1
WindView™ for IRIX
Programmer’s Guide
Document Number 007-2824-001
CONTRIBUTORS
Written by Susan Thomas
Edited by Christina Cary
Production by Laura Cooper
Engineering contributions by Jeffery Heller, Bruce Johnson, Ralph Humphries.
© Copyright 1995, Silicon Graphics, Inc.— All Rights Reserved
This document contains proprietary and confidential information of Silicon
Graphics, Inc. The contents of this document may not be disclosed to third parties,
copied, or duplicated in any form, in whole or in part, without the prior written
permission of Silicon Graphics, Inc.
RESTRICTED RIGHTS LEGEND
Use, duplication, or disclosure of the technical data contained in this document by
the Government is subject to restrictions as set forth in subdivision (c) (1) (ii) of the
Rights in Technical Data and Computer Software clause at DFARS 52.227-7013 and/
or in similar or successor clauses in the FAR, or in the DOD or NASA FAR
Supplement. Unpublished rights reserved under the Copyright Laws of the United
States. Contractor/manufacturer is Silicon Graphics, Inc., 2011 N. Shoreline Blvd.,
Mountain View, CA 94039-7311.
Silicon Graphics, REACT/Pro, and IRIS are registered trademarks and IRIX is a
trademark of Silicon Graphics, Inc. WindView is a trademark of Wind River Systems,
Inc.
WindView™ for IRIX Programmer’s Guide
Document Number 007-2824-001
About This Guide
This guide describes the WindView™ graphical analysis tool for IRIX.™
WindView allows developers to observe the instantaneous timing of the
IRIX kernel and its interactions with applications.
The following summarizes the contents of this guide:
Chapter 1, “About WindView,” provides an overview of the WindView
program, including its features and architecture.
Chapter 2, “Collecting Event Data,” describes simple and advanced
procedures for collecting data for analysis.
Chapter 3, “Working with Event Data,” describes how to examine and
analyze event data.
Chapter 4, “Event Dictionary,” describes the events that you will see.
Chapter 5, “Command Reference,” provides an alphabetical reference of all
the WindView commands and icons.
Chapter 6, “X Resources and Tcl Configuration Commands,” describes how
you can customize the WindView GUI and operation.
Note: The figures in this manual show the Motif window manager. Your
WindView windows will look different if you are using a different window
manager.
Included with the IRIX for WindView product are two files that describe in
detail the Tcl language as it is used with WindView. After installation, these
files are contained in the directory /usr/WindView/docs. Their names are
tclgd.ps and tclman.ps. The file tclgd.ps contains “Tcl: An Embedded
Command Language,” a description of Tcl by its creator, John K. Ousterhout.
The reference page for Tcl is in tclman.ps.
iii
About This Guide
Other Useful Books
The following books contain more information that can be useful to a
real-time programmer.
•
For a description of the support IRIX provides to real-time programs,
see the REACT/Pro Programmer’s Guide, part number 007-2499-001.
•
For a survey of all IRIX facilities and manuals, Programming on Silicon
Graphics Systems: An Overview. This useful manual, part of the IRIX
Developer Option, is new in version 5.3; part number 007-2476-001.
•
For details of the architecture of the CPU, processor cache, processor
bus, and virtual memory, MIPS R4000 Microprocessor User’s Manual by
Joseph Heinrich, Prentice-Hall, 1993 (ISBN 0-13-105925-4); and the
MIPS R10000 Microprocessor User’s Manual, available in 1995.
•
For details of many IRIX system facilities not covered in this book,
Topics in IRIX Programming, part number 007-2478-001; and MIPS
Compiling and Performance Tuning Guide, 007-2479-001 (both are
available with the IRIX Developer’s Option).
•
For programming inter-computer connections using sockets, IRIX
Network Programming Guide, part number 007-0810-050.
•
The Definitive Guides to the X Window System, Motif Edition, published
by O’Reilly & Associates, Inc., for information on the X Window System
and Motif.
•
The OpenWindows Version 3 User’s Guide and/or DeskSet Reference Guide,
by SunSoft™, a Sun Microsystems Company, for information on the
OpenWindows window manager.
Style Conventions
This guide follows these conventions:
iv
•
In command syntax descriptions and examples, square brackets ([])
surround an optional argument. (Square brackets are also used with
shell commands as metacharacters.)
•
Variable parameters are in italics. You replace these variables with the
appropriate string or value.
Product Support
•
In text descriptions, filenames, IRIX commands, process names,
routines, functions, window buttons, new and emphasized terms are in
italics.
•
System messages and displays are shown in typewriter font.
•
Bold typewriter font is for user input and non-printing characters.
For example: <Return>.
This guide uses the standard UNIX® convention for referring to entries in
IRIX documentation. The entry name is followed by a section number in
parentheses. For example, rcp(1C) refers to the rcp online reference page.
Product Support
Silicon Graphics,® Inc. provides a comprehensive product support and
maintenance program for hardware and software products. For further
information, contact your service organization.
v
Contents
About This Guide iii
1.
About WindView 1
WindView Events 3
Context Switch Events 4
Process State Transition Events 5
User-Generated Events 7
WindView Architecture 7
High-Resolution Timestamp 8
Host-Side Activities 8
2.
Collecting Event Data 11
Using the WindView GUI 12
Starting WindView 13
Invoking the windview Program 13
Understanding the WindView Main Window 13
Using Help 14
Exiting WindView 16
Importing Event Data 16
Displaying a View Graph 16
Setting Up for Event Logging 17
Starting and Stopping Event Logging on the Target 18
Event Buffer Overflow Information 19
Saving and Opening a Processed Event Log 19
vii
Contents
Advanced Methods for Using WindView 22
Specifying Arguments to the windview Command 22
Setting the Event Port Number 24
Using the Target Window to Set the Event Port Number 25
Starting Event Logging and Instrumenting Timestamps 26
Adding Timestamps to Your Programs 26
Starting the rtmond Daemon 27
Using the rtmon-client Tool and the Analyze Menu Option 28
3.
viii
Working with Event Data 31
Understanding the View Graph 31
Selecting and Examining Event Data 38
Selecting Data 38
Selecting a Time Interval 38
Selecting a Time Instant 39
Selecting a Sub-Time Interval 40
Canceling a Time Instant or a Sub-Time Interval 41
Selecting an Event 42
Examining Data 45
Analyzing Data 49
Example 1—How WindView Starts to Execute 49
Example 2—WindView Executing on a Multiprocessor System
Example 3—Beginning of an FRS Frame 54
Example 4—FRS Recovery Mechanism 56
52
4.
5.
Event Dictionary 59
Using the Event Dictionary 59
Event Dictionary 61
ISR 61
intEnt—Entry to ISR 61
intExit—Exit from ISR 64
Signal 65
sigwrapper—Entry to signal handler 65
kill—Send a signal to a process 66
Processes 67
processDelete—Delete a process 67
Unknown 68
unknown—Unknown event 68
User Event 68
defaultUser—Display user-specified event
68
Command Reference 73
About WindView Command 74
Analyze Command 75
Analyze All Command 77
Contents Command 78
Display Events Command 78
For Context Command 80
Legend Window Icon 80
New Graph Command 81
Open Command 83
Pan Left/Pan Right Icons 84
Push/Pop/Exchange Icons 85
Quit Command 85
Save Command 85
Search Accelerator Icons 87
Search Window Icon 88
Target Command 90
ix
Contents
Tcl Evaluation Command 92
Tcl: Event Inspector Command 93
Time Units Menu Icon 94
View Control Window Icon
95
Zoom In/Zoom Out Icons 97
6.
X Resources and Tcl Configuration Commands 99
Customizing X Resources 99
Customizing Your X Defaults 99
Customizing WindView’s Appearance 100
Creating Icons for User Events 101
WindView Window Management Policy 102
Application-Specific Resources 103
Widget Resources 104
Customizing Tcl Files 111
Customizing WindView Tcl Initialization Files 111
Customizing the Event Inspector Window for User Events
Using the Tcl Evaluation Window 115
WindView Extensions to Tcl 116
Index 131
x
113
Figures
Figure 1-1
Figure 1-2
Figure 1-3
Figure 1-4
Figure 1-5
Figure 1-6
Figure 2-1
Figure 2-2
Figure 2-3
Figure 2-4
Figure 2-5
Figure 2-6
Figure 2-7
Figure 2-8
Figure 3-1
Figure 3-2
Figure 3-3
Figure 3-4
Figure 3-5
Figure 3-6
Figure 3-7
Figure 3-8
Figure 3-9
Figure 3-10
Figure 3-11
Figure 3-12
Figure 3-13
WindView View Graph 2
IntEnt Event Icon 3
Event Inspector 4
Current Content Line 4
User Event Icon 7
WindView Architecture 7
WindView Main Window 13
About WindView Window 15
Help Window 15
View Graph Window 17
Target Window 18
Save Event File Window 20
Open Event File Window 21
Analyze Event Log Window 29
View Graph With Event Data 32
Time Units Menu Icon 33
View Control Icon 33
Zoom In/Zoom Out Icons 34
Pan Left/Pan Right Icons 34
Push Icon 34
Pop Icon 34
Exchange Icon 34
Search Window Icon 35
Search Accelerator Icons 35
Legend Window Icon 35
Legend Window 36
Interrupt Label 36
xi
Figures
Figure 3-14
Figure 3-15
Figure 3-16
Figure 3-17
Figure 3-18
Figure 3-19
Figure 3-20
Figure 3-21
Figure 3-22
Figure 3-23
Figure 3-24
Figure 3-25
Figure 3-26
Figure 3-27
Figure 3-28
Figure 3-29
Figure 3-30
Figure 3-31
Figure 3-32
Figure 3-33
Figure 3-34
Figure 4-1
Figure 4-2
Figure 4-3
Figure 4-4
Figure 4-5
Figure 4-6
Figure 4-7
Figure 4-8
Figure 4-9
Figure 5-1
Figure 5-2
Figure 5-3
xii
Process Label 36
Idle Loop Label 36
Detailed Time Information Field 36
Scrollbars 37
Using Scrollbars 37
State Stipple 37
Event Icon 38
Timeline 38
View Control Window 39
Time Instant 40
Sub-Time Interval 41
Event Timestamp 42
Search Window 43
Event Inspector Window 46
Inspection of sigwrapper 46
Display Events/States Window 48
Single Processor Trace 50
Single Processor—Sub-Time Interval 51
Multiprocessor Trace 53
Beginning of an FRS Minor Frame 55
FRS Recovery Mechanism 57
sigwrapper Icon 59
Sample Event Dictionary Page 60
intEnt Icon 61
IntExit Icon 64
sigwrapper Icon 65
kill Icon 66
processDelete Icon 67
unknown Icon 68
defaultUser Icon 68
WindView Main Window 74
View Graph Icon Bar 74
About WindView Window 75
Figure 5-4
Figure 5-5
Figure 5-6
Figure 5-7
Figure 5-8
Figure 5-9
Figure 5-10
Figure 5-11
Figure 5-12
Figure 5-13
Figure 5-14
Figure 5-15
Figure 5-16
Figure 5-17
Figure 5-18
Figure 5-19
Figure 5-20
Figure 5-21
Figure 5-22
Figure 5-23
Figure 6-1
Figure 6-2
Analyze Event Log Window 76
Help Contents Window 78
Display Events/States Window 79
Legend Window Icon 80
Legend Window 81
View Graph Window 82
Open Event File Window 83
Pan Left/Pan Right Icons 84
Push/Pop/Exchange Icons 85
Save Event File Window 86
Search Accelerator Icons 87
Search Window Icon 88
Search Window 88
Target Window 90
Tcl Evaluation Window 92
Event Inspector Window 93
Time Units Menu Icon 94
View Control Window Icon 95
View Control Window 95
Zoom In/Zoom Out Icons 97
User Icon and Event Number 101
Tcl Evaluation Window 115
xiii
Tables
Table 1-1
Table 3-1
Table 4-1
Table 4-2
Table 6-1
Process State Stipples 6
Selecting Data With the Mouse 43
Interrupt Level Descriptions 63
User Event Numbers Above 20000 69
WindView Application-Specific Resources
103
xv
Chapter 1
1.
About WindView
The WindView program is a logic analyzer for real-time software. A
real-time system—defined in this manual to consist of the IRIX operating
system, your real-time application, and the target system—involves
complex interactions among processes, IRIX system objects, and interrupts.
These interactions must occur within certain time constraints, often
characterized by resolutions of microseconds or finer. Traditional tools for
debugging and benchmarking real-time systems have included source-level
debuggers and profilers. These types of tools can provide much useful
information about a system; however, they provide only a static picture of a
very dynamic situation. What real-time developers have needed is a way to
view these dynamic interactions in a visual way—a way to look “under the
hood” of the real-time system. WindView provides such a view.
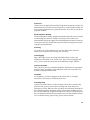
The interaction of the processes, objects, and interrupts in a real-time system
can result in context switches. The term context switch refers to the operation
performed by a multitasking operating system in which the current thread
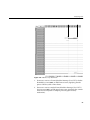
of execution is switched for another. WindView allows the user to examine
information on the state of each process in the system and the events that lead
to a context switch. This information is shown in a WindView View Graph
window; for an example, see the sample WindView View Graph in
Figure 1-1.
1
About WindView
User event 20005
event icon
Interrupt
Processes
Thread of
execution
Timeline
Idle loop
Figure 1-1
WindView View Graph
The View Graph provides manageable access to a wealth of information
about the real-time system. With this window, you can scroll the information
forward and backward in time and zoom it in and out to different time
scales. Detailed information is displayed for each event (such as the action
that occurred, the context in which the action occurred, and the object
associated with the action). All events are tagged with high-resolution
timestamps.
All of this occurs with minimal intrusion (less than 10 microseconds
overhead per event) on the real-time system. The system is not halted when
information is gathered, and the information-gathering activities have been
highly optimized. Because it provides a view into the complex activities of a
real-time system, WindView allows you to do the following:
2
WindView Events
•
detect race conditions, deadlocks, processor starvation, and other
problems relating to process interaction
•
determine application responsiveness and performance
•
see cyclic patterns in application behavior
The rest of this chapter describes the events logged by WindView in more
detail, the WindView architecture, and the resources that are available to
WindView users.
WindView Events
In WindView, an event is any action undertaken by a process or an interrupt
service routine (ISR) that can affect the state of the real-time system.
Examples of events are process spawns and deletions, system clock ticks,
and interrupts. IRIX has been instrumented to log this event information.
In the WindView View Graph window, time is represented on the horizontal
axis, while the current system’s contexts are represented on the vertical axis
(see Figure 1-1):
Figure 1-2
IntEnt Event Icon
•
Beginning at the top of the screen, the interrupts used in the system are
listed.
•
Next, processes are listed.
•
The last context shown is an idle loop for each processor, with the
highest-level processor listed first.
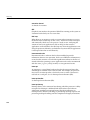
When an event occurs, an event icon is shown in the View Graph. It is placed
at the point on the vertical axis that represents the context in which it
occurred, and horizontally according to the time (or sequence number) at
which it occurred.
You can drag an event icon into an Event Inspector window to see the icon’s
associated information. For example, when a hardware interrupt occurred
for which there is an associated ISR, an IntEnt event icon (see Figure 1-2) is
displayed. By dragging the icon into the Event Inspector, you see
information on that event: its timestamp, its context, the event name; see
Figure 1-3. (For information on using the Event Inspector, see Chapter 3,
3
About WindView
“Working with Event Data.” For information on what is displayed for each
event, see Chapter 4, “Event Dictionary.”)
Figure 1-3
Event Inspector
The following sections describe features of event logging. These descriptions
include information on how the GUI looks by default; you can customize
many of the GUI’s attributes to meet your own needs; see Chapter 6, “X
Resources and Tcl Configuration Commands.” In addition, you can choose
which events and states to display; see “Examining Data” on page 45.
Context Switch Events
Note: In this manual, a kernel mode switch, such as the switch the processor
makes from idle mode to resume execution of a user process, is referred to
as a context switch.
In real-time systems, the term current context usually refers to the current
process and the information needed to restore the process’ state, such as the
state of the processor registers, operating system control information, and
the stack. For WindView, the meaning of current context has been extended
to include any thread of execution: a process, an ISR, or the kernel’s idle
loop. A context or mode switch, then, refers to a change in the current context,
which can occur when one process preempts another, a process delays itself
or pends on a resource, or a process is interrupted by an ISR.
Figure 1-4
4
Current Content Line
When Context Switch events are logged, WindView shows the current
context and where it is switched. The current context is shown as a solid,
WindView Events
horizontal line (see Figure 1-4), with a different color being used for each
processor (on multiprocessor systems). When a context or mode switch
occurs, a dotted, vertical line connects the previous context’s line to the
current context’s line.
Process State Transition Events
The term process state transition refers to a process exiting from one state and
entering into another; for example, from the pending state to the executing
state. A process state transition may or may not result in a context switch,
depending on the states of other processes in the system when the process in
question makes a transition between states.
When Process State Transition events are logged, WindView shows the
process state transitions and possibly the events that cause them. A process
state is shown by the type of horizontal line (known as a state stipple) used to
display it; see Table 1-1 for a listing of the state stipples. Note that if you are
using a color monitor, these state stipples are further differentiated by color.
In addition, the event that caused the process state transition is shown as an
icon.
Note: WindView does not provide information on events that do not result
in process state transitions.
As an optimization, events in the Process State Transition are not separately
timestamped. However, such events receive the timestamp of the next exit
from the IRIX kernel. This exit is typically only a few microseconds after the
5
About WindView
event that caused the process state transition, and marks the moment at
which the process state transition truly takes effect.
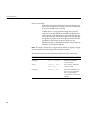
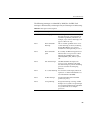
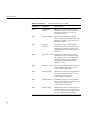
Table 1-1 Process State Stipples
Type of Line
6
Process State
Description
Executing
The process, ISR, or idle loop has
control of the processor.
Nondegrading,
real-time
priority
A process that executes in the
real-time band of priorities. The
real-time priorities are those
numerically less than or equal to
the system-tuning parameter
ndpri_lolim, which is normally 39.
The kernel guarantees that one of
these processes will never sit idle
waiting for a process with a lower
priority (for example, the network
daemon, rtnetd, runs at a
non-degrading priority).
Suspended
The process attempted to gain
access to a resource or event and
the resource or event was not
available (also referred to as a
“blocked” process). (On
multiprocessor systems, if not all
processors are traced, a process
may display as Suspended even
after it has run, since process
migration can occur.)
Ready
The process is not waiting for any
resource other than the processor;
that is, it is ready to execute, but
has not yet been executed by the
scheduler. (On multiprocessor
systems, if not all processors are
traced, a process may display as
Ready even after it has run, since
process migration can occur.)
WindView Architecture
User-Generated Events
Figure 1-5
User Event Icon
When event logging has been started, WindView shows application-specific
events. By default, these events are displayed by the User Event icon (see
Figure 1-5) on the View Graph. Event numbers are taken from a parameter
provided with the rtmon_log_user_tstamp() function call. User-generated
events are described in detail in “defaultUser—Display user-specified
event” on page 68.
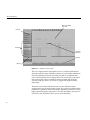
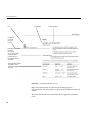
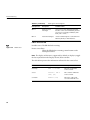
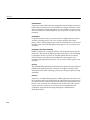
WindView Architecture
WindView consists of two components: one resides on the target (the system
for which events are being collected), and the other on the host (the system
running the GUI display), as shown in Figure 1-6 (the target and the host can
be the same system).
IRIX Target
IRIX Host
Target control
requests
RPC
WindView
for IRIX
rtmond
Daemon
Event
buffer
Event data
TCP/IP
Events
Buffer
IRIX
Figure 1-6
Application
process
WindView Architecture
7
About WindView
Events are logged to a buffer on the target system. When this buffer starts to
fill up, the contents of the buffer are passed to the host by the rtmond
daemon.
The kernel’s instrumentation is highly optimized and operates with minimal
intrusion on the real-time system.
High-Resolution Timestamp
When you start the event collection process under IRIX (either through the
Target window “Start” command or through rtmon_client), the instrumented
kernel tags certain events with a high-resolution timestamp. The events are
then displayed in the WindView View Graph along a timeline showing
when they occurred, based on these timestamps. You can see the exact
timestamp for any particular event; for details, see “Selecting and
Examining Event Data” on page 38.
The timestamp driver’s resolution is hardware dependent, but is 21
nanoseconds for Challenge, Onyx, Power Challenge, and Power Onyx
systems.
Host-Side Activities
The WindView host component (that is, the GUI) is an X application that
runs as a process under UNIX. It receives the event data from the target
system, processes the data, and displays it in a graphical format. The default
target-to-host communication mechanism is TCP/IP.
Normally, event data is displayed by the View Graph as it is received from
the target system. WindView analyzes the information gathered from the
target system, and then displays it in the View Graph in an
easy-to-understand format. You can navigate the event information to see
the relationships among system components and to better visualize the
system’s construction and behavior. For details on using the View Graph, see
“Understanding the View Graph” on page 31.
8
WindView Architecture
In some situations, however, you may find it more convenient and less
intrusive to collect the event data in a file on the host, for later analysis and
display. For example, you may wish to collect data at a remote site for later
analysis at a lab. This is accomplished with the rtmon-client tool, described in
“Using the rtmon-client Tool and the Analyze Menu Option” on page 28.
9
Chapter 2
2.
Collecting Event Data
The phrase collecting event data refers to the process of starting event logging
on the IRIX target, and then capturing that data as it is uploaded to the host.
After the event data is collected, you can analyze it. This chapter describes
how to collect event data; Chapter 3, “Working with Event Data” describes
how to examine and analyze it.
There are two methods for collecting event data with WindView for IRIX:
•
The basic method, using the WindView GUI to control event data
collection; see “Using the WindView GUI” on page 12.
•
The advanced method, controlling event data collection with the
rtmon-client program; see “Advanced Methods for Using WindView”
on page 22.
Throughout this chapter, the following terms are used:
event
This is any action undertaken by a process or an interrupt
service routine (ISR) that can affect the state of the real-time
system. Examples of events are process spawns and
deletions, system clock ticks, and interrupts. The IRIX
kernel has been instrumented to log this event information.
event logging
This is the target activity of writing information about
events to the WindView event buffer as the events occur.
event data
This is information that is logged to the WindView event
buffer and uploaded to the host by the WindView real-time
monitoring daemon, rtmond.
event log
This is a finite collection of event data that resides on the
host.
processed event log
This is an event log that has been imported into WindView,
either directly from the target or with the Analyze
11
Collecting Event Data
command if you are used rtmon-client. You can save
processed event logs for later study with the Save menu
option, and then import them again with the Open menu
option.
raw event log
This is the format of an event log collected by the
rtmon-client tool; see “Using the rtmon-client Tool and the
Analyze Menu Option” on page 28.
This chapter assumes that WindView has been installed and configured for
your environment; see the WindView release notes for details.
For specific information on any of the WindView GUI commands mentioned
in this chapter, see Chapter 5, “Command Reference.”
Using the WindView GUI
This section covers the following topics:
•
“Starting WindView”
•
“Importing Event Data”
•
“Starting and Stopping Event Logging on the Target”
•
“Saving and Opening a Processed Event Log”
Note: Before proceeding with this section, make sure that WindView has
been correctly installed and the rtmond daemon is running. For more
information, see the WindView release notes and “Starting the rtmond
Daemon” on page 27.
This section is intended to help you get WindView up and running quickly.
Once you understand WindView operation, you may choose to use the
advanced methods described in“Advanced Methods for Using WindView”
on page 22 to collect event data.
12
Using the WindView GUI
Starting WindView
This section describes the following:
•
“Invoking the windview Program”
•
“Understanding the WindView Main Window”
•
“Using Help”
•
“Exiting WindView”
Invoking the windview Program
Before you can collect data from the target, you must invoke the windview
program on the host. To use the following command, be sure to update your
shell $PATH variable to include the pathname /usr/WindView/bin. Enter the
windview command from an IRIX shell:
% windview
When the windview command is successful, the WindView Main window
appears. This window is described in the following section.
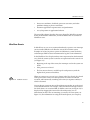
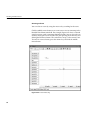
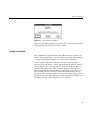
Understanding the WindView Main Window
WindView’s Main window is shown in Figure 2-1.
WindView
Menu Bar
Scrollbars
WindView
Message
Area
Figure 2-1
WindView Main Window
The WindView Main window includes a message area; when you first
invoke WindView, the following message should appear:
Site Tcl Initialization Complete.
13
Collecting Event Data
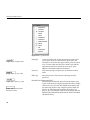
The WindView Main window contains the following pulldown menus,
which are discussed in this chapter and in Chapter 3, “Working with Event
Data.” For detailed information on any of the menu commands, see
Chapter 5, “Command Reference.”
File
This menu contains the commands for analyzing raw event
logs, and for opening and saving processed event logs. It
also contains the Quit command, which allows you to exit a
WindView session.
Windows
This menu lets you display windows with which to control
the target and examine event data, including the View
Graph window.
Help
This menu contains the Help commands; for details, see
“Using Help” on page 14.
Leave the WindView Main window open at all times: the message area
provides feedback on WindView operations, and the commands in its menu
bar are useful when examining event data.
To use the pulldown menus, use the left mouse button. You can also use the
keyboard shortcuts: press the <ALT> key plus the letter underlined in the
menu bar. For example, to display the File menu, press <ALT-F>. Then, to
pick one of the commands from the menu, type the underlined letter. For
example, to choose the Quit command, type Q when the File menu is open.
For other window-manipulation tips, see the documentation for your
window manager.
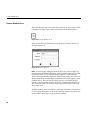
Using Help
The WindView online help facility provides two types of information:
information on the current WindView release, and a hypertext,
context-sensitive online help system.
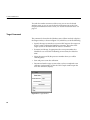
To display information on the current WindView release, choose the “About
WindView” command from the Help menu. The window shown in
Figure 2-2 appears, showing the WindView version number and the
copyright information. Click the OK or Cancel button to remove this window
from your screen, or click the Help button to display information for this
window.
14
Using the WindView GUI
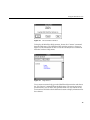
Figure 2-2
About WindView Window
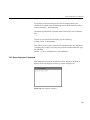
To display the WindView Help contents, choose the “Content” command
from the Help menu. The WindView Help window appears as shown in
Figure 2-3; for information on how to use this window, choose commands
from this window’s Help menu.
Figure 2-3
Help Window
To use context-sensitive help, go to the WindView Main window and choose
the “For Context” command from the Help menu. The cursor turns into a
question mark; you can move this question mark over any element of the
user interface and click with the left mouse button to display information for
that element.
15
Collecting Event Data
In addition to these Help menu commands, many WindView windows (such
as the Save Event File, Open Event File, and Analyze Event Log) contain
their own Help button. Clicking on this button displays information for that
window.
Exiting WindView
To exit WindView at any time, choose the “Quit” command from the File
menu. The WindView Main window and all other WindView windows are
removed from the screen.
Note: When you exit WindView, you are not prompted to save your event
data. To save event data before exiting, follow the instructions in “Save
Command” on page 85.
Importing Event Data
The process of importing event data consists of the following steps, which
are described in this section:
1.
Displaying a view graph.
2.
Setting up for event logging.
3.
Starting and stopping event logging on the target.
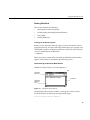
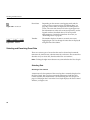
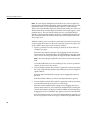
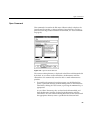
Displaying a View Graph
The View Graph window is used to view the event data. It is not necessary
to open a View Graph window to collect event data. It can be opened at a
later time to analyze the collected data.
Tip: To minimize intrusion on the target system, it is recommended that the
event data not be viewed as it is being received.
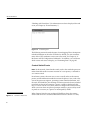
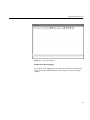
To display a View Graph, choose New Graph from the Windows menu. An
empty View Graph window labeled View 1 appears; see Figure 2-4. This
window is described in detail in “Understanding the View Graph” on
page 31.
16
Using the WindView GUI
Figure 2-4
View Graph Window
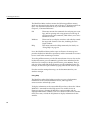
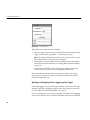
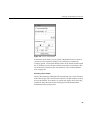
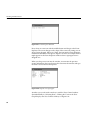
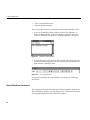
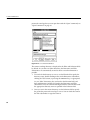
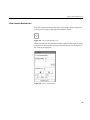
Setting Up for Event Logging
To set up for event logging, first open the Target window by choosing the
Target command from the Windows menu. Figure 2-5 shows the Target
window.
17
Collecting Event Data
Figure 2-5
Target Window
Then, follow these steps to use this window:
1.
Type the target system’s name in the Target Name field. (To find out the
target system’s name, type uname -n on the target system.)
Note: The target and the host may be the same system, in this case, enter
the hostname of the system you are executing on.
2.
The default event port number of 6164 is displayed in the Event Data
Port field. For more information, see “Setting the Event Port Number”
on page 24.
3.
In the Processor ID field, type in the processor number of the target
system where you want to start event logging and click Start.
You can simultaneously monitor several processors on the same target
system; type in a processor number and click Start followed by the next
processor number and Start.
Starting and Stopping Event Logging on the Target
To start the logging of events on the target, click the Start button in the Target
window. Event data will begin to appear in the View Graph; if it does not,
see “Event Buffer Overflow Information” on page 19.
Pause event logging at any time by clicking the Stop button. Event logging
ceases on the processor that is currently identified in the Processor ID field.
18
Using the WindView GUI
To easily stop event logging on all processors, click the Disconnect button.
You are now ready to analyze the event data; see Chapter 3, “Working with
Event Data.”
Note: If you stop event data collection with Disconnect and then click Start
again, the event data displayed in the View Graph is overwritten by the new
event data. You can save the previous event data with the Save command;
see “Save Command” on page 85.
Event Buffer Overflow Information
If you click the Start button in the Target window, but no event data appears
in the View Graph, or if it starts to appear but stops before you have clicked
Stop, the following warning message may appear in a popup window:
Target event buffer overflow
This occurs when the event rate exceeds the bandwidth of the connection. In
this case, the event logging mechanism shuts itself off. Try one or more of the
following strategies to solve this problem:
•
Toggle off the Track Incoming Data button in the View Control window.
Doing so keeps the View Graph from being updated as new event data
arrives. Instead, the View Graph is “frozen.” See “Examining Data” on
page 45 for details.
•
If you believe that network traffic may be the cause of the problem,
isolate the host and target on a subnetwork or a standalone network.
•
Use the rtmon-client tool to collect the event data; see “Using the
rtmon-client Tool and the Analyze Menu Option” on page 28.
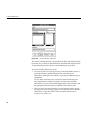
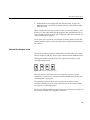
Saving and Opening a Processed Event Log
You may find it convenient to save event data to a processed event log for
later study. To do so, choose the Save command from the File menu. The
Save Event File window shown in Figure 2-6 displays.
19
Collecting Event Data
Figure 2-6
Save Event File Window
The current working directory is displayed in the Filter and Selection fields
by default. Type the appropriate directory name and filename into the
Selection field; then click the OK button or press the <Return> key to save
the file and remove the Save Event File window from the screen. If the file
that you wish to save to is listed in the Files subwindow, you can
double-click the name to overwrite that file with the current event data. (For
details on working with this window, see “Save Command” on page 85.)
When a processed event log is saved, two files are created: filename.wv and
filename.wvd. These files must be kept together in the same directory, the .wv
and .wvd suffixes intact, or the “Open” command will not be successful.
Now you can import the processed event log any time you wish to study it.
Choose the “Open” command from the File menu. The Open Event File
window shown in Figure 2-7 appears.
20
Using the WindView GUI
Figure 2-7
Open Event File Window
Use this window in the same way that you use the Save Event File window:
type the appropriate directory name and filename.wv into the Selection field,
then click the OK button or press the <Return> key to open the file and
remove the Open Event File window from the screen. If the file that you wish
to open is listed in the Files subwindow, you can double-click on the name
to open it. (For details on working with this window, see “Open Command”
on page 83.)
Note that processed event logs have the .wv suffix; if you attempt to open a
raw event log with the .wvr suffix, an error message appears. A raw event log
with the .wvr suffix is generated by the rtmon-client tool; see “Using the
rtmon-client Tool and the Analyze Menu Option” on page 28.
If the processed event log is successfully opened, a message similar to the
following appears in the Main window message area:
Processor 1:
CPU: R4400
BSP: Silicon Graphics
21
Collecting Event Data
Then, if the View Graph is displayed, the processed event log is displayed
there; see “Displaying a View Graph” on page 16 for information. (Note that
you can display the View Graph either before or after you have opened a
processed event log.)
Advanced Methods for Using WindView
Now that you understand the basics of collecting data with WindView, you
may choose to replace some of the GUI methods of collecting data with the
more advanced methods detailed in this section. These methods can provide
greater flexibility in your use of WindView, particularly in the ways in which
you start event logging and import event data.
Specifically, this section covers these topics:
•
“Specifying Arguments to the windview Command”
•
“Setting the Event Port Number”
•
“Starting Event Logging and Instrumenting Timestamps”
•
“Using the rtmon-client Tool and the Analyze Menu Option”
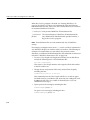
Specifying Arguments to the windview Command
For greater flexibility at invocation, you can specify arguments to the
windview command The following shows the complete syntax of the
command:
windview [ -port number ] [ -target name ] [ -emc size ] [ -nx ] \
[ -x filename ] [ -xi expression ] [ -XToolkitFlag ...]
Note that all flags are optional. The following is a description of each:
-port number
22
Specifies the minimum event port number that you would
like to use; the default is 6164. WindView attempts to obtain
a port number, using this value as the minimum. That is, if
you specify 5050, then 5050 is the lowest event port
WindView attempts to own.
Advanced Methods for Using WindView
The port number that WindView was successful in
obtaining is displayed in the Event Data Port field of the
Target window. Using this flag has the same effect as typing
the port number in this window. See “Setting the Event Port
Number” on page 24 for information on using the Target
window and for other issues involved with the event port
number.
-target name
Specifies the name of the target that is to receive commands
from WindView. The name you specify here is displayed in
the Target Name field of the Target window. Using this flag
has the same effect as typing the target name in this
window; see “Setting the Event Port Number” on page 24
for information.
-emc size
Specifies the size of the host event buffer in integer
megabytes; the default is 8 MB, the minimum is 1 MB, and
the maximum is determined by the amount of memory on
your host. After this limit is reached, events accumulate in a
file in the current directory named wndvw_unique_id.
-nx
By default, WindView reads the following Tcl initialization
files, in the following order (for information on Tcl
initialization files, see “Customizing WindView Tcl
Initialization Files” on page 111):
/usr/WindView/resource/tcl/WindView.tcl
The site WindView initialization file; this file must be
present for WindView to start successfully.
~/.windview.tcl
Your personal WindView Tcl initialization file.
./.windview.tcl
The current directory’s WindView Tcl initialization file.
The -nx flag prevents WindView from reading your
personal and the current directory’s WindView Tcl
initialization files. Only the site WindView initialization file
and files specified with the -x flag (see below) are read.
Tcl initialization files are read automatically only at
WindView startup.
23
Collecting Event Data
-x filename
Reads additional Tcl initialization information from the
specified file. This file is read only after the site Tcl
initialization file, your personal Tcl initialization file, and
the current directory’s Tcl initialization file. If you supply
multiple Tcl initialization files with multiple -x flags, only
the last file is used.
Tcl initialization files are read automatically only at
WindView startup.
-xi expression
Evaluates the specified Tcl expression. This expression is
evaluated only after any initialization files have been read,
including any specified with the -x flag, above. If you
specify multiple Tcl expressions with multiple -xi flags, only
the last expression is evaluated.
For example, you can use the -xi flag to get around the
one-file-only restriction of the -x flag. The following shows
the -xi flag being used to source both the foo file and the bar
file:
windview -xi 'source foo; source bar' &
Note that because there is more than one word in the
specified expression, the words are enclosed in single
quotation marks.
-xToolkitFlag
Any standard X Toolkit flags, such as -fg, -geometry, or -xrm.
For additional information on the X Toolkit flags, see
“Application-Specific Resources” on page 103.
When the windview command is successful, the WindView Main window
appears; see “Understanding the WindView Main Window” on page 13 for
information.
Setting the Event Port Number
The event port number is the host TCP/IP port over which the WindView host
component listens for event data from the event buffer daemon, rtmond.
If you invoke the windview command without specifying an event port
number with the -port flag, WindView starts negotiating for a port number
starting at number 6164. When the Main window appears, you can see
24
Advanced Methods for Using WindView
which event port number WindView obtained by looking at the Event Data
Port field in the Target window (choose the Target command from the
Windows menu).
If WindView was successful in getting port 6164, and if you start event
logging (see “Starting Event Logging and Instrumenting Timestamps” on
page 26), you can now start your application. As soon as the application
encounters the first event logging instruction, you will start to receive event
data in your View Graph.
However, one of the following may be true:
•
WindView may not have been successful in getting port 6164.
•
You may have specified for WindView to start negotiating for a port
number starting at a different minimum number with the -port flag; see
“Specifying Arguments to the windview Command” on page 22.
•
You may now, or at some later point, want WindView to start
negotiating for a port number starting at a different minimum number
using the Target window (this has the same effect as using the -port
flag); see the following section.
In any of the above cases, you must inform the target of the new event port
number. The following subsections first describe how to set an event port
number using the Target window, then describe how to inform the target of
the new event port number.
Using the Target Window to Set the Event Port Number
Choose the Target command from the Windows menu to display the Target
window, shown in Figure 2-5.
The successfully negotiated event port number is displayed in the Event
Data Port field; in the figure above, WindView was successful in getting port
6164. If this is not the appropriate port number, you can change it with this
window at any time.
25
Collecting Event Data
To use this window, follow these steps:
1.
Type the target’s name in the Target Name field.
You can find the target name by typing uname -n at the command line
on the target system.
If you used the -target flag to the windview command, that target name
will be displayed in the Target Name field. You must specify the target’s
name before clicking the Start button of this window.
2.
Type the processor number in the processor ID field. For example, to
collect data on processor 3, type 3 in the Processor ID field.
3.
If the event port number is appropriate for your use, click the Start
button.
4.
If the event port number is not appropriate, type the minimum port
number you would like to use in the Event Data Port field. The valid
range is 5001 to 32767. For example, if you would like to use any port
number above 5050, type 5050.
5.
Press the <Return> key. WindView attempts to obtain a new event data
port number, using your input into the Event Data Port field as its
minimum. That is, if you type 5050, then 5050 is the lowest event data
port WindView will attempt to own.
When WindView has obtained a port number, the number it was
successful in obtaining is displayed in the Event Data Port field.
Starting Event Logging and Instrumenting Timestamps
Event logging is the target activity of writing event data to the target event
buffer as the events occur. You can use the WindView GUI to collect events,
described earlier in this chapter, or the rtmon-client tool, as described in this
section. You add timestamps to user applications with the
rtmon_log_user_tstamp() function.
Adding Timestamps to Your Programs
The REACT/Pro user timestamp logging function, rtmon_log_user_tstamp(),
is used to insert timestamps into user application code. This function logs
events and passes them to rtmon_client or WindView. These user events can
then be viewed from the Tcl Event Inspector window. For more information
26
Advanced Methods for Using WindView
about implementing the rtmon_log_user_tstamp() function, see the
rtmon_log_user_tstamp reference page.
In WindView for IRIX, user events greater than 20000 are operating system
events. For a descriptions of these user events, see Table 4-2.
Starting the rtmond Daemon
The REACT/Pro real-time monitoring daemon, rtmond, must be running on
the target machine for WindView to collect event data. Only one copy of
rtmond can run on a machine and it must be started at the command line.
Once rtmond is started, data can be collected with WindView or rtmon-client.
To start the rtmond daemon, on the target machine at the command line,
type:
/usr/react/etc/rtmond
The daemon has two optional arguments:
-d
Sends error messages to the terminal window where rtmond
is started. By default, error messages are written to syslog.
-p n
Determines how the process name is displayed on the View
Graph. The following values are supported for n:
0 Displays the process name.
1 Displays the process ID of the program with the timestamp in the
format pid-x where x is the PID.
2 Displays the process name and process ID in the format name(id) (this
is the default).
For more information on rtmond, refer to the reference page rtmond(1).
27
Collecting Event Data
Using the rtmon-client Tool and the Analyze Menu Option
The rtmon-client tool offers a programmatic alternative to the WindView GUI
for event collection. This tool allows you to collect a raw event log on the
host without importing it into WindView until some later time. For example:
•
rtmon-client uses much less processor attention. Your real-time system
generates a large amount of event data. Because the WindView GUI
must process the event data before it can display it, you may encounter
target event buffer overflow conditions if your host computer does not
have enough speed to allow WindView to process the events in real
time (see “Event Buffer Overflow Information” on page 19).
•
You want to collect event data at a remote site for later analysis at a lab.
You can use rtmon-client to collect a raw event log as the remote system
runs, and then import and view the event data with the WindView GUI
at the lab.
•
You want to save event logs to multiple files, each generated from a
different operating condition. rtmon-client provides an option that
allows you to save event logs into multiple files; each time event
logging is turned off and then on, a new file is generated.
To use rtmon-client, type the following at the command line on the target
system:
/usr/react/bin/rtmon-client
By default, the collected raw event log is saved to the host file
eventLog.processor_number.wvr. You can change this name with the
rtmon-client -f flag; note that if you do not specify the .wvr suffix, rtmon-client
adds this suffix to the file. To stop rtmon-client, press <Ctrl-C>.
You can now import this raw event log into the WindView GUI with the
“Analyze” command in the File menu, later saving it as a processed event
log with the “Save” command if you wish; see “Event Buffer Overflow
Information” on page 19.
Additional options to rtmon-client allow you to specify the number of
seconds to run (-t sec), to monitor other processors (-p n) or hosts (-h name),
and turn debugging on or off (-d 0|1). For a complete description of
rtmon-client and its options, refer to the reference page rtmon-client(1).
28
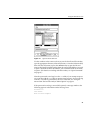
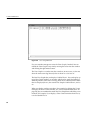
Advanced Methods for Using WindView
To import the raw event log into the WindView GUI, choose the “Analyze”
command from the File menu. The Analyze Event Log window, similar to
the one shown in Figure 2-8, displays.
Figure 2-8
Analyze Event Log Window
The current working directory is displayed in the Filter and Selection fields
by default. Type the appropriate directory name and filename.wvr into the
Selection field, then click the OK button or press the <Return> key to open
the file and remove the Analyze Event Log window from the screen. If the
file that you wish to import is listed in the Files subwindow, you can
double-click on the name to import it. (For details on working with this
window, see “Analyze Command” on page 75.)
Note that raw event logs have the .wvr suffix; if you attempt to open a
processed event log with the .wv suffix, an error message appears.
If the raw event log is successfully opened, a message like the following
appears in the Main window message area:
Processor 1:
CPU: R4400
BSP: Silicon Graphics
29
Collecting Event Data
Then, if the View Graph is displayed, the event log is displayed there; see
“Displaying a View Graph” on page 16 for information. (Note that you can
display the View Graph either before or after you have opened a raw event
log.)
The “Analyze All” command is similar to the “Analyze” command,
described above, but is used to open a trace that displays multiple
processors. When invoked, it displays the Analyze All Event Log window,
similar to Figure 2-8, which lets you import a raw event log collected with
the rtmon-client tool into WindView.
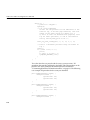
As an example, to create traces for multiple processors, in this example,
processors 1 through 3, and save them to the file, mp_test, type:
/usr/react/bin/rtmon_client -f mp_test -p 1-3 -t 10
This command collects data for 10 seconds (-t 10) and then creates three files,
mp_test.1.wvr, mp_test.2.wvr, and mp_test.3.wvr. (Note the syntax of the new
filename is name.processor_number.wvr.) The filenames display in the Files
pane (see Figure 2-8). Selecting the first name in the series (mp_test.1.wvr, for
example) opens a trace that displays activity for all three processors.
Additionally, each of the processor traces could be opened separately with
the “Analyze” command.
30
Chapter 3
3.
Working with Event Data
Chapter 2, “Collecting Event Data,” described how to collect event data;
now you are ready to work with it. By “working with the event data,” we
mean navigating the event log, selecting event data, and analyzing event
data.
Note: In most cases, this chapter does not distinguish between raw event
logs and processed event logs. This is because once you have imported event
data into the View Graph, it is considered processed.
This chapter covers the following topics:
•
“Understanding the View Graph”
•
“Selecting and Examining Event Data”
•
“Analyzing Data”
This chapter assumes that WindView has been installed and configured for
your environment; see the WindView release notes for details. It also
assumes that you have followed the instructions in Chapter 2, “Collecting
Event Data” to start WindView, open a View Graph, and import event data
into the View Graph.
For specific information on any of the WindView GUI commands mentioned
in this chapter, see Chapter 5, “Command Reference.”
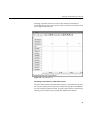
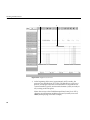
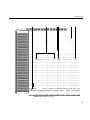
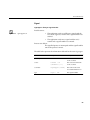
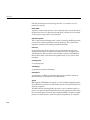
Understanding the View Graph
Depending on the real-time system and the event logging modes that have
been started, the View Graph looks something like the one shown in
Figure 3-1. Use your window manager to resize the View Graph, if need be.
31
Working with Event Data
You can refresh the View Graph at any time by moving the cursor into the
window and clicking the right mouse button.
Time Units
Menu
View Control
Window Icon
Zoom
In/Out
Pan
Left/Right
Push
Pop
Exchange Search
Legend
Accelerators Window
Search
Icon
Window
Icon
Event
Icons
State
Stipples
Interrupts
Processes
Idle Loop
Scrollbars
Detailed Time
Information Field
Timeline
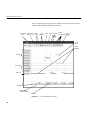
Figure 3-1
32
View Graph With Event Data
Understanding the View Graph
The View Graph is a window into the event data; in most cases, it does not
show the entire event log. Instead, what is shown is a time interval. In
Figure 3-1, for example, the time interval shown is roughly second 3.7496 to
second 3.7501.
The first View Graph that you display is labeled View 1. You can display up
to 16 View Graph windows at one time, which can be useful for looking at
different portions of the same event log. Each one is numbered in the order
that it is displayed; that is, the second View Graph is labeled View 2, and so
on.
When you display auxiliary windows, they are numbered to match the View
Graph from which they were invoked. For example, if you display a View
Control window from View 2, it is also labeled View 2. A Search window
displayed from View 2 is labeled Search 2.1, because you can display
multiple Search windows: the next one displayed from View 2 is labeled
Search 2.2, and so on. (Information on how to display auxiliary windows is
provided below.)
Figure 3-2
Time Units Menu Icon
Time Units Menu Icon
If you click and hold the left mouse button over this menu
icon, you can choose the unit of time displayed in the
Timeline and the Detailed Time Information field. The
choices are:
sec
seconds (the default)
msec
milliseconds
usec
microseconds
nsec
nanoseconds
For detailed description, see “Time Units Menu Icon” on
page 94.
Figure 3-3
View Control Icon
View Control Window Icon
Clicking this icon displays the View Control window. This
window is shown and described in “View Control Window
Icon” on page 95.
33
Working with Event Data
Figure 3-4
Icons
Zoom In/Zoom Out
Zoom In/Zoom Out Icons
The Zoom In (uppercase Z) icon lets you focus on details;
the Zoom Out (lowercase z) icon lets you focus on a bigger
picture.
Zoom In halves the time interval displayed, preserving the
screen’s midpoint. If a sub-interval is selected, the
boundaries of the sub-interval become the time interval’s
boundaries. For information on selecting a sub-interval, see
“Selecting Data” on page 38.
Zoom Out doubles the current time interval (or a selected
sub-interval), preserving the midpoint, if possible. For a
detailed description of these icons, see “Zoom In/Zoom
Out Icons” on page 97.
Figure 3-5
Icons
Figure 3-6
Figure 3-7
Pan Left/Pan Right
Pan Left/Pan Right Icons
These icons move the time interval one page to the left or
right, where a page is the width of the current time interval.
For a detailed description of these icons, see “Pan Left/Pan
Right Icons” on page 84.
Push Icon
The Push icon saves the current time interval. You can later
move back to this time interval with the Pop or Exchange
icon (see below). You can push up to 16 time intervals; if you
push more than 16, the oldest intervals are discarded in
FIFO order. For a detailed description of this icon, see
“Push/Pop/Exchange Icons” on page 85.
Pop Icon
The Pop icon causes the most recently pushed time interval
to be displayed (see the Push icon, above). For a detailed
description of this icon, see “Push/Pop/Exchange Icons”
on page 85
Push Icon
Pop Icon
Exchange Icon
Figure 3-8
34
Exchange Icon
This icon swaps the currently displayed time interval with
the most recently pushed time interval. For example, find
an interval that is of interest to you and save it with the Push
icon. Move to another time interval of interest. Then click
the Exchange icon repeatedly to move between that interval
and the current interval. For a detailed description of this
icon, see “Push/Pop/Exchange Icons” on page 85.
Understanding the View Graph
Figure 3-9
Search Window Icon
Figure 3-10 Search Accelerator
Icons
Search Window Icon
Clicking the Search Window icon (uppercase S) displays a
Search window. This window is shown and described in
“Search Window Icon” on page 88.
Search Accelerator Icons
Clicking on one of these icons finds the next or previous
occurrence of the currently selected event. (An event is
selected when found by a previous search command, or
when you click on it with the middle mouse icon; see
“Search Accelerator Icons” on page 87 for details.)
The underlined arrows find the next (or previous)
occurrence of the currently selected event in the same
context, that is, in the same interrupt level, process, or idle
loop context.
The arrows without underlines search for the next or
previous occurrence of the currently selected event,
regardless of context.
Figure 3-11 Legend Window Icon
Legend Window Icon
Clicking this icon displays the scrollable Legend window
shown in Figure 3-12. This window shows what each event
icon and process state stipple means. For detailed online
help on these icons and stipples, choose For Context from
the Help menu; then click the question mark over an icon or
stipple in the Legend window. For a detailed description of
this icon, see “Legend Window Icon” on page 80.
35
Working with Event Data
Figure 3-12 Legend Window
Interrupts
At the top of the View Graph, the interrupts used in this
event log are listed. If you need more space above the
interrupts to view icons that appear there, place the cursor
over a context label, and then press <Ctrl> and click the
right mouse button. To remove the extra space, press
<Shift> and click the right mouse button.
Processes
After the interrupts, the processes are listed in random
order.
Idle Loop
After the processes is the kernel’s idle loop, listed by
processor.
Figure 3-13 Interrupt Label
Figure 3-14 Process Label
Figure 3-15 Idle Loop Label
Figure 3-16 Detailed Time
Information Field
36
Detailed Time Information Field
Detailed time information about the current time instant,
event, or sub-interval is displayed in this field. For example,
click on an event icon with the middle mouse button and
the timestamp of that event is displayed in this field. For
details, see “Selecting and Examining Event Data” on
page 38. You can change the units that are displayed by the
Detailed Time Information field with the Time Units Menu
(described above).
Understanding the View Graph
Scrollbars
Figure 3-17 Scrollbars
Use either scrollbar by dragging the scrollbar’s thumb (the
rectangle in the scrollbar), clicking in the gutters (the area on
either side of the thumb), or clicking the arrows.
To move the thumb to a particular point in the scrollbar, put
the cursor where you want to move, then click the middle
mouse button. To move the thumb to one of the scrollbar’s
extreme ends, press the <Ctrl> key and click the left mouse
button in the gutter. Figure 3-18 summarizes these
instructions.
Figure 3-18 Using Scrollbars
The vertical scrollbar scrolls among the contexts that were
valid when this event log was collected: interrupts,
processes, and the kernels’ idle loop.
The horizontal scrollbar scrolls along the time or event
sequence axis, starting at 0 when event logging began.
State Stipples
Figure 3-19 State Stipple
These are the horizontal lines that show the state of each
process. The state stipple shown here is the Suspended
stipple. For information on what each state stipple
represents, see the Legend window (described above).
37
Working with Event Data
Event Icons
Depending on the current event logging mode and the
events you have suppressed (see “Examining Data” on
page 45), various icons are displayed that correspond to
events. The event icon shown here is the sigwrapper icon.
For information on what each event icon represents, see the
Legend window (described above). To learn specific
information on a particular occurrence of an icon, see
“Examining Data” on page 45.
Timeline
The timeline displays the time in seconds since event
logging began. You can change the units that are displayed
using the Time Units Menu.
Figure 3-20 Event Icon
Figure 3-21 Timeline
Selecting and Examining Event Data
There are various types of event data that can be selected and examined:
time intervals, time instants, sub-time intervals, and events. This section first
describes ways to select data, then describes how to examine it.
Note: Clicking the right mouse button at any time refreshes the View Graph.
Selecting Data
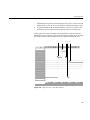
Selecting a Time Interval
A time interval is that portion of the event log that is currently displayed in
the View Graph. You can select a particular time interval with the View
Control window, first mentioned in “Understanding the View Graph” on
page 31. Clicking on the V icon in the View Graph displays the View Control
window; see Figure 3-22.
38
Selecting and Examining Event Data
Figure 3-22 View Control Window
In the From and To fields, you can specify which time interval, in units of
seconds or event sequence numbers, you would like to examine. For
example, type 62.7 in the From field and 62.8 in the To field, and then click
the Go To button to view the interval from second 62.7 to second 62.8. (The
rest of the View Control window is described in “View Control Window
Icon” on page 95.)
Selecting a Time Instant
Select a time instant by clicking the left mouse button over a time of interest
in the View Graph. (The cursor must be in the View Graph window; it cannot
be over the timeline, for example.) A vertical line appears in the event log,
and details about that time instant are displayed in the Detailed Time
Information field; see Figure 3-23.
39
Working with Event Data
Figure 3-23 Time Instant
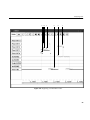
Selecting a Sub-Time Interval
Select a sub-time interval by first selecting a time instant, then moving the
cursor to another time of interest and clicking the left mouse button a second
time. Now two vertical lines are displayed in the event log, and the times of
each “leg” of the sub-interval and the difference between them are displayed
in the Detailed Time Information field.
For example, Figure 3-24 shows a sub-interval with legs at 0.6037 and 0.6177
seconds; the difference between these legs is 0.0139 seconds.
40
Selecting and Examining Event Data
Selecting a sub-time interval can tell you the amount of time that has
occurred between events. You can also select a sub-interval and zoom in on
it by using the Zoom In icon.
Figure 3-24 Sub-Time Interval
Canceling a Time Instant or a Sub-Time Interval
To cancel a time instant or sub-time interval and set a new time instant, move
the cursor to where you want the new vertical line; then press the <Shift>
key and click the left mouse button. To cancel a time instant or sub-interval
entirely, press the <Ctrl> key and click the middle mouse button.
41
Working with Event Data
Selecting an Event
You can select an event by using the mouse or by searching for the event.
Click the middle mouse button on an event icon to view its timestamp in the
Detailed Time Information field. For example, Figure 3-25 shows a selected
signal event icon, with a timestamp of 0.0851 seconds. You can also select an
event by moving the cursor near the icon, then pressing the <Ctrl> key and
clicking the left mouse button. The vertical line “snaps” to the nearest event.
To cancel an event selection, press the <Ctrl> key and click the middle
mouse button.
Figure 3-25 Event Timestamp
42
Selecting and Examining Event Data
The various mouse clicks described in this section are summarized in
Table 3-1.
Table 3-1 Selecting Data With the Mouse
Mouse Click
Description
Right button
Refresh screen
Left button
Select a time instant
Left button, move, left button
Select a sub-time interval
<Shift> + left button
Cancel a time instant or sub-interval and
set a new time instant
Middle button
Select an event
<Ctrl> + left button
Select nearest event
<Shift> + middle button
Cancel any selection
Another way to select an event is to search for it; the search commands were
first mentioned in “Understanding the View Graph” on page 31. Clicking on
the S icon in the View Graph displays a Search window labeled Search 1.1;
see Figure 3-26.
Figure 3-26 Search Window
43
Working with Event Data
Note: You can display multiple Search windows for a View Graph. Each
Search window is labeled sequentially: the first number represents the View
Graph from which you invoked the Search window (1 in the example
above); the second number represents which Search window it is relative to
all Search windows currently displayed for this View Graph (again, 1 in the
example above). The next Search window for View 1 would be labeled
Search 1.2; the first Search window for View 2 would be labeled Search 2.1.
The maximum number of Search windows that can be displayed for each
View Graph is 16.
With this window, you can search for a particular event, the next or previous
event in a particular context, or the next or previous event of any type in any
context. Follow these steps to use the Search window:
1.
Specify a particular event by entering its name in the Event field, for
example, sigwrapper.
Enter the event name by typing it or by dragging the icon of interest
into the field; see “Examining Data” for information on dragging event
icons. You can also drag icons from the Legend window into this field.
Note: You cannot drag the defaultUser and unknown event icons into this
field.
Leave this field blank if you are searching for any event in a particular
context, or any event in any context.
2.
You can further constrain the search for a particular event by specifying
the event’s object ID (the ID of the object being acted on; for example, a
signal number).
Enter the object information by typing it or by dragging the icon into
the field.
If the Event field is blank, any data in the Object ID field is ignored.
3.
You can further constrain the search for a particular event by specifying
its context ID (interrupt level, process, or idle loop).
Enter the context information by typing it or by dragging the icon of
interest into the field. Or, you can enter the information by selecting the
context label from the vertical axis with the middle mouse button, then
dragging the word “CONTEXT” that appears into the Context ID field.
If the Event field is blank, any data in the Object ID field is ignored, and
the next or previous event of any type is found in the specified context.
44
Selecting and Examining Event Data
If the Event field and the Context ID field are blank, then the next or
previous event of any type in any context is found.
4.
After you have specified the search parameters, click the appropriate
arrow to perform the search.
When the next occurrence of the event is found, the View Graph displays the
time interval in which it occurs and indicates the found occurrence by
placing a vertical line through it. Timing information is displayed in the
Detailed Information field.
To search for another occurrence of the event, you can use the Search
window again, or you can use the Search Accelerator icons in the View
Graph. For information on these icons, see “Understanding the View Graph”
on page 31.
Examining Data
An obvious way to examine the event data is to simply look at it. Use the
scrollbars to scan the data as a whole, zooming in and out as appropriate
with the Zoom icons. Even with this simple method you can gain useful
information about your real-time system; for example, you can answer the
following questions:
•
Are deadlines being met?
•
Are all the application processes getting a chance to execute?
•
Is too much time being spent in ISRs or in the idle loop?
Another way to examine the event data is to use the methods described in
“Selecting Data” to select time intervals or events of interest, zoom in or out
on them, and examine their timestamps and sub-intervals.
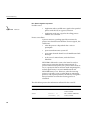
For a more in-depth analysis of your real-time system, you can examine
specific events. To do so, first choose the “Tcl: Event Inspector” command
from the Windows menu. The Event Inspector window appears, as shown
in Figure 3-27.
45
Working with Event Data
Figure 3-27 Event Inspector Window
Now, select an event icon with the middle button and drag it to the Event
Inspector. The cursor changes to the shape of the event icon, letting you see
what is being dragged. When you “drop” the icon into the Event Inspector,
information about that event appears. Figure 3-27 shows an example of what
might appear in the Event Inspector window when a sigwrapper icon is
dropped in it.
When you drag a new icon into the window, it overwrites the previous
event’s information. You can also move the cursor into the window and type
the letter C to clear the Event Inspector.
Figure 3-28 Inspection of sigwrapper
Another way to work with event data is with the View Control window
(described briefly in “Selecting Data”). Clicking the V icon in the View
Graph displays the View Control window; see Figure 3-22.
46
Selecting and Examining Event Data
The View Control window contains commands that let you change how the
event log is displayed. The following describes the elements of this window:
Track Incoming Data Button
This toggle button controls how the View Graph is updated
in relationship to the importing of an event log. (This only
affects data that is being imported as the target is running;
see “Importing Event Data” on page 16. Event data
imported with the Analyze and Open commands is brought
into the View Graph all at once.)
If the Track Incoming Data button is toggled on (the default),
the View Graph displays the event log in real time as it
arrives. In this mode, you cannot work with the event data
until collection is stopped.
If the button is toggled off, the View Graph is “frozen”: only
the horizontal scrollbar is adjusted to show that more data
has arrived. This mode allows you to examine something of
interest while the raw event log continues to be imported.
For example, you can examine a particular time interval,
save it with the Push icon, then turn Track Incoming Data
back on. When you find another time interval of interest,
you can turn Track Incoming Data off again, then toggle
between the two intervals with the Exchange icon.
From/To/Go To
In the From and To fields, you can specify which time
interval, in units of seconds or event sequence numbers,
you would like to examine. See “Selecting Data” on page 38
for details. Click the Go To button to go to that section of the
timeline.
Preserve (%)/Left and Right Arrow Buttons
The Left and Right Arrow buttons act like the Pan Left and
Pan Right icons on the View Graph (see “Understanding the
View Graph” on page 31), but are constrained by the
Preserve (%) field.
For example, if Preserve is set to 50, the arrows move the
view forward or back one-half page at a time (where a page
is the width of the current time interval). However, if
Preserve is set to 90, they move forward and back just 10%
47
Working with Event Data
of the current time interval at a time. If Preserve is set to 0,
they act the same as the icons on the View Graph; if Preserve
is 100, these arrows are disabled.
Zoom In/Out/Factor
The Zoom In and Zoom Out buttons act like the zoom icons
on the View Graph (see “Understanding the View Graph”
on page 31), but are constrained by the Factor field.
For example, if Factor is set to 10, this Zoom In displays 1⁄10
of the current time interval and this Zoom Out displays 10
times the current time interval. If Factor is set to 2, they act
the same as the zoom icons on the View Graph (Zoom In
displays 1⁄2 the current time interval; Zoom Out displays 2
times the current interval). However, if Factor is set to less
than 1, the actions of these zoom buttons are reversed.
Display Events Button
Clicking the Display Events button causes the Display
Events/States window to appear, as shown in Figure 3-29.
Figure 3-29 Display Events/States Window
48
Analyzing Data
Toggling these event types and state types on or off controls
which elements are displayed. ISR entrances and exits
(Interrupts), and vertical lines between process or interrupt
contexts and ISRs (Interrupt Transitions) are not displayed
by default. (For a description of the other events and states,
see “Display Events Command” on page 78.)
Note that this is different from the Target window, which
controls event logging; see “Starting and Stopping Event
Logging on the Target” on page 18.
Analyzing Data
Once you know how to use the WindView tools to collect and examine data,
the data in the View Graph can be analyzed. This section walks you through
several example View Graph windows to show how to analyze a
progression of events, as they are displayed in real time.
The first example shows the events leading up to the WindView program
executing on a single processor. The second example shows WindView
executing on a multiprocessor system. Examples 3 and 4 shows the
REACT/Pro Frame Scheduler running on a Silicon Graphics multiprocessor
system.
The callout numbers outside the figures point out important events that are
described in the corresponding text listing. For example, step 1 in the text
describes what is happening at item 1 in the View Graph.
Note: If scheduling actions are performed on an untraced processor, they
will not display in the View Graph. You must trace every processor on which
the process can run to completely follow the progress of the process.
Example 1—How WindView Starts to Execute
Figure 3-30 shows a trace where WindView starts executing on a single
processor, labeled Proc2.
49
Working with Event Data
1
2
Figure 3-30 Single Processor Trace
1.
At the beginning of this trace (approximately 62.77 seconds), the
processor is in the idle loop (Proc2 Idle). The WindView (windview.ex)
process, and the pfslowtimo and routed daemons are suspended. The
system controller (sysctlrd) and network daemons (rtnetd) are ready to
run, waiting on the run queue.
Notice the activity at the Global Interrupt Entry Point (Proc2 INT 0),
showing several interrupt qualifier user-events (actually user event
20005, but displaying as 5 in this example).
50
Analyzing Data
Additionally, the processor Tick Interrupt (Proc2 INT 6) occurs every 10
milliseconds, as you can see if you click two adjacent interrupt 6 events.
2.
At approximately 62.80 seconds, WindView (windview.ex) receives the
event that causes it to go from the suspended to the executing state.
At this point, we want to examine in more detail the events that caused
Windview to start executing. Click on 62.80 seconds and then zoom in (click
the Zoom In icon) to the sub-time interval, as displayed in Figure 3-31.
1
2
3 4
5
Figure 3-31 Single Processor—Sub-Time Interval
51
Working with Event Data
1.
At approximately 62.80479 seconds, an interrupt occurs that enters the
Global Interrupt Entry Point (Proc2 INT 0). The interrupt is further
qualified (designated by the user event 5).
2.
Once IRIX has further qualified the interrupt as an Interprocessor
Interrupt, the interprocessor Interrupt Service Routine (ISR) is entered,
as shown in the graph by the change in state to Proc2 INT 11.
3.
After the completion of processing within the interprocessor interrupt
ISR, the processor exits through the Global Interrupt Entry Point (Proc2
INT 0).
4.
The processor returns to the idle state (Proc2 Idle) and the IRIX
scheduler re-evaluates the run queue.
5.
Since the processor is idle, a mode switch can occur. The WindView
process (windview.ex), which was suspended on the run queue, now is
ready to run and begins to execute.
Example 2—WindView Executing on a Multiprocessor
System
Figure 3-32 shows a trace for a multiprocessor system, with processors
labeled Proc2 and Proc3. This example shows how the WindView process
migrates between the two processors as it executes.
52
Analyzing Data
1
2
3 4
5
6
Figure 3-32 Multiprocessor Trace
53
Working with Event Data
1.
At the start of the trace, both processors are executing the idle loop.
2.
The WindView process (windview.ex) is in the ready state and begins to
run on Processor 3. Processor 3 goes into idle mode and then continues
running windview.ex three times, as it periodically blocks, waiting for an
event or resource.
3.
At approximately 6.630 seconds, Processor 2 receives an IRIX
scheduling interrupt (Proc2 INT6). The interrupt is qualified through
the Global Interrupt Entry Point (Proc2 INT 0).
4.
WindView is shown executing (at approximately 6.6305 seconds) on
Processor 2.
5.
At approximately 6.633 seconds, Processor 3 receives an interprocessor
interrupt. The interrupt is qualified through the Global Interrupt Entry
Point (Proc3 INT 0).
6.
WindView again executes on Processor 3.
Example 3—Beginning of an FRS Frame
Figure 3-33 shows the start of a Frame Scheduler (FRS) minor frame.
54
Analyzing Data
1 2 3
4
5
6
7
Figure 3-33 Beginning of an FRS Minor Frame
55
Working with Event Data
1.
Processor 1 receives an interrupt transitioning from the idle state to the
Global Interrupt Entry Point (Proc1 INT 0). The interrupt is further
qualified (user event 5) as a CC Counter Interrupt.
2.
Processor 1 transitions to the CC Counter Interrupt ISR (Proc 1 INT 7),
signifying an IRIX timeout.
Note: The processor is interrupted only once; the other interrupts that
follow in this figure are further qualifications of this same processor
interrupt.
3.
Processor 1 further qualifies the interrupt as a Frame Scheduler
Interrupt (Proc1 INT 1), signifying the FRS has interrupted the
processor.
4.
User event 20017 occurs in the Frame Scheduler ISR, signifying the start
of an FRS minor frame.
5.
Processor 1 receives user event 20002, an FRS Dispatch, signifying that
FRS chooses a new process to run; in this example, the process multi.
6.
The process multi begins executing.
7.
A Frame Scheduler Yield event is registered (Proc1 INT 5, event 20003)
indicating that the executing process has called the frs_yield function.
Example 4—FRS Recovery Mechanism
This is an example of the Frame Scheduler (FRS) recovery mechanism.
Figure 3-34 show a minor frame being injected so processing can complete.
56
Analyzing Data
1
2
Figure 3-34 FRS Recovery Mechanism
1.
Processor 2 receives a Frame Scheduler Interrupt (Proc2 INT 1) further
identified by event 20009, an FRS frame overrun, signifying that the
process failed to yield a minor frame.
2.
Processor 2 receives another Frame Scheduler Interrupt (Proc2 INT 1)
for user event 20011, an FRS inject frame event, signifying that a minor
frame has been injected to complete processing (the recovery
mechanism).
57
Chapter 4
4.
Event Dictionary
This chapter provides a “dictionary” of the events collected by WindView. It
lists each event by object type, providing the following information for each:
•
the event’s icon
•
the possible causes of the event
•
the possible process state effects that can result from the event
•
the information collected about the event (That is, the information
displayed when you drag the event’s icon into the Event Inspector
window; see “Examining Data” on page 45 for details on using this
window.)
Using the Event Dictionary
This section provides tips for using the event dictionary.
Figure 4-1
sigwrapper Icon
1.
Suppose you are viewing an event log with the WindView GUI and you
see the sigwrapper event icon as shown in Figure 4-1.
2.
Look in the Legend window (see “Understanding the View Graph” on
page 31) to determine that this is the sigwrapper event icon.
3.
Using the online help (see “Using Help” on page 14) or this event
dictionary chapter, you can look up the information on what can cause
a sigwrapper event, what effect on process state it may have, and what
information is collected for a sigwrapper event, as shown in Figure 4-2:
59
Event Dictionary
Icon
Event Name
Event Description
List of what
can cause
the event
to occur
Description of the effect
this event
can have on
the process in whose
context the event
occurred, as well
as other processes in
the system
The event table presents
information on the
parameters logged for
this event
Figure 4-2
Sample Event Dictionary Page
Most of the elements that are called out on the sample page are
self-explanatory, with the possible exception of the “Information collected”
section.
The event table describes the information that is logged for a particular
event.
60
Event Dictionary
Looking at the sample sigwrapper event dictionary page above, you see the
context (the process, ISR, or idle loop in which the event occurred);
eventName; taskId; priority; you also see that the timeStamp is logged. (For
information on starting event logging, see Chapter 2, “Collecting Event
Data.”)
For example, if you drag the sigwrapper icon into the Event Inspector
window, you see something like this:
Time : 0.00195
Context : t4 (0xf90f6c) {77}
sigwrapper (10029)
signo : 0xe
This provides the following information:
•
Time indicates the time (in seconds) since tracing began (0.0195).
•
Context indicates the process (t4), process ID (0xe), and unique event
•
A sigwrapper event occurred (internal event type #10029).
ID (77)1.
Note: If an invalid parameter is passed to a routine, an event icon may not
appear, depending on whether the error was detected before or after event
logging occurs. In particular, if an invalid object ID is passed to a routine, the
event icon will not appear.
Event Dictionary
ISR
intEnt—Entry to ISR
Figure 4-3
intEnt Icon
1
Possible causes: A hardware interrupt occurred for which there is an
associated ISR.
A unique event ID is assigned to each event in the log. This is to differentiate between, for example, a process of
a particular ID that is deleted and a new process that is spawned with the deleted process’s ID.
61
Event Dictionary
Process state effects:
If the interrupt occurs in the context of an executing process,
the process is displayed as making a transition to the ready
state when the ISR starts executing.
In IRIX, there is a single global interrupt entry point for
each processor. With WindView for IRIX, this global entry
point appears on the WindView graph as interrupt 0 (ProcX
INT0). All interrupts received by a processor pass through
this global entry point. Each interrupt may then be further
qualified by other kernel events that appear on the
WindView graph as additional interrupts. A description of
interrupts is provided in Table 4-1.
Note: The display of this icon is suppressed by default; to display it, toggle
the Interrupts button in the Display Events/States window.
The table below presents the information collected for the event intEnt:
62
Event Parameter
Sample Data
Description
timeStamp
Time : 0.669146
The time at which the
event occurred.
context
Context : INT 3
(0x3) {63}
The context in which the
event occurred.
eventName
intEnt-3 (105)
The name and INT level of
the event associated with
this icon; the internal
event number = 102 + INT
number.
Event Dictionary
The following interrupts are identified by WindView for IRIX. Each
interrupt is delineated by an interrupt entry and interrupt exit timestamp.
Table 4-1 Interrupt Level Descriptions
Interrupt Level
Description
Probable Cause
INT 0
Interrupt qualifier
All interrupts that occur under IRIX “pass
through” this level. Some interrupts are
not further qualified by WindView (for
example, vsync and vme interrupts) and
appear at this level only.
INT 1
Frame Scheduler
Interrupt
This is a further qualified version of CC
counter interrupt (see INT 7) indicating
that the IRIX REACT/Pro™ Frame
Scheduler has interrupted the processor.
INT 5
Frame Scheduler
yield
Not actually an IRIX interrupt, this level
indicates that a user process has called
either the frs_yield() function or the
schedctl() (MPTS_FRS_YIELD) system
call.
INT 6
CPU tick interrupt
The IRIX scheduler interrupts each
processor every 10 milliseconds. IRIX
uses this interrupt to perform scheduling
processes and other housekeeping
functions.
INT 7
CC counter interrupt An event timeout interrupt, either from
expiration of a kernel-initiated timer or a
user-initiated timer (ITIMER).
INT 8
Profiler interrupt
An interrupt initiated from the IRIX
profiler (see prof(1)).
INT 9
Group interrupt
Designates interrupt occurring on IRIX
multiprocessor systems. Group interrupts
are seen when multiple Frame Schedulers
are synchronized across multiple
processors.
63
Event Dictionary
Table 4-1 (continued)
Interrupt Level Descriptions
Interrupt Level
Description
Probable Cause
INT 11
Inter-processor
interrupts
One processor has interrupted another
based on some action initiated by the first
processor (for example, TLB flush, TLB
fault, and so forth).
INT 12
Network interrupts
A network interrupt has occurred from an
Ethernet, FDDI, or ATM interface.
intExit—Exit from ISR
Possible causes: The ISR finished executing.
Figure 4-4
IntExit Icon
Process state effects:
When this ISR finishes executing, control returns to the
interrupted context.
Note: The display of this icon is suppressed by default; to display it, toggle
the Interrupts button in the Display Events/States window.
The table below presents the information collected for the event intExit:
64
Event Parameter
Sample Data
Description
timeStamp
Time : 0.671482
The time at which the
event occurred.
context
Context : INT 5
(0x5) {65}
The context in which the
event occurred.
eventName
intExit (101)
The name of the event
associated with this icon.
Event Dictionary
Signal
sigwrapper—Entry to signal handler
Possible causes:
Figure 4-5
sigwrapper Icon
•
The application code or an ISR sent a signal with the
kill() or the sigqueue() routine and a signal handler was
entered.
•
The application code sent a signal with the raise()
routine and a signal handler was entered.
Process state effects:
The signalled process is interrupted and the signal handler
runs in that process’ context.
The table below presents the information collected for the event sigwrapper:
Event Parameter
Sample Data
Description
timeStamp
Time : 0.00195
The time at which the
event occurred.
context
Context : t4
(0xf90f6c) {77}
The context in which the
event occurred.
eventName
sigwrapper (10029)
The name of the event
associated with this icon.
signo
signo : 0xe
The signal number.
65
Event Dictionary
kill—Send a signal to a process
Possible causes:
Figure 4-6
kill Icon
•
Application code or an ISR sent a signal to the specified
process with the kill() or sigqueue() function.
•
Application code sent a signal to the calling process
with the raise() function.
Process state effects:
A process receives a pending signal the next time the
process exits from the kernel domain. For most signals, this
could occur:
•
when the process is dispatched after a wait or
preemption
•
upon return from some system call
•
upon return from the kernel’s usual 10 millisecond tick
interrupt
•
at the start of a minor frame, under the Frame
Scheduler
SIGALRM is delivered as soon as the kernel is ready to
return to user processing after the timer interrupt, to
preserve timer accuracy. Thus, for a process that is ready to
run, in a processor that has not been made nonpreemptive,
normal signal latency is at most 10 milliseconds and
SIGALRM latency is less. However, when the receiving
process is not ready to run, or when there are competing
processes with superior priorities, the delivery of a signal is
delayed until the next time the receiving process is
scheduled.
The table below presents the information collected for the event kill:
66
Event Parameter
Sample Data
Description
timeStamp
Time : 0.1530
The time at which the
event occurred.
context
Context : t2
(0x3dd918) {30}
The context in which the
event occurred.
Event Dictionary
Event Parameter
Sample Data
Description
eventName
kill (10027)
The name of the event
associated with this icon.
taskId
taskId : 0xf90
The PID of the process to
receive the signal.
signo
signo : 0x1e
The signal number.
Processes
processDelete—Delete a process
Possible causes:
Figure 4-7
processDelete Icon
•
The system or application code received a signal with
the action to terminate the process.
•
The system or application code called the exit()
function.
Process state effects:
If the routine is successful, the specified process is
terminated. If the executing process kills itself, a context
switch occurs.
The table below presents the information collected for the event
processDelete:
Event Parameter
Sample Data
Description
timeStamp
Time : 0.09537
The time at which the
event occurred.
context
Context : tShell
(0x3a468c) {82}
The context in which the
event occurred.
eventName
taskDelete (10001)
The name of the event
associated with this icon.
safeCnt
Not applicable for IRIX.
Not applicable for IRIX.
taskId
taskId : 0x38b
The PID of the process to
delete.
67
Event Dictionary
Unknown
unknown—Unknown event
Possible causes:
Figure 4-8
•
unknown Icon
WindView has received an event that it does not
recognize.
Process state effects:
Indeterminate.
The table below presents the information collected for the event unknown:
Event Parameter
Sample Data
Description
UnknownId
Unknown event id :
-25437
The ID of the event.
User Event
defaultUser—Display user-specified event
Possible causes:
Figure 4-9
defaultUser Icon
•
The application code called the rtmon_log_user_tstamp()
function.
Process state effects:
None.
Note: The icon shown above is the default user event icon. You can design
your own; see “Creating Icons for User Events” on page 101.
The table below presents the information collected for the event defaultUser:
Other information is collected based on the passing of parameters to
68
Event Dictionary
rtmon_log_user_tstamp (see “Adding Timestamps to Your Programs” on
page 26 for more information).
Event Parameter
Sample Data
Description
timeStamp
Time : 9.672774
The time at which the
event occurred.
context
Context : t1
(0x3a118c) {40}
The context in which the
event occurred.
userEventId
User event 2
The name and number of
the user event.
address
Address : 0x1a644
The address at which the
eventpoint was set.
Many IRIX kernel events are shown as “user” events—or, more accurately,
user event numbers above 20000 are reserved for kernel events. These events
are unique to WindView for IRIX and are described in Table 4-2 (in the
following table, IRIX REACT/Pro Frame Scheduler is designated as FRS for
convenience).
Table 4-2 User Event Numbers Above 20000
Event Number
Description
Possible Cause
20000
Undefined system An event (timestamp) of an unknown type
event
was generated from the IRIX kernel.
20001
Undefined
daemon event
An event (timestamp) of an unknown type
was generated from an IRIX daemon.
20002
FRS dispatch
The FRS chooses a new process to run, or
idles the processor if no other FRS processes
are ready to run.
20003
FRS yield
A user process has called either the
frs_yield() function or the schedctl
(MPTS_FRS_YIELD) system call. This event
generally appears with INT 5.
69
Event Dictionary
Table 4-2 (continued)
70
User Event Numbers Above 20000
Event Number
Description
Possible Cause
20004
FRS fatal frame
overrun
The FRS has incurred a frame overrun
(indicates that a process failed to yield in a
minor frame) and there is no recovery
mechanism in place.
20005
Interrupt qualifier An interrupt has been received by the
processor and is being qualified. (This event
number may display as 5 in some version of
WindView for IRIX.)
20008
FRS frame
underrun
20009
FRS frame overrun The FRS has incurred a frame overrun
(indicates that a process failed to yield in a
minor frame). This event is accompanied
with either event 20010, 20011, 20012, or
20013. Qualifier #2 returns the current
number of overruns.
20010
FRS no recovery
No recovery mechanism is in place upon an
overrun condition (this event is always
accompanied by event 20009).
20011
FRS inject frame
An FRS minor frame has been injected as the
recovery mechanism for a frame overrun
occurrence (this event is always
accompanied by event 20009).
20012
FRS stretch frame
An FRS minor frame has been stretched as
the recovery mechanism for a frame overrun
occurrence (this event is always
accompanied by event 20009).
20013
FRS steal frame
An FRS minor frame has stolen time from an
adjacent frame as the recovery mechanism
for a frame overrun occurrence (this event is
always accompanied by event 20009).
The FRS has incurred a frame underrun
(indicates that a process should have been
dispatched in a minor frame and was not).
Qualifier #2 returns the current number of
underruns.
Event Dictionary
Table 4-2 (continued)
User Event Numbers Above 20000
Event Number
Description
Possible Cause
20014
FRS maximum
errors
The FRS has received the maximum number
of allowable errors (overruns or underruns)
permitted by the application or program.
This event causes the FRS to terminate.
20015
Dropped
timestamps
In some extreme circumstances, the rtmond
daemon issues this event to indicate that
timestamps have been dropped from the
event stream (this could occur, for example,
when events are being generated faster than
they can be saved).
20016
FRS start of major
frame
Designates the start of a Frame Scheduler
major frame.
20017
FRS start of minor Designates the start of a Frame Scheduler
frame
minor frame.
71
Chapter 5
5.
Command Reference
This chapter provides a reference to the WindView GUI commands. They are
presented in alphabetical order by command or icon name:
•
“About WindView Command”
•
“Analyze Command”
•
“Analyze All Command”
•
“Contents Command”
•
“Display Events Command”
•
“For Context Command”
•
“Legend Window Icon”
•
“New Graph Command”
•
“Open Command”
•
“Pan Left/Pan Right Icons”
•
“Push/Pop/Exchange Icons”
•
“Quit Command”
•
“Save Command”
•
“Search Accelerator Icons”
•
“Search Window Icon”
•
“Target Command”
•
“Tcl Evaluation Command”
•
“Tcl: Event Inspector Command”
•
“Time Units Menu Icon”
73
Command Reference
•
“View Control Window Icon”
•
“Zoom In/Zoom Out Icons”
There are two places where commands are located in the WindView GUI:
•
In one of the WindView Main window’s menus: File, Windows, or
Help. The Main window, as shown in Figure 5-1, displays when the
windview command is invoked; see “Starting WindView” on page 13.
Figure 5-1
•
WindView Main Window
In the icon bar across the top of the View Graph, as shown in Figure 5-2.
The View Graph is displayed with the “New Graph” command in the
Main window’s Windows menu.
Figure 5-2
View Graph Icon Bar
For general information on using WindView, see Chapter 2, “Collecting
Event Data.”
About WindView Command
This command is located in the Help menu. When invoked, it displays the
About WindView window, as shown in Figure 5-3, which contains version
and copyright information on the WindView product.
74
Analyze Command
Figure 5-3
About WindView Window
When you are finished with the screen, click OK or Cancel to remove it. Click
Help to get online information about this window.
Analyze Command
This command is located in the File menu. When invoked, it displays the
Analyze Event Log window, as shown in Figure 5-4, which lets you import
a raw event log collected with the rtmon-client tool into WindView.
You will notice a difference in the amount of time it takes to import a
processed event log with the “Open” command and the amount of time it
takes to analyze a raw event log with the “Analyze” command. When a
processed log is imported, it takes a constant, minimal amount of time,
because the information that the WindView GUI needs to depict the event
data is already present. Conversely, because this information is not yet
present in a raw evert log, the time to analyze such a log is longer, and is in
proportion to the size of the log. Because of this depiction of information, a
processed event log is much larger than a raw event log.
75
Command Reference
Figure 5-4
Analyze Event Log Window
The current working directory is displayed in the Filter and Selection fields
by default. As you move to other directories, the Directories and Files fields
are automatically resized to show as much information as possible.
To use this window, follow these steps:
1.
To search for the raw event log to open, use the Filter field to specify a
particular directory, double-clicking names in the Directories
subwindow, clicking the Filter button, or pressing the <Return> key, as
appropriate.
As you “filter” directories, they are listed in the Selection field, and
their subdirectories and files are listed in the Directories and Files
subwindows. You can continue filtering directories in this manner until
the appropriate directory name is specified in the Selection field.
2.
76
Once you are in the correct directory, use the Selection field to specify
the particular raw event log to open. You can click the name in the Files
subwindow or type the name in. Files are named with the syntax
name.processor_number.wvr.
Analyze All Command
3.
Double-click the event log name, click the OK button, or press
<Return> to analyze the file and remove the Analyze Event Log
window from the screen.
Note: Raw event logs have the .wvr suffix; if you attempt to open a
processed event log (with the .wv suffix), an error message appears.
If the raw event log is successfully opened, a message like the following
appears in the Main window message area:
Processor 1:
CPU: R4400
BSP: Silicon Graphics
Then, if the View Graph is displayed, the event log is displayed there; see
“New Graph Command” on page 81. (Note that you can display the View
Graph either before or after you have opened a raw event log.)
At any time, you can click the Cancel button to remove the Analyze Event
Log window from the screen, or click the Help button to display information
on this window.
Analyze All Command
This command is located in the File menu. The “Analyze All” command is
similar to the “Analyze” command, described above, but is used to open a
View Graph that displays multiple processors. When invoked, it displays
the Analyze All Event Log window, similar to Figure 5-4, that lets you
import the first raw event log in a series of similarly named logs collected
with the rtmon-client tool.
As an example, to create traces for multiple processors, in this example,
processors 1 through 3, and save them to the file, mp_test, type:
/usr/react/bin/rtmon_client -f mp_test -p 1-3 -t 10
This command creates three files, mp_test.1.wvr, mp_test.2.wvr, and
mp_test.3.wvr. (Note the syntax of the new filename is
name.processor_number.wvr.) The filenames display in the Files pane of the
Analyze All window. Selecting the first name in the series (mp_test.1.wvr, for
example) opens a trace that displays the activity of all three processors.
77
Command Reference
Additionally, each of the processor traces could be opened separately with
the “Analyze” command.
Contents Command
This command is located in the Help menu. When invoked, it displays the
WindView Help Contents window, as shown in Figure 5-5, which lets you
scroll and jump among the various help topics.
Figure 5-5
Help Contents Window
For information on how to use the help, choose the “Using Help” command
from this window’s Help menu.
Display Events Command
This command is located in the View Control window, which is located in
the View Graph (displayed with the New Graph command); see “View
Control Window Icon” on page 95.
Clicking the Display Events button on the View Control window displays the
Display Events/States window, as shown in Figure 5-6.
78
Display Events Command
Figure 5-6
Display Events/States Window
Toggling these event and state types on or off controls which elements are
displayed in the View Graph. System clock ticks (Ticks), ISR entrances and
exits (Interrupts), and vertical lines between process or interrupt contexts
and ISRs (Interrupt Transitions) are not displayed by default.
Note that this is different from the Target window, which controls event
logging; see “Target Command” on page 90.
The following describes the event and state types you can display:
Tasks
If toggled on (the default), process event icons are
displayed.
Note: With WindView for IRIX, not all listed events can be
displayed (for example, the processSpawn event can not be
displayed).
Signals
If toggled on (the default), signal event icons are displayed.
Interrupts
If toggled on, interrupt event icons (intEnt and intExit) are
displayed.
79
Command Reference
User Defined
If toggled on (the default), user-defined event icons
(including the default “user-defined” event icon) are
displayed.
UD Event IDs
If toggled on (the default), IDs associated with user-defined
events are displayed.
Nonexecuting States
If toggled on (the default), process states other than the
executing state (such as pended and ready) are displayed.
Transition Lines
If toggled on (the default), vertical lines connecting a
previous context to the current context are displayed.
Interrupt Transitions
If toggled on, vertical lines to or from an interrupt context
are displayed.
For Context Command
This command is located in the Help menu and it allows you to get
context-sensitive help on any portion of the user interface.
When you choose this command, the cursor turns into a question mark.
Move this question mark over the user interface element of interest and click
with the left mouse button to display information for that element.
Legend Window Icon
The Legend Window icon is located in the icon bar of the View Graph, which
is displayed with the “New Graph” command in the Windows menu.
Figure 5-7
80
Legend Window Icon
New Graph Command
Clicking this icon displays a scrollable Legend window, as shown in
Figure 5-8, that shows what each event icon and stipple means. For more
information on these icons and stipples, choose “For Context” from the Main
window’s Help menu, then click the question mark over the icon or stipple
of interest in the Legend window.
Figure 5-8
Legend Window
New Graph Command
This command is located in the Windows menu. When invoked, it displays
a View Graph, as shown in Figure 5-9, where you can examine event data.
81
Command Reference
Figure 5-9
View Graph Window
Use your window manager to resize the View Graph, if needed. You can
refresh the View Graph at any time by moving the cursor into the window
and clicking the right mouse button.
The View Graph is a window into the event data; in most cases, it does not
show the entire event log. Instead, what is shown is a time interval.
The first View Graph that you display is labeled View 1. You can display up
to 16 View Graph windows at one time, which can be useful for looking at
different portions of the same event log. Each one is numbered in the order
that it is displayed; that is, the second View Graph is labeled View 2, and so
on.
When you display auxiliary windows (for example, by clicking the V icon)
to display the View Control window, see “View Control Window Icon” on
page 95), they are numbered to match the View Graph from which they were
invoked. For example, if you display a View Control window from View 2,
it is also labeled View 2.
82
Open Command
Open Command
This command is located in the File menu. When invoked, it displays the
Open Event File window, as shown in Figure 5-10, which lets you open a
processed event log (created with the Save command; see “Save Command”
on page 85).
Figure 5-10 Open Event File Window
The current working directory is displayed in the Filter and Selection fields
by default. As you move to other directories, the Directories and Files
subwindows are automatically resized to show as much information as
possible.
1.
To search for the processed event log to open, use the Filter field to
specify a particular directory, double-clicking names in the Directories
subwindow, clicking the Filter button, or pressing the <Return> key, as
appropriate.
As you “filter” directories, they are listed in the Selection field, and
their subdirectories and files are listed in the Directories and Files
subwindows. You can continue filtering directories in this manner until
the appropriate directory name is specified in the Selection field.
83
Command Reference
2.
Once you are in the correct directory, use the Selection field to specify
the particular processed event log to open. You can click on the name in
the Files subwindow or type the name in.
3.
Double-click the event log name, click the OK button, or press
<Return> to open the file and remove the Open Event File window
from the screen.
Note: Processed event logs have the .wv suffix; if you attempt to open a raw
event log (with the .wvr suffix), an error message appears.
If the processed event log is successfully opened, a message like the
following appears in the Main window message area:
Processor 1:
CPU: R4400
BSP: Silicon Graphics
Then, if the View Graph is displayed, the event log is displayed there; see
“New Graph Command” on page 81. (Note that you can display the View
Graph either before or after you have opened a processed event log.)
At any time, you can click the Cancel button to remove the Open Event File
window from the screen, or click the Help button to display information on
this window.
Pan Left/Pan Right Icons
These icons are located in the icon bar of the View Graph, which is displayed
with the “New Graph” command in the Windows menu.
Figure 5-11 Pan Left/Pan Right Icons
Pan Left and Pan Right move the time interval one page to the left or right,
where a page is the width of the current time interval.
84
Push/Pop/Exchange Icons
Push/Pop/Exchange Icons
These icons are located in the icon bar of the View Graph, which is displayed
with the “New Graph” command in the Windows menu.
Figure 5-12 Push/Pop/Exchange Icons
The Push icon saves the current time interval. You can later move back to this
time interval with the Pop or Exchange icon. You can push up to 16 time
intervals; if you push more than 16, the oldest intervals are discarded in
FIFO order.
The Pop icon causes the most recently pushed time interval to be displayed.
The Exchange icon swaps the currently displayed time interval with the
most recently pushed time interval. For example, find an interval that is of
interest to you and save it with the Push icon. Then click the Exchange icon
repeatedly to move between that interval and the current interval.
Quit Command
This command is located in the File menu. When it is invoked, it exits
WindView.
The WindView Main window and all other WindView windows are
removed from the screen.
Note: When you exit WindView, you are not prompted to save your event
data. To save event data before exiting, see “Save Command” on page 85.
Save Command
This command is located in the File menu. When it is invoked, it displays the
Save Event File window, as shown in Figure 5-13, which lets you save
85
Command Reference
processed event logs that you can open later with the “Open” command; see
“Open Command” on page 83.
Figure 5-13 Save Event File Window
The current working directory is displayed in the Filter and Selection fields
by default. As you move to other directories, the Directories and Files
subwindows are automatically resized to show as much information as
possible.
1.
To search for the directory to save to, use the Filter field to specify the
directory name, double-clicking names in the Directories subwindow,
clicking the Filter button, or pressing the <Return> key, as appropriate.
As you “filter” directories, they are listed in the Selection field, and
their subdirectories and files are listed in the Directories and Files
subwindows. You can continue filtering directories in this manner until
the appropriate directory name is specified in the Selection field.
2.
86
Once you are in the correct directory, use the Selection field to specify
the particular processed event log to save to. You can click the name in
the Files subwindow or type the name in.
Search Accelerator Icons
3.
Double-click the event log name, click the OK button, or press the
<Return> key to save the file and remove the Save Event File window
from the screen.
When a processed event log is saved, two files are created: filename.wv and
filename.wvd. These files must be kept together in the same directory, the .wv
and .wvd suffixes intact, or the “Open” command will not be successful; see
“Open Command” on page 83.
At any time, you can click the Cancel button to remove the Save Event File
window from the screen, or click the Help button to display information on
the window.
Search Accelerator Icons
The Search Accelerator icons are located in the icon bar of the View Graph,
which is displayed with the “New Graph” command in the Windows menu.
Clicking one of these icons finds the next or previous occurrence of the
currently selected event.
Figure 5-14 Search Accelerator Icons
The event may be selected because it was found by a previous search
command, or you may have selected it with the middle mouse button (see
“Selecting Data” on page 38).
The underlined arrows find the next (or previous) occurrence of the
currently selected event in the same context, that is, in the same interrupt
level, process, or idle loop context.
The arrows without underlines search for the next or previous occurrence of
the currently selected event, regardless of context.
87
Command Reference
Search Window Icon
The Search Window icon is located in the icon bar of the View Graph, which
is displayed with the “New Graph” command in the Windows menu.
Figure 5-15 Search Window Icon
When you click the Search Window icon, the Search window displays, as
shown in Figure 5-16.
Figure 5-16 Search Window
Note: You can display multiple Search windows for a View Graph. Each
Search window is labeled sequentially: the first number represents the View
Graph from which you invoked the Search window (1 in the example
above), the second number represents which Search window it is relative to
all Search windows currently displayed for this View Graph (again, 1 in the
example above). The next Search window for View 1 would be labeled
Search 1.2; the first Search window for View 2 would be labeled Search 2.1.
The maximum number of Search windows that can be displayed for each
View Graph is 16.
With this window, you can search for a particular event, the next or previous
event in a particular context, or the next or previous event of any type in any
context. Follow these steps to use the Search window:
88
Search Window Icon
1.
Specify a particular event by entering its name in the Event field, for
example, sigwrapper.
Enter the event name by typing it or by dragging the icon of interest
into the field; see “Selecting Data” on page 38 for information on
dragging event icons. You can also drag icons from the Legend window
into this field; the exceptions are the defaultUser and unknown icons.
Leave this field blank if you are searching for any event in a particular
context, or any event in any context.
2.
You can further constrain the search for an event by specifying the
event’s object ID (the ID of the object being acted on; for example, a
semaphore ID).
Enter the object information by typing it or by dragging the icon into
the field.
If the Event field is blank, any data in the Object ID field is ignored.
3.
You can further constrain the search for a particular event by specifying
its context ID (interrupt level, process, or idle loop).
Enter the context information by typing it or by dragging the icon of
interest into the field. Or, you can enter the information by selecting the
context label from the vertical axis with the middle mouse button, then
dragging the word “CONTEXT” that appears into the Context ID field.
If the Event field is blank, any data in the Object ID field is ignored, and
the next or previous event of any type is found in the specified context.
If the Event field and the Context ID field are blank, then the next or
previous event of any type in any context is found.
4.
After you have specified the search parameters, click the appropriate
arrow to perform the search.
When the next occurrence of the event is found, the View Graph displays the
time interval in which it occurs and indicates the found occurrence by
placing a vertical line through it. Timing information is displayed in the
Detailed Information field (see “Understanding the View Graph” on
page 31).
89
Command Reference
To search for another occurrence of the event, you can use the Search
window again, or you can use the Search Accelerator icons in the View
Graph. For information on these icons, see “Search Accelerator Icons” on
page 87.
Target Command
This command is located in the Windows menu. When invoked, it displays
the Target window, as shown in Figure 5-17, which lets you do the following:
•
Specify the target system that is to receive RPC requests (the target can
be the system executing the WindView program). The name of the
target system can be found with the uname -n command.
•
Examine (and change, if appropriate) the event port number that
WindView was successful in obtaining on invocation; the default is
6164.
•
Select the processor ID (the processor number where you will be
collecting data).
•
Start and pause event data collection.
•
Disconnect from the target system when you have completed event
collection (or alternately, to clear the View Graph window upon the
next data collection/display).
Figure 5-17 Target Window
90
Target Command
The successfully negotiated event port number is displayed in the Event
Data Port field; in the figure above, WindView was successful in getting port
6164. If this is not the appropriate port number, you can change it with this
window at any time.
To use this window, follow these steps:
1.
Type the target system’s name in the Target Name field (this is the same
as the hostname).
If you used the -target flag to the windview command, that target name
will be displayed in the Target Name field. If nothing is displayed, you
must specify the target’s name before using the Start and Stop buttons
in this window.
2.
If the event port number is appropriate for your use, skip to step 5.
3.
If the event port number is not appropriate, type the minimum port
number you would like to use in the Event Data Port field. The valid
range is 5001 to 32767. For example, if you would like to use any port
number above 5050, type 5050.
4.
Press the <Return> key. WindView attempts to obtain a new event data
port number, using your input into the Event Data Port field as its
minimum. That is, if you type 5050, then 5050 is the lowest event data
port WindView will attempt to own.
When WindView has obtained a port number, the number it was
successful in obtaining is displayed in the Event Data Port field.
5.
Type the processor number in the processor ID field. For example, to
collect data on processor 3, type 3 in the Processor ID field.
6.
Start the logging of events on the target by clicking the Start button. If
you have not already done so, start the target application. Event data
will begin to appear in the View Graph if it is displayed; see “New
Graph Command” on page 81.
7.
At any time, you can disconnect WindView from that event port by
clicking the Disconnect button.
8.
Stop event logging at any time by clicking the Stop button. You are now
ready to analyze the event data; see Chapter 3, “Working with Event
Data.”
91
Command Reference
9.
You can choose another event logging mode and click Start to start
event logging; note that a new mode does not take effect until you have
stopped the logging of the previous one.
Note: If you stop event data collection and then click Start again, the event
data displayed in the View Graph is overwritten by the new event data. You
can save the previous event data to a processed event log with the “Save”
command; see “Save Command” on page 85.
Tcl Evaluation Command
This command is located in the Windows menu. When it is invoked, it
displays the Tcl Evaluation window, as shown in Figure 5-18.
Figure 5-18 Tcl Evaluation Window
This window can be used to submit commands directly to the Tcl interpreter
running in the WindView session. For example, you can use this window to
read in Tcl files that you have created while WindView is running, or to
debug Tcl scripts.
To use this window, type the Tcl command or commands in the window.
Press <Return> to start a new text line, for example, if you are typing a
multi-command string.
To send a command to the Tcl interpreter, hold the <Ctrl> key and press
<Return>.
92
Tcl: Event Inspector Command
For example, to find out which version of Tcl is integrated into your
WindView executable, type the following into the Tcl Evaluation window:
info tclversion
<Ctrl-Return>
The following information is printed in the window after your command
line:
7.0
To read in a new file of Tcl commands, type the following:
source filename <Ctrl-Return>
This allows you to re-read a particular Tcl initialization file after WindView
is running. For example, to re-read your personal Tcl initialization file, type
the following:
source /my_home/.windview.tcl <Ctrl-Return>
Tcl: Event Inspector Command
This command is located in the Windows menu. When it is invoked, it
displays the Event Inspector window, as shown in Figure 5-19.
Figure 5-19 Event Inspector Window
93
Command Reference
To use this window:
1.
Click an event icon in an event log with the middle mouse button.
2.
Drag the event icon to the Event Inspector window. The cursor changes
to the shape of the event icon, letting you see what is being dragged.
3.
“Drop” the icon into the Event Inspector. Information about that event
appears.
(For details on what type of information is logged for an event at each
mode, see Chapter 4, “Event Dictionary.”)
4.
When you drag a new icon into the window, it overwrites the previous
event’s information. You can also move the cursor into the window and
type the letter C to clear the Event Inspector.
Time Units Menu Icon
This icon is located in the icon bar of the View Graph, which is displayed
with the “New Graph” command in the Windows menu.
Figure 5-20 Time Units Menu Icon
If you click and hold the left mouse button over this menu icon, you can
choose the unit of time displayed in the Timeline and the Detailed Time
Information field (see “Understanding the View Graph” on page 31 for
information on these locations). The choices are:
94
sec
seconds (the default)
msec
milliseconds
usec
microseconds
nsec
nanoseconds
View Control Window Icon
View Control Window Icon
This icon is located in the icon bar of the View Graph, which is displayed
with the “New Graph” command in the Windows menu.
Figure 5-21 View Control Window Icon
When you click this icon, the View Control window is displayed, as shown
in Figure 5-22. This window contains commands that let you change how
the event log is displayed.
Figure 5-22 View Control Window
95
Command Reference
To use this window, follow these steps:
1.
The Track Incoming Data toggle button controls how the View Graph is
updated in relation to the importing of an event log. (This only affects
data that is being imported as the target is running; see “Importing
Event Data” on page 16. Event data imported with the “Analyze” and
“Open” commands is brought into the View Graph all at once.)
If the Track Incoming Data button is toggled on (the default), the View
Graph displays the event data in real time as it arrives. In this mode,
you cannot work with the event data until collection is stopped.
If the button is toggled off, the View Graph is “frozen”: only the
horizontal scrollbar is adjusted to show that more data has arrived. This
mode allows you to examine something of interest while the event log
continues to be imported. For example, you can examine a particular
time interval, save it with the Push icon, then turn Track Incoming Data
back on. When you find another time interval of interest, you can turn
Track Incoming Data off again, then toggle between the two intervals
with the Exchange icon.
2.
In the From and To fields, you can specify which time interval, in units
of seconds or event sequence numbers, you would like to examine.
For example, type 1 in the From field and 2.5 in the To field, and then
click the Go To button to view the interval from second 1 to second 2.5.
Use whole numbers to specify the range of event sequence numbers
you want displayed; for example, from 0 to 25, or from 1500 to 2000.
3.
The Left and Right Arrow buttons act like the Pan Left and Pan Right
icons on the View Graph (see “Pan Left/Pan Right Icons” on page 84),
but are constrained by the Preserve (%) field.
For example, if Preserve is set to 50, the arrows move the view forward
or back one-half page at a time (where a page is the width of the current
time interval). However, if Preserve is set to 90, they move forward and
back just 10% of the current time interval at a time. If Preserve is set to
0, they act the same as the icons on the View Graph; if Preserve is 100,
these arrows are disabled.
4.
96
The Zoom In and Zoom Out buttons act like the zoom icons on the View
Graph (see “Zoom In/Zoom Out Icons” on page 97), but are
constrained by the Factor field.
Zoom In/Zoom Out Icons
For example, if Factor is set to 10, this Zoom In displays 1⁄10 of the current
time interval and this Zoom Out displays 10 times the current time
interval. If Factor is set to 2, they act the same as the zoom icons on the
View Graph (Zoom In displays 1⁄2 the current time interval; Zoom Out
displays 2 times the current interval). However, if Factor is set to less
than 1, the actions of these zoom buttons are reversed.
5.
Clicking on the Display Events button causes the Display Events/States
window to appear; see “Display Events Command” on page 78.
Zoom In/Zoom Out Icons
These icons are located in the icon bar of the View Graph, which is displayed
with the “New Graph” command in the Windows menu.
Figure 5-23 Zoom In/Zoom Out Icons
The capital Z (Zoom In) icon lets you focus on details; the lowercase z (Zoom
Out) icon lets you focus on a bigger picture.
Zoom In halves the time interval displayed, preserving the screen’s
midpoint. If a sub-interval is selected, the boundaries of the sub-interval
become the time interval’s boundaries. For information on selecting a
sub-interval, see “Selecting Data” on page 38.
Zoom Out doubles the current time interval (or a selected sub-interval),
preserving the midpoint, if possible.
97
Chapter 6
6.
X Resources and Tcl Configuration Commands
This chapter describes the X Resources that are used to customize your
WindView environment and the Tcl configuration commands. The sections
in this chapter are:
•
“Customizing X Resources”
•
“Customizing Tcl Files”
Customizing X Resources
This section contains the following topics:
•
“Customizing Your X Defaults”
•
“Customizing WindView’s Appearance”
•
“Creating Icons for User Events”
•
“WindView Window Management Policy”
•
“Application-Specific Resources”
•
“Widget Resources”
Customizing Your X Defaults
The WindView site-wide application resource file, WindView, is located in the
directory /usr/WindView/resource/app-defaults. This file contains the
WindView default X Window System configuration information, and must
be present for WindView to run.
The WindView-color (for color monitors) and WindView-grayscale (for
grayscale monitors) application resource files are also located in this
99
X Resources and Tcl Configuration Commands
directory. Follow the instructions in the WindView release notes to use one
of these files instead of the default file, WindView.
You can customize your WindView environment by editing your personal
.Xdefaults file. However, if defaults have been loaded to the X server by the
xrdb command, changes to your ~/.Xdefaults will not take effect until you
have merged them with the server defaults. To see if defaults have been
loaded to the server, enter:
xrdb -query
If nothing is returned, there are no defaults in the X server and changes to
~/.Xdefaults will be visible the next time WindView is started. If text is
returned, enter the following to merge your changes to the X server’s set of
defaults:
xrdb -merge ~/.Xdefaults
Then restart WindView.
Customizing WindView’s Appearance
The following examples show some of the customizations to WindView you
can make in your ~/.Xdefaults file:
•
To change the color of the executing state’s stipple to yellow, add the
following line:
WindView*ViewGraph.executingColor: yellow
The other state colors can be changed by referring to the appropriate
resources, such as supendedColor and readyColor.
•
To change the color of user-defined event #7 to red, add the following
line:
WindView.user7Color: red
Note: User-defined icon resources do not follow the same naming
convention as other event icon resources. That is, do not use
WindView*ViewGraph.user7Color: gray.
•
100
To change the default size of a View Graph to 800 x 800 pixels, add the
following line:
Customizing X Resources
WindView*View.width: 800
WindView*View.height: 800
•
To change the directory that appears by default in the Selection field of
the Analyze Event Log window to /my/logfile/dir, add the following line:
WindView*analyzeSelectionBox.directory: /my/logfile/dir
To make the similar changes to the Open Event File and Save Event File
windows, use the openSelectionBox and saveSelectionBox
resources.
•
To change the background color of the context labels on the vertical axis
of the View Graph to green, add the following line:
WindView*View*ctxLabels*XmPushButton.background: green
To make a similar change to the color of the text in the context labels,
use the WindView*View*ctxLabels*XmPushButton.foreground
resource.
•
To use a smaller font in the context labels and reduce the distance
between them, use the following two defaults:
WindView*ctxLabels*fontList: \
-adobe-courier-bold-r-normal--10-*-*-*-*-*-iso8859-1
WindView*ctxLabels.spacing: 0
Creating Icons for User Events
Figure 6-1
Number
User Icon and Event
By default, the rtmon_log_user_tstamp() function generates the defaultUser
icon preceded by the event number (see Figure 6-1). However, you can create
your own icon to be displayed for each event number.
To create the icon, use the X11 bitmap editor. The following shows the syntax
of the bitmap command:1
bitmap [ -options ...] filename widthxheight
1
For more information on the bitmap command, and for information on using the bitmap editor, see the bitmap
reference page.
101
X Resources and Tcl Configuration Commands
For use with WindView, filename must be of the form userNumber, for
example, user10.
For example, the following command line invokes the bitmap editor to create
the user99 file, with a width of 20 pixels and a height of 20 pixels:
bitmap user99 20x20
A file like the following is created:
#define filename_width 20
#define filename_height 20
static char filename_bits[] = {
0x91,0x04,0xca,0x06,0x84,
0x04,0x8a,0x04,0x91,0x04
};
For examples of user event files, see the files in the directory
wv/src/demo/dine/bitmaps/WindView/events/userDefined.
Now you can connect your icons to user events. First, in your .cshrc, set the
WV_USER_ICONS environment variable to the location of your new icons.2
For example:
setenv WV_USER_ICONS
~wv/resource/bitmaps/WindView/userDefined
Run the source command on your .cshrc.
Now, whenever you call the rtmon_log_user_tstamp() function, the user event
icon with the corresponding event number is displayed. For example, if you
call rtmon_log_user_tstamp(99, NULL, 0), the icon described by the file user99
(if present) is displayed.
WindView Window Management Policy
In the WindView default configuration, if you are using the Motif Window
Manager, View Graph auxiliary windows (such as the View Control window
2
102
If you do not set this environment variable, the icons in vw/resource/bitmaps/WindView/userDefined are used.
Customizing X Resources
and the Legend window) are iconified when the View Graph is iconified.
These auxiliary windows cannot be iconified separately, and they cannot be
stacked underneath the View Graph to which they belong.
You can override this behavior by adding the following line to your
~/.Xdefaults file:
WindView.independentDialogs: 1
This allows View Graph auxiliary windows to be iconified separately from
the View Graph, and to be stacked in any order.
Application-Specific Resources
For every windview command-line argument, there is an equivalent X
resource you can set in your ~/.Xdefaults file. These resources are known as
application-specific resources, and are summarized in Table 6-1.
Table 6-1 WindView Application-Specific Resources
Argument
X Resource Name
Example Value
-emc
eventMemCacheSize
WindView.eventMemCacheSize: 4
-id
independentDialogs
WindView.independentDialogs: 1
-it
initialTimeInterval
WindView.initialTimeInterval: 2
-nx
localTclInit
WindView.localTclInit: 0
-port
defaultTargetPort
WindView.defaultTargetPort: 6200
-target
targetHostName
WindView.targetHostName: mytarget
-usrbuf
maxUserEventBufSize
WindView.maxUserEventBufSize:
1024
-x
extraTclInit
WindView.extraTclInit: \
/home/myMacros.tcl
-xi
immediateTclExpr
WindView.immediateTclExpr: \
viewCreate
103
X Resources and Tcl Configuration Commands
Widget Resources
The following list contains the hierarchical order of the widgets in the
WindView GUI. For each widget, the instance name is given followed by the
class name in square brackets. (If the widget is a popup, this is indicated by
“>” immediately preceding its name). For more information, see the Open
Software Foundation’s OSF/Motif Programmer’s Reference, Revision 1.2.
windview [ApplicationShell]
mainWindow [XmMainWindow]
Separator1 [XmSeparatorGadget]
Separator2 [XmSeparatorGadget]
Separator3 [XmSeparatorGadget]
mainMenuBar [XmRowColumn]
fileMenuButton [XmCascadeButton]
windowsMenuButton [XmCascadeButton]
helpMenuButton [XmCascadeButton]
>menuShell [XmMenuShell]
fileMenuPulldown [XmRowColumn]
openButton [XmPushButton]
saveButton [XmPushButton]
analyzeButton [XmPushButton]
quitButton [XmPushButton]
>menuShell1 [XmMenuShell]
windowsPulldown [XmRowColumn]
newGraphButton [XmPushButton]
targetControlButton [XmPushButton]
tclEvaluationButton [XmPushButton]
Tcl: Event Inspector [XmPushButton]
>menuShell2 [XmMenuShell]
helpPulldown [XmRowColumn]
helpContentsButton [XmPushButton]
helpContextButton [XmPushButton]
separator7 [XmSeparator]
aboutButton [XmPushButton]
messagesSW [XmScrolledWindow]
HorScrollBar [XmScrollBar]
VertScrollBar [XmScrollBar]
messagesText [XmText]
>fileSaveDialog [XmDialogShell]
saveSelectionBox [XmFileSelectionBox]
Items [XmLabelGadget]
ItemsListSW [XmScrolledWindow]
VertScrollBar [XmScrollBar]
104
Customizing X Resources
HorScrollBar [XmScrollBar]
ItemsList [XmList]
Selection [XmLabelGadget]
Text [XmTextField]
Separator [XmSeparatorGadget]
OK [XmPushButtonGadget]
Apply [XmPushButtonGadget]
Cancel [XmPushButtonGadget]
Help [XmPushButtonGadget]
FilterLabel [XmLabelGadget]
Dir [XmLabelGadget]
FilterText [XmTextField]
DirListSW [XmScrolledWindow]
VertScrollBar [XmScrollBar]
HorScrollBar [XmScrollBar]
DirList [XmList]
>fileOpenDialog [XmDialogShell]
openSelectionBox [XmFileSelectionBox]
Items [XmLabelGadget]
ItemsListSW [XmScrolledWindow]
VertScrollBar [XmScrollBar]
HorScrollBar [XmScrollBar]
ItemsList [XmList]
Selection [XmLabelGadget]
Text [XmTextField]
Separator [XmSeparatorGadget]
OK [XmPushButtonGadget]
Apply [XmPushButtonGadget]
Cancel [XmPushButtonGadget]
Help [XmPushButtonGadget]
FilterLabel [XmLabelGadget]
Dir [XmLabelGadget]
FilterText [XmTextField]
DirListSW [XmScrolledWindow]
VertScrollBar [XmScrollBar]
HorScrollBar [XmScrollBar]
DirList [XmList]
>tclEvalDialog [XmDialogShell]
tclEvalForm [XmForm]
tclEntry [TclEntry]
tclEntryText [XmText]
>aboutDialog [XmDialogShell]
aboutMessageBox [XmMessageBox]
Symbol [XmLabelGadget]
Message [XmLabelGadget]
105
X Resources and Tcl Configuration Commands
Separator [XmSeparatorGadget]
OK [XmPushButtonGadget]
Cancel [XmPushButtonGadget]
Help [XmPushButtonGadget]
>fileAnalyzeDialog [XmDialogShell]
analyzeSelectionBox [XmFileSelectionBox]
Items [XmLabelGadget]
ItemsListSW [XmScrolledWindow]
VertScrollBar [XmScrollBar]
HorScrollBar [XmScrollBar]
ItemsList [XmList]
Selection [XmLabelGadget]
Text [XmTextField]
Separator [XmSeparatorGadget]
OK [XmPushButtonGadget]
Apply [XmPushButtonGadget]
Cancel [XmPushButtonGadget]
Help [XmPushButtonGadget]
FilterLabel [XmLabelGadget]
Dir [XmLabelGadget]
FilterText [XmTextField]
DirListSW [XmScrolledWindow]
VertScrollBar [XmScrollBar]
HorScrollBar [XmScrollBar]
DirList [XmList]
>targetDialog [XmDialogShell]
targetForm [XmForm]
targetHostnameLabel [XmLabel]
targetHostnameField [XmTextField]
disconnectButton [XmPushButton]
eventDataPortField [XmTextField]
eventDataPortLabel [XmLabel]
separator5 [XmSeparator]
label [XmLabel]
loggingModeLabel [XmLabel]
rowColumn [XmRowColumn]
startCollectionButton [XmPushButton]
stopCollectionButton [XmPushButton]
separator6 [XmSeparator]
rowColumn1 [XmRowColumn]
cseButton [XmToggleButton]
tsteButton [XmToggleButton]
oseButton [XmToggleButton]
>View 1 [TopLevelShell]
View 1 [View]
106
Customizing X Resources
board [XmBulletinBoard]
toolBar [XmRowColumn]
timeUnitSelect [XmRowColumn]
OptionLabel [XmLabelGadget]
OptionButton [XmCascadeButtonGadget]
seqLabel [XmLabel]
viewBtn [XmPushButton]
sep1 [XmSeparator]
zoomIn [XmPushButton]
zoomOut [XmPushButton]
panLeft [XmPushButton]
panRight [XmPushButton]
sep2 [XmSeparator]
viewPush [XmPushButton]
viewPop [XmPushButton]
viewXchg [XmPushButton]
sep3 [XmSeparator]
viewSearch [XmPushButton]
viewSearchLCtx [XmPushButton]
viewSearchL [XmPushButton]
viewSearchR [XmPushButton]
viewSearchRCtx [XmPushButton]
sep4 [XmSeparator]
legendBtn [XmPushButton]
>popup_timeUnitSelect [XmMenuShell]
timeUnitSelect [XmRowColumn]
button_0 [XmPushButtonGadget]
button_1 [XmPushButtonGadget]
button_2 [XmPushButtonGadget]
button_3 [XmPushButtonGadget]
axis [Axis]
ctxLabelSwin [XmScrolledWindow]
ScrolledWindowClipWindow [XmDrawingArea]
ctxLabels [XmRowColumn]
VertScrollBar [XmScrollBar]
HorScrollBar [XmScrollBar]
viewGraph [ViewGraph]
hsbar [XmScrollBar]
infoField [XmTextField]
>legendDialog [XmDialogShell]
legendForm [XmForm]
legend [Legend]
legendSwin [XmScrolledWindow]
ScrolledWindowClipWindow [XmDrawingArea]
rowcol [XmRowColumn]
107
X Resources and Tcl Configuration Commands
pairForm [XmForm]
defaultUser [XmLabel]
defaultUser [XmLabel]
pairForm [XmForm]
unknown [XmLabel]
unknown [XmLabel]
pairForm [XmForm]
exception [XmLabel]
exception [XmLabel]
pairForm [XmForm]
intExit [XmLabel]
intExit [XmLabel]
pairForm [XmForm]
intEnt [XmLabel]
intEnt [XmLabel]
pairForm [XmForm]
tick:timeslice [XmLabel]
tick:timeslice [XmLabel]
pairForm [XmForm]
tick:watchdog [XmLabel]
tick:watchdog [XmLabel]
pairForm [XmForm]
tick:undelay [XmLabel]
tick:undelay [XmLabel]
pairForm [XmForm]
tick:timeout [XmLabel]
tick:timeout [XmLabel]
pairForm [XmForm]
taskSpawn [XmLabel]
taskSpawn [XmLabel]
pairForm [XmForm]
taskDelete [XmLabel]
taskDelete [XmLabel]
pairForm [XmForm]
taskDelay [XmLabel]
taskDelay [XmLabel]
pairForm [XmForm]
taskPrioritySet [XmLabel]
taskPrioritySet [XmLabel]
pairForm [XmForm]
taskSuspend [XmLabel]
taskSuspend [XmLabel]
pairForm [XmForm]
taskResume [XmLabel]
taskResume [XmLabel]
108
Customizing X Resources
pairForm [XmForm]
taskSafe [XmLabel]
taskSafe [XmLabel]
pairForm [XmForm]
taskUnsafe [XmLabel]
taskUnsafe [XmLabel]
pairForm [XmForm]
semBCreate [XmLabel]
semBCreate [XmLabel]
pairForm [XmForm]
semCCreate [XmLabel]
semCCreate [XmLabel]
pairForm [XmForm]
semDelete [XmLabel]
semDelete [XmLabel]
pairForm [XmForm]
semFlush [XmLabel]
semFlush [XmLabel]
pairForm [XmForm]
semGive [XmLabel]
semGive [XmLabel]
pairForm [XmForm]
semMCreate [XmLabel]
semMCreate [XmLabel]
pairForm [XmForm]
semMGiveForce [XmLabel]
semMGiveForce [XmLabel]
pairForm [XmForm]
semTake [XmLabel]
semTake [XmLabel]
pairForm [XmForm]
wdCreate [XmLabel]
wdCreate [XmLabel]
pairForm [XmForm]
wdDelete [XmLabel]
wdDelete [XmLabel]
pairForm [XmForm]
wdStart [XmLabel]
wdStart [XmLabel]
pairForm [XmForm]
wdCancel [XmLabel]
wdCancel [XmLabel]
pairForm [XmForm]
msgQCreate [XmLabel]
msgQCreate [XmLabel]
109
X Resources and Tcl Configuration Commands
pairForm [XmForm]
msgQDelete [XmLabel]
msgQDelete [XmLabel]
pairForm [XmForm]
msgQReceive [XmLabel]
msgQReceive [XmLabel]
pairForm [XmForm]
msgQSend [XmLabel]
msgQSend [XmLabel]
pairForm [XmForm]
signal [XmLabel]
signal [XmLabel]
pairForm [XmForm]
sigsuspend [XmLabel]
sigsuspend [XmLabel]
pairForm [XmForm]
pause [XmLabel]
pause [XmLabel]
pairForm [XmForm]
kill [XmLabel]
kill [XmLabel]
pairForm [XmForm]
safePend [XmLabel]
safePend [XmLabel]
pairForm [XmForm]
sigwrapper [XmLabel]
sigwrapper [XmLabel]
pairForm [XmForm]
suspended [XmDrawingArea]
suspended [XmLabel]
pairForm [XmForm]
delayed [XmDrawingArea]
delayed [XmLabel]
pairForm [XmForm]
pended [XmDrawingArea]
pended [XmLabel]
pairForm [XmForm]
ready [XmDrawingArea]
ready [XmLabel]
pairForm [XmForm]
executing [XmDrawingArea]
executing [XmLabel]
pairForm [XmForm]
locked [XmDrawingArea]
locked
110
Customizing Tcl Files
Customizing Tcl Files
Tcl, the Tool command language, is integrated into WindView. You can use
it to customize some aspects of WindView behavior.
The following excerpt is from John K. Ousterhout’s article, “Tcl: An
Embeddable Command Language”:
Tcl is an interpreter for a tool command language. It consists of a library package
that is embedded in tools (such as editors, debuggers, etc.) as the basic command
interpreter. Tcl provides (a) a parser for a simple textual command language, (b) a
collection of built-in utility commands, and (c) a C interface that tools use to
augment the built-in commands with tool-specific commands.
Note: If the WindView default Tcl environment meets your needs, you need
not follow the customization instructions in this section.
This section contains the following topics:
•
“Customizing WindView Tcl Initialization Files”
•
“Customizing the Event Inspector Window for User Events”
•
“Using the Tcl Evaluation Window”
•
“WindView Extensions to Tcl”
For more Tcl reference information, see “Tcl Reference Page” in the file
tclman.ps and “Tcl: An Embeddable Command Language” in tclgd.ps. After
installation, these files are contained in the directory /usr/WindView/docs.
Customizing WindView Tcl Initialization Files
The WindView site-wide Tcl initialization file, WindView.tcl, is located in the
directory vw/resource/tcl. This file contains the WindView default Tcl
configuration information, and must be present for WindView to run.
111
X Resources and Tcl Configuration Commands
When the windview program is invoked (see “Starting WindView” on
page 13), the WindView.tcl file is read automatically. Then the following
initialization files are read, if they exist. These are the files that you can create
to customize WindView’s behavior:
~/.windview.tcl Your personal WindView Tcl initialization file.
./.windview.tcl The current directory’s WindView Tcl initialization file.
filename
Any additional Tcl initialization file specified with the -x
flag to the windview program.
Note: Tcl initialization files are read automatically only at WindView
startup.
For example, you might want to create a ~/.windview.tcl file to customize the
way WindView displays its windows when you invoke it. The following are
examples of customizations you can make in the personal, current
directories, or additional Tcl initialization files (the commands are discussed
in detail in “WindView Extensions to Tcl” on page 116):
•
To cause a View Graph to be displayed each time you run WindView,
include the following line in a Tcl initialization file:
set view [viewCreate]
This creates a View Graph window and assigns the ID of that window
to the Tcl variable view.
•
Change the size and position of the newly created View Graph by
including this line:
viewPosition $view 10 10 800 400
This command places the View Graph with ID view so that its upper
left-hand corner is at coordinates (10, 10) and its size is 800 pixels wide
by 400 pixels tall. (The view variable is returned by the viewCreate
command used in step 1.)
•
Open a processed event log by including this line:
eventFileOpen filename.wv
Or, open a raw event log by including this line:
eventFileAnalyze filename.wvr
112
Customizing Tcl Files
•
Control the time interval displayed with either of the commands used
above by including this line:
viewIntervalSet $view 1.00 1.50
This command adjusts the View Graph created in step 1 so that it
displays the event data from 1.00 seconds to 1.50 seconds of the sample.
If you are using sequential event display, specify the time interval in
whole numbers. For example, specify from event 0 to event 25, or from
event 1000 to event 1500.
Customizing the Event Inspector Window for User Events
You can generate user events with the rtmon_log_user_tstamp() function. You
can customize the Event Inspector window so that it displays these
qualifiers in a format that is appropriate for your needs.
The rtmon_log_user_tstamp() function call permits up to five integer
qualifiers to be logged when the event occurs.
The following is an example program that shows how the
rtmon_log_user_tstamp() function might be used to pass qualifiers to the
WindView Event Inspector.
#include
#include
#include
#include
<stdio.h>
<stdlib.h>
<sys/rtmon.h>
<sys/sysmp.h>
/* a sample program that alternates between processors 1, 2,
and 3 and logs a user timestamp every TIC */
main()
{
int proc;
int count;
proc = 1;
count = 0;
/* start off running on processor 1 */
sysmp(MP_MUSTRUN, proc);
113
X Resources and Tcl Configuration Commands
while (1) {
/* pause for a CLK_TCK */
sginap(1);
/* log a user timestamp:
we will use the processor as the identifier of the
event we log, as the man page indicates, this will
appear in the event stream as X where X is 1,
2, and 3 in turn. For demonstration purposes, we’ll
log two event qualifiers, 17 and 11 and indicate
that by setting numb_quals to be 2 */
rtmon_log_user_tstamp(proc, 2, 17, 11, 0, 0, 0);
/* move to a different processor every 100 events we
log */
count++;
if ((count % 100) == 0) {
proc++;
if (proc == 3) proc = 1;
sysmp(MP_MUSTRUN, proc);
}
}
}
To see the data that was posted with the event, you must write a Tcl
procedure that unpacks and displays the buffer. This Tcl procedure can be
placed in one of the additional Tcl initialization files described in
“Customizing WindView Tcl Initialization Files” on page 111. The following
is an example Tcl procedure for the event just described:
proc usrEvent1Format {event} {
usrUnpack $event {
{“qualifier1” int}
{“qualifier2” int}
}
}
proc usrEvent2Format {event} {
usrUnpack $event {
{“qualifier1” int}
{“qualifier2” int}
}
}
proc usrEvent3Format {event} {
usrUnpack $event {
114
Customizing Tcl Files
{“qualifier1” int}
{“qualifier2” int}
}
}
To use the new procedure, you must either restart WindView so that it reads
the appropriate Tcl initialization file, or give the source command to the Tcl
Evaluation window (described in “Using the Tcl Evaluation Window” on
page 115).
Using the Tcl Evaluation Window
The Tcl Evaluation window (displayed with the “Tcl Evaluation” command
in the Windows menu; see Figure 6-2) can be used to submit commands
directly to the Tcl interpreter running in the WindView session. For example,
you can use this window to read in Tcl files that you have created while
WindView is running, or to debug Tcl scripts.
Figure 6-2
Tcl Evaluation Window
To use this window, type the Tcl command or commands in the window.
Press <Return> to start a new text line, for example, if you are typing a
multi-command string.
To send a command to the Tcl interpreter, hold the <Ctrl> key and press
<Return>.
115
X Resources and Tcl Configuration Commands
For example, to find out which version of Tcl is integrated into your
WindView executable, type the following into the Tcl Evaluation window:
info tclversion
<Ctrl-Return>
The following information is printed in the window after your command
line:
7.0
To read in a new file of Tcl commands, type the following:
source filename <Ctrl-Return>
This allows you to reread a particular Tcl initialization file after WindView is
running. For example, to reread your personal Tcl initialization file, type the
following:
source /my_home/.windview.tcl <Ctrl-Return>
For more information on the Tcl commands, see “WindView Extensions to
Tcl” on page 116, “Tcl Man Page,” and “Tcl: An Embeddable Command
Language.”
WindView Extensions to Tcl
This section describes the WindView extensions to Tcl. You can use these in
Tcl scripts to automate your work. For examples, see “Customizing
WindView Tcl Initialization Files” on page 111.
In this section, the following conventions are used:
delayedEval time expr
Evaluates the specified Tcl expression expr in the specified
number of milliseconds time in the future. This can be used
to schedule target event collections. The timing facility used
is that provided by the X client library, and the delay time
should be considered approximate. In particular, if the
WindView application is busy when the timeout expires, it
runs the next time the application is idle.
This command does not return a value.
116
Customizing Tcl Files
eventFileAnalyze filename.wvr
Opens the raw event log filename.wvr, in the same way that
the File menu’s “Analyze” command does.
This command does not return a value.
The following is an example of this command:
eventFileAnalyze /home/logs/myLog.wvr
eventFileOpen filename.wv
Opens the processed event log filename.wv, in the same way
that the File menu’s “Open” command does.
This command does not return a value.
The following is an example of this command:
eventFileOpen/home/logs/myProcLog.wv
messagePut messages...
Puts messages in the WindView Main window’s message
area. You can use this command to show the status of Tcl
scripts while you are debugging them. Newlines are not
added automatically, so if they are to appear in the message,
include them in the messages arguments.
This command does not return a value.
The following is an example of this command:
messagePut "Home Tcl file read.\n"
swapTargetInt int
Returns the supplied 4-byte integer in byte-swapped,
hexadecimal format if the currently attached event log was
created by a target whose byte order is opposite that of the
host running WindView.
This command returns the (possibly swapped) int
argument.
117
X Resources and Tcl Configuration Commands
swapTargetShort short
Returns the supplied 2-byte integer in byte-swapped,
hexadecimal format if the currently attached event log was
created by a target whose byte order is opposite that of the
host running WindView.
This command returns the (possibly swapped) short
argument.
118
Glossary
application code
Application code is any user-supplied code operating under IRIX.
collecting event data
See event collection.
context
See context switch, current context, process context.
context switch
A context switch is an operation performed by a multitasking operating
system in which the current thread of execution is switched for another.
Examples of this are one process preempting another, a process delaying
itself or pending on a resource (making the processor available for another
thread of execution), or a process being interrupted by an ISR. See also
current context, process context.
WindView logging mode
This WindView event logging mode shows the current context and where it
is switched. The current context is shown as a solid horizontal line. When a
context switch occurs, a dotted vertical line connects the previous context’s
line to the current context’s line.
CPU starvation
CPU starvation refers to a process that is “starving” for CPU time. In other
words, the process never gets to run, because it is never scheduled by the
IRIX scheduler.
119
Glossary
current context
In real-time systems, the term “current context” usually
refers to the currently executing process and information
needed to restore the process’s state, such as the state of the
processor registers, operating system control information,
and the stack. For WindView, the meaning has been
extended to include ISRs and the kernel’s idle loop. (See
process context.)
deadlock
Two or more processes are in deadlock when they are
keeping each other from running, for example, when taskA
is pending on a semaphore waiting to be unblocked by
taskB, but taskB is pending on another semaphore waiting to
be unblocked by taskA. This is a common bug in real-time
systems, easily diagnosed with WindView.
event
In WindView, an event is any action undertaken by a
process or an ISR that can affect the state of the real-time
system. Examples of events are process spawns and
deletions, timer expirations, and interrupts. IRIX has been
instrumented to log this event information. See also event
logging, WindView logging mode, instrumented code,
user-generated events.
event buffer
The event buffer is an area of memory in IRIX that
temporarily holds the event data before it is processed by
WindView, when you are using the GUI to collect event
data.
event data
This is information that is logged to the WindView event
buffer.
event data collection
This is the process of starting event logging under IRIX, and
then capturing the event data to the event buffer.
120
event icon
Various icons are displayed in the View Graph that correspond to events. For
information on what each event icon represents, see the Legend window. To
learn specific information on a particular instance of an icon, use the Event
Inspector window.
Event Inspector window
The Event Inspector window displays information about the event: its name,
its timestamp, the context in which it occurred, and any other event
information that has been logged. Use the middle mouse button to select any
event icon in the View Graph and drag it into the Event Inspector window
to display this information.
event log
An event log is a finite collection of event data that resides in shared
memory. See also processed event log, raw event log.
event logging
This is the target activity of writing information about events to the
WindView event buffer as the events occur. You start event logging with
rtmon_client or with the Start button in the WindView Target window.
event port number
This is the host port over which the WindView GUI listens for connections
from the target; specifically, where WindView listens for event data. The
default event port number is 6164.
exception
An exception is an error in program code or data, such as an illegal
instruction, a bus error, or a divide-by-zero error.
executing state
A process or other context is in the executing state if it has control of the
processor. For a process to be in the executing state, there must be no
interrupts to service. ISRs are in the executing state after their interrupt has
been acknowledged by the kernel; if there is more than one ISR to service,
the one at the processor’s highest interrupt level executes. The idle loop is in
the executing state when there are no processes to run and no ISRs to service.
See also current context, process state, process state transition.
121
Glossary
execution thread
See thread of execution.
GUI
Graphical user interface: the portion of WindView running on the system or
X terminal with which you view event data.
idle loop
When there are no processes ready to execute and no interrupts to service,
the kernel enters its idle loop. In this “state,” the kernel services interrupts
and continually checks to see if a process is ready to run. Analyzing the
amount of time your application is idle can help you fine-tune the
application: too much time in the idle loop may mean the application is not
using the processor efficiently; too little time may mean that the application
is interrupted too often to run effectively.
instrumented code
Instrumented code is software that has been modified to provide
information about its own operation. In the case of IRIX, this information is
event data that contains a record of the significant moments in the flow of
control within the operating system. Application code can be instrumented
with the rtmon_log_user_tstamp() routine; see user-generated events.
interrupt
An interrupt is a signal from hardware that lets the processor know that
something has occurred in the external world. For example, the processor
may receive an interrupt when a clock tick occurs or when a character is
received on a serial port. See also Interrupt Service Routine (ISR).
interrupt handler
See Interrupt Service Routine (ISR).
interrupt latency
Interrupt latency is the amount of time during which the processor’s ability
to respond to interrupts is inhibited. Both the hardware and software
architecture contribute to interrupt latency. Hardware influences on
interrupt latency include such things as prioritizing interrupt requests and
preventing interrupt handling until the completion of lengthy instructions.
122
Software influences stem from mode switches, context switches, and kernel
preemption latencies.
Interrupt Service Routine (ISR)
Also known as an “interrupt handler,” an ISR is a routine that is called when
a particular interrupt occurs. For example, when a character is received on a
serial port, the associated ISR is called to handle that interrupt. (Handling
such an interrupt typically consists of copying the input character to a buffer
and clearing the serial device for the next character.)
ISRs run in a special interrupt-level context, which is separate from any
process’s context.
interprocess communication mechanisms (IPCs)
Interprocess communication mechanisms allow processes to synchronize
and communicate so that they can coordinate their activity. The IRIX
interprocess communication mechanisms include semaphores, message
queues, pipes, sockets, and signals.
intrusion
In WindView, intrusion refers to the amount of overhead added to the target
IRIX system by including instrumented code and starting event logging.
Legend window
This WindView window shows what each event icon and state stipple
represents. It can be displayed with the Legend Window icon on the View
Graph.
non-degrading real-time priority
An IRIX non-degrading priority is not affected by normal priority aging
schemes within the kernel. Priorities between NDPHIMAX and NDPHIMIN
(kernel systune parameters, by default, 30-39) are priorities higher than all
other processes subject to normal scheduling and are therefore referred to as
real-time priorities.
page
In a View Graph, a page is the width of the current time interval; that is, the
portion of the event log currently displayed in the View Graph.
123
Glossary
pended state
A process is in the pended state if it attempted to obtain an object or resource
but the object or resource was not available; for example, if it made a call to
obtain a semaphore, but the semaphore was not available. A process in this
state is also known as a blocked process. See also process state, process state
transition.
preemption
If a process becomes ready to execute and it has a higher priority than the
currently executing process, the “new” process preempts the current
process. That is, the operating system saves the current process’s context and
switches to the context of the higher-priority process. See also process state
transition.
preemptive priority scheduling
In IRIX, each process is assigned a priority, and the kernel ensures that the
processor is allocated to the highest-priority ready process. The scheduling
is preemptive in that if a process of a higher priority than the executing
process becomes ready, the kernel preempts the current process and
switches to the higher-priority process. See also context switch, process state
transition.
priority
The standard IRIX scheduler provides 256 process priority levels, numbered
0 (highest) through 255 (lowest). Processes are assigned a priority when
created; however, while executing, a process may change its priority using
schedctl(2).
process
A process is an independent program in a IRIX application that has its own
job to perform, such as the management of a robot arm. Each process has its
own context, which is the processor environment and system resources the
process “sees” each time it is scheduled to run by the kernel. On a context
switch, a process’s context is saved. Processes can communicate and
synchronize with each other through interprocess communication
mechanisms (IPCs).
124
process composition
A process consists of an address space containing the program text and data,
and a number of process attributes managed by the IRIX kernel. A few
examples of process attributes are: a unique process ID number; machine
register contents, representing the current instruction and stack level as well
as working data; UNIX user and group identities; current working directory
for file searches; and signal-handling status.
processed event log
This is an event log that has been imported into WindView, either directly
from the target or with the “Analyze” command if you are using
rtmon_client to collect event data. You can save processed event logs for
later study with the “Save” command, and then import them again with the
“Open” command. Files that contain processed event logs have the .wv
extension. Files that contain unprocessed, “raw” event logs have the .wvr
extension. See also raw event log.
process state
In IRIX applications, process states include the following: executing, ready,
and suspended.
process state transition
This term refers to the action of a process exiting from one state and entering
into another (this is different from context switch, which refers to a change
in the controlling context within the processor). A process state transition
may or may not result in a context switch, depending on the states of other
processes in the system when the process in question makes its transition
between states.
race condition
When the outcome of a program is erroneously determined by the first of
two or more events (for example, is a particular variable read first, or
updated first?), it is said that a race condition exists. This kind of problem
can often be solved by using mutual exclusion semaphores to synchronize
the process’ use of the resource.
raw event log
This is the format of an event log that has been collected with the
rtmon-client tool. Files that contain raw event logs have the .wvr extension.
125
Glossary
Files that contain processed event logs have the .wv extension. See also
processed event log.
ready state
A process is in the ready state if it is not waiting for any resource other than
the processor; that is, it is placed on the run queue, and has not yet executed.
See also process state, process state transition.
real-time system
This is a general term referring to the “system” formed by the IRIX operating
system, your real-time application, and the hardware. This system must
respond to external events within prescribed time limits.
resource
A system object for which a process may contend with other processes.
Examples of resources are memory pool data structures, message queues,
and semaphores. If the resource is not available, a process contending for
that resource makes a transition to the pended state. See also process state
transition.
running state
See executing state.
scheduling
See preemptive priority scheduling.
semaphore
A semaphore is an IRIX system object that provides mutual exclusion of
shared resources and interprocess synchronization.
signal
IRIX supports UNIX BSD-style signals as well as POSIX-compatible signals
for asynchronous transfer of control within a process, based on hardware or
software exceptions.
The IRIX software signaling facility provides a set of 31 distinct signals. A
process can specify a signal handler routine to take appropriate action when
the associated signal is received. When signal handling is complete, normal
process execution resumes, unless the signal corresponds to an exception.
126
socket
A socket is a UNIX BSD 4.3-compatible interface for transferring byte
streams between processes, regardless of location in a networked
application.
state
See process state.
state stipple
The state stipples are the horizontal lines on the View Graph that show the
current state of each process in the real-time system. For information on
what each state stipple represents, see the Legend window.
sub-time interval
A sub-time interval is the space between two time instants. Choose the first
time instant with the left mouse button, then choose the second instant in the
same way. Two vertical lines are displayed in the event log, and details about
the sub-interval are displayed in the Detailed Time Information field. It can
be useful to know the amount of time that has occurred between events, or
to select a sub-interval that you zoom in on with the Zoom In icon.
system code
In an IRIX system, this term refers to any code that is not application code. It
includes the IRIX kernel, IRIX system libraries, device drivers, and so on.
system clock
Silicon Graphics systems include a system clock, which continually runs and
emits a periodic interrupt known as a tick. IRIX uses the system clock to
manage process scheduling, process delays, and so on.
target
The target is the system where WindView is collecting events.
Tcl
Tool command language; see the Tcl Guide for information.
thread of execution
The sequence of instructions that a particular process (such as a process or
ISR) executes to carry out its job.
127
Glossary
time instant
A time instant is a single point in time, selected with a click of the left mouse
button in the View Graph. A vertical line appears in the event log, and
details about the time instant are displayed in the Detailed Time Information
field.
time interval
The time interval is the portion of the event log currently displayed in the
View Graph. If timestamping is enabled, the time interval is an amount of
time. If sequential event display is used, the time interval is a number of
events.
time slice
Each process has a guaranteed time slice, which is the amount of time it is
normally allowed to execute without being preempted. By default, the time
slice is 3 ticks, or 30 ms. Often, a typical process will be blocked for I/O
before reaching the end of its time slice.
At the end of a time slice, the kernel chooses which process to run next on
the same processor, based on process priorities. When runnable processes
have the same priority, the kernel runs them in turn.
timestamp
When the instrumented IRIX kernel is run with the accompanying real-time
monitoring daemon, certain logged events are tagged with a high-resolution
timestamp. The events are displayed in the View Graph along a timeline
showing when they occurred based on their timestamps.
transition
See process state transition.
unblocked
A process that is pended (blocked) on a resource is unblocked when the
resource becomes available, its timeout expires, or it is explicitly unblocked.
user-defined event icon
A user-defined event icon is an event icon that has been defined to appear
when a user event occurs; see user-generated events. If you have not created
your own icons, the defaultUser icon appears by default, preceded by the
128
event number. User event numbers are from 1-20000, numbers above 20000
are reserved for kernel events.
user-generated events
When event logging has been started, you can cause WindView to show
application-specific events. This is done by inserting calls to
rtmon_log_user_tstamp into application source code.
user interface
See GUI.
View Graph
This is the WindView window that lets you examine event data logged about
your real-time system. In this window, time is represented on the horizontal
axis, while the current system’s contexts are represented on the vertical axis:
Starting from the top of the screen, the interrupts used in the system are
listed first. The interrupts are followed by the processes, with the process
first recording events listed first, followed by others as they record events.
The last context shown is the processor’s idle loop.
129
Index
Symbols
C
-emc flag, 23
-nx flag, 23
-port flag, 22
-target flag, 23
-x flag, 24
-xi flag, 24
commands
bitmap, 101
Tcl extensions
delayedEval, 116
eventFileAnalyze, 117
eventFileOpen, 117
messagePut, 117
swapTargetInt, 117
swapTargetShort, 118
windview, 13, 22-24, 103
WindView GUI, 73, 85, 97
locating, 74
About WindView, 14, 74
Analyze, 28-30, 75, 77
Analyze All, 77
Contents, 15, 78
Display Events, 78-80
Exchange icon, 34
For Context, 15, 80
Legend Window icon, 35, 80
New Graph, 16, 74, 81
Open, 20-21, 83-84
Pan icons, 34
Pop icon, 34, 85
Push icon, 34, 85
Quit, 14, 16, 85
Save, 19-20, 85-87
Search Accelerator icons, 35, 87
Search Window icon, 35, 88-90
Target, 17, 90-92
Tcl Evaluation, 92, 115
A
About WindView command, 14, 74
Analyze All command, 30, 77
Analyze command, 28, 30, 75-77
architecture
host-side activities, 8
target-side activities, 8
arguments
windview command, specifying to, 22-24
X Window System equivalents, 103
B
bitmap command, 101
131
Index
Tcl: Event Inspector, 93-94
Time Units Menu icon, 94
View Control Window icon, 95-97
Zoom icons, 34, 97
Contents command, 15, 78
Context Switch events, 4
current context, 4
context switches, 1, 4
conventions
typographical, iv
current context, 4
D
defaultUser event, 68
delayedEval Tcl command, 116
Display Events command, 48, 78-80
documentation conventions, v
E
event buffer
overflow, 19
size, specifying, 23
event data, 11
see also event data collection, event data importing
analyzing, 45-49
collecting, 11
displaying, 8
importing, 16
event buffer overflow, 19
saving, 19
selecting, 38-45
event data collection, 11
addresses, specifying, 23
advanced methods, 22
event buffer
132
overflow, 19
specifying size of host, 23
event port number
minimum, specifying, 22
setting, 24
rtmon-client, using, 30
starting, 90-92
stopping, 90-92
target names, specifying, 23
Tcl initialization files, reading, 23-24
WindView GUI, 12, 22
event data importing, 16
event icons, 3, 5, 38, 59
definitions for, 35, 80
user events, creating for, 101-102
Event Inspector window, 3
user events, customizing for, 113-114
using, 45-46, 93-94
event log, 11
event logging, 8, 11
see also Context and Mode Switch events, Process
State Transition events, user events
see also processed event logs, raw event logs
context switches, 4
event buffer overflow, 19
event data, saving, 19
Process State Transitions, 5
setting up for, 17
starting, 18
stopping, 18
timestamping, 8
event port number
examining, 90-92
minimum, specifying, 22
setting, 24
Target command, using, 25-26
eventFileAnalyze Tcl command, 117
eventFileOpen Tcl command, 117
events, 3-7, 11, 59-71
see also individual events
displaying, 48, 78-80
interrupt service routine (ISR), 61-64
process, 67
searching for, 44-45
selecting, 42
signal, 65
sub-time intervals, 40
time instants, 39
time intervals, 38
unknown, 68
user
see also user events
Exchange icon, 34, 85
exiting (WindView), 14, 16, 85
F
File menu, 14
Analyze All Event Log window, displaying, 77
Analyze Event Log window, displaying, 30, 75, 77
event files, saving, 85-87
exiting WindView, 16, 85
processed event logs
creating, 19-20
importing, 20-21
opening, 83-84
For Context command, 15, 80
context-sensitive help, getting, 15, 80
version and copyright information, displaying, 14,
74
I
icon bar (View Graph), 74
Exchange icon, 34, 85
Legend Window icon, 35, 80
Pan icons, 34
Pop icon, 34, 85
Push icon, 34, 85
Search Accelerator icons, 35, 87
Search Window icon, 35, 43, 88
Time Units Menu icon, 94
View Control Window icon, 33, 95, 97
Zoom icons, 34, 97
icons, see event icons, icon bar, and individual View
Graph icon bar icons
idle loop, 36
intEnt event, 61
interrupt events, 79
displaying, 79
interrupt service routines (ISR), 61-64, 79
entrances, 79
exits, 79
interrupt transitions, 79
displaying, 80
intExit event, 64
H
help
product, v
support, v
Help (online facility), 14
Help menu, 14
contents, displaying, 15, 78
K
kill event, 66
L
Legend Window icon, 35, 80
133
Index
M
menus, see File menu, Help menu, Windows menu
messagePut Tcl command, 117
Motif Window Manager
and View Graphs, 102
Push icon, 34, 85
Q
Quit command, 14, 16, 85
N
R
New Graph command, 16, 74, 81
see also View Graphs
nonexecuting states
displaying, 80
raw event logs, 12
and Analyze command, 28-30
opening, 30, 47, 75, 77, 117
and rtmon-client, 28
rtmon-client tool, 12, 19, 30, 75, 77
event data collection, 30
rtmond daemon
starting, 27
O
Open command, 20-21, 83-84
S
P
page, 34, 47, 84, 96
Pan icons, 34
Pop icon, 34, 85
process events, 67
displaying, 79
Process State Transition events, 5
state stipples, 5
timestamping, 5
process states
displaying, 48
processDelete event, 67
processed event logs, 11
creating, 19-22
opening, 19-22, 83-84, 117
saving, 86-87
product support, v
134
Save command, 19-20, 85-87
Search Accelerator icons, 35, 87
Search Window icon, 35, 43, 88-90
using, 44-45, 88
searching, 35
accelerators, using, 35
contexts, 44-45, 88-90
events, 44-45, 87, 88-90
objects, 44-45, 88-90
window, using, 44-45
signal events, 65
displaying, 79
sigwrapper event, 65
state stipples, 5, 37
definitions for, 35, 80
stipples, see state stipples
sub-intervals, see sub-time intervals
sub-time intervals
cancelling, 41
selecting, 40
swapTargetInt Tcl command, 117
swapTargetShort Tcl command, 118
system clock ticks, 79
T
Target command, 17, 90-92
event logging
starting, 18
stopping, 18
event port number, setting, 25-26
target name, finding, 26
targets
disconnecting from, 90-92
names or addresses, specifying, 23
Tcl (Tool command language), 111-118
Event Inspector
see also Event Inspector window
customizing for user events, 113-114
extensions (WindView), 116-118
initialization files, customizing, 111-113
interpreter, submitting commands to, 92, 115
Tcl Evaluation window, using the, 92, 115
and windview command, 23-24
Tcl Evaluation command, 92, 115
Tcl interpreter, 92, 115
Tcl: Event Inspector command, 45, 93-94
see also Event Inspector window
TCP/IP, 8
time instants
cancelling, 41
selecting, 39
time intervals
doubling, 34
exchanging, 34
halving, 34
moving, 34, 47, 84, 96
popping, 34
pushing, 34
selecting, 38
Time Units Menu icon, 94
Timeline
for View Graphs, 38
timestamps, 5
resolution, 8
Tool command language, see Tcl (Tool command
language)
Track Incoming Data button, 19, 47, 96
transition lines
displaying, 80
typographical conventions, iv
U
unknown event, 68
user events, 7, 68
displaying, 80
IDs, displaying, 80
user-defined event icon, 68
V
View Control
events, displaying, 48, 78-80
incoming data, tracking, 47, 96
states, displaying, 48, 78-80
time intervals
constraining viewing of, 47
selecting, 38
specifying, 47
View Control Window icon, 33, 95-97
135
Index
window
displaying, 33, 95-97
using, 46-49
zooming in and out, 48, 96
View Graphs, 1-2, 3, 31-38
see also View Control
displaying, 16, 81
event icons, 3, 38
definitions for, 35, 80
events, displaying, 78-80
Exchange icon, 34, 85
icon bar, 74
see also icon bar and individual icon bar icons
iconifying, 103
idle loop, 36
Legend window, displaying, 35
and Motif, 102
Pan icons, 34
Pop icon, 34, 85
processes in priority order, listing, 36
Push icon, 34, 85
refreshing, 32, 82
scrolling, 37
search accelerators, 35
Search window, displaying, 35
searching, 87, 88-90
state stipples, 37
definitions for, 35, 80
states, displaying, 78-80
time information, displaying detailed, 36
time instants, selecting, 39
time intervals, displaying, 82
time units, specifying, 94
Timeline, 38
timeline, 8
View Control window, displaying, 33, 95, 97
zooming, 34, 97
W
widget hierarchy, 104-118
window management, 102
Windows menu, 14
event data collection, starting and stopping, 90-92
Event Inspector window, using the, 93-94
event logging mode, choosing, 90-92
event logging, setting up for, 17
event port numbers, examining, 90-92
targets, specifying RPC request, 90-92
Tcl interpreter, using the, 92
View Graphs, displaying, 16, 81
WindView
events, 59-71
exiting, 14, 16, 85
Help (online facility), 14
Main window, 13-14
windview command, 13
arguments to, specifying, 22-24, 103
event buffer, specifying size of host, 23
event port numbers, specifying, 22
target names or addresses, specifying, 23
Tcl initialization files, reading, 23, 24
WindView GUI commands, locating, 74
X Window System equivalents, 103
WindView GUI
see also commands, event data collection, event
data importing, File menu, Windows menu,
Help menu
commands, locating, 74
widget hierarchy, 104-118
windview program
see windview command
X
X Window System, 99-118
application-specific resources, 103
136
customizing, 99-103
default configuration, 99
icons for user events, creating, 101-102
widget hierarchy, 104-118
window management, 102
and windview arguments, 103
X11 bitmap editor, 101
Z
Zoom icons, 34, 45, 97
for View Control, 48, 96
View Graphs, using, 34, 97
137
We'd Like to Hear From You
As a user of Silicon Graphics documentation, your comments are important
to us. They help us to better understand your needs and to improve the
quality of our documentation.
Any information that you provide will be useful. Here is a list of suggested
topics to comment on:
•
General impression of the document
•
Omission of material that you expected to find
•
Technical errors
•
Relevance of the material to the job you had to do
•
Quality of the printing and binding
Please include the title and part number of the document you are
commenting on. The part number for this document is
007-2824-001.
Thank you!
Three Ways to Reach Us
GE
NO POSTA
SARY
NECES D
IF MAILE
IN THE
S
D STATE
UNITE
BUSINES
S REPLY
MAIL
Inc.
Graphics, Blvd.
Silicon
Shoreline
2011 N. View, CA 94043
Mountain
The postcard opposite this page has space for your comments. Write your
comments on the postage-paid card for your country, then detach and mail
it. If your country is not listed, either use the international card and apply the
necessary postage or use electronic mail or FAX for your reply.
If electronic mail is available to you, write your comments in an e-mail
message and mail it to either of these addresses:
•
If you are on the Internet, use this address: [email protected]
•
For UUCP mail, use this address through any backbone site:
[your_site]!sgi!techpubs
You can forward your comments (or annotated copies of manual pages) to
Technical Publications at this FAX number:
415 965-0964