Download Quick Introduction - T-Lab

Transcript
T-LAB Plus
2019
Quick Introduction
Tools
for
Text Analysis
Copyright © 2001-2019
T-LAB by Franco Lancia
All rights reserved.
Website: http://www.tlab.it/
E-mail: [email protected]
T-LAB is a registered trademark
The above artwork has been realized for T-LAB
by Claudio Marini (http://www.claudiomarini.it/)
in collaboration with Andrea D’Andrea.
What T-LAB does and what it enables us to do
(Excerpt from the User’s Manual)
T-LAB software is an all-in-one set of linguistic, statistical and graphical tools for text analysis
which can be used in research fields like Content Analysis, Sentiment Analysis, Semantic Analysis,
Thematic Analysis, Text Mining, Perceptual Mapping, Discourse Analysis, Network Text Analysis,
Document Clustering, Text Summarization.
In fact T-LAB tools allow the user to easily manage tasks like the following:
•
•
•
•
•
•
•
•
•
•
•
measure, explore and map the co-occurrence relationships between key-terms;
perform either unsupervised or supervised clustering of textual units and documents, i.e.
perform a bottom-up clustering which highlights emerging themes or a perform top-down
classification which uses a set of predefined categories;
check the lexical units (i.e. words or lemmas), context units (i.e. sentences or paragraphs) and
themes which are typical of specific text subsets (e.g. newspaper articles from specific time
periods, interviews with people belonging to the same category);
apply categories for sentiment analysis;
perform various types of correspondence analysis and cluster analysis;
create semantic maps that represent dynamic aspects of the discourse (i.e. sequential
relationships between words or themes);
represent and explore any text as a network;
customize and apply various types of dictionaries for both lexical and content analysis;
perform concordance searches;
analyse all the corpus or its subsets (e.g. groups of documents) by using various key-term lists;
create, explore and export numerous contingency tables and co-occurrences matrices.
T-LAB Plus 2019 - Quick Introduction - Pag. 2 of 29
The T-LAB user interface is very user-friendly and various types of texts can be analysed:
- a single text (e.g. an interview, a book, etc.);
- a set of texts (e.g. a set of interviews, web pages, newspaper articles, responses to open-ended
questions, Twitter messages, etc.).
All texts can be encoded with categorical variables and/or with IDnumbers that correspond to
context units or cases (e.g. responses to open-ended questions).
In the case of a single document (or a corpus considered as a single text) T-LAB needs no further
work: just select the ‘Import a single file…’ option (see below) and proceed as follows.
T-LAB Plus 2019 - Quick Introduction - Pag. 3 of 29
When, on the other hand, the corpus is made up of various texts and/or categorical variables are
used the Corpus Builder tool (see below) must be used. In fact, such a tool automatically
transforms any textual material and various types of files (i.e. up to ten different formats) into a
corpus file ready to be imported by T-LAB.
T-LAB Plus 2019 - Quick Introduction - Pag. 4 of 29
N.B.: At the moment, in order to ensure the integrated use of various tools, each corpus file
shouldn't exceed 90 Mb (i.e. about 55,000 pages in .txt format). For more information, see the
‘Requirements and Performances’ section of the Help/Manual.
Six steps are that is required to perform a quick check of the software functionalities:
1 – Click on the ‘Select a T-LAB demo File’ option
T-LAB Plus 2019 - Quick Introduction - Pag. 5 of 29
2 - Select any corpus to analyse
3 - Click "ok" in the first Setup window
4 - Select a tool from one of the "Analysis" sub-menus
T-LAB Plus 2019 - Quick Introduction - Pag. 6 of 29
5 - Check the results
T-LAB Plus 2019 - Quick Introduction - Pag. 7 of 29
6 - Use the contextual help function to interpret the various graphs and tables
Let's consider how a typical work project which uses T-LAB can be managed.
Hypothetically, each project consists of a set of analytical activities (operations) which have the
same corpus as their subject and are organized according to the user's strategy and plan. It then
begins gathering the texts to be analysed, and concludes with a report.
The succession of the various phases is illustrated in the following diagram:
T-LAB Plus 2019 - Quick Introduction - Pag. 8 of 29
N.B.:
- The six numbered phases, from the corpus preparation to the interpretation of the outputs, are
supported by T-LAB tools and are always reversible;
- By using T-LAB automatic settings it is possible to avoid two phases (3 and 4); however, in
order to achieve high quality results, their use is, nevertheless, advisable.
Now let’s try to comment on the various steps.
1 - CORPUS PREPARATION: transformation of the texts to be analysed in a file (corpus) that
can be processed by the software.
In the case of a single text (or a corpus considered as a single text) T-LAB needs no further work.
When, on the other hand, the corpus is made up of various texts and/or categorical variables are
used the Corpus Builder tool must be used, which automatically transforms any textual material and
various types of files (i.e. up to eleven different formats) into a corpus file ready to be imported by
T-LAB.
2 - CORPUS IMPORTATION: a series of automatic processes that transform the corpus into a
set of tables integrated in the T-LAB database.
Starting from the selection of the Import a Corpus option, the intervention of the user is required
in order to define certain choices (see below):
During the pre-processing phase, T-LAB carries out the following treatments: Corpus
Normalization; Multi-Word and Stop-Word detection; Elementary Context segmentation;
0Automatic Lemmatization or Stemming; Vocabulary building; Key-Terms selection.
T-LAB Plus 2019 - Quick Introduction - Pag. 9 of 29
Here is the complete list of the thirty (30) languages for which the automatic lemmatization or the
stemming process is supported by T-LAB Plus.
LEMMATIZATION: Catalan, Croatian, English, French, German, Italian, Polish, Portuguese,
Romanian, Russian, Serbian, Slovak , Spanish, Swedish, Ukrainian.
STEMMING: Arabic, Bengali, Bulgarian, Czech, Danish, Dutch, Finnish, Greek, Hindi,
Hungarian, Indonesian, Marathi, Norwegian, Persian, Turkish.
When selecting languages in the setup form, while the six languages (*) for which T-LAB already
supported the automatic lemmatization can be selected trough the button on the left (see 'A' below),
the new one can be selected trough the button on the right (see 'B' below).
(*) English, French, German, Italian, Portuguese and Spanish.
In any case, without automatic lemmatization and / or by using customized dictionaries the user
can analyse texts in all languages, provided that words are separated by spaces and / or punctuation.
N.B.: As the pre-processing options determine both the kind and the number of analysis units (i.e.
context units and lexical units), different choices determine different analysis results. For this
reason, all T-LAB outputs (i.e. charts and tables) shown in the user’s manual and in the on-line help
are just indicative.
3 - THE USE OF LEXICAL TOOLS allows us to verify the correct recognition of the lexical
units and to customize their classification, that is to verify and to modify the automatic choices
made by T-LAB.
T-LAB Plus 2019 - Quick Introduction - Pag. 10 of 29
4 - THE KEY-WORD SELECTION consists of the arrangement of one or more lists of lexical
units (words, lemmas or categories) to be used for producing the data tables to be analysed.
The automatic settings option provides the lists of the key-words selected by T-LAB;
nevertheless, since the choice of the analysis units is extremely relevant in relation to subsequent
elaborations, the use of customized settings (see below) is highly recommended. In this way the
user can choose to modify the list suggested by T-LAB and/or to arrange lists that better correspond
to the objectives of his research.
5 - THE USE OF ANALYSIS TOOLS allows the user to obtain outputs (tables and graphs) that
represent significant relationships between the analysis units and enables the user to make
inferences.
At the moment, T-LAB includes fifteen different analysis tools each of them having its own
specific logic; that is, each one generates specific tables, uses specific algorithms and produces
specific outputs.
Consequently, depending on the structure of texts to be analysed and on the goals to be achieved,
the user has to decide which tools are more appropriate for their analysis strategy every time.
T-LAB Plus 2019 - Quick Introduction - Pag. 11 of 29
N.B.: Besides the distinction between tools for co-occurrence, comparative and thematic analysis,
it can be useful to consider that some of the latter allow us to obtain new corpus subsets which can
be included in further analysis steps.
Even though the various T-LAB tools can be used in any order, there are nevertheless three ideal
starting points in the system which correspond to the three ANALYSIS sub-menus:
A : TOOLS FOR CO-OCCURRENCE ANALYSIS
These tools enable us to analyse different kinds of relationships between lexical units (i.e. words or
lemmas)
According to the types of relationships to be analysed, the T-LAB options indicated in this diagram
use one or more of the following statistical tools: Association Indexes, Chi Square Tests, Cluster
Analysis, Multidimensional Scaling and Markov chains.
Here are some examples (N.B.: for more information on how to interpret the outputs please refer to
the corresponding sections of the help/manual).
T-LAB Plus 2019 - Quick Introduction - Pag. 12 of 29
- Word Associations
This T-LAB tool allows us to check how co-occurrence relationships determine the local meaning
of selected words.
T-LAB Plus 2019 - Quick Introduction - Pag. 13 of 29
- Comparison between Word Pairs
This T-LAB tool allows us to compare sets of elementary contexts (i.e. co-occurrence contexts) in
which the elements of a pair of key-words are present.
T-LAB Plus 2019 - Quick Introduction - Pag. 14 of 29
- Co-Word Analysis and Concept Mapping
This T-LAB tool allows us to find and map co-occurrence relationships between sets of key-words.
- Sequence and Network Analysis
This T-LAB tool, which takes into account the positions of the various lexical units relative to each
other, allows us to represent and explore any text as a network.
That means that the user is allowed to check the relationships between the ‘nodes’ (i.e. the keyterms) of the network at different levels: a) in one-to-one connections; b) in the ‘ego’ networks; c)
within the ‘community’ to which they belong; d) within the entire text network.
ONE-TO-ONE
EGO-NETWORK
T-LAB Plus 2019 - Quick Introduction - Pag. 15 of 29
COMMUNITY
ENTIRE NETWORK
Moreover, by clicking the GRAPH MAKER option, the user is allowed to obtain various types of
graphs by using customized lists of key words (see below).
T-LAB Plus 2019 - Quick Introduction - Pag. 16 of 29
B : TOOLS FOR COMPARATIVE ANALYSIS
These tools enable us to analyse different kinds of relationships between context units (e.g.
documents or corpus subsets)
Specificity Analysis enables us to check which words are typical or exclusive of a specific corpus
subset, either comparing it with the rest of the corpus or with another subset. Moreover it allows us
to extract the typical contexts (i.e. the characteristic elementary contexts) of each analysed subset
(e.g. the ‘typical’ sentences used by any specific political leader).
T-LAB Plus 2019 - Quick Introduction - Pag. 17 of 29
T-LAB Plus 2019 - Quick Introduction - Pag. 18 of 29
Correspondence Analysis allows us to explore similarities and differences between (and within)
groups of context units (e.g. documents belonging to the same category).
T-LAB Plus 2019 - Quick Introduction - Pag. 19 of 29
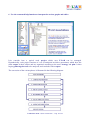
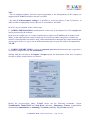
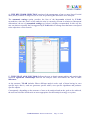
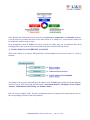
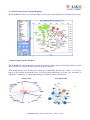
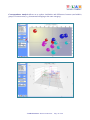
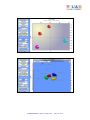
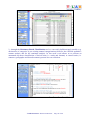
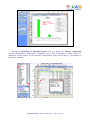
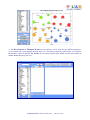
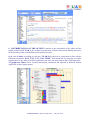
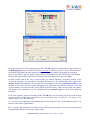
Cluster Analysis, which requires a previous Correspondence Analysis and can be carried out using
various techniques, allows us to detect and explore groups of analysis units which have two
complementary features: high internal (within cluster) homogeneity and high external (between
cluster) heterogeneity.
T-LAB Plus 2019 - Quick Introduction - Pag. 20 of 29
C : TOOLS FOR THEMATIC ANALYSIS
These tools enable us to discover, examine and map “themes” emerging from texts.
As theme is a polysemous word, when using software tools for thematic analysis we have to refer
to operational definitions. More precisely, in these T-LAB tools, “theme” is a label used to indicate
four different entities:
1- a thematic cluster of contexts units characterized by the same patterns of key-words (see the
Thematic Analysis of Elementary Contexts, Thematic Document Classification and DictionaryBased Classification tools);
2- a thematic group of key terms classified as belonging to the same category (see the DictionaryBased Classification tool);
3 – a mixture component of a probabilistic model which represents each context unit (i.e.
elementary context or document) as generated from a fixed number of topics or “themes” (see the
Modeling of Emerging Themes tool).
4- a specific key term used for extracting a set of elementary contexts in which it is associated
with a specific group of words pre-selected by the user (see the Key Contexts of Thematic Words
tool).
For example, depending on the tool we are using, a single document can be analysed as composed
of various ‘themes’ (see ‘A’ below) or as belonging to a set of documents concerning the same
‘theme’ (see ‘B’ below). In fact, in the case of ‘A’ each theme can correspond to a word or to a
sentence, whereas in the case of ‘B’ a theme can be a label assigned to a cluster of documents
characterized by the same patterns of key-words.
In detail, the ways how T-LAB ‘extracts’ themes are the following:
1 - both the Thematic Analysis of Elementary Contexts and the Thematic Document
Classification tools, when performing an unsupervised clustering, work in the following way:
a - perform co-occurrence analysis to identify thematic clusters of context units;
b - perform comparative analysis of the profiles of the various clusters;
c - generate various types of graphs and tables (see below);
d - allow you to save the new variables (thematic clusters) for further analysis.
T-LAB Plus 2019 - Quick Introduction - Pag. 21 of 29
T-LAB Plus 2019 - Quick Introduction - Pag. 22 of 29
2 - through the Dictionary-Based Classification tool we can easily build/test/apply models (e.g.
dictionaries of categories or pre-existing manual categorizations) both for the classical qualitative
content analysis and for the sentiment analysis. In fact such a tool allows us to perform an
automated top-down classification of lexical units (i.e. words and lemmas) or context units (i.e.
sentences, paragraphs and short documents) present in a text collection.
T-LAB Plus 2019 - Quick Introduction - Pag. 23 of 29
3 - through the Modelling of Emerging Themes tool (see below) the mixture components
described through their characteristic vocabulary can be used for building a coding scheme for
qualitative analysis and/or for the automatic classification of the context units (i.e. documents or
elementary contexts).
T-LAB Plus 2019 - Quick Introduction - Pag. 24 of 29
4 - the Key Contexts of Thematic Words tool (see below) can be used for two different purposes:
(a) to extract lists of meaningful context units (i.e. elementary contexts) which allow us to deepen
the thematic value of specific key words; (b) to extract context units which are the most similar to
sample texts chosen by the user.
T-LAB Plus 2019 - Quick Introduction - Pag. 25 of 29
6 - INTERPRETATION OF THE OUTPUTS consists in the consultation of the tables and the
graphs produced by T-LAB, in the eventual customization of their format and in making inferences
on the meaning of the relationships represented by the same.
In the case of tables, according to each case, T-LAB allows the user to export them in files with the
following extensions: .DAT, .TXT, .CSV, .XLS, .HTML. This means that, by using any text editor
program and /or any Microsoft Office application, the user can easily import and re-elaborate them.
All graphs and charts can be zoomed, maximized, customized and exported in different formats
(right click to show popup menu)
T-LAB Plus 2019 - Quick Introduction - Pag. 26 of 29
Some general criteria for the interpretation of the T-LAB outputs are illustrated in a paper quoted in
the Bibliography and are available from the www.tlab.it website (Lancia F.: 2007). This document
presents the hypothesis that the statistical elaboration outputs (tables and graphs) are particular
types of texts, that is they are multi-semiotic objects characterized by the fact that the relationships
between the signs and the symbols are ordered by measures that refer to specific codes.
In other words, both in the case of texts written in "natural language" and those written in the
"statistical language", the possibility of making inferences on the relationships that organize the
content forms is guaranteed by the fact that the relationships between the expression forms are not
random; in fact, in the first case (natural language) the significant units follow on and are ordered in
a linear manner (one after the other in the chain of the discourse), while in the second case (tables
and graphs) the organization of the multidimensional semantic spaces comes from statistical
measures.
Even if the semantic spaces represented in the T-LAB maps are extremely varied, and each of them
require specific interpretative procedures, we can theorize that - in general - the logic of the
inferential process is the following:
A – to detect some significant relationships between the units "present" on the expression plan (e.g.
between table and/or graph labels);
B – to explore and compare the semantic traits of the same units and the contexts to which they are
mentally and culturally associated (content plan);
T-LAB Plus 2019 - Quick Introduction - Pag. 27 of 29
C – to generate some hypothesis or some analysis categories that, in the context defined by the
corpus, give reason for the relationships between expression and content forms.
T-LAB Plus 2019 - Quick Introduction - Pag. 28 of 29
At present, T-LAB Plus options have the following restrictions:
•
•
•
•
•
•
•
•
•
•
•
•
•
•
corpus dimension: max 90Mb, equal to about 55,000 pages in .txt format;
primary documents: max 30,000 (max 99,999 for short texts which do not exceed 2,000
characters each, e.g. responses to open-ended questions, Twitter messages, etc);
categorical variables: max 50, each allowing max 150 subsets (categories) which can be
compared;
modelling of emerging themes: max 5,000 lexical units (*) by 5,000,000 occurrences;
thematic analysis of elementary contexts: max 300,000 rows (context units) by 5,000 columns
(lexical units);
thematic document classification: max 30,000 rows (context units) by 5,000 columns (lexical
units);
specificity analysis (lexical units x categories): max 10,000 rows by 150 columns;
correspondence analysis (lexical units x categories): max 10,000 rows by 150 columns;
correspondence analysis (context units x lexical units): max 10,000 rows by 5,000 columns;
multiple correspondence analysis (elementary contexts x categories): max 150,000 rows by 250
columns;
cluster analysis that uses the results of a previous correspondence analysis: max 10,000 rows
(lexical units or elementary contexts);
word associations, comparison between word pairs: max 5,000 lexical units;
co-word analysis and concept mapping: max 5,000 lexical units;
sequence analysis: max 5,000 lexical units (or categories) by 3,000,000 occurrences.
(*) In T-LAB, ‘lexical units’ are words, multi-words, lemmas and semantic categories. So, when
the automatic lemmatization is applied, 5,000 lexical units correspond to about 12,000 words
(i.e. raw forms).
T-LAB Plus 2019 - Quick Introduction - Pag. 29 of 29