1
3385 Scott Blvd., Santa Clara, CA 95054 Tel: +1/408.727.6600 Fax: +1/408.727.6622
CATC FCTracer and FCTracer 4G™
Fibre Channel Protocol Analyzer
User’s Manual
Manual Version 2.10
For FCTracer Software Version 2.10
20 September, 2004
CATC
FCTracer4G and FCTracer User’s Manual
SW Version 2.10
Document Disclaimer
The information in this document has been carefully checked and is
believed to be reliable. However, no responsibility can be assumed for
inaccuracies that may not have been detected.
CATC reserves the right to revise the information in this document without
notice or penalty.
Trademarks and Servicemarks
CATC, FCTracer 4G, FCTracer, Link Tracker and BusEngine are
trademarks of Computer Access Technology Corporation.
Microsoft, Windows, Windows 98SE, Windows 2000, Windows ME, and
Windows XP are registered trademarks of Microsoft Inc.
All other trademarks are property of their respective companies.
Copyright
Copyright © 2004, Computer Access Technology Corporation (CATC); All
Rights Reserved.
This document may be printed and reproduced without additional
permission, but all copies should contain this copyright notice.
FCC Conformance Statement
This equipment has been tested and found to comply with the limits for a
Class A digital device, pursuant to Part 15 of the FCC Rules. These limits
are designed to provide reasonable protection against harmful interference
when the equipment is operated in a commercial environment. This
equipment generates, uses, and can radiate radio frequency energy and, if
not installed and used in accordance with the instruction manual, may cause
harmful interference to radio communications. Operation of this equipment
in a residential area is likely to cause harmful interference in which case the
user will be required to correct the interference at his own expense. The end
user of this product should be aware that any changes or modifications made
to this equipment without the approval of CATC could result in the product
not meeting the Class A limits, in which case the FCC could void the user's
authority to operate the equipment.
Release Information
This is version 2.10 of the CATC FCTracer and FCTracer 4G™ Fibre
Channel Protocol Analyzer User’s Manual. This manual is based on
FCTracer software version 2.10.
ii
CATC
FCTracer4G and FCTracer User’s Manual
SW Version 2.10
EU Conformance Statement
This equipment complies with the EMC Directive 89/336/EEC and the Low
Voltage Directive 73/23/EEC, and their associated amendments for Class A
Information Technology Equipment. It has been tested and found to comply
with EN55022 and EN55024 (EN61000-4-2, EN61000-4-3, EN61000-4-4,
EN61000-4-5, EN61000-4-6, EN61000-4-11, EN61000-3-2,
EN61000-3-3), and EN605950.
Part number: 730-0045-00
iii
CATC
FCTracer4G and FCTracer User’s Manual
iv
SW Version 2.10
CATC
FCTracer4G and FCTracer User’s Manual
SW Version 2.10
TABLE OF CONTENTS
Chapter 1 Overview . . . . . . . . . . . . . . . . . . . . . . . . . . . . . . . . . . . . . 1
FCTracer 4G and FCTracer Fibre Channel Protocol Analyzers . . . . . . . . . . . . . . 1
The CATC Trace . . . . . . . . . . . . . . . . . . . . . . . . . . . . . . . . . . . . . . . . . . . . . . . . . . 3
Automation. . . . . . . . . . . . . . . . . . . . . . . . . . . . . . . . . . . . . . . . . . . . . . . . . . . . . . . 4
File-Based Decoding . . . . . . . . . . . . . . . . . . . . . . . . . . . . . . . . . . . . . . . . . . . . . . . 5
Specifications . . . . . . . . . . . . . . . . . . . . . . . . . . . . . . . . . . . . . . . . . . . . . . . . . . . . . 6
Package . . . . . . . . . . . . . . . . . . . . . . . . . . . . . . . . . . . . . . . . . . . . . . . . . . 6
Power Requirements . . . . . . . . . . . . . . . . . . . . . . . . . . . . . . . . . . . . . . . . . 6
Environmental Conditions . . . . . . . . . . . . . . . . . . . . . . . . . . . . . . . . . . . . 6
Switches . . . . . . . . . . . . . . . . . . . . . . . . . . . . . . . . . . . . . . . . . . . . . . . . . . 6
Indicators (LEDs) . . . . . . . . . . . . . . . . . . . . . . . . . . . . . . . . . . . . . . . . . . . 6
Probing Characteristics . . . . . . . . . . . . . . . . . . . . . . . . . . . . . . . . . . . . . . . 7
Recording Memory Size . . . . . . . . . . . . . . . . . . . . . . . . . . . . . . . . . . . . . 7
Basic Trigger Events . . . . . . . . . . . . . . . . . . . . . . . . . . . . . . . . . . . . . . . . . 7
Chapter 2 Installation . . . . . . . . . . . . . . . . . . . . . . . . . . . . . . . . . . . 9
System Components/Packing List . . . . . . . . . . . . . . . . . . . . . . . . . . . . . . . . . . . . . 9
Fibre Channel Cabling Requirements . . . . . . . . . . . . . . . . . . . . . . . . . . . . . . . . . . 9
Host PC Requirements . . . . . . . . . . . . . . . . . . . . . . . . . . . . . . . . . . . . . . . . . . . . . . 9
FCTracer Modules . . . . . . . . . . . . . . . . . . . . . . . . . . . . . . . . . . . . . . . . . . . . . . . . . 9
FCTracer 4G Analyzer LED Descriptions . . . . . . . . . . . . . . . . . . . . . . . . . . . . . . 10
Front Panel Description . . . . . . . . . . . . . . . . . . . . . . . . . . . . . . . . . . . . 10
FCTracer Analyzer LED Descriptions . . . . . . . . . . . . . . . . . . . . . . . . . . . . . . . . . 10
Front Panel Description . . . . . . . . . . . . . . . . . . . . . . . . . . . . . . . . . . . . 11
Rear Panel Description. . . . . . . . . . . . . . . . . . . . . . . . . . . . . . . . . . . . . . . . . . . . . 11
Setting Up the Analyzer . . . . . . . . . . . . . . . . . . . . . . . . . . . . . . . . . . . . . . . . . . . . 12
Installing the Analyzer Software . . . . . . . . . . . . . . . . . . . . . . . . . . . . . . . . . . . . . 13
Connecting the Analyzer to the Device Under Test . . . . . . . . . . . . . . . . . . . . . . 15
Connecting the Analyzer. . . . . . . . . . . . . . . . . . . . . . . . . . . . . . . . . . . . . 16
Placing the Analyzer between Multiple Nodes. . . . . . . . . . . . . . . . . . . . 17
Connecting FCTracer to a Hub . . . . . . . . . . . . . . . . . . . . . . . . . . . . . . . . 17
Making a Fibre Channel Recording . . . . . . . . . . . . . . . . . . . . . . . . . . . . . . . . . . . 19
Stopping a Recording . . . . . . . . . . . . . . . . . . . . . . . . . . . . . . . . . . . . . . . 22
External Interface Breakout Board. . . . . . . . . . . . . . . . . . . . . . . . . . . . . . . . . . . . 23
Pin-Outs for the Data In/Out Connector . . . . . . . . . . . . . . . . . . . . . . . . . 23
Prototype Rework Area. . . . . . . . . . . . . . . . . . . . . . . . . . . . . . . . . . . . . . 25
Configuring the Analyzer for the Breakout Board . . . . . . . . . . . . . . . . . 25
Chapter 3 Networking FCTracer 4G . . . . . . . . . . . . . . . . . . . . . . 27
Working with Multiple Analyzers . . . . . . . . . . . . . . . . . . . . . . . . . . . . . . . . . . . . 27
Hardware Setup for Direct USB Connections . . . . . . . . . . . . . . . . . . . . . . . . . . . 28
Setup for Cascaded Multiple Analyzer Use . . . . . . . . . . . . . . . . . . . . . . . . . . . . . 28
Set Up for Remote Access over an IP LAN. . . . . . . . . . . . . . . . . . . . . . . . . . . . . 29
Configuring the Connection . . . . . . . . . . . . . . . . . . . . . . . . . . . . . . . . . . . . . . . . . 29
USB-Connected Analyzers . . . . . . . . . . . . . . . . . . . . . . . . . . . . . . . . . . . 29
iii
CATC
FCTracer4G and FCTracer User’s Manual
SW Version 2.10
Remote Analyzers Over an IP Network . . . . . . . . . . . . . . . . . . . . . . . . . 30
Configuring Cascaded Multiple Analyzers. . . . . . . . . . . . . . . . . . . . . . . 31
Network Chat . . . . . . . . . . . . . . . . . . . . . . . . . . . . . . . . . . . . . . . . . . . . . . . . . . . . 32
Chapter 4 Updates and Licensing . . . . . . . . . . . . . . . . . . . . . . . . . 33
Software, Firmware, and BusEngine Revisions. . . . . . . . . . . . . . . . . . . . . . . . . . 33
Software Updates . . . . . . . . . . . . . . . . . . . . . . . . . . . . . . . . . . . . . . . . . . . . . . . . . 34
License Information . . . . . . . . . . . . . . . . . . . . . . . . . . . . . . . . . . . . . . . . . . . . . . . 34
Updating the Software License . . . . . . . . . . . . . . . . . . . . . . . . . . . . . . . . 34
BusEngine and Firmware Updates. . . . . . . . . . . . . . . . . . . . . . . . . . . . . . . . . . . . 35
Updating the BusEngine . . . . . . . . . . . . . . . . . . . . . . . . . . . . . . . . . . . . . 35
Updating the Firmware . . . . . . . . . . . . . . . . . . . . . . . . . . . . . . . . . . . . . . 35
Automatic Updates . . . . . . . . . . . . . . . . . . . . . . . . . . . . . . . . . . . . . . . . . 35
Manual Updates . . . . . . . . . . . . . . . . . . . . . . . . . . . . . . . . . . . . . . . . . . . 37
Manually Updating the Firmware . . . . . . . . . . . . . . . . . . . . . . . . . . . . . . 39
Chapter 5 Software Overview . . . . . . . . . . . . . . . . . . . . . . . . . . . . 41
Starting the FCTracer Program . . . . . . . . . . . . . . . . . . . . . . . . . . . . . . . . . . . . . . 41
Opening Sample Traces . . . . . . . . . . . . . . . . . . . . . . . . . . . . . . . . . . . . . . . . . . . . 41
Tool Tips. . . . . . . . . . . . . . . . . . . . . . . . . . . . . . . . . . . . . . . . . . . . . . . . . . . . . . . . 41
Trace Tool-Tips . . . . . . . . . . . . . . . . . . . . . . . . . . . . . . . . . . . . . . . . . . . . . . . . . . 42
The Main Display Menus. . . . . . . . . . . . . . . . . . . . . . . . . . . . . . . . . . . . . . . . . . . 42
View Options . . . . . . . . . . . . . . . . . . . . . . . . . . . . . . . . . . . . . . . . . . . . . . . . . . . . 45
Resetting the Toolbar . . . . . . . . . . . . . . . . . . . . . . . . . . . . . . . . . . . . . . . 45
Tool Bar. . . . . . . . . . . . . . . . . . . . . . . . . . . . . . . . . . . . . . . . . . . . . . . . . . 47
Multi-Segment Tool Bar . . . . . . . . . . . . . . . . . . . . . . . . . . . . . . . . . . . . . 48
Status Bar . . . . . . . . . . . . . . . . . . . . . . . . . . . . . . . . . . . . . . . . . . . . . . . . . . . . . . . 48
Recording Progress . . . . . . . . . . . . . . . . . . . . . . . . . . . . . . . . . . . . . . . . . 49
Recording Status . . . . . . . . . . . . . . . . . . . . . . . . . . . . . . . . . . . . . . . . . . . 50
Analyzer Status . . . . . . . . . . . . . . . . . . . . . . . . . . . . . . . . . . . . . . . . . . . . 51
Activity . . . . . . . . . . . . . . . . . . . . . . . . . . . . . . . . . . . . . . . . . . . . . . . . . . 51
Search Status . . . . . . . . . . . . . . . . . . . . . . . . . . . . . . . . . . . . . . . . . . . . . . 51
Status Bar - Spooled Recordings . . . . . . . . . . . . . . . . . . . . . . . . . . . . . . 51
Zoom In. . . . . . . . . . . . . . . . . . . . . . . . . . . . . . . . . . . . . . . . . . . . . . . . . . 51
Zoom Out . . . . . . . . . . . . . . . . . . . . . . . . . . . . . . . . . . . . . . . . . . . . . . . . 51
Analyzer Keyboard Shortcuts . . . . . . . . . . . . . . . . . . . . . . . . . . . . . . . . . . . . . . . 52
Chapter 6 Recording Options . . . . . . . . . . . . . . . . . . . . . . . . . . . . 53
Opening the Recording Options Dialog Box . . . . . . . . . . . . . . . . . . . . . . . . . . . . 53
Recording Options - General . . . . . . . . . . . . . . . . . . . . . . . . . . . . . . . . . . . . . . . . 53
Recording type . . . . . . . . . . . . . . . . . . . . . . . . . . . . . . . . . . . . . . . . . . . . 54
Options . . . . . . . . . . . . . . . . . . . . . . . . . . . . . . . . . . . . . . . . . . . . . . . . . . 55
Recording Scope . . . . . . . . . . . . . . . . . . . . . . . . . . . . . . . . . . . . . . . . . . . . . . . . . 55
Conventional Single Buffer Recording . . . . . . . . . . . . . . . . . . . . . . . . . . . . . . . . 55
Save As Multisegment Trace . . . . . . . . . . . . . . . . . . . . . . . . . . . . . . . . . . . . . . . . 56
File Structure for Segmented Files . . . . . . . . . . . . . . . . . . . . . . . . . . . . . 57
Spooled Recordings . . . . . . . . . . . . . . . . . . . . . . . . . . . . . . . . . . . . . . . . . . . . . . . 58
iv
CATC
FCTracer4G and FCTracer User’s Manual
SW Version 2.10
Recording Options - Miscellaneous . . . . . . . . . . . . . . . . . . . . . . . . . . . . . . . . . . . 60
Rate Control . . . . . . . . . . . . . . . . . . . . . . . . . . . . . . . . . . . . . . . . . . . . . . 61
Channel Presence . . . . . . . . . . . . . . . . . . . . . . . . . . . . . . . . . . . . . . . . . . 61
Primitive Recording Control. . . . . . . . . . . . . . . . . . . . . . . . . . . . . . . . . . 62
Loopback Control . . . . . . . . . . . . . . . . . . . . . . . . . . . . . . . . . . . . . . . . . . 62
Recording Options - Recording Rules . . . . . . . . . . . . . . . . . . . . . . . . . . . . . . . . . 63
Recording Rules Toolbar . . . . . . . . . . . . . . . . . . . . . . . . . . . . . . . . . . . . . . . . . . . 64
Recording Rules Page - How it Works. . . . . . . . . . . . . . . . . . . . . . . . . . . . . . . . . 65
Creating Event Buttons . . . . . . . . . . . . . . . . . . . . . . . . . . . . . . . . . . . . . . 65
Selecting a Channel. . . . . . . . . . . . . . . . . . . . . . . . . . . . . . . . . . . . . . . . . 66
Dragging a Button to the Main Display Area . . . . . . . . . . . . . . . . . . . . . 66
Assigning an Action . . . . . . . . . . . . . . . . . . . . . . . . . . . . . . . . . . . . . . . . 66
Pop-up Menus . . . . . . . . . . . . . . . . . . . . . . . . . . . . . . . . . . . . . . . . . . . . . . . . . . . 67
State Pop-up . . . . . . . . . . . . . . . . . . . . . . . . . . . . . . . . . . . . . . . . . . . . . . 67
Action Pop-up Menu. . . . . . . . . . . . . . . . . . . . . . . . . . . . . . . . . . . . . . . . 67
Event Pop-up Menu . . . . . . . . . . . . . . . . . . . . . . . . . . . . . . . . . . . . . . . . 68
Events . . . . . . . . . . . . . . . . . . . . . . . . . . . . . . . . . . . . . . . . . . . . . . . . . . . . . . . . . . 70
Properties Dialogs . . . . . . . . . . . . . . . . . . . . . . . . . . . . . . . . . . . . . . . . . . . . . . . . 72
Event Properties Dialog . . . . . . . . . . . . . . . . . . . . . . . . . . . . . . . . . . . . . 72
Event Properties Dialog Boxes - Descriptions. . . . . . . . . . . . . . . . . . . . . . . . . . . 75
Data Pattern Properties Dialog . . . . . . . . . . . . . . . . . . . . . . . . . . . . . . . . 76
Primitive Properties Dialog. . . . . . . . . . . . . . . . . . . . . . . . . . . . . . . . . . . 76
Advanced Primitive Properties Dialog . . . . . . . . . . . . . . . . . . . . . . . . . . 76
Error Properties Dialog . . . . . . . . . . . . . . . . . . . . . . . . . . . . . . . . . . . . . . 77
EOF Properties Dialog . . . . . . . . . . . . . . . . . . . . . . . . . . . . . . . . . . . . . . 78
Properties Dialogs - Any Data Frame, Primitive, Connect, Disconnect. 79
XFR_RDY . . . . . . . . . . . . . . . . . . . . . . . . . . . . . . . . . . . . . . . . . . . . . . . 81
Data . . . . . . . . . . . . . . . . . . . . . . . . . . . . . . . . . . . . . . . . . . . . . . . . . . . . . 81
FCP . . . . . . . . . . . . . . . . . . . . . . . . . . . . . . . . . . . . . . . . . . . . . . . . . . . . . 82
Conf. . . . . . . . . . . . . . . . . . . . . . . . . . . . . . . . . . . . . . . . . . . . . . . . . . . . . 82
Extended CDBs. . . . . . . . . . . . . . . . . . . . . . . . . . . . . . . . . . . . . . . . . . . . 82
SCSI Primary Command Set (SPC-3) . . . . . . . . . . . . . . . . . . . . . . . . . . 83
SCSI Block Command Set (SBC-2) . . . . . . . . . . . . . . . . . . . . . . . . . . . . 83
SCSI Media Changer Command set (SMC-2) . . . . . . . . . . . . . . . . . . . . 84
SCSI Stream Command set (SSC-2). . . . . . . . . . . . . . . . . . . . . . . . . . . . 84
SCSI Stream Command set (SSC-2). . . . . . . . . . . . . . . . . . . . . . . . . . . . 85
Assigning Actions . . . . . . . . . . . . . . . . . . . . . . . . . . . . . . . . . . . . . . . . . . . . . . . . 88
Using the Global State Cell . . . . . . . . . . . . . . . . . . . . . . . . . . . . . . . . . . . . . . . . . 89
Filter In and Filter Out . . . . . . . . . . . . . . . . . . . . . . . . . . . . . . . . . . . . . . 90
Filter In or Out Everything . . . . . . . . . . . . . . . . . . . . . . . . . . . . . . . . . . . 90
Counting Events . . . . . . . . . . . . . . . . . . . . . . . . . . . . . . . . . . . . . . . . . . . 92
Creating Event Sequences . . . . . . . . . . . . . . . . . . . . . . . . . . . . . . . . . . . . . . . . . . 93
Using Sequence Cells . . . . . . . . . . . . . . . . . . . . . . . . . . . . . . . . . . . . . . 93
FCTracer Supports Up to Two Sequences . . . . . . . . . . . . . . . . . . . . . . . 94
How to Create an Event Sequence . . . . . . . . . . . . . . . . . . . . . . . . . . . . . 94
Using a Timer . . . . . . . . . . . . . . . . . . . . . . . . . . . . . . . . . . . . . . . . . . . . . 97
Recording Options - Channels . . . . . . . . . . . . . . . . . . . . . . . . . . . . . . . . . . . . . . . 99
v
CATC
FCTracer4G and FCTracer User’s Manual
SW Version 2.10
Where Custom Channel Names Appear . . . . . . . . . . . . . . . . . . . . . . . . . 99
Chapter 7 Display Options & Application
Preferences . . . . . . . . . . . . . . . . . . . . . . . . . . . . . . . . . 101
Setting Display Options . . . . . . . . . . . . . . . . . . . . . . . . . . . . . . . . . . . . . . . . . . . 101
General Display Options . . . . . . . . . . . . . . . . . . . . . . . . . . . . . . . . . . . . . . . . . . 102
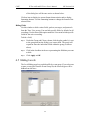
Saving and Loading Display Options . . . . . . . . . . . . . . . . . . . . . . . . . . . . . . . . 103
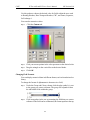
Color/Format/Hiding Display Options. . . . . . . . . . . . . . . . . . . . . . . . . . . . . . . . 103
Setting Field Colors . . . . . . . . . . . . . . . . . . . . . . . . . . . . . . . . . . . . . . . 104
Changing Field Formats . . . . . . . . . . . . . . . . . . . . . . . . . . . . . . . . . . . . 106
Hiding Fields. . . . . . . . . . . . . . . . . . . . . . . . . . . . . . . . . . . . . . . . . . . . . 107
Hiding Levels . . . . . . . . . . . . . . . . . . . . . . . . . . . . . . . . . . . . . . . . . . . . . . . . . . . 107
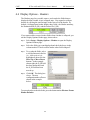
Display Options - Headers . . . . . . . . . . . . . . . . . . . . . . . . . . . . . . . . . . . . . . . . . 108
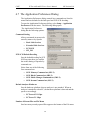
The Application Preferences Dialog . . . . . . . . . . . . . . . . . . . . . . . . . . . . . . . . . 109
Command Sorting . . . . . . . . . . . . . . . . . . . . . . . . . . . . . . . . . . . . . . . . . 109
FCP SCSI Default Decoding . . . . . . . . . . . . . . . . . . . . . . . . . . . . . . . . 109
Default Analyzer Hardware . . . . . . . . . . . . . . . . . . . . . . . . . . . . . . . . . 109
Number of Recent Files on File Menu . . . . . . . . . . . . . . . . . . . . . . . . . 109
Setting Channel Names . . . . . . . . . . . . . . . . . . . . . . . . . . . . . . . . . . . . . . . . . . . 110
Chapter 8 Navigating a CATC Trace . . . . . . . . . . . . . . . . . . . . . 111
Trace View Features. . . . . . . . . . . . . . . . . . . . . . . . . . . . . . . . . . . . . . . . . . . . . . 111
Expanding & Collapsing Traffic . . . . . . . . . . . . . . . . . . . . . . . . . . . . . . . . . . . . 111
Expanded and Collapsed Field Formats. . . . . . . . . . . . . . . . . . . . . . . . . . . . . . . 112
Pop-up Shortcut Menus . . . . . . . . . . . . . . . . . . . . . . . . . . . . . . . . . . . . . . . . . . . 112
Right Mouse Button . . . . . . . . . . . . . . . . . . . . . . . . . . . . . . . . . . . . . . . 113
Left Mouse Button . . . . . . . . . . . . . . . . . . . . . . . . . . . . . . . . . . . . . . . . 113
Tool Tips. . . . . . . . . . . . . . . . . . . . . . . . . . . . . . . . . . . . . . . . . . . . . . . . . . . . . . . 114
Navigating with Trace Navigator . . . . . . . . . . . . . . . . . . . . . . . . . . . . . . . . . . . . 114
Scaling. . . . . . . . . . . . . . . . . . . . . . . . . . . . . . . . . . . . . . . . . . . . . . . . . . 114
Layout . . . . . . . . . . . . . . . . . . . . . . . . . . . . . . . . . . . . . . . . . . . . . . . . . . 115
Pop-up Menu. . . . . . . . . . . . . . . . . . . . . . . . . . . . . . . . . . . . . . . . . . . . . 115
Positioning . . . . . . . . . . . . . . . . . . . . . . . . . . . . . . . . . . . . . . . . . . . . . . 115
Edit or Clear Marker . . . . . . . . . . . . . . . . . . . . . . . . . . . . . . . . . . . . . . . . . . . . . 116
Edit Comment . . . . . . . . . . . . . . . . . . . . . . . . . . . . . . . . . . . . . . . . . . . . . . . . . . 118
Chapter 9 Decoding Traffic . . . . . . . . . . . . . . . . . . . . . . . . . . . . . 119
Decoding and Displaying Traffic . . . . . . . . . . . . . . . . . . . . . . . . . . . . . . . . . . . . 119
Decoding Via the Toolbar . . . . . . . . . . . . . . . . . . . . . . . . . . . . . . . . . . . 119
Decoding Via the Display Options Dialog Box . . . . . . . . . . . . . . . . . . 119
Viewing Details about FCP and SCSI Fields . . . . . . . . . . . . . . . . . . . . . . . . . . 120
Viewing FCP-SCSI Fields . . . . . . . . . . . . . . . . . . . . . . . . . . . . . . . . . . 121
Displaying Raw 10b Codes . . . . . . . . . . . . . . . . . . . . . . . . . . . . . . . . . . . . . . . . 123
Chapter 10 Searching and Exporting . . . . . . . . . . . . . . . . . . . . . 125
Quick Search . . . . . . . . . . . . . . . . . . . . . . . . . . . . . . . . . . . . . . . . . . . . . . . . . . . 125
Search Menu. . . . . . . . . . . . . . . . . . . . . . . . . . . . . . . . . . . . . . . . . . . . . . . . . . . . 125
vi
CATC
FCTracer4G and FCTracer User’s Manual
SW Version 2.10
Go to Trigger. . . . . . . . . . . . . . . . . . . . . . . . . . . . . . . . . . . . . . . . . . . . . 125
Go to Packet . . . . . . . . . . . . . . . . . . . . . . . . . . . . . . . . . . . . . . . . . . . . . 126
Go to Marker. . . . . . . . . . . . . . . . . . . . . . . . . . . . . . . . . . . . . . . . . . . . . 126
Go to . . . . . . . . . . . . . . . . . . . . . . . . . . . . . . . . . . . . . . . . . . . . . . . . . . . 127
Find . . . . . . . . . . . . . . . . . . . . . . . . . . . . . . . . . . . . . . . . . . . . . . . . . . . . 127
Find Next . . . . . . . . . . . . . . . . . . . . . . . . . . . . . . . . . . . . . . . . . . . . . . . 129
Exporting Frames and Data . . . . . . . . . . . . . . . . . . . . . . . . . . . . . . . . . . . . . . . . 129
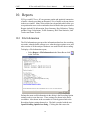
Chapter 11 Reports . . . . . . . . . . . . . . . . . . . . . . . . . . . . . . . . . . . 131
File Information . . . . . . . . . . . . . . . . . . . . . . . . . . . . . . . . . . . . . . . . . . . . . . . . . 131
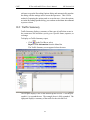
Traffic Summary . . . . . . . . . . . . . . . . . . . . . . . . . . . . . . . . . . . . . . . . . . . . . . . . 132
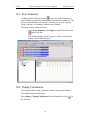
Error Summary. . . . . . . . . . . . . . . . . . . . . . . . . . . . . . . . . . . . . . . . . . . . . . . . . . 133
Timing Calculations . . . . . . . . . . . . . . . . . . . . . . . . . . . . . . . . . . . . . . . . . . . . . . 133
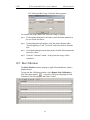
Bus Utilization . . . . . . . . . . . . . . . . . . . . . . . . . . . . . . . . . . . . . . . . . . . . . . . . . . 134
Excluding/Including Traffic from Graphs . . . . . . . . . . . . . . . . . . . . . . 138
Real Time Statistics . . . . . . . . . . . . . . . . . . . . . . . . . . . . . . . . . . . . . . . . . . . . . . 138
Exporting Frames and Data . . . . . . . . . . . . . . . . . . . . . . . . . . . . . . . . . . . . . . . . 140
Link Tracker Window . . . . . . . . . . . . . . . . . . . . . . . . . . . . . . . . . . . . . . . . . . . . 141
Frame Tracker Window . . . . . . . . . . . . . . . . . . . . . . . . . . . . . . . . . . . . . . . . . . . 146
Chapter 12 Verification Scripts. . . . . . . . . . . . . . . . . . . . . . . . . . 149
Window Layout. . . . . . . . . . . . . . . . . . . . . . . . . . . . . . . . . . . . . . . . . . . . . . . . . 149
Script Menu area . . . . . . . . . . . . . . . . . . . . . . . . . . . . . . . . . . . . . . . . . . 149
Script Description Area. . . . . . . . . . . . . . . . . . . . . . . . . . . . . . . . . . . . . 151
Output window . . . . . . . . . . . . . . . . . . . . . . . . . . . . . . . . . . . . . . . . . . . 151
Additional Resources . . . . . . . . . . . . . . . . . . . . . . . . . . . . . . . . . . . . . . . . . . . . . 151
Chapter 13 How to Contact CATC. . . . . . . . . . . . . . . . . . . . . . . 153
vii
CATC
FCTracer4G and FCTracer User’s Manual
viii
SW Version 2.10
CATC
FCTracer4G and FCTracer User’s Manual
SW Version 2.10
1. Overview
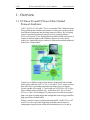
1.1 FCTracer 4G and FCTracer Fibre Channel
Protocol Analyzers
CATC's FCTracer™ 4G and FCTracer are portable Fibre Channel test and
debug platforms that combines non-intrusive, multi-port recording with the
most advanced triggering and decoding features available. By leveraging
years of experience in protocol analysis tools for emerging markets,
FCTracer 4G and FCTracer blend sophisticated functionality with practical
features to allow designers and validation engineers to easily specify
multi-level, conditional trigger scenarios to pinpoint intermittent problems
in the Fibre Channel fabric.
System level validation requires non-intrusive monitoring from multiple
probe points within the SAN. FCTracer 4G and FCTracer ensure accurate
data collection by providing transparent taps using active port bypass
circuits capable of recording 1, 2 and, in the case of FCTracer 4G, 4 Gbps
Fibre Channel traffic at full line rate. At the heart of FCTracer4G and
FCTracer is the CATC BusEngine™ protocol processor that incorporates
both a real-time recording engine and configurable tools to trigger and filter
high-speed Fibre Channel traffic.
Effective analysis requires isolating important traffic. Both FCTracer 4G
and FCTracer have powerful triggering capabilities that include two
independent sequencers that can track two unrelated series of events in
1
CATC
FCTracer4G and FCTracer User’s Manual
SW Version 2.10
parallel. The presence of two independent sequencers is like having two
analyzers in one - each sequencer can separately monitor up to 256 levels of
trigger logic with up to six "events" per level. FCTracer 4G and
FCTracer dynamically allocates memory resources up to a maximum of 2
GB across all four recorded channels. Users can selectively exclude any
channel from the recording to boost memory depth for the remaining
channels.
System level debug frequently requires tools to capture intermittent
problems. FCTracer 4G and FCTracer have a Long Term (Spooled)
Recording mode; enabling capture of data for days to better analyze
problems. FCTracer 4G and FCTracer also supports remote operation over
a LAN and unattended control of the analyzer with an Automation API.
FCTracer 4G and FCTracer include a Traffic Summary utility that provides
statistics on the occurrence of errors, primitives, frames, sequences, and
exchanges. Users can evaluate these metrics at a glance or use them to
navigate through the trace.
FCTracer 4G also features graphical bus utilization and throughput reports
that provide a histogram of activity dynamically linked to frame level
details. Real-time monitoring continuously displays metrics for each port
providing a high level view of network performance. Ideal for system-level
test and debug, FCTracer 4G tracks throughput and recovered errors for
end-to-end Fibre Channel analysis.
For complete product information, please visit www.catc.com.
The Fibre Channel specification is available from the Fibre Channel TA at
its web site http://www.fibrechannel.org/
FEATURES
BENEFITS
2 Parallel Event Sequencers with 256
States, each with Independent Trigger &
Filter Criteria
Isolate intermittent problems by tracking two completely independent event sequences in parallel
FCTracer 4G: 1, 2 & 4 Gbps FC Ports
FCTracer: 1 or 2 Gbps ports
Monitor, trigger and record multiple Fibre Channel
ports simultaneously
Link Tracker™ Trace Display
Chronologically display all DWORDs on all channels synchronized to a common clock
Frame Tracker™
Chronologically displays all FRAMES on all channels synchronized to a common clock
2
CATC
FCTracer4G and FCTracer User’s Manual
SW Version 2.10
Hardware Filtering
Extend capture window by removing non-essential
primitives or truncating data payloads from the
trace
Performance Statistics
Quickly identify and track error rates, abnormal
bus or timing conditions
Long Term (Spooled) Recording
Enable capture of intermittent problems for which
trigger conditions are difficult to predict
Verification Script Engine
Allows users to create programs to perform customized analysis on captured traces
Cascade Multiple Analyzers
By cascading up to 4 analyzers, time correlated
traces for up to 16 channels can be obtained
Remote Access over LAN
One or more FCTracers can be controlled over the
network
Traffic Summary Reports
Statistical summaries provide high level view of
events, sequences, exchanges, errors & throughput
Collapsible / Expandable Headers
Increased drill-down on Exchanges, Sequences, or
individual Frames
Real-time Performance Monitoring &
Statistics
Easily identify throughput problems and anomalies
Dynamically Allocated Memory Pool
(2 GB) captures long time-windows for analysis
and problem solving
1.2 The CATC Trace
While other products display the stream of frames in difficult-to-understand
text format, the CATC Trace expert software system matches a strong
decoding engine with an easy to use graphical user interface that removes
complexity and aids the user to understand information quickly. The CATC
Trace displays each Primitive, Data Frame, or decoded Sequence on a
separate row and logically groups all sequences that are part of a common
exchange. FC-2 and FC-4 level events are decoded and any protocol errors
are automatically marked in red. This view groups and displays SCSI
operations (FCP mapping) with easy "drill down" to sequence and frame
level detail. Context sensitive ToolTips help explain the specification and
provide ease-of-use and understanding for Fibre Channel development
teams.
3
CATC
FCTracer4G and FCTracer User’s Manual
SW Version 2.10
The additional Link Tracker display allows users to see DWORD level bus
traffic in a table view. This simplifies analysis of state transitions by
displaying the Fibre Channel traffic, moving across all channels,
synchronized to a common reference clock. Link Tracker may be used
independently or time synchronized with the CATC Trace display.
FCTracer’s combination of the CATC Trace display, which logically
arranges bus traffic, and Link Tracker, which provides a chronological
representation, is a unique and powerful tool.
For additional information on the CATC Trace, please download the White
Paper from the CATC website:
http://www.catc.com/support/whitepapers/index.html.
1.3 Automation
The FCTracer software includes an Application Program Interface (API)
that will allow you to develop test programs and scripts in C++ and Visual
Basic. The API reproduces most of the commands embodied in the
FCTracer trace viewer software. This API allows users to automate
procedures that otherwise have to be run manually via the trace viewer
software. The Automation API can be run locally on the PC attached to
FCTracer or remotely over a network connection.
For further details, refer to the Automation API for CATC FCTracer
Reference Manual included in the installation CD-ROM. You can also
download the document from the CATC website.
4
CATC
FCTracer4G and FCTracer User’s Manual
SW Version 2.10
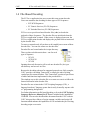
1.4 File-Based Decoding
The FCTracer application lets users create their own custom decodes.
Users can customize the decoding for three types of FC Sequences:
• FCP SCSI Sequences
• FC Generic Services (FC-GS) Sequences
• FC Switched Services (FC-SW) Sequences.
FCTracer uses special text-based decoder files (.dec) to decode the
payloads of these Sequences. The decoder files are initialized when the
FCTracer application is started. When a trace is displayed onscreen, the
FCTracer application decodes and displays the payload fields as instructed
by the decoder files.
To create a custom decode, all you have to do is modify one or more of these
decoder files. You can also create new decoder files.
Decoder files are located under the /scripts directory.
There are three sub-directories there - one for each
type of Sequence:
• /FC-GS
• /FCP-SCSI
• /FC-SW
Opening these sub-directories will reveal one decoder file (.dec) per
sub-directory and several .inc files.
Because the decoding schemas for supported protocols are fairly complex,
CATC provides a decoding "framework" to simply the task of writing
vendor-specific custom decoders. This "framework" consists of special sets
of tables and functions implemented in the provided files.
The simplest way to edit a decoder file or to create new one is to follow the
framework format in the decoder files.
Decoder files are written in the CATC Scripting Language (CSL), a
language based on C language syntax that is easily learned by anyone with
a C programming background.
For further information on file-based decoding, refer to the CATC Scripting
Language Reference Manual for FCTracer included in the installation
CD-ROM. You can also download the document from the CATC website.
CATC also provides a library of script constant, variables and script API
functions which enhance the capabilities of CSL and make the job of writing
decoding scripts even easier.
5
CATC
FCTracer4G and FCTracer User’s Manual
SW Version 2.10
For further information on CATC script API, refer to the file:
"CATCScriptAPI.inc" in \script\shared directory.
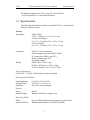
1.5 Specifications
The following specifications describe a combined FCTracer and Universal
Protocol Analyzer System.
Package
Dimensions:
UPAS 10,000:
12.2 x 3.5 inches (31.1 x 31.1 x 8.9 cm)
FCTracer 4G Plug-in:
9.3 x 6.7 x 1.3 inches (23.6 x 17.0 x 3.2 cm)
FCTracer Plug-in:
4.5 x 6.7 x 1.3 inches (11.3 x 17.0 x 3.2 cm)
Connectors:
UPAS AC power connection
External trigger connection (DB-25, BNC)
PC connection (USB2.0, type "B")
Break-out board (type "D")
Recording Channel
UPAS 10K: 9.5 lbs (4.3 kg)
FCTracer 4G Plug-in: 1.8 lbs (.82 kg)
FCTracer Plug-in: 1 lb 11.4 oz (0.77 kg)
Weight:
Power Requirements
90-254 VAC, 47-63 Hz, 165W maximum (universal input)
Environmental Conditions
Operating Range:
Storage Range:
Humidity:
0 to 40 °C (32 to 104 °F)
-20 to 80 °C (-4 to 176 °F)
10 to 90%, non-condensing
Switches
Power:
Manual Trigger:
On/off
When pressed forces a trigger event
Indicators (LEDs)
UPAS:
Status (STATUS):
Power (PWR): Illuminated when analyzer is powered on
Illuminated during Power-On Self Test (POST)
6
CATC
FCTracer4G and FCTracer User’s Manual
SW Version 2.10
Recording (REC):
Illuminated when the analyzer is actively recording traffic
data
Triggered (TRG):
Illuminated when the analyzer has a trigger condition
Uploading (UPLD): Illuminated when the analyzer is uploading its recording
memory to the Host PC for displaying the CATC trace and
during the memory-testing step of the POST
FCTracer Plug-in:
Link activity status
Probing Characteristics
FCTracer 4G
Connection:
4 Gbps SFP for 4 Gbps traffic
Stacked SFP modules may be used for 2 Gbps or 1 Gbps
traffic
Interchangeable with multimode or single mode optical fibre or copper
components
FCTracer
Connection:
Standard SFP Modules
Interchangeable with multimode or single mode optical fibre or copper
components
Recording Memory Size
2 GBytes for trace capture, timing, and control information.
Basic Trigger Events
Conditions:
Errors:
Primitives, Data Frames, Disconnect or Connect of the
Link, Frame Header, SOF Primitive, EOF Primitive, Basic
Link Services, SCSI Operations
Invalid 10b codes, CRC Errors, Running Disparity Errors,
EOF Abort, K28.5 Comma Alignment Errors, Missing
IDLE Primitives
7
CATC
FCTracer4G and FCTracer User’s Manual
8
SW Version 2.10
CATC
FCTracer4G and FCTracer User’s Manual
SW Version 2.10
2. Installation
FCTracer 4G and FCTracer are factory-installed hardware modules that are
sold as part of the Universal Protocol Analyzer System 10000 (UPAS
10000).
The UPAS 10000, the FCTracer module, and associated software are easily
installed. You can begin making Fibre Channel recordings after following
the steps shown below.
Note
Henceforth, both FCTracer 4G and FCTracer will be referred to
as FCTracer.
2.1 System Components/Packing List
•
•
•
•
•
•
•
Factory-installed FCTracer Analyzer module(s)
One USB cable
FCTracer software program CD-ROM
Breakout Board
DB-25 Cable
User Manual
BNC Cable
2.2 Fibre Channel Cabling Requirements
You will need to provide fibre channel cables and SFPs.
2.3 Host PC Requirements
FCTracer connects to a Host PC over a USB line that supports USB 2.0.
Please consult the readme file on the installation CD for the latest PC
requirements.
2.4 FCTracer Modules
Users can order FCTracer in three configurations:
•
•
•
Two channel (with FCTracer module installed in left-slot)
Four channel (same as above but with additional channels enabled
through software license)
Eight channel (two four-channel FCTracer modules installed)
9
CATC
FCTracer4G and FCTracer User’s Manual
SW Version 2.10
2.5 FCTracer 4G Analyzer LED Descriptions
When powered on, the FCTracer 4G activates the user-accessible controls
and LEDs on the front and rear panels of the UPAS.
Warning Do not open the UPAS enclosure. There are no operator serviceable
parts inside. Refer servicing to CATC.
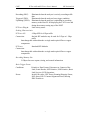
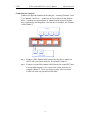
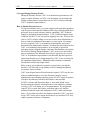
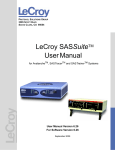
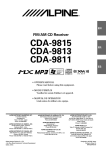
Figure 1: FCTracer 4G Front Panel
Front Panel Description
A PWR (power) - Green indicator LED for UPAS. Lights when the unit
power is switched on.
B Status indicator - Red indicator LED for UPAS. Lights during
initialization/power up of UPAS base unit. Blinks if a self-test fails.
C REC (recording) - Green LED. Lights when the unit is recording.
D TRG (triggered) - Orange LED. Lights when the unit triggers on an
event.
E UPLD (Upload) - Green LED. Lights when trace is being uploaded from
the analyzer to the PC.
F Manual Trigger - Push-button. Allows a manual Trace capture.
G Fibre Channel Connector
H Green Status LED. Illuminates when a physical connection is made
between the DUT and the Channel.
2.6 FCTracer Analyzer LED Descriptions
When powered on, the FCTracer activates the user-accessible controls and
LEDs on the front and rear panels of the UPAS.
Warning Do not open the UPAS enclosure. There are no operator serviceable
parts inside. Refer servicing to CATC.
10
CATC
FCTracer4G and FCTracer User’s Manual
SW Version 2.10
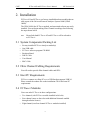
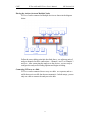
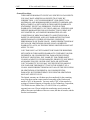
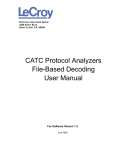
Figure 2: FCTracer Front Panel
Front Panel Description
A PWR (power) - Green indicator LED for UPAS. Lights when the unit
power is switched on.
B Status indicator - Red indicator LED for UPAS. Lights during
initialization/power up of UPAS base unit. Blinks if a self-test fails.
C REC (recording) - Green LED. Lights when the unit is recording.
D TRG (triggered) - Orange LED. Lights when the unit triggers on an
event.
E UPLD (Upload) - Green LED. Lights when trace is being uploaded from
the analyzer to the PC.
F Manual Trigger - Push-button. Allows a manual Trace capture.
G Fibre Channel Connector
H Green Status LED. Illuminates when a physical connection is made
between the DUT and the Channel.
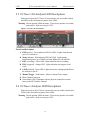
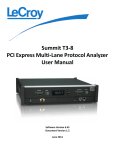
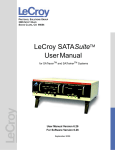
2.7 Rear Panel Description
From left to right, the UPAS rear panel contains the following components:
Figure 3: Rear Panel
USB type “B” host computer connector
This connector links the analyzer to the Host PC. for the purpose of
transmitting commands from the PC to the analyzer and uploading traces
from the analyzer’s recording memory to the FCTracer software for
viewing and analysis.
11
CATC
FCTracer4G and FCTracer User’s Manual
SW Version 2.10
RS-232 25 pin "Data Output" Connector
This connector links a 25 pin RS-232 cable to an external breakout board.
The breakout board allows signals to be sent from the analyzer to an external
device such as an oscilloscope or from an external device to the analyzer for
the purpose of triggering on an external input. You configure input/output
signalling through the Recording Options dialog box. Breakout board use
is described at the end of this chapter.
BNC Connectors "Ext. In" and "Ext. Out"
These connectors allow BNC cables to be attached to the analyzer for the
purpose of triggering on external input signals or for sending an output
signal from the analyzer to another device. These connectors have the same
function as the 25 pin RS-232 connector - i.e., they channel input and output
signals but do not support the use of a breakout board.
Wide range AC connector module
— Power socket
—
Power on/off switch
—
Enclosed 5x20 mm 2.0A 250 V fast acting glass fuse
Warning For continued protection against fire, replace fuse only with the type
and rating specified above.
2.8 Setting Up the Analyzer
Step 1
Step 2
Remove the FCTracer/UPAS from its shipping container.
The FCTracer module will already be installed in the left slot. If
you have purchased an 8-channel FCTracer, both slots will have
analyzer modules.
Connect the Analyzer unit to a 100-volt to 240-volt, 50 Hz to 60 Hz,
120 W power outlet using the provided power cord.
Note
The Analyzer is capable of supporting supply voltages between
100-volt and 240-volt, 50 Hz or 60 Hz, thus supporting all
known supply voltages around the world.
Step 3
Turn on the power switch on the rear of the UPAS.
12
CATC
FCTracer4G and FCTracer User’s Manual
SW Version 2.10
Note
At power-on, the analyzer initializes itself in approximately ten
seconds and performs an exhaustive self-diagnostic that lasts
about five seconds. The Status LED of the UPAS base unit turns
red on power up/initialization. The LED remains on
approximately 25 seconds while the analyzer performs
self-diagnostic testing. If the diagnostics fail, the Status LED
will blink red, indicating a hardware failure. If this occurs, call
CATC Customer Support for assistance.
Step 4
Insert the CD into the CD ROM drive of the PC that will be
controlling the analyzer.
Step 5
Connect the USB cable between the USB port on the back of the
analyzer and a USB port on the PC.
The host operating system detects the analyzer and begins to install the USB
driver.
Step 6
Follow Windows on-screen Plug-and-Play instructions for the
automatic installation of the analyzer as a USB device on the Host
PC (the required USB files are included on the FCTracer CD). Step
through the Windows hardware wizard. The wizard will
automatically install FCTracer as a USB device on the PC. When
the wizard prompts you for driver information, point it to the CD
which should be in your disk drive and install catcupa.sys and
FCTracer.sys.
2.9 Installing the Analyzer Software
Once FCTracer has been recognized as a USB device, install the FCTracer
software on the Host PC.
Step 1
On the PC, run Install Software on the installation CD and follow
the on-screen instructions.
The FCTracer software will install on the PC hard disk.
Step 2
To start the application, launch the CATC FCTracer program from
the Start menu:
Start > Programs > CATC > FCTracer.
13
CATC
FCTracer4G and FCTracer User’s Manual
SW Version 2.10
The FCTracer program opens.
Note
The software may be used with or without the analyzer. When
used without an analyzer attached to the computer, the program
functions as a Trace Viewer to view, analyze, and print captured
traffic.
14
CATC
FCTracer4G and FCTracer User’s Manual
SW Version 2.10
2.10 Connecting the Analyzer to the Device Under
Test
The analyzer can be connected and configured in two ways: as a repeater
where traffic is routed into and out of the analyzer, and as a sniffer where
the analyzer listens to a link without transmitting. When the analyzer is
configured as a repeater, it echoes the FC signal. The analyzer does not,
however, occupy a node on the FC fabric. In repeater mode, the analyzer
does not re-time the signal but does add a very small amount of latency.
When configured as a sniffer, the analyzer passively monitors the link
without adding latency. This latter role is particularly useful if you are
trying to monitor latencies between ports in a hub.
In the following section, you are shown how to connect the analyzer to two
devices, for example, an HBA and a switch. In this set up, FCTracer will
act as a repeater and will use two channels on the front panel for the
connections.
15
CATC
FCTracer4G and FCTracer User’s Manual
SW Version 2.10
Connecting the Analyzer
Connect two adjacent channels on the analyzer -- meaning Channels 1 and
2, or Channels 3 and 4 etc. -- to the two devices as shown in the diagram
below. You must use adjacent pairs of channels on the analyzer because
they are physically wired together. You can not, for example, use Channel
1 and Channel 3.
Step 1
Connect a fibre channel cable between the first device under test
(DUT) and a port on the analyzer, for example Channel 1.
Step 2
Connect a second fibre channel cable between the second DUT and
a second adjacent port on the same module on the analyzer, for
example Channel 2. These two analyzer ports will act as a pair.
Traffic will enter one port and exit the other.
16
CATC
FCTracer4G and FCTracer User’s Manual
SW Version 2.10
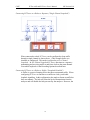
Placing the Analyzer between Multiple Nodes
FCTracer can be connected to multiple devices as shown in the diagram
below:
Follow the same cabling principle described above: use adjacent pairs of
analyzer channels for these connections -- Channel 1 and 2, or Channels 3
and 4 etc. After connecting the analyzer to the devices, you are ready to
configure the analyzer Recording Options and begin recording.
Connecting FCTracer to a Hub
FCTracer can be connected in two ways to a hub: as a repeater, and as a
sniffer that receives traffic but does not transmit it. In both setups, you use
only one cable to connect the analyzer to the hub.
17
CATC
FCTracer4G and FCTracer User’s Manual
SW Version 2.10
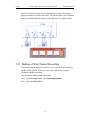
Connecting FCTracer to a Hub as a Repeater ("Single Channel Loopback")
When connected to a hub, FCTracer can be configured to loop traffic
through a single channel as shown above. (This example shows two
channels so configured). This mode is referred to as Per Channel
Loopback. In Per Channel Loopback FCTracer functions as a repeater transmitting and receiving traffic to and from a hub on the same channel.
You enable loopback via the Recording Options described later.
Connecting FCTracer to a Hub as a Sniffer ("Loopback Disabled")
A sniffer is a passive listening device that does not transmit traffic. When
configuring FCTracer to function as a sniffer on a hub, you disable
loopback signalling. In this configuration, the analyzer listens to traffic but
does not transmit. The hub will sense the lack of transmission from the
analyzer and will disable the hub port used by the analyzer. However, the
18
CATC
FCTracer4G and FCTracer User’s Manual
SW Version 2.10
hub will continue to transmit on the disabled port, thereby allowing the
analyzer to passively monitor the traffic. This mode allows you to monitor
devices on a hub without the latency that might occur in loopback mode.
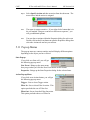
2.11 Making a Fibre Channel Recording
After connecting the analyzer to the device(s), you will need to configure
the Recording Options. Then you can test the analyzer by creating a
16-Mbyte snapshot recording.
To make this recording, follow these steps:
Step 1
From the Setup menu, select Recording Options.
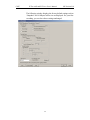
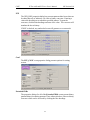
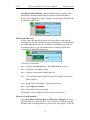
Step 2
Select the General tab.
19
CATC
FCTracer4G and FCTracer User’s Manual
SW Version 2.10
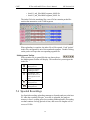
The following window displays the factory default settings such as
“Snapshot” and 16 Mbytes buffer size are displayed. For your first
recording, you can leave these settings unchanged.
20
CATC
FCTracer4G and FCTracer User’s Manual
SW Version 2.10
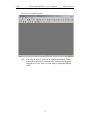
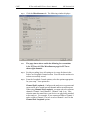
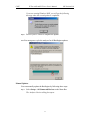
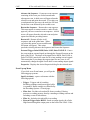
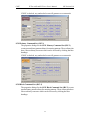
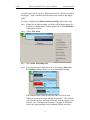
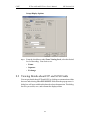
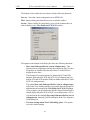
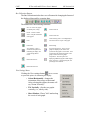
Step 3
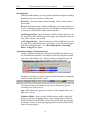
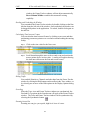
Click the Miscellaneous tab. The following window displays:
Note
The page shown above and in the following few screenshots
is for FCTracer 4G. The Miscellaneous page for FCTracer
shows eight channels.
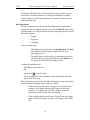
Step 4
For this recording, leave all settings as is except for those in the
Probe Card Loopback Control section. You will need to set these in
orderto successfully record.
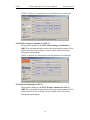
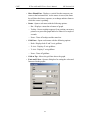
Step 5
From the Loopback Control options, select the options appropriate
for your setup. Your options are:
Channel Pair Loopback - Configures the analyzer as a repeater and
causes traffic to be routed into one channel and out an adjacent one.
When using Channel Pair Loopback, you must select two adjacent
channels: Channel 1 and Channel 2, Channel 3 and 4, etc. Your
selection must also match how your devices are physically attached
to the analyzer. For example, if you connect an HBA to Channel 1
and a switch to Channel 2, be sure to select Channel 1 and 2 in the
Channel Pair Loopback options.
21
CATC
FCTracer4G and FCTracer User’s Manual
SW Version 2.10
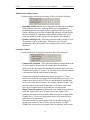
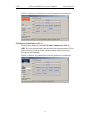
Per Channel Loopback - Configures the analyzer as a repeater and
causes traffic to be routed into and out of a single analyzer channel.
This option is used with hubs. Example: connect Channel 1 to a
hub. Then select Channel 1 from the Per Channel Loopback
options.
Loopback Disabled - Configures the analyzer as a sniffer. Causes
the analyzer to passively listen to the selected channel without
transmitting traffic. This option is used with hubs. Example:
connect Channel 1 to a hub. Then select Channel 1 from the
Loopback Disabled options.
Step 6
Click OK to accept your Recording Options selections and close the
dialog box. The analyzer is now ready for recording.
Step 7
Click
on the Tool Bar. This is the Start button and will cause the
analyzer to begin recording. After 16 Mbytes of traffic has been
recorded, the analyzer uploads the data and displays the sequences.
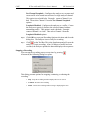
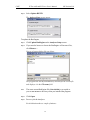
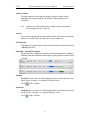
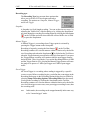
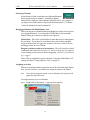
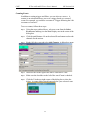
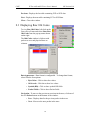
Stopping a Recording
You can stop the recording process at any time by pressing
Afterwards, the following dialog box opens:
.
This dialog presents options for stopping, continuing, or aborting the
recording:
• Stop - Stops the recording and then displays the trace on screen.
• Continue - Resumes the recording.
• Flush - Cancels the recording without saving or displaying the trace.
22
CATC
FCTracer4G and FCTracer User’s Manual
SW Version 2.10
When the recording session is finished, the bus traffic is uploaded to the PC
and is automatically saved to the hard drive as a file named data.fct or the
name you assign as the default filename.
Step 8
To save a current recording for future reference, select
Save As from the File menu.
Step 9
Give the recording a unique name and save it to the appropriate
directory.
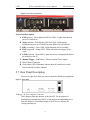
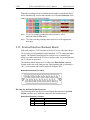
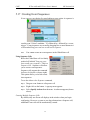
2.12 External Interface Breakout Board
With each analyzer, CATC includes an External Interface Breakout Board
for accessing several potentially useful standard, LV TTL output and input
signals. The breakout board also offers a simple way to connect logic
analyzers or other tools to the FCTracer Analyzer unit. Six ground pins and
one 5-volt pin are provided.
The Breakout Board connects via a cable to the Data In/Out connector
located on the rear of the analyzer unit. Each signaling pin is isolated by a
100Ω series resistor and a buffer inside the Analyzer unit.
Data In/Out Connector (on cable)
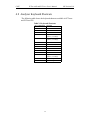
Pin-Outs for the Data In/Out Connector
The following table lists the pin-out and signal descriptions for the Data
In/Out connector on a cable that connects to the breakout board.
Data In/Out Connector – Pin-Out
Pin
Signal Name
Signal Description
1
RSV
Reserved
2
GND
Ground
23
CATC
FCTracer4G and FCTracer User’s Manual
Pin
Note
Signal Name
Signal Description
3
GP OUT
General Purpose Output
4
TRG IN 1
Trigger In 1
5
GND
Ground
6
DATA 6
Data 6
7
DATA 4
Data 4
8
DATA 3
Data 3
9
DATA 1
Data 1
10
GND
Ground
11
RSV
Reserved
12
RSV
Reserved
13
+5V
+5 Volts, 250 mA DC Source
14
RSV
Reserved
15
GND
Ground
16
TRG OUT
Trigger Out
17
TRG IN 0
Trigger In 0
18
DATA 7
Data 7
19
DATA 5
Data 5
20
GND
Ground
21
DATA 2
Data 2
22
DATA 0
Data 0
23
GND
Ground
24
RSV
Reserved
25
RSV
Reserved
(*) Pins
SW Version 2.10
4 and 17 have the same function: they allow external
signals to be used to cause triggering or recording. Pins 3 and 16
are used to transmit output signals. Pins 6, 7, 8, 9, 18, 19, 21, and
22 (data pins) are used to define data patterns for external input
signals. See External Input Signals in Chapter 6.
24
CATC
FCTracer4G and FCTracer User’s Manual
SW Version 2.10
External Interface Breakout Board
Prototype Rework Area
The Breakout Board contains a prototype rework area for making custom
circuits for rapid development. The area consists of plated-through holes, 20
columns wide by 27 rows long. The top row of holes is connected to GND
and the bottom row is connected to +5V. The remaining holes are not
connected. Use the rework area to insert custom components and wire-wrap
their respective signal, power, and ground pins.
Configuring the Analyzer for the Breakout Board
To configure the analyzer for the breakout board, see the chapter on
Recording Options.
25
CATC
FCTracer4G and FCTracer User’s Manual
26
SW Version 2.10
CATC
FCTracer4G and FCTracer User’s Manual
SW Version 2.10
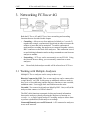
3. Networking FCTracer 4G
Both the FCTracer 4G and FCTracer have networking and cascading
functions that are described in this chapter.
•
Cascading -- Allows two to four analyzers be linked (or "cascaded")
together into a single, synchronized, logical unit in order to increase the
number of ports that can be monitored. To enable synchronized
multi-analyzer recording, the analyzers are connected together via their
BNC connectors on the back of the analyzers. This connection is used
to send clocking information and recording commands are sent from one
analyzer to another.
•
Networking -- FCTracer can be run remotely over an IP LAN. Using
the Network browse dialog, you can remotely control one or more
analyzers.
Note
Henceforth, both analyzer models will be referred to as FCTracer.
3.1 Working with Multiple Analyzers
Multiple FCTracer analyzers can be set up in three ways:
Directly Connected by USB - Two or more analyzers can be connected to
a single host PC via USB. In this setup, no additional cables are used (as
they are in a Cascaded setup) and the analyzers function as non-cascaded,
standalone units. Users toggle back and forth between the units.
Cascaded - Two or more local analyzers linked by BNC. One (or all) of the
analyzers then connect via USB to a host PC.
The BNC cable functions to transmit clocking and control information
between the analyzers, thereby allowing the analyzers to function as a
cascade - i.e., a single, logical analyzer. Cascading analyzers allows them
to perform synchronized, multi-analyzer recordings.
Connected Remotely over an IP Network - A PC connected to analyzers
across an IP network.
27
CATC
FCTracer4G and FCTracer User’s Manual
SW Version 2.10
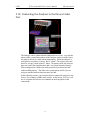
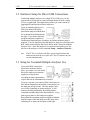
3.2 Hardware Setup for Direct USB Connections
Connecting multiple analyzers to a single PC by USB gives you the
convenience of being able to control multiple analyzers from a single
FCTracer application. The application provides you with a means of
toggling back and forth between the analyzers.
To set up multiple analyzers via
USB, you attach USB cables
between the analyzers and the host
PC as shown iin the illustration on
the right. If you do not intend to
group the analyzers together for
synchronized multi-analyzer recordings, no further hardware setup is
required. If you do intend to group the analyzers, then you will need to add
BNC cables as described in the section below under "Setup for Multiple
Analyzer Use." Once the analyzers are connected and started, you can
browse to the analyzers via the command Setup > Analyzer Network ...
Note
The FCTracer software will allow you to toggle between the
analyzers but not run two copies of FCTracer software on your
screen simultaneously.
3.3 Setup for Cascaded Multiple Analyzer Use
If you add a BNC connection
between the analyzers shown
above, you create a cascade which
allows the analyzers to function
together as a logical unit.
Cascading increases the numbers
of ports that can be simultaneously recorded.
To set up a cascade, you connect a BNC cable between
the External Output port on the back of one analyzer to
the input port on the second. The first analyzer will
serve as the controlling or master analyzer. It will
transmit clocking information, Recording Option
commands and other data to the other analyzers. If you
plan to group three or four analyzers together,
daisy-chain the remaining analyzers together, and then
loop the output of the last analyzer to the input of the
first analyzer as shown in the figure on the right.
28
CATC
FCTracer4G and FCTracer User’s Manual
SW Version 2.10
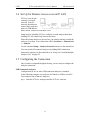
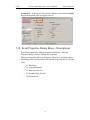
3.4 Set Up for Remote Access over an IP LAN
FCTracers can be run
remotely over an IP
network. In an IP
network, the analyzers
connect their respective
hosts via USB and the
hosts, in turn, connect to each other via IP.
Setup involves installing FCTracer software on each analyzer host, then
enabling IP LAN connectivity between the hosts.
When the remote analyzer is powered on, you connect remotely control the
analyzer via its host. Your connection will be Local host => Remote host
=> Analyzer.
Use the command Setup > Analyzer Network to browse to the remote host.
You can cascade IP-connected analyzers by adding BNC connections
between the analyzers as described above in “Setup for Cascaded Multiple
Analyzer Use” on page 28.
3.5 Configuring the Connection
Once you have completed the physical setup, you are ready to configure the
analyzer connection.
USB-Connected Analyzers
Configuration for two or more USB connected analyzers is minimal.
In the following example, two analyzers are linked via USB to a host PC.
You connect to one of the two analyzers.
Step 1
Start the FCTracer analyzers and the FCTracer software.
29
CATC
FCTracer4G and FCTracer User’s Manual
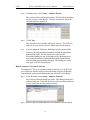
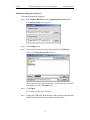
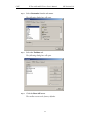
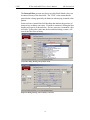
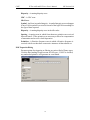
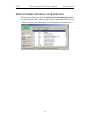
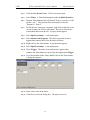
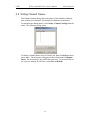
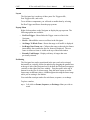
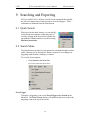
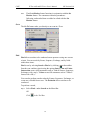
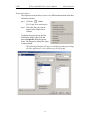
Step 2
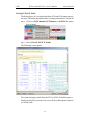
SW Version 2.10
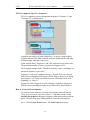
From the menu, select Setup > Analyzer Devices.
The Analyzer Devices dialog box opens. The left side of the dialog
box has a series of checkboxes. To select an analyzer, check the
relevant checkbox on the left.
Step 3
Click Close.
The dialog box closes and the analyzer is selected. The FCTracer
software on your screen will now control the selected analyzer.
Note
You can update the Firmware, BusEngine and License from this
dialog by checking an analyzer and then clicking the appropriate
button on the right. You can also directly open and set
Recording Options for any of the analyzers by checking one or
more analyzers and then clicking the Recording Options button.
The Recording Options dialog will open. The settings you create
will apply to all selected analyzers.
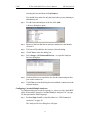
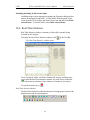
Remote Analyzers Over an IP Network
To configure FCTracer to remotely control an analyzer over an IP LAN,
you will need to use the Analyzer Network dialog to browse to the host
controlling the analyzer and add both the host and its PC to the dialog.
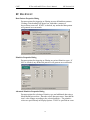
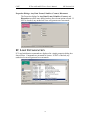
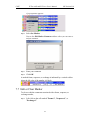
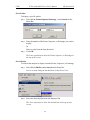
Step 1
From the menu, select Setup > Analyzer Network.
The Analyzer Network dialog box opens. This dialog lists host PCs
and their analyzers. The listed devices are either currently connected
or were connected at some point previously.
Step 2
Remove any host (other than the Local Machine) from the list by
30
CATC
FCTracer4G and FCTracer User’s Manual
SW Version 2.10
selecting the host and then clicking Remove.
You should keep in the list only the host(s) that you are planning to
immediately use.
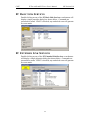
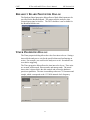
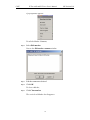
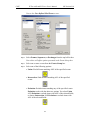
Step 3
To add a host and analyzer to the list, click Add.
A browse dialog box opens.
Step 4
Browse to the host that has an analyzer attached to it and double
click on it.
Step 5
The host will be added to the Analyzer Network dialog.
Step 6
Click Close to close the dialog box.
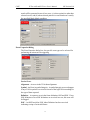
Step 7
Select Setup > All Connected Devices ... to open the Analyzer
Devices dialog box.
Step 8
Uncheck all boxes except for the one for the remote analyzer that
you wish to connect to.
Step 9
Click Close to close the dialog box and establish a connection to the
selected analyzer.
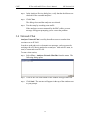
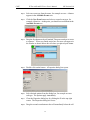
Configuring Cascaded Multiple Analyzers
To configure analyzers to work as a group (i.e., into a cascade), attach BNC
cables as described “Setup for Cascaded Multiple Analyzer Use” on page
28, then perform the following steps:
Step 1
Perform Steps 1 and 2 as described above in “USB-Connected
Analyzers” on page 29.
The Analyzer Devices dialog box will open.
31
CATC
FCTracer4G and FCTracer User’s Manual
SW Version 2.10
Step 2
In the Analyzer Devices dialog box, verify that the checkboxes are
checked for the cascaded analyzers.
Step 3
Click Close.
The dialog closes and the analyzers are selected.
Step 4
Test the setup by recording some traffic.
If the analyzers are not connected by the BNC cables, an error
message will appear prompting you to correct the problem.
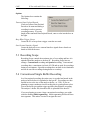
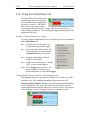
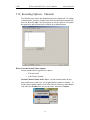
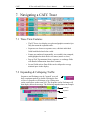
3.6 Network Chat
Analyzer Network Chat is a utility that allows users to conduct chat
sessions over an IP LAN.
In order to send and receive electronic text messages, each user must be
working with a PC that is attached to an analyzer. And each PC must, in
turn, be connected to an IP LAN.
To start a chat session,
Step 1
Select View > Analyzer Network Chat Bar from the menu. The
following dialog opens.
Step 2
Click in the cell at the bottom of the window and type some text.
Step 3
Click Send. The sent text will appear in the top of the window next
to your prompt.
32
CATC
FCTracer4G and FCTracer User’s Manual
SW Version 2.10
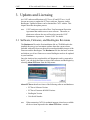
3. Updates and Licensing
As CATC makes modifications to FCTracer 4G and FCTracer, it will
become necessary to update the FCTracer software, firmware, and/or
BusEngine. Updated software can be obtained the CATC website. This
chapter describes the update process.
Note:
CATC analyzers come with a Three Year Investment Protection
Agreement that entitles users to new software. Thereafter, to
obtain new software the user will need to renew the CATC
Maintenance Agreement. Contact CATC for details.
3.1 Software, Firmware, and BusEngine Revisions
The Readme.txt file on the first installation disk or CD-ROM and in the
installed directory gives last-minute updates about the current release.
Included with each release are the most recent downloadable images of the
Firmware and the BusEngine. The Readme.txt file lists the latest versions
and informs you if new Firmware or a new BusEngine needs to be updated
in your hardware.
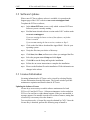
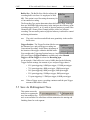
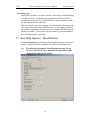
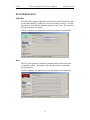
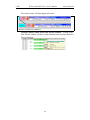
Once the Analyzer has completed the self diagnostics and is connected to
the PC, you can check the latest revision of the software and BusEngine by
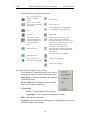
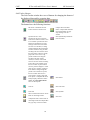
selecting About FCTracer from the Help menu:
About FCTracer details revisions of the following software and hardware:
• FCTracer Software Version
• FCTracer Firmware & ROM Versions
• BusEngine Version
• Unit Serial Number
Note
When contacting CATC for technical support, please have available
all the revisions reported in the About FCTracer... window.
33
CATC
FCTracer4G and FCTracer User’s Manual
SW Version 2.10
3.2 Software Updates
When a new FCTracer software release is available, it is posted on the
Support page of the CATC website at www.catc.com/support.html.
To update the FCTracer software,
Step 1
In the About FCTracer screen, verify which version of FCTracer
Software you are currently running.
Step 2
Find the latest released software version on the CATC website under
www.catc.com/support.
If you are running the latest version of the software, no further
action is needed.
If you are not running the latest version, continue to Step 3.
Step 3
Click on the first link to download the zipped Disk 1 files for your
operating system.
Step 4
Unzip the files into your choice of directory.
Step 5
Click Start, then Run, and browse to where you unzipped the files.
Step 6
Select the program named Setup and click Open.
Step 7
Click OK to run the Setup and begin the installation.
Step 8
Follow the on-screen instructions to complete the installation.
Step 9
Please see the Readme file on the installation CD for information on
changes in the release.
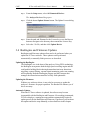
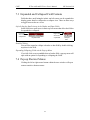
3.3 License Information
Licensing information for FCTracer can be viewed by selecting Display
License Information from the Help menu. The License window provides
maintenance expiration and features data for FCTracer.
Updating the Software License
License keys are necessary to enable software maintenance for both
FCTracer 4G and for FCTracer. Software maintenance is also needed on
FCTracer for and four or eight channel support. If they are not enabled, a
message appears if an attempt is made to access these features, stating that
a license key is necessary to use the features.
To access these tools, a License Key must be obtained by CATC. Once the
License Key is obtained, perform the following steps to install it:
34
CATC
FCTracer4G and FCTracer User’s Manual
Step 1
SW Version 2.10
From the Setup menu, select All Connected Devices.
The Analyzer Devices dialog opens.
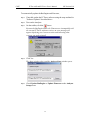
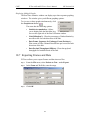
Step 2
Click the button Update License button. The Update License dialog
appears.
Step 3
Enter the path and filename for the License key or use the Browse
button to navigate to the directory that contains the License Key.
Step 4
Select the *.lic file, and then click Update Device.
3.4 BusEngine and Firmware Updates
BusEngine and Firmware updates often need to be performed when you
update the FCTracer software. These updates can be performed
automatically or manually. Both processes are described.
Updating the BusEngine
The BusEngine core is the heart of the analyzer. Using FPGA technology,
the BusEngine incorporates both the high speed recording engine and the
configurable building blocks that implement data/state/error detections,
triggering, capture filtering, external signal monitoring, and event counting
and sequencing. Both the BusEngine program and the Firmware that
manages the internal microcontroller are fully field updateable.
Updating the Firmware
Within a new software release, it may also be necessary to update the
analyzer’s firmware for proper operation. The Readme file informs you if
this is necessary.
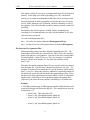
Automatic Updates
When the FCTracer software is updated, the software may become
incompatible with the BusEngine and Firmware. If a recording is attempted,
FCTracer displays a warning message and then automatically begins an
update process for the BusEngine and Firmware. If preferred, you can abort
this update and do the steps manually, as described later in this chapter.
35
CATC
FCTracer4G and FCTracer User’s Manual
SW Version 2.10
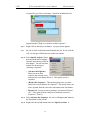
To automatically update the BusEngine and Firmware,
Step 1
If needed, update the FCTracer software using the steps outlined in
"Software Updates" described above.
Step 2
Turn on the Analyzer.
Step 3
On the toolbar, click the
button.
Because the BusEngine and/or the Firmware are incompatible with
the current FCTracer software version, an error message will
appear displaying your current versions and indicating what
versions you need to install.
Step 4
Click Yes.
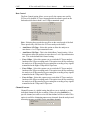
The above window closes and the Analyzer Setup window opens.
Step 5
Check Update BusEngine or Update Firmware on the Analyzer
Setup screen.
36
CATC
FCTracer4G and FCTracer User’s Manual
SW Version 2.10
If you are running Windows 98SE, you will get the following
message when the second update is completed:
Step 6
Note
Power cycle FCTracer to complete the update.
You must power cycle the analyzer for all BusEngine updates.
Manual Updates
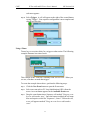
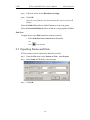
You can manually update the BusEngine by following these steps:
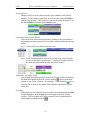
Step 1
Select Setup > All Connected Devices on the Menu Bar.
The Analyzer Devices dialog box opens.
37
CATC
FCTracer4G and FCTracer User’s Manual
Step 2
SW Version 2.10
Select Update BE/FW.
The Analyzer Setup screen opens:
To update the BusEngine,
Step 3
Click Update BusEngine on the Analyzer Setup screen.
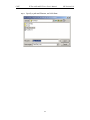
Step 4
If you need to browse to locate the BusEngine or Firmware files,
click Browse ...
You see a browse dialog like one below:
The program has already automatically searched for the correct file
and displays it in the File name field.
Note
The most current BusEngine file (fctrcrbe.bin) was copied to
your \CATC\FCTracer directory when you installed the program.
Step 5
Click Open.
Step 6
Power cycle the Analyzer.
Re-initialization takes a couple of minutes.
38
CATC
FCTracer4G and FCTracer User’s Manual
SW Version 2.10
Manually Updating the Firmware
To manually update the firmware,
Step 1
Select Update BE/FW from the Analyzer Devices dialog box.
The Analyzer Setup screen opens:
Step 1
Click Setup screen.
Step 2
If you need to locate the correct Firmware file, click Browse ...
You see the Select firmware file window:
The program has already automatically searched for the correct file
and displays it in the File name field.
Step 3
Click Open.
The Analyzer updates the Firmware.
Step 4
Unplug the USB cable from the back of the Analyzer unit and then
reinsert it so the new Firmware update can take effect.
39
CATC
FCTracer4G and FCTracer User’s Manual
40
SW Version 2.10
CATC
FCTracer4G and FCTracer User’s Manual
SW Version 2.10
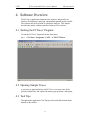
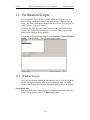
4. Software Overview
The FCTracer application administers the analyzer and provides an
interface for displaying, analyzing, and printing captured protocol traffic.
The software may be used with or without the analyzer. This chapter
describes the menus, toolbars and other features of the software.
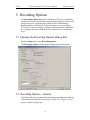
4.1 Starting the FCTracer Program
To start the FCTracer Program from the Start menu,
Step 1
Click Start > Programs > CATC > CATC FCTracer.
4.2 Opening Sample Traces
A good way to gain familiarity with FCTracer is to open some of the
provided sample files and explore the menus, pop-up menus, and reports.
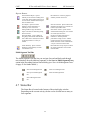
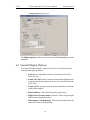
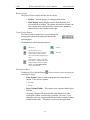
4.3 Tool Tips
Throughout the application, Tool Tips provide useful information about
buttons on the toolbar.
41
CATC
FCTracer4G and FCTracer User’s Manual
SW Version 2.10
To display a Tool Tip, position the mouse pointer over
an item of interest such as part of the trace or a button.
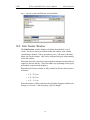
4.4 Trace Tool-Tips
Many fields within the Trace will display tool-tips when the mouse pointer
is suspended over them. These tips may provide a simple legend for the cell
or may give substantial added details about the field.
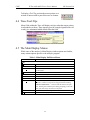
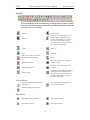
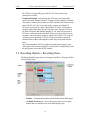
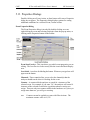
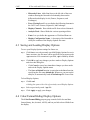
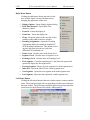
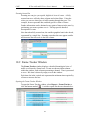
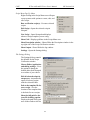
4.5 The Main Display Menus
While some of the analyzer’s Main Display window options are familiar,
many contain options specific to the analyzer program.
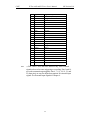
Table 1: Main Display Pull-Down Menus
Menu
Function
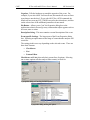
File
Open…
Opens a trace file.
Close
Closes the current file.
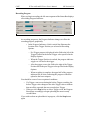
Save As…
Saves all or a specified range of packets from the current file with a
specified name.
Print…
Prints part or all of the current trace file.
Print Preview
Displays an on-screen preview before printing.
Print Setup…
Sets up your current or new printer.
Edit Comment…
Creates or edits the Trace file comment field.
Export>>
Packets to Text (Packet View Format) - Saves all or part of a Trace to
a text file. Useful for saving traces to floppy disk and for emailing.
Packets to EAS Format ... - Creates an EAS file based on the open
trace. Running this command opens a dialog prompting you for a file
name, path, and a range of Frames to be exported.
Last File
Lists the last files that were opened.
Exit
Exits the FCTracer program.
42
CATC
FCTracer4G and FCTracer User’s Manual
Menu
SW Version 2.10
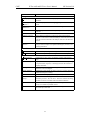
Function
Setup
Display Options…
Provides the control of various display options such as color, formats,
and filters.
Recording
Options…
Provides setup options for recording, triggering events, and filtering
events.
Application
Preferences ...
Sets how commands are listed in menus and dialog boxes.
Update BE/FW …
Allows the operator to reset the Analyzer or update the BusEngine and
Firmware.
Channel Settings …
Allows channel names to be customized.
Analyzer Network ...
Opens a dialog box that lets you browse for local and networked
analyzers. To browse for a networked analyzer, select Add, then browse
to the PC host that is attached to the analyzer, then select the attached
analyzer.
All Connected
Devices ...
Opens a dialog box with a list of analyzers connected to the host PC.
Lets you select an analyzer and update the BusEngine, Firmware, and
licensing information.
Record
Start
Causes the Analyzer to begin recording Fibre Channel activity.
Stop
Causes the Analyzer to stop recording Fibre Channel activity.
Report
File Information
Summarizes key facts, such as the number of packets and triggering
setup.
Error Summary
Displays an error summary of the current trace file and allows you to go
to a specific frame, sequence, or exchange, and save the error file to a
uniquely named file.
Timing Calculation
Starts the calculator dialog for calculating various timing and bandwidth
parameters in the recording file.
Traffic Summary
Summarizes in table format the number and types of packets that were
transferred during the recording.
Bus Utilization
Opens a window with graphs of bus usage for the open trace.
Run Verification
Scripts ...
Opens a window for running performance tests of Fibre Channel traffic
recorded by FCTracer 4G or FCTracer. These tests evaluate the timing
and data of events in accordance with user-defined conditions.
Link Tracker
Opens a window for displaying a detailed chronological view of Bus
activity on a Primitive-by-Primitive basis.
Frame Tracker
Opens a window for displaying a detailed chronological view of traffic
on a Frame-by-Frame basis.
43
CATC
FCTracer4G and FCTracer User’s Manual
Menu
SW Version 2.10
Function
Search
Go to Trigger
Positions the display to the first frame, sequence, or exchange following
the trigger event.
Positions the display to the indicated Frame, Sequence, or Exchange.
Go to Frame/
Sequence/Exchange...
Go to Time ...
Positions the display to a specific time.
Go to Marker »
Positions the display to a previously marked frame, sequence, or
exchange.
Go to »
Enables searching for specific events using a cascade of pop-up menus.
Find
Allows complex searches.
Find Next
Repeats the previous Find operation. Also use F3 to find next.
Search Direction
Allows you to specify a forward or backward search of a trace file.
View
Toolbars
Displays list of available toolbars. Has a customize command for
creating.
Analyzer Network
Chat Bar
Opens a dialog for chatting with other analyzer users. This option works
only with PCs directly.
Status Bar
Switches display of the Status Bar on or off.
Real-Time Statistics
Opens a window that displays graphs of traffic in real-time.
Zoom In
Zoom in increases the size of the displayed elements.
Zoom Out
Zoom out decreases the size of the displayed elements.
Wrap
Allows the display to wrap.
Decoding
Assignments
Opens a dialog box called FCP SCSI Decoding Settings that lets you
correct problems with SCSI decoding by assigning a SCSI command set.
This dialog box provides a way of resolving discrepancies caused by the
sharing of the same Opcode by different SCSI command sets.
Frames Level
View/Hide Frames Level.
Sequences Level
View/Hide Sequences Level.
Exchanges Level
View/Hide Exchanges Level.
First Segment
Opens the first segment in a multi-segment trace. Requires that a
multi-segmented file be opened first.
Previous Segment
Opens the previous segment in a multi-segment trace.
Index File
Opens the index file for a multi-segmented trace. The index file
summarizes the trace and its segments.
Next Segment
Opens the next segment in a multi-segment trace.
Last Segment
Opens the last segment in a multi-segment trace.
44
CATC
FCTracer4G and FCTracer User’s Manual
Menu
SW Version 2.10
Function
Window
New Window
Switches display of the Tool Bar on or off.
Cascade
Displays all open windows in an overlapping arrangement.
Tile
Displays all open windows in a side-by-side arrangement.
Arrange Icons
Arranges minimized windows at the bottom of the display.
Windows
Displays a list of open windows.
Help
Help Topics
Displays online help.
Update License
Displays a dialog box for entering updated license information.
Display License
Information
Displays version information about FCTracer, its firmware, and
BusEngine.
About FCTracer
Displays version information about FCTracer.
4.6 View Options
You can hide, display or reset
toolbars by selecting View >
Toolbars from the menu bar.
Resetting the Toolbar
From time to time (such as
following a software upgrade) it is
possible for the buttons on the
toolbar to not match their intended
function.
To reset the toolbar,
Step 1
Select View >Toolbars from the menu bar.
45
CATC
FCTracer4G and FCTracer User’s Manual
Step 2
Select Customize from the sub-menu.
The following dialog box will open.
Step 3
Select the Toolbars tab.
The following dialog box will open.
Step 4
Click the Reset All button.
The toolbar resets to the factory defaults.
46
SW Version 2.10
CATC
FCTracer4G and FCTracer User’s Manual
SW Version 2.10
Tool Bar
The Tool Bar provides quick access to most of the FCTracer software functions.
Youcanlearn the function ofeach buttonby passingthemouse pointeroverthem.
Descriptionsofthebuttonsappearonthestatusbaratthebottomofthewindowand
as tooltips above each button.
Open file
Stop Recording
Re-upload. This button appears in the
toolbar if Stop is pressed during an
upload. Causes analyzer to re-upload
trace from analyzer buffer to the PC.
Gives options for selecting which part of
the trace you want uploaded.
Save As
Preview
Zoom In
Print…
Zoom Out
Edit as text - opens a text editor for
editing traffic generation files.
Wrap
Setup Record Options
Find - Opens a dialog for conducting
complex searches
Setup Display Options
Find Next - repeats last Find or Go To
operation
Trace Panes. Allows multiple traces to be
locked together and scrolled in tandem.
This option only works with .mtt traces
created by multi-analyzer cascades in a
single recording session.
Start Recording
Decode Buttons
Decode & display Frame Layer (Frames
& Primitives)
Decode & display SCSI Application
Layer (SCSI Commands)
Decode & display Sequence Layer
Hide Buttons
Hide Align and Notify Primitives
Hide Initiator Channel 1
Hide RRDY Primitives
Hide Target Channel 1
47
CATC
FCTracer4G and FCTracer User’s Manual
SW Version 2.10
Reports Buttons
File Information Report. Opens a
summary of the trace file including when
it was made, the Recording Options used
to create the file, and data on the analyzer
that recorded the trace.
Error Report. Opens the Traffic
Summary window and displays a
summary of errors in the trace.
Timing and Bus Usage Calculations.
Opens a calculator for measuring timing
between Frames.
Show Data Block. Opens a dialog for
navigating to data blocks within Frames.
Once a data block is located, the window
can display the data in a variety of
formats.
Bus Utilization. Presents a graphical
summary of traffic in the trace.
Show Link Tracker. Opens window with
detailed chronological view of traffic on a
Primitive-by-Primitive basis.
Show Frame Tracker. Opens window
with detailed chronological view of traffic
on a Frame-by-Frame basis.
Invokes FC-Auditor application, if
installed. FC-Auditor performs
performance testing on traces. Auditor
requires that traces be converted into a
format called EAS via the command File
> Export > Packets to EAS format.
Run Verification Scripts. Opens a window
for running performance tests of Fibre
Channel traffic.
Traffic Summary. Opens a window
displaying a table summary of traffic
recorded in the trace.
Multi-Segment Tool Bar
The Multi-Segment Tool Bar lets you navigate forward and backward through
traces that have been divided into segments via the Save As Multi-Segment Trace
option in the Recording Options General dialog (see “Save As Multisegment Trace”
on page 56 for further details.)
Show first multisegment file
Show next multisegment file
Show previous multisegment
file
Show last multisegment file
Show multisegment index
file
4.7 Status Bar
The Status Bar is located at the bottom of the main display window.
Depending on the current activity, the bar can be divided into as many as
four segments.
48
CATC
FCTracer4G and FCTracer User’s Manual
SW Version 2.10
Recording Progress
When you begin recording, the left-most segment of the Status Bar displays
a Recording Progress Indicator:
As recording progresses, the Progress Indicator changes to reflect the
recording progress graphically:
• In the Progress Indicator, a black vertical line illustrates the
location of the Trigger Position you selected in Recording
Options.
—
Pre-Trigger progress is displayed in the field to the left of the
Trigger Position in the before-Trigger color specified in the
Display Options.
—
When the Trigger Position is reached, the progress indicator
wiggles as it waits for the trigger.
—
After the trigger occurs, the field to the right of the Trigger
Position fills in the post-Trigger color specified in the Display
Options.
—
When recording is complete, the upper half of the progress
indicator fills in white, indicating the progress of the data
upload to the host computer.
You should be aware of two exceptional conditions:
•
If a Trigger event occurs during the before-Trigger recording, the
before-Trigger color changes to the after-Trigger color to indicate
that not all the expected data was recorded pre-Trigger.
• When you click Stop before or after a Trigger event, the Progress
Bar adjusts accordingly to begin uploading the most recently
recorded data.
If you wish to abort an upload that is in progress, click the Stop button
again.
49
CATC
FCTracer4G and FCTracer User’s Manual
SW Version 2.10
The Progress Bar fills with color in proportion to the specified size and
actual rate at which the hardware is writing and reading the recording
memory. However, the Progress Indicator is normalized to fill the space
within the Status Bar.
Recording Status
During recording activity, the current Recording Status is temporarily
displayed in the next segment. When you activate the Record function, this
segment flashes one of the following messages (depending on the selected
Recording Options):
—
Trigger?
—
Triggered!
—
Uploading
After recording stops,
—
The flashing message changes to Uploading data–x% done
(x% indicates the percentage completion of the data
uploading process).
—
The traffic data is copied to disk (overwriting any previous
version of this file) using the default file name data.fct or a
new name specified in the Recording options.
To abort the upload process,
Press Esc on your keyboard
OR
Again click
in the Tool Bar.
You are prompted to choose whether to keep the partially uploaded
data or to throw it away.
When the data is saved, the Recorded Data file appears in the main display
window and the Recording Status window is cleared.
• If the recording resulted from a Trigger Event, the first frame,
sequence, or exchange following the Trigger (or the frame,
sequence, or exchange that caused the Trigger) is initially
positioned second from the top of the display.
• If the recording did not result from a Trigger Event, the display
begins with the first frame, sequence, or exchange in the traffic
file.
50
CATC
FCTracer4G and FCTracer User’s Manual
SW Version 2.10
Analyzer Status
The third segment in the status bar displays analyzer status. During
uploading, this segment displays the percent of the upload process
completed.
Note
If packets are filtered from the recording or data are truncated,
the recording activity is reduced.
Activity
The Activity segment indicates the amount of Fibre Channel activity that the
analyzer is currently detecting from the device(s) under test.
Search Status
The rightmost segment displays the current search direction: Fwd (forward)
or Bwd (backward).
Status Bar - Spooled Recordings
During spooled recordings, the status bar indicates that spooled recording is
underway and shows the name and progresss of the segment currently being
recorded.
Zoom In
Zoom In increases the size of the displayed elements, allowing fewer (but
larger) frame, sequence, or exchange fields per screen.
Click
on the Tool Bar.
Zoom Out
Zoom Out decreases the size of the displayed elements, allowing more (but
smaller) frame, sequence, or exchange fields per screen.
Click
on the Tool Bar.
51
CATC
FCTracer4G and FCTracer User’s Manual
SW Version 2.10
4.8 Analyzer Keyboard Shortcuts
The following table shows the keyboard shortcuts available in FCTracer
and FCTracer 4G.
Table 2: Keyboard Shortcuts
Key Combination Operation
Ctrl+O
Open the file
Ctrl+P
Print
Ctrl+S
Save the file
Ctrl+Home
Jump to first frame,
sequence, or exchange
Ctrl+End
Jump to last frame,
sequence, or exchange
F3
Find Next
F6
Next Pane
Shift+F6
Previous Pane
Ctrl+B
Search Backward
Ctrl+F
Search Forward
Shift+Insert
Paste
Ctrl+Home
Jump to first frame,
sequence, or exchange
Ctrl+R
Start recording
Ctrl+T
Stop recording
52
CATC
FCTracer4G and FCTracer User’s Manual
SW Version 2.10
5. Recording Options
The Recording Options dialog box controls how FCTracer records Fibre
Channel data. At the top of the Recording Options dialog box are four tabs
that provide access to options pages called General, Miscellaneous,
Recording Rules, and Channels. Using these pages, you can configure
FCTracer to create event triggers, increase or decrease memory allocation
for recording, and interact with other Fibre Channel devices in different
ways.
5.1 Opening the Recording Options Dialog Box
From the Setup menu, select Recording Options...
The Recording Options window appears displaying the General tab.
5.2 Recording Options - General
The General tab opens a window shown in the previous illustration made up
of five main boxes marked Recording Type, Buffer Size, Trigger Position,
Options, and Recording Scope.
53
CATC
FCTracer4G and FCTracer User’s Manual
SW Version 2.10
Recording type
The Recording Type box presents three options that
allow you to set how FCTracer begins and ends a
recording. The options are: Snapshot, Manual Trigger,
and Event Trigger.
Snapshot
A Snapshot is a fixed-length recording. You can set the size two ways: by
adjusting the "Buffer Size" slide bar dialog or by clicking the Stop button
any time during the recording. Recording begins by clicking the Start button
on the Tool Bar and ends when either the selected buffer size is filled
or you press the Stop button.
Manual Trigger
A Manual Trigger is a recording whose Trigger point is activated by
pressing the Trigger button on the front panel.
Recording is begun by pressing the Start button
on the Tool Bar.
Recording continues in a circular manner within the limits set by the buffer
size. Recording ends when the Stop button
is clicked on the Tool Bar or
when the Trigger button is pressed on the analyzer's front panel. If you press
the Trigger button, recording will continue until the post-trigger memory
has been filled. Thus, for example, if you set the Recording Buffer to 10 MB
and the Trigger Point to 50%, pressing the Manual Trigger button will cause
the analyzer to preserve 5 MB of pre-trigger and 5 MB of post-trigger
traffic.
Event Trigger
An Event Trigger is a recording whose ending is triggered by a specific
event or events. Before recording begins, you define the event trigger in the
Recording Rules page in the Recording Options dialog box (accessible by
selecting Setup> Recording Options >Recording Rules from the menu).
You begin the recording by clicking the Start button on the Tool Bar.
Recording continues in a circular manner within the limits set by the buffer
size. Once the trigger event occurs, some post-trigger recording occurs, then
the recording ends.
Note
In this mode, the recording can be stopped manually in the same way
as for "manual trigger" mode.
54
CATC
FCTracer4G and FCTracer User’s Manual
SW Version 2.10
Options
The Options box contains the
following:
Truncate Data Payload Dwords
If selected, allows Data Payload
Dwords to be truncated during a
recording in order to preserve
recording memory. To set the
length of the truncated Data Payload Dword, enter a value into the box on
the right.
Beep When Trigger Occurs
Causes the PC to beep when a trigger event has occurred.
Save External Interface Signals
Causes the analyzer to save external interface signals from a break-out
board as fields in the trace.
5.3 Recording Scope
Recording Scope controls the maximum size of a recording and how it is
uploaded from the analyzer to the host PC. Recording Scope has two
settings: Conventional recording and Spooled recording. Conventional
recordings have a maximum size limit of 2 GB and are used for recordings
lasting several minutes. Spooled recordings have no built-in size limitation
and can be used for recordings lasting hours or even days.
5.4 Conventional Single Buffer Recording
In a Conventional recording, the entire trace is recorded and stored in the
analyzer buffer before it is uploaded to the host PC. Recordings are thus
limited in size to the size of the analyzer buffer - or 2 GB. If you are
planning to create a moderate-sized recording, this is a good option to select.
You set the buffer size and the trigger position, then begin the recording.
The analyzer’s buffer fills, then the traffic is uploaded to the host PC.
If you are planning to create a large conventional recordings, you might
consider enabling Multi-segmenting. Multi-segmenting divides the trace
into segments. This makes it easier to navigate the trace.
55
CATC
FCTracer4G and FCTracer User’s Manual
SW Version 2.10
Buffer Size - The Buffer Size slide bar adjusts the
recording buffer size from 1.6 megabytes to 2048
MB. This option is used for setting the memory for
a Conventional recording.
The Recording Type option determines how this buffer is used. Although
there are 2048 MB of physical memory in the Analyzer, the efficiency of the
recording ranges from 2:1 to 4:1 ratios of physical memory to actual Fibre
Channel traffic. Shorter Fibre Channel packets yield a less efficient
recording. The non-traffic portion of physical memory is utilized for control
and timing information.
Note
The scale is not linear and affords more granularity in the smaller
buffer sizes.
Trigger Position - The Trigger Position slide bar sets
the amount of pre- and post-trigger recording in a
Conventional recording. It also allows adjustment of
the location of the trigger within the defined buffer.
You can adjust the Triggering Position between 1 and
99% post-Trigger. Trigger Position is available only when Manual
Trigger or Event Trigger is selected as Recording type.
As an example, if the buffer size is set to 16MB, then for the following
Trigger Position settings, the amount of pre- and post-Trigger data is
•
•
•
•
•
Note
95% post-triggering: 0.8MB pre-trigger, 15.2MB post-trigger
75% post-triggering: 4MB pre-trigger, 12MB post-trigger
50% post-triggering: 8MB pre-trigger, 8MB post-trigger
25% post-triggering: 12MB pre-trigger, 4MB post-trigger
5% post-triggering: 15.2MB pre-trigger, 0.8MB post-trigger
When a Trigger occurs, recording continues until the post-Trigger
amount of the buffer is filled.
5.5 Save As Multisegment Trace
This option causes the
analyzer to segment the
trace into multiple files
and create an index file called data.mlt that summarizes the starting and
finishing frame for each segment.
56
CATC
FCTracer4G and FCTracer User’s Manual
SW Version 2.10
This option is useful for very large recordings and for host PCs with limited
memory. In the latter case, multi-segmenting gives a PC with limited
memory a way to open recordings that would otherwise be too large to open.
The only downside to multi-segmenting is that limits the scope of reports
such as Traffic Summary, Bus Utilization, and Error Summary to each of
the segments. You will not be able to perform summary statistics on the full
recording.
The default value for this option is 64 MB. Before attempting large
recordings, it is recommended that you play with this number to see what
value best suits your needs.
To create a multisegmented trace,
Step 1
Check the box marked Save As Multisegmented Trace.
Step 2
Set the file size for each segment in the box marked MB Segments.
File Structure for Segmented Files
Multisegmenting produces an index file and segmented trace files. The
default name of the index file is dataXYZ.mlt, where XYZ is the last three
digits of the analyzer’s serial number. (You can see the unit’s serial number
by selecting Help > About FCTracer.) Thus, for example, if you had an
analyzer with the serial number 111, the index file would be called
data111.mlt.
The index file and the segmented trace files are stored in a directory named
after the index file. The directory is named indexfilename_mlt_files. For
example, if the index file is named data111.mlt, the directory will be named
data111_mlt_files. Below this directory additional, sequentially numbered
sub-directories (up to 100,000) that house the segmented trace files. These
sub-directories bear simple numerical names: 00000 - 00999. Each of these
subdirectories can hold up to 100 sequentially-numbered segment files.
Collectively, the entire directory structure can hold up to 10 million files.
Example
A 1010 MB recording using 10 MB segments and the default file names will
create the following sub-directories and files. The example below uses the
serial number 111:
• data111.mlt This is the index file.
• data111_mlt_files\00000\segment_00000.fct
• data111_mlt_files\00000\segment_00001.fct
...
• data111_mlt_files\00000\segment_00099.fct
57
CATC
FCTracer4G and FCTracer User’s Manual
SW Version 2.10
• data111_mlt_files\00001\segment_00100.fct
• data111_mlt_files\00001\segment_00101.fct
The index file looks something like a trace file but contains packet-like
entities that summarize each 10 MB segment.
When uploading is complete, the index file will be opened. Each "packet"
in this file corresponds to one of the numbered segments. Double clicking
on the packet will open the corresponding segment file.
Multisegement Toolbar
When an index file is opened like the one shown above,
the Multisegment Toolbar will display. This toolbar lets you navigate the
index file.
Open first segment in
multisegment trace.
Open previous segment
in multisegment trace.
Open index file. This
button becomes active if
a multisegment trace file
is open.
Open next segment in
multisegment trace.
Open last segment in
multisegment trace.
5.6 Spooled Recordings
In a Spooled recording, uploading commences from the analyzer to the host
PC when the recording is begun. As traffic is uploaded, the analyzer
memory is freed - creating space for recording additional traffic. Recording
can thus continue for long periods of time, and create file lengths well in
excess of 2 GBs.
58
CATC
FCTracer4G and FCTracer User’s Manual
SW Version 2.10
Recording Size
With Spooled Recordings, you are given the option of setting the recording
length based on time or on the recording size.
Record for - Enter the duration of the recording in days, hours, minutes,
and seconds.
Record - Enter the amount of traffic (in MB) that you want the analyzer to
record. Selecting this option will create a fixed length recording that begins
as soon as you click the REC button on the menu bar.
Until Triggered, plus - Enter the amount of traffic (in time) that you want
the analyzer to record following an event trigger. Recording time units are
days, hours, minutes, and seconds.
Until Triggered, plus - Enter the amount of traffic (in MB) that you want
the analyzer to record following an event trigger. You select event triggers
in the Recording Rules page -- see “Recording Options - Recording
Rules” on page 63 for details.
Spooled Recordings - Performance Issues
During a spooled recording if the analyzer buffer fills faster than the trace
can be uploaded to the host PC, the analyzer will briefly suspend recording
until some of the buffer is free. When recording is suspended, gaps will
appear in the trace. These gaps will appear as entries in the trace.
During the recording, you can see if gaps are likely to happen by reading the
status bar at the bottom of the screen.
The Status bar has two fields that you can use to determine if gaps are
occurring or are about to occur.
gaps - Shows how many gaps have occurred. In the example above, two
gaps have occurred.
Hardware Buffer - shows you how full the analyzer buffer is and if the
analyzer is currently dropping packets. In the example above, Hardware
Buffer field shows that the buffer is full (shown by the thick green graph)
and that the analyzer is currently dropping packets (shown by thin red line
atop of the green graph.)
59
CATC
FCTracer4G and FCTracer User’s Manual
SW Version 2.10
Preventing Gaps
Gaps can be caused by a number of factors - the number of channels being
recorded, the absence of filtering, the performance of the host PC (for
example, is it using USB 2.0 to upload traffic?), and the amount of traffic
produced by the devices under test.
There are several ways to prevent gaps. You will need to experiment with
your setup to determine what works best for you. You might try filtering
out primitives, turning on data truncation (for example to 10 Dwords) and
filtering out LISMs. If you want to record primitives, it is recommended
that you enable primitive packing.
5.7 Recording Options - Miscellaneous
The Miscellaneous page in the Recording Options dialog box lets you set
bitrates, loopback and other conditions on a channel-by-channel basis.
Note
The following screenshots of the Miscellaneous page for are
FCTracer 4G. The FCTracer Miscellaneous page shows eight
channels and omits the 4G options.
60
CATC
FCTracer4G and FCTracer User’s Manual
SW Version 2.10
Rate Control
The Rate Control option allows you to specify the capture rate used by
FCTracer. By default, FCTracer autonegotiates the transfer speed on the
link and records data at both 1 and 2 Gbps transmitted speed.
Note - Selecting these speeds has no effect on the actual speed of the link.
These speeds only effect how the FCTracer analyzes the traffic.
•
•
•
•
•
Auto Detect 1/2 Gbps - Select this option to allow the analyzer to
auto-detect a 1 or 2 Gbps transmission rate.
Auto Detect 2/4 Gbps - This is the default Rate Control setting. Select
this option to allow the analyzer to auto-detect a 2 or 4 Gbps transmission
rate. This is the default Rate Control setting.
Force 1Gbps - Select this capture rate to switch the FCTracer analysis
hardware into 1Gbps recording mode. This option is useful for restricting
the analysis to 1Gbps transfers by preventing the recording of any signals
transmitted at the higher 2Gbps and 4 Gbps rates.
Force 2Gbps - Select this capture rate to switch the FCTracer analysis
hardware into 2Gbps recording mode. This option is useful for restricting
the analysis to 2Gbps transfers by preventing the recording of any signals
transmitted at the 1Gbps and 4 Gbps rates.
Force 4 Gbps - Select this capture rate to switch the FCTracer analysis
hardware into 4Gbps recording mode. This option is useful for restricting
the analysis to 4Gbps transfers by preventing the recording of any signals
transmitted at the 1Gbps and 2 Gbps rates.
Channel Presence
Channel Presence is a global setting that allows you to include or exclude
individual channels from the recording. When you select Inhibit for a
specific channel, no traffic received on that channel will be recorded. This
option is useful for eliminating unnecessary channels from the analysis and
increasing memory available for the remaining channels.
61
CATC
FCTracer4G and FCTracer User’s Manual
SW Version 2.10
Primitive Recording Control
Use this setting to disable the recording of Idles or Primitive Packing.
•
•
Recording of IDLEs Is On - Select this option to enable the recording of
IDLE primitives in a trace. Although IDLEs are not important in
performing protocol level analysis they might be needed for verifying
certain compliances to the Fibre Channel Specification. All data frames
must be separated by a minimum of three IDLE primitives for use in
clock rate matching. Under normal use, this option can be disabled.
Primitive Packing Is On - Select this option to enable packing of up to
256 primitives per recording entry. This feature can be used to
significantly reduce the amount of recording memory used for storing
primitives.
Loopback Control
Use these options to set loopback control for the various channels.
•
•
Channel Pair Loopback - This is the most common configuration of the
FCTracer module. In this mode, the channel pairs designated in
silkscreen on the face plate work together as a transmit and receive pair.
Channel pairs include (1, 2) and (3, 4). The data received on one channel
is retransmitted out the other channel of that pair.
Channel Pair Loopback configuration allows you to place FCTracer
between two nodes on a link such as between an HBA and a switch. You
connect one device to one of FCTracer’s paired channels and the other
device to the other paired channel - for example, Channels 1 and 2. The
internal loopback between the channel pairs of FCTracer ensure that
these devices communicate as if the analyzer was not present.
Single Channel Loopback - In this mode, each channel has a loopback
of the RX signal back to the TX output of the same channel. This
configuration can be used to monitor traffic coming from a single Fibre
Channel device. The device being probed will receive back the exact
traffic that it has transmitted.
This mode can also be used to probe traffic on an arbitrated loop. By
plugging one channel of the FCTracer into one channel of a Fibre
Channel hub, the analyzer can monitor traffic on that hub. In this mode,
62
CATC
•
FCTracer4G and FCTracer User’s Manual
SW Version 2.10
the FCTracer is physically part of the FC-AL loop, but does not
participate as a node.
Loopback Disabled - In this mode, the FCTracer can record traffic
received on each channel, but the TX output of each channel is disabled.
This mode is used to probe traffic on a Fibre Channel hub without being
part of the FC-AL loop. To use this mode, connect one channel of
FCTracer to one port of a Fibre Channel hub. FCTracer will be able to
monitor traffic on the hub, but since no data comes from the FCTracer,
the Hub will bypass that channel and the FC-AL loop will persist as if
FCTracer is not connected to the Hub. This mode may be useful in rare
scenarios where the timing or delays which exist in the FC-AL loop are
effecting correct operation. FCTracer can be used in this scenario to
monitor traffic without effecting the overall delay associated with the
loop.
To perform loopback, FCTracer utilizes an analog port bypass circuit.
The signal is not re-timed using PLL circuits, but is re-amplified by both
the port bypass circuit and an SFP module.
5.8 Recording Options - Recording Rules
The Recording Rules page lets you set triggers and filters. The page divides
into following areas:
•
•
Toolbar - Contains buttons that control the Recording Rules page.
Available Events area -- Part of the screen where you can park
buttons that you intend to use in the Main display area
63
CATC
FCTracer4G and FCTracer User’s Manual
•
•
•
SW Version 2.10
Main display area -- Part of the screen where you create trigger
and filter conditions. You create conditions by dragging buttons
onto the Main display area from the Available Events area. You
then create additional conditions by right-clicking on a button and
selecting options from a pop-up menu.
Config Status Indicator (shown top right) - A button that tells you
if your configuration is valid or invalid. When Events have been
correctly configured, the button will turn green and display the text
Config is Valid. When the configuration is incorrect, the button
will turn red and display the text Config is Invalid.
Pop Up Menus (not shown) - Right-clicking on button or area in
the Recording Rules page will access a context-sensitive pop-up
menu containing most of the commands listed in the toolbar.
5.9 Recording Rules Toolbar
The Recording Rules toolbar exposes functionality for controlling the
Recording Rules page.
New Event. Creates a new event in the Available Events area.
A set of cascaded menus will pop up.
Delete Event. Deletes selected event.
Undo. Undoes last change made to Recording Rules page.
The undo buffer has unlimited depth.
Redo. Repeats changes undone by the Undo button.
Zoom In. Enlarges the display. There are five zoom levels.
The default level is the middle one. If you have a wheel
mouse, you can also zoom by holding down the Control key
and then operating the mouse wheel.
Zoom Out. Makes the display appear smaller.
Show/Hide channels. When pressed, this button tells the
Recording Rules dialog to show the channel buttons on the
Events icons. When unpressed, the channels are hidden.
64
CATC
FCTracer4G and FCTracer User’s Manual
SW Version 2.10
Show/Hide Properties Dialog. Shows or hides the Properties
dialog of the selected State/Event/Action.
Config is valid. This message display when the current
Recording Rules configuration can be executed by the
hardware. When the configuration is incorrect, the message is
replaced by "Config is incorrect."
Config is incorrect. This message displays when the current
Recording Rules configuration exceeds hardware limitations.
The message gets updated every time the Recording Rules
configuration changes. You can click this indicator to get the
diagnostics message box to find the problem.
5.10 Recording Rules Page - How it Works
The Recording Rules page can be thought of as a chalk board where you
create a graphical model of the events and actions. In essence, you are
creating a visual representation of the rules that the analyzer should follow
during a recording when it encounters events that you specify.
You can create simple or complex rules.
Creating a rule involves four steps:
Step 1
Create event buttons.
Step 2
Click the small buttons on the Event buttons to select the channels
that the analyzer should record.
Step 3
Move the Event buttons to the Main Display area.
Step 4
Assign an action such as Trigger to the events buttons.
Creating Event Buttons
To create a rule, you start by creating one or more Event buttons. When you
create Event buttons they are automatically parked in the Available Events
area. The following steps show the process.
Step 1
Click the New Event button.
A menu of Events displays.
Step 2
Select an Event from the menu. The selected Event will appear in
the Available Events area.
Step 3
To move the button to the main display area, drag the event button.
65
CATC
FCTracer4G and FCTracer User’s Manual
SW Version 2.10
Selecting a Channel
At the bottom of each event button are eight small buttons
that represent analyzer channels. Selecting a channel
button tells the analyzer which channels it should watch. For example, if
you depress all of the buttons except for the button marked "6," it means
"search all channels except for channel 6."
Dragging a Button to the Main Display Area
When you drag an event button to the main display area, there are two places
you can put the button: in a cell marked "Global State" and in another
marked "Drag an event here to add an event sequence."
Global State - This cell is a placeholder for rules that are active throughout
the recording. If you place an event button here such as Error and then
assign an action such as Trigger, the analyzer will always look for Errors
and trigger when an error is found.
Drag an event here to add an event sequence - This cell is used to created
conditional rules called Event Sequences. An Event Sequence is a chain of
events leading to some outcome such as triggering - such as "If x is followed
by y, trigger."
These cells are explained in greater detail in “Using the Global State Cell”
on page 89 and in “Using Sequence Cells” on page 93.
Assigning an Action
When an event button has been placed in one of the cells in the main display
area, you are not done - you still need to assign an action to the button.
Note
If you do not assign an action to an event button, the analyzer will
ignore the selected event.
To assign an action to an event button,
Step 1
Right-click on the button. A pop-up menu appears:
66
CATC
FCTracer4G and FCTracer User’s Manual
SW Version 2.10
Step 2
Select Specify Action and then an action from the sub-menu. The
menu closes and the action is assigned.
Note
The menu is context-sensitive. If you right-click a button that is in
the cell marked "Drag an event here to add a new sequence," you
will get additional options.
Note
You can also set actions within the Properties dialog for each event.
Double-click on the Event button to open the Properties dialog, then
select the Actions tab and set your actions.
5.11 Pop-up Menus
The pop-up menu are context-sensitive and will display different options
depending on the object you have clicked.
State Pop-up
If you click on a State cell, you will get
the following pop-up menu:
New Event - Brings up the same menu
that you get when you click the New Event button on the toolbar.
Properties - Brings up the State Properties dialog for the selected state.
Action Pop-up Menu
If you click on an Action button, you will get
the following pop-up menu:
Trigger - Sets or clears Trigger action.
Filter In - Sets or clears Filter In action. This
option precludes the use of Filter Out.
Filter Out - Sets or clears the Filter Out action.
This option precludes the use of Filter In.
67
CATC
FCTracer4G and FCTracer User’s Manual
SW Version 2.10
Advance the Sequence - Creates an event sequence
consisting of the event you clicked on and some
subsequent event. A thick arrow will appear from the
selected event and point downward. If you place an
event button below the arrow, the analyzer will look
for the first event followed by the second event.
Restart the Sequence - Restarts the event sequence.
This menu option is context-sensitive. and will only
appear if you have created an event sequence. A thick
arrow will appear from the selected event and point
upward towards the preceding button.
Restart All - Restarts all rules in all
sequences and in the global state. When
you select this option, an arrow and Restart
All button will appear. This action
precludes selecting Advance the Sequence and Restart the Sequence.
External Trigger Pulse HIGH, Pulse LOW, Pulse TOGGLE - Causes
the event send an external signal out through the External Out port on the
back of the UPAS. The shape of the signal (Pulse HIGH, Pulse LOW or
Pulse TOGGLE) must be the same for all events sending out such signal.
This means that if you change the output signal for one event, it will
automatically change the signal for all other events sending output signals.
Properties - Displays the Action Properties dialog for the selected state.
Event Pop-up Menu
If you click on an Event button, you will get the
following pop-up menu:
Specify Action(s) - opens a sub-menu with the
following options:
• Trigger - Triggers end of recording.
Recording continues until post-trigger buffer
is expended. Buffer settings are controlled by
the Recording Options - General page.
• Filter Out - Excludes selected traffic from recording. Filtering
preserves recording memory, thereby extending recording sessions and
excluding events of little interest.
• Filter In - Includes selected traffic in recording.
• External Trigger Pulse HIGH - Sends an output signal with a Pulse
High format through the output ports on the back of the UPAS. Pulse
68
CATC
FCTracer4G and FCTracer User’s Manual
SW Version 2.10
High is the default format. Pulse High causes the analyzer to transmit a
5 volt, 40 nanosecond signal.
• External Trigger Pulse LOW - Sends an output signal with a Pulse
Low format through the output ports on the back of the UPAS. Pulse
Low causes the analyzer to transmit a 0 volt, 40 nanosecond signal.
• External Trigger Pulse TOGGLE -This format causes the analyzer to
transmit a signal that will toggle with each trigger event between a
continuous 5 volt signal and a continuous 0 volt signal.
Add Counter - Displays the Event Properties dialog with the Counter
selected and ready to accept the count value. The menu item is not shown
if the counter is not applicable to the selected event. If the counter is already
specified this menu item is replaced with Don’t Use Counter and Change
Counter Value.
Move Event To - Moves selected event to a different position in the
Recording Rules window.
Copy Event To - Copies selected event to a different position in the
Recording Rules window.
Delete this Event - Deletes the selected Event. Alternatively, you can use
the Delete button on the toolbar or keyboard to delete events.
Properties - Opens a dialog box and lets you specify further sub-types (for
example, types of errors) and additional conditions for the selected event.
69
CATC
FCTracer4G and FCTracer User’s Manual
SW Version 2.10
5.12 Events
To see the list of selectable events, click the New Events button.
The following table shows the types of Events available for selection:
Category
FC Bus Event
Event
Parameters to Set
Data Pattern
Specify Mask-Match pattern for
any part of the Frame
Primitive
Select one or more of the 15 FC
Primitives
Advanced Primitive
Specify parameters for any one of
the 15 FC Primitives
Error
Select 1 or more of 10 error types
Any Data Frame
EOF
Any Data Frame
Any Primitive
Connect
Disconnect
LISM
LIFA
LIPA
FC Loop Initialization
LIHA
LISA
LIRP
LILP
NOP
ABTS
FC Basic Link Services
RMC
BA_ACC
BA_RJT
PRMT
70
CATC
Category
SCSI Operations
FCTracer4G and FCTracer User’s Manual
SW Version 2.10
Event
Parameters to Set
XFER_RDY
Specify XFER_RDY params
DATA
Specify up to 8 Dwords of FCP
Data
RSP
Specify RSP parameters
CONF
Extended CDBs
Listed under "FCP_CMND"
below
SCSI Primary Command set
(SPC-3)
Listed under "FCP_CMND"
below
SCSI Block Command set
(SBC-2)
Listed under "FCP_CMND"
below
SCSI Media Changer Command
set (SMC-2)
Listed under "FCP_CMND"
below
FCP_CM ND:
0 x0 0
0 x0 1
0 x0 3
0 x0 4
0 x0 5
0 x0 7
0 x0 8
0 x0 A
0 x0 B
0 x0 F
0 x1 1
0 x1 2
0 x1 4
0 x1 5
0 x1 6
0 x1 7
0 x1 A
0 x1 B
0 x1 C
0 x1 D
0 x1 E
0 x2 5
0 x2 8
0 x2 9
0 x2 A
0 x2 B
0 x2 C
0 x2 D
0 x2 E
0 x2 F
0 x3 3
0 x3 4
0 x3 5
0 x3 6
0 x3 7
0 x3 8
0 x3 B
0 x3 C
0 x3 D
0 x3 E
0 x3 F
0 x4 1
0 x4 4
0 x4 C
0 x4 D
T E S T U N IT R E A D Y
R E W IN D
REQUEST SENSE
F O R M A T U N IT
R E A D B L O C K L IM IT S
R E A S S IG N B L O C K S
R E A D (6 )
SEND
S E T C A P A C IT Y
R E A D R E V E R S E (6 )
S P A C E (6 )
IN Q U IR Y
RCVR BUFFERED DATA
M O D E S E L E C T (6 )
R E S E R V E (6 )
R E L E A S E (6 )
M O D E S E N S E (6 )
S T A R T S T O P U N IT
R E C E IV E D IA G R E S U L T S
S E N D D IA G N O S T IC
P R E V E N T A L LW M D M R M V L
R E A D C A P A C IT Y (1 0 )
R E A D (1 0 )
R E A D G E N E R A T IO N
W R IT E (1 0 )
S E E K (1 0 )
E R A S E (1 0 )
READ UPDATED BLO CK
W R IT E A N D V E R IF Y (1 0 )
V E R IF Y (1 0 )
S E T L IM IT S (1 0 )
P R E -F E T C H (1 0 )
S Y N C C A C H E (1 0 )
L O C K -U N L C K C A C H E (1 0 )
R E A D D E F E C T D A T A (1 0 )
M E D IU M S C A N
W R IT E B U F F E R
READ BUFFER
UPDATE BLO CK
READ LO NG
W R IT E L O N G
W R IT E S A M E (1 0 )
REPO RT DNSTY SUPRT
LO G SELECT
LO G SENSE
71
0 x 5 0 X D W R IT E (1 0 )
0 x 5 1 X P W R IT E (1 0 )
0 x 5 2 X D R E A D (1 0 )
0 x 5 3 X D W R IT E R E A D (1 0 )
0 x 5 5 M O D E S E L E C T (1 0 )
0 x 5 6 R E S E R V E (1 0 )
0 x 5 7 R E L E A S E (1 0 )
0 x 5 A M O D E S E N S E (1 0 )
0 x 5 E P E R S IS T E N T R E S E R V E IN
0 x 5 F P E R S IS T E N T R E S E R V E O U T
0 x7 F E X T E N D E D C D B
0 x 8 0 X D W R IT E E X T E N D E D (1 6 )
0 x 8 1 R E B U IL D (1 6 )
0 x 8 2 R E G E N E R A T E (1 6 )
0 x8 3 E X T E N D E D C O P Y
0 x 8 4 R E C E IV E C O P Y R E S U L T S
0 x 8 8 R E A D (1 6 )
0 x 8 A W R IT E (1 6 )
0 x 8 C R E A D A T T R IB U T E
0 x 8 D W R IT E A T T R IB U T E
0 x 8 E W R IT E A N D V E R IF Y (1 6 )
0 x 8 F V E R IF Y (1 6 )
0 x 9 0 P R E -F E T C H (1 6 )
0 x 9 1 S Y N C C A C H E (1 6 )
0 x 9 2 L O C K -U N L C K C A C H E (1 6 )
0 x 9 3 W R IT E S A M E (1 6 )
0 x 9 E R E A D C A P A C IT Y (1 6 )
0 xA 0 R E P O R T L U N S
0 x A 3 R E P O R T D E V IC E ID
0 x A 4 S E T D E V IC E ID E N T IF IE R
0 x A 5 M O V E M E D IU M
0 x A 6 E X C H A N G E M E D IU M
0 x A 7 M O V E M E D IU M A T T A C H E D
0 x A 8 R E A D (1 2 )
0 x A A W R IT E (1 2 )
0 x A C E R A S E (1 2 )
0 x A E W R IT E A N D V E R IF Y (1 2 )
0 x A F V E R IF Y (1 2 )
0 x B 3 S E T L IM IT S (1 2 )
0 xB 4 R E A D E L M N T S T S A T T C H
0 xB 5 R E Q S T V O L E L M N T A D D R
0 xB 6 S E N D V O L U M E T A G
0 x B 7 R E A D D E F E C T D A T A (1 2 )
0 xB 8 R E A D E LE M E N T S T A T U S
CATC
FCTracer4G and FCTracer User’s Manual
SW Version 2.10
5.13 Properties Dialogs
Double-clicking on a Event, Action, or State button will cause a Properties
dialog box to appear. The Properties dialog displays options for setting
additional conditions for a selected Event, Action or State.
Event Properties Dialog
The Event Properties dialog is invoked by double-clicking an event,
right-clicking an event and selecting Properties from the pop-up menu, or
clicking on the Properties button on the toolbar.
Event Icon Preview - This icon shows you which event properties you are
editing. The Icon Preview looks exactly like the icon in the Main Display
area.
Icon Label - A text box for labeling the button. Whatever you type here will
appear on the button.
Channels - These controls allow you to select the channel(s) that the
analyzer should search when it is looking for the event.
Counter - A counter tells the analyzer to search for x instances of the
selected event. For example, if you enter "10," the analyzer will count 10
instances of the selected event before it performs whatever action you
assign. There are only two counts available in the hardware so if you try to
assign more than two, you will get a warning.
Note
Counters can not be applied to events with Filter Actions. The
maximum counter value is 65,535.
72
CATC
FCTracer4G and FCTracer User’s Manual
SW Version 2.10
Negation - Tells the hardware to match the opposite of the event. For
example, if you select NOT for Errors Event, the match will occur on Error
types that are not checked. If you select NOT for a SCSI command, the
match will occur on any FCP_CMND except for the selected one, and also
on the selected one if the additional parameters do not match.
Pin Button - Allows you to "pin" the Properties dialog box to the
application so that it does not go away when another object appears such as
an event, state or action.
Description String - This area contains a textual description of the event.
Event-specific Settings - The largest part of the Event Properties dialog
box. Selecting an option narrows the range of events that the analyzer will
search for.
The settings in this area vary depending on the selected events. There are
three basic formats:
• Checkboxes
• List
• Pattern Editor
Checkboxes and Lists (shown below) present lists of options. Selecting
one or more options tells the analyzer what event(s) to look for.
A properties dialog box showing checkbox options.
A properties dialog showing list options.
73
CATC
FCTracer4G and FCTracer User’s Manual
SW Version 2.10
The Pattern Editor presents text boxes in which Mask-Match values can
be entered for any of the data fields. The "XXX" value means that the
particular bit is being ignored by the hardware when trying to match a data
pattern.
Some text boxes contain blue field headings that indicate the presence of
menus or hex-to-binary converters. If a menu is contained, clicking the blue
heading will open it as shown below. If a hex converter is contained, a box
will open. Typing a hex value into the box and then hitting <return> will
convert the hex value to binary.
Properties dialog showing a drop-down menu.
Properties dialog showing a hex-to-binary converter.
74
CATC
FCTracer4G and FCTracer User’s Manual
SW Version 2.10
Actions Tab - At the top of each properties dialog is a tab marked Actions
that presents options such as triggers to be set.
5.14 Event Properties Dialog Boxes - Descriptions
Each Event button has a different Properties dialog box. And each
Properties dialog box has a different set of options.
This section describes the Event Properties dialog boxes and their options.
The dialogs will be described in the order that they appear in the New Events
menu:
•
•
•
•
•
FC Bus Event
FC Loop Initialization
FC Basic Link Services
FC Extended Link Services
SCSI Operations
75
CATC
FCTracer4G and FCTracer User’s Manual
SW Version 2.10
FC BUS EVENT
Data Pattern Properties Dialog
Presents options for triggering or filtering on user-defined data patterns.
Clicking a blue heading will open a box with either a menu or a
hex-to-binary converter. If NOT is checked, any unchecked data pattern
will generate an event match.
Primitive Properties Dialog
Presents options for triggering or filtering on various Primitive types. If
NOT is checked, any unchecked primitive will generate an event match.
Advanced Primitive Properties Dialog
Presents options for selecting a Primitive type and additional data using a
Mask-Match byte text box. Enter the values, then press enter. Note that the
icon’s color changes according to the selected primitive. The primitive
colors are specified only in Display Options. If NOT is specified an event
76
CATC
FCTracer4G and FCTracer User’s Manual
SW Version 2.10
match will be generated in one of two cases: (a) when a primitive other then
selected occurs, and (b) when selected primitive occurs that doesn’t satisfy
the specified Mask-Match condition.
Error Properties Dialog
The Error Properties dialog box lets specific error types to be selected for
performing an action such as triggering.
Packet Errors
Alignment - An error in the 32-bit data alignment.
Symbol - An Error in symbol integrity. A symbol integrity error can happen
if any of 10-bit symbol is received is not one of the legal 10-bit encoding for
the type of data expected.
Delimiter - A sequence error in the frame delimiters SOF and EOF. If two
SOF delimiters or two EOF delimiters are received in a row, this error will
be flagged.
EOF - An EOF Invalid or EOF Abort Delimiter has been received
indicating receipt of an invalid frame.
77
CATC
FCTracer4G and FCTracer User’s Manual
SW Version 2.10
Disparity - A running disparity error.
CRC - A CRC error.
Idle Errors
Symbol - An Error in symbol integrity. A symbol integrity error can happen
if any of 10-bit symbol is received is not one of the legal 10-bit encoding for
the type of data expected.
Disparity - A running disparity error in the idle codes.
Spacing - A spacing error in which fewer than two primitives are received
between frames. These primitives are necessary to allow for compensation
of transmitter and receiver clock frequencies.
Primitives - A Primitive Sequence error in which a Primitive Sequence is
received with fewer than three consecutive instances of that ordered set.
EOF Properties Dialog
Presents options for triggering or filtering on various End of Frame types.
Click the blue heading to open a menu of EOF types. If NOT is checked,
any unchecked primitive will generate an event match.
78
CATC
FCTracer4G and FCTracer User’s Manual
SW Version 2.10
Properties Dialogs - Any Data Frame, Primitive, Connect, Disconnect
The Properties dialogs for Any Data Frame, Primitive, Connect, and
Disconnect are all the same dialog but have the relevant option selected. If
NOT is checked, any unchecked event will generate an event match.
FC LOOP INITIALIZATION
FC Loop Initialization commands are displayed in a single properties dialog box
shown below. Commands are presented in a menu. If NOT is checked, any
unchecked event will generate an event match.
79
CATC
FCTracer4G and FCTracer User’s Manual
SW Version 2.10
FC BASIC LINK SERVICES
Double-clicking on any of the FC Basic Link Services event buttons will
display a single properties dialog box shown below. Commands are
presented in a menu. If NOT is checked, any unchecked event will generate
an event match.
FC EXTENDED LINK SERVICES
Double-clicking on any of the FC Extended Link Services event buttons
will display a single properties dialog box shown below. Commands are
presented in a menu. If NOT is checked, any unchecked event will generate
an event match.
80
CATC
FCTracer4G and FCTracer User’s Manual
SW Version 2.10
SCSI OPERATIONS
XFR_RDY
The XFR_RDY properties dialog box presents two pattern editor boxes that
can be edited directly or indirectly via a hex-to-binary converter. To open
the converter, click the blue headings and enter a hex value. The converter
will translate the hex to binary.
If NOT is checked, any unchecked event will generate an event match.
Data
The FCP_Data properties dialog box presents pattern editor boxes that
accept binary values. Entering a value tells the analyzer to match the
specified pattern.
If NOT is checked, any unchecked event will generate an event match.
81
CATC
FCTracer4G and FCTracer User’s Manual
SW Version 2.10
FCP
The XFR_RDY properties dialog box presents pattern editor boxes that can
be edited directly or indirectly via a hex-to-binary converter. Entering a
value tells the analyzer to match the specified pattern. To open the
converter, click the blue headings and enter a hex value. The converter will
translate the hex to binary.
If NOT is checked, any unchecked event will generate an event match.
Conf
The FCP_CONF event properties dialog presents options for setting
actions.
Extended CDBs
The properties dialogs for all of the Extended CDBs events present binary
pattern editors for entering patterns. These editors also have a hex-to-binary
converter which can be accessed by clicking the blue headings.
82
CATC
FCTracer4G and FCTracer User’s Manual
SW Version 2.10
If NOT is checked, any unchecked event will generate an event match.
SCSI Primary Command Set (SPC-3)
The properties dialogs for the SCSI Primary Command Set (SPC-3)
events present binary pattern editors for entering patterns. These editors also
have a hex-to-binary converter which can be accessed by clicking the blue
headings.
If NOT is checked, any unchecked event will generate an event match.
SCSI Block Command Set (SBC-2)
The properties dialogs for the SCSI Block Command Set (SBC-2) events
present binary pattern editors for entering patterns. These editors also have
a hex-to-binary converter which can be accessed by clicking the blue
headings.
83
CATC
FCTracer4G and FCTracer User’s Manual
SW Version 2.10
If NOT is checked, any unchecked event will generate an event match.
SCSI Media Changer Command set (SMC-2)
The properties dialogs for the SCSI Media Changer Command set
(SMC-2) events present binary pattern editors for entering patterns. These
editors also have a hex-to-binary converter which can be accessed by
clicking the blue headings.
If NOT is checked, any unchecked event will generate an event match.
SCSI Stream Command set (SSC-2)
The properties dialogs for the SCSI Stream Command set (SSC-2)
(SMC-2) events present binary pattern editors for entering patterns. These
editors also have a hex-to-binary converter which can be accessed by
clicking the blue headings.
84
CATC
FCTracer4G and FCTracer User’s Manual
SW Version 2.10
If NOT is checked, any unchecked event will generate an event match.
SCSI Stream Command set (SSC-2)
The properties dialogs for the SCSI Stream Command set (SSC-2)
(SMC-2) events present binary pattern editors for entering patterns. These
editors also have a hex-to-binary converter which can be accessed by
clicking the blue headings.
If NOT is checked, any unchecked event will generate an event match.
85
CATC
FCTracer4G and FCTracer User’s Manual
SW Version 2.10
SWITCH FABRIC INTERNAL LINK SERVICES
The properties dialogs for all of the Switch Fabric Internal Link Services
are all one and the same - a dialog with a menu for the various Link Services.
If NOT is checked, any unchecked event will generate an event match.
86
CATC
FCTracer4G and FCTracer User’s Manual
SW Version 2.10
BREAKOUT BOARD PROPERTIES DIALOG
The Breakout Board properties dialog allows a Mask-Match pattern to be
specified for the Breakout Board. The pattern tells the analyzer what
external input signal to look for. The NOT checkbox is not available for
the Breakout Board event.
TIMER PROPERTIES DIALOG
The Timer properties dialog allows the value for a timer to be set. Setting a
timer tells the analyzer to wait for the specified time until performing an
action. For example, you could set the analyzer to wait 1 second after an
error before triggering.
The Timer properties dialog allows the time interval to be set. Time units
are seconds, milliseconds, microseconds, and nanoseconds. The actual
timer value is shown below the edit controls and reflects the hardware
precision capabilities. The time is rounded up to the next 7.519 nanosecond
sample, which corresponds to the 1.33 MHz internal clock frequency.
87
CATC
FCTracer4G and FCTracer User’s Manual
SW Version 2.10
5.15 Assigning Actions
As described above, you assign an action by
right-clicking on an Event button and then selecting a
command from the ensuing pop-up menu. The selected
action will be represented by a button to the right of the Event button.
The following table shows the types of Actions you can select.
Category
Action
Trigger Actions
TRIGGER
Comment
FILTER OUT
Can’t be assigned to the
events with Counters. Can’t
be used for Timers.
Filter Actions
FILTER IN
Control Actions
ADVANCE SEQUENCE
(shown as a fat arrow)
Can’t be used for the events
in Global State. When
sequence is advanced all
rules in the old state getting
disabled and all rules in the
new state are getting
initialized (timers restarted,
counters recharged etc.)
RESTART SEQUENCE
(shown as a fat arrow)
Can’t be used for the events
in Global State or for the
events in the first state of a
sequence. When sequence
is restarted all rules in the
old state getting disabled
and all rules in the first state
are getting initialized (timers
restarted, counters
recharged etc.)
RESTART ALL
When Recording Rules are
restarted all rules in all
sequences getting
reinitialized (timers restarted,
counters recharged etc.). All
sequences start from the
first state.
EXT. PULSE HIGH
All External Triggering
Events have to be of the
same type.
External Triggering EXT. PULSE LOW
EXT. PULSE TOGGLE
88
CATC
FCTracer4G and FCTracer User’s Manual
SW Version 2.10
5.16 Using the Global State Cell
The Global State cell is used to create
conditions that are active at all times.
You can think of these conditions as
the default conditions. The Global
State cell is used to create simple
event triggers and filters such as "Trigger when an xxx error occurs," or
"filter out all xyz primitives.") For most simple trigger conditions, this is the
appropriate cell to use.
Example - Creating a Simple Event Trigger
To create a simple condition that is active at all times, place an event button
in the Global State cell:
Step 1
Click the New Event button. An
Events menu opens (shown right).
Step 2
Select an event from the menu. The
event will appear as a button in the
Available Events area on the left.
Step 3
Drag the event button to the cell
marked "Global State."
Step 4
Right-click on the button (i.e., not the
cell). A pop-up menu appears.
Step 5
Select Trigger from the menu. An
arrow will project from the error
button and point to a cell marked Trigger.
Creating Multiple Event Conditions in the Global State Cell
When multiple buttons are placed in the Global Cell, it creates an "AND"
condition or an "OR" condition depending on the actions selected.
Creating an OR Condition - When two or more buttons in the Global State
cell are assigned the same action, the analyzer will search for all of the
events and perform the action on which ever event it sees first. The example
below illustrates. It reads "Trigger if an error or a primitive occurs".
89
CATC
FCTracer4G and FCTracer User’s Manual
SW Version 2.10
Creating an AND Condition - When multiple events are placed in the
Global State cell and assigned different actions, an AND statement is
created. The example below reads "Trigger if an error occurs AND filter out
any primitives that occur."
Filter In and Filter Out
A filter causes the analyzer to filter in or out specified events from the
recording. If events are filtered out of the recording, they are excluded and
not simply hidden from the trace. The purpose of filtering is to preserve
recording memory so you can conduct longer recording sessions and
exclude events that do not interest you.
To Filter In or Out traffic,
Step 1
Click the New Event button. The New Event menu opens.
Step 2
Select an event from the menu.
Step 3
Drag the event into the Global State cell.
Note
You could also drag it into the cell marked "Drag an event here to
add a sequence."
Step 4
Right-click on the button. A pop-up menu opens.
Step 5
Select Specify Action(s)
Step 6
Select Filter Out (for example).
The analyzer is now configured to filter out the selected event.
Filter In or Out Everything
The options Filter Out Everything or Filter In Everything allow you to
filter all traffic in or out of the trace. These options are useful in excluding
all traffic from a recording until a key event occurs. For example, "Filter out
90
CATC
FCTracer4G and FCTracer User’s Manual
SW Version 2.10
everything until you see an error. When an error occurs, filter in everything
and trigger." Such a condition would result in a trace with no pre-trigger
traffic.
To create a condition with Filter In/Out Everything, follow these steps:
Step 1
Step 2
Right-click in either an empty cell or the cell holding a button. Do
not click on a button itself. In the example below, the Global State
cell has been clicked.
Select New Event.
Step 3
Select Filter Everything Out.
Step 4
The foregoing steps outline the process of creating a Filter Out
Everything condition. Below is a more meaningful example:
This example reads "Filter out all traffic until you see an error.
When you see an error, trigger and filter in all traffic." This example
will cause the analyzer to record traffic only from the trigger event
onward. See “Creating Event Sequences” on page 93 for further
details on creating multiple-event conditions like the one above.
91
CATC
FCTracer4G and FCTracer User’s Manual
SW Version 2.10
Counting Events
In addition to setting triggers and filters, you can also set counters. A
counter is an action that allows you to set a trigger based on a count of
events. For example, you could use a counter to "Trigger following the 16th
occurrence of an error."
To use a counter, follow these steps:
Step 1
Using the steps outlined above, select an event from the Select
Event menu and drag it to the Main Display area in the center of the
dialog box.
Step 2
Click the small buttons 1-8 on the selected Event button to select the
channels for the actions.
Step 3
Right-click the event and select Add Counter. A dialog box opens.
Step 4
In the text box to the right of the label Count enter a value.
Step 5
Make sure the checkbox to the left of the word Count is checked.
Step 6
Click the X in the top right corner of the dialog box to close the
dialog. A counter button should appear below your selected event.
92
CATC
FCTracer4G and FCTracer User’s Manual
SW Version 2.10
5.17 Creating Event Sequences
Event sequences are chains of events leading to some action. A sequence is
a multi-event "if, then" condition: "If x followed by y followed by z occurs,
trigger." Event sequences are created by dragging two or more buttons to a
a cell marked Drag an event here to add a new sequence.
Note
You cannot create an event sequence in the Global State cell.
Using Sequence Cells
Below the Global State cell is a faintly
marked cell labeled "Drag an event
here to add a new sequence." This is a
Sequence Cell. Sequence cells allow
you to create event sequences.
Sequence cells support the command
Advance the Sequence (shown right).
This option allows you to link events
into sequences.
To see the Advance the Sequence command,
Step 1
Drag an event button to a Sequence cell.
Step 2
Right-click on the button. A pop-up menu appears.
Step 3
Select Specify Actions from the menu. A sub-menu appears (shown
above).
Creating Multiple Sequence Cells
By default, only one Event cell displays in the window when you begin
configuring. However, as soon as you drag a button into a Sequence cell,
additional Event cells will be automatically created.
93
CATC
FCTracer4G and FCTracer User’s Manual
SW Version 2.10
FCTracer Supports Up to Two Sequences
FCTracer supports up to two independent sequences ("Sequence 1" and
"Sequence 2") as shown below:
Sequences are made up of cells called States. A state is a stage within a
sequence that specifies what events the analyzer should look for and what
actions to apply when the event occurs.
In the example above, Sequence 1 and 2 are composed of two states each.
The maximum number of states a sequence can support is 256.
The foregoing example reads: "Search for Sequence 1 and 2 and trigger on
whichever sequence occurs first."
Sequence 1 is the more complex of the two. It reads "If you see an error
followed by an Extended Link Service (RSS), trigger. However, if during
that sequence, a FC Bus Event follows an error, restart the search at the
beginning (i.e., State 1)."
Sequence 2 reads "Trigger if you see a Primitive (actually, a sub-type of
Primitive that is not apparent in the screen) followed by Any Primitive."
How to Create an Event Sequence
To create an event sequence, you drag event buttons to the cell marked
"Drag an event here to add a new sequence," link them with the action
Advance the Sequence, then apply a trigger or other action to the end of the
chain. The following steps illustrate how to create an event sequence.
Step 1
Click the New Event button. The New Event menu opens.
94
CATC
FCTracer4G and FCTracer User’s Manual
SW Version 2.10
Step 2
Select an event type from the menu, for example an error. A button
appears in the Available Events area.
Step 3
Click the New Event button and select a second event type, for
example a Primitive. At this point, you should see two buttons in the
Available Events area.
Step 4
Drag the first button to the cell marked "Drag an event here to create
a sequence." When you finish, notice how two new cells appear in
the window as shown below the cell where you placed your button.
Step 5
Double-click on the button. A Properties dialog box opens.
Step 6
Select desired options from the dialog box, for example an error
sub-type. The options apply immediately.
Step 7
Close the Properties dialog box by clicking the X in the top right
corner. The Properties dialog box closes.
Step 8
Drag the second event button to the cell immediately below the cell
95
CATC
FCTracer4G and FCTracer User’s Manual
SW Version 2.10
occupied by your first event button. Note that an additional cell
appears marked "Drag an event here to add a sequence."
Step 9
Right-click on the first event button. A pop-up menu appears.
Note
Be sure to click on the button itself and not the cell. If you click the
cell, you will get a different menu with fewer options.
Step 10
Select Specify Actions. Notice
how this menu differs slightly
from the menu shown earlier in
this chapter. You will see three
options for advancing or
restarting a sequence:
• Advance the Sequence Draws an arrow that
connects the selected event
button to the event button below it. This option creates a
sequence.
• (Restart the Sequence) - This option appears once you have
linked two or more buttons in a sequence. This option draws an
arrow upward from the selected event button to the first button.
• Restart All - Creates an arrow pointing a cell marked "Restart
All." This option tells the analyzer to restart the search (i.e.,
Sequence 1, State1).
Step 11
Select Advance the Sequence. An arrow will appear that connects
the first button to the second.
Step 12
Right-click the second button and select Specify Actions. A
96
CATC
FCTracer4G and FCTracer User’s Manual
SW Version 2.10
sub-menu appears.
Step 13
Select Trigger. A cell will appear to the right of the second button
saying "Trigger." Your sequence configuration is now complete and
should look like this:
Using a Timer
Timers let you set a time-delay for a trigger or other action. The following
example illustrates how timers work.
This example reads "Look for a Extended Link Service LIFA. When you
see one, wait three seconds then trigger."
To create the example shown above, perform the following steps:
Step 1
Click the New Event button to open the Event menu.
Step 2
Select an event such as FC Loop Initialization (LIFA) from the
menu. An event button appears in the Available Events area.
Step 3
Drag the event button into a Sequence cell marked "Drag an event
here to add another state." Once the button is added, the cell turns
blue and acquires a title like "Sequence 1, State 1." Below the cell,
a new cell appears marked "Drag an event here to add another
state."
97
CATC
FCTracer4G and FCTracer User’s Manual
SW Version 2.10
Step 4
Click the New Events button. The Events menu opens.
Step 5
Select Timer. A Timer button appears in the Available Events list.
Step 6
Drag the Timer Button to the cell marked "Drag an event here to add
another state." The cell turns blue and acquires a title like
"Sequence 1, State 2."
Step 7
To link the two events into a sequence, right-click on the first event
(in our example, the LIFA event button). Be sure to click on the
event button and not on the cell. A pop-up menu appears.
Step 8
Select Specify Action(s). A sub-menu opens.
Step 9
Select Advance the Sequence. The menu closes and an arrow
appears that connects this cell to the State cell below.
Step 10
Right-click on the Timer button. A pop-up menu appears.
Step 11
Select Specify Action(s). A sub-menu opens.
Step 12
Select Trigger. The menu closes and an arrow appears that
connects the Timer button to a new cell to the right marked Trigger.
Step 13
To set the duration of the Timer, double-click on the Timer button.
A dialog box appears.
Step 14
Enter a time value in the boxes.
Step 15
Click the x to close the dialog box. The timer is now set.
98
CATC
FCTracer4G and FCTracer User’s Manual
SW Version 2.10
5.18 Recording Options - Channels
The Channels page allows the channel names to be customized. To change
a channel name, select the channel, then click the edit button and enter the
new text, then click OK. Once the options are set, the analyzer will update
the open trace and all future traces with the new channel names.
Where Custom Channel Names Appear
Custom channel names appear in two places:
• The trace itself
• Link Tracker window
Custom Channel Names in the Trace - Custom channel names do not
appear right away in the trace: the original names continue to display. To
see the custom channel names, click in the first cell of the trace (the channel
cell) and select Format from the pop-up menu, then select Custom.
99
CATC
FCTracer4G and FCTracer User’s Manual
SW Version 2.10
The custom names will then appear in the trace.
Channel 1 renamed as Channel 1.
Custom Channel Names in the Link Tracker Window - Tooltips in the
Link Tracker window will show custom channel names as soon as they have
been customized.
100
CATC
FCTracer4G and FCTracer User’s Manual
SW Version 2.10
6. Display Options & Application
Preferences
FCTracer has two sets of options for controlling the appearance of the
application: the Display Options dialog and the Application Preferences
dialog.
Display Options dialog - Controls how traffic is displayed in the trace
window. This dialog controls the appearance of the trace itself: the colors,
format and other characteristics of the trace.
Application Preferences dialog - Controls how commands are listed in the
application’s menus. This dialog lets you list commands by Opcode or
name, and set defaults for the link speed.
6.1 Setting Display Options
The Display Options dialog controls the way CATC Trace information is
displayed - meaning the trace colors, data format (hex, binary, ASCII etc.),
and the hiding of cells and frame types.
To open the Display Options dialog,
• Select Display Options under Setup on the Menu Bar
OR
• Click
on the Tool Bar
101
CATC
FCTracer4G and FCTracer User’s Manual
SW Version 2.10
The Display Options dialog opens:
The Display Options window always opens with the General page options
displayed.
6.2 General Display Options
The General Display Options controls the zoom level, tool tips behavior,
wrap and other general features:
• Zoom Level: Adjustable in discrete increments from 10% to
200% percent.
• Enable Tool Tips: Select to enable tool tips with explanation text
to pop up when you position your cursor over various fields in the
Trace View.
• Wrap: Inhibits carriage returns in packets when they exceed the
width of the window.
• Hide Primitives: Shows/hides Primitives in the trace.
• Right-click cell context menu: Causes FCTracer swap the right
and left mouse button functions
• Timestamp At The Beginning: Moves the timestamp from the
end of the Frame to the beginning.
102
CATC
FCTracer4G and FCTracer User’s Manual
SW Version 2.10
• Hierarchy Lines: Adds faint lines to the left side of the trace
window showing the hierarchical relationship between the
different decode/display levels (Frames, Sequences, and
Exchanges.)
• Trace Viewing Level: Lets you display the following elements in
the CATC trace: Frames, Sequences, and Exchanges.
• Display Channels: Shows/hides traffic from selected channels.
• Analysis Tools: Shows/Hides the various reporting utilities.
• Fonts: Lets you define the appearance of Field and Data text.
• Display Configuration Name: A descriptive label intended to
clarify the contents of the Display Options file name.
6.3 Saving and Loading Display Options
To save your Display Options settings for future use,
Step 1
Click Save to save the currently specified Display Options for use in
future sessions. Any file name can be specified, but you must use the
.opt extension. If no extension is specified, .opt is added by default.
Step 2
Click OK to apply any changes you have made to Display Options
and close this dialog box.
• Click Cancel to cancel any immediate changes you have made
and exit the Display Options menu.
• The Save as Default function is equivalent to the Save function,
specifying the file name default.opt. Whenever you start up the
analyzer, it automatically loads the default.opt file if one exists.
To load Display Options,
Step 1
Click Load.
A dialog box opens with a list of previously saved Display Options.
Step 2
Select a previously saved *.opt file.
Step 3
Click Apply to apply your changes.
6.4 Color/Format/Hiding Display Options
The Color/Format/Hiding property page controls field color and data
format (binary, hex, decimal, ASCII), and lets you hide selected fields from
the display.
103
CATC
FCTracer4G and FCTracer User’s Manual
SW Version 2.10
Click the Color/Format/Hiding tab on the Display Options screen.
Setting Field Colors
Step 1 Open Display Options (View > Set Display Options …)
Step 2
Under the Group and Colors column, click the plus symbol (+) next
to the group you want to reformat. The group will expand to show
the individual fields within the group. Each field will have a color as
shown below:
Step 3
Click in the colored cell that you want to change. A color palette
104
CATC
FCTracer4G and FCTracer User’s Manual
SW Version 2.10
appears.
Step 4
Click in a color in the palette, then click Apply or OK.
Note: The colors of the following Frame types cannot be changed:
• Invalid Data (frame error) field (red)
• Softbit Errors (yellow)
Two color fields are provided for frame, sequence, or exchange number
displays to differentiate between pre-Trigger traffic and post-Trigger traffic.
• The frame, sequence, or exchange that causes the Trigger and all
the packets before it are colored with the - color.
• The frame, sequence, or exchange that follows a Trigger is
colored with the + color.
• All packets are colored with a + color when there is no Trigger.
Use the color buttons labeled + and - under the Frame, Sequence, Or
Exchange # section of the Colors screen to select a Trigger color.
To select or change a color,
• Click the appropriate color button.
You see the color palette.
105
CATC
FCTracer4G and FCTracer User’s Manual
SW Version 2.10
Use this palette to choose the desired color for fields within the trace such
as Routing Headers, Base Transport Headers, CRC, and Frame, Sequence,
Or Exchange #.
You can also customize colors.
Step 1
Click the Custom tab.
Step 2
Click your mouse pointer in the color spectrum on the desired color.
Step 3
Drag the triangle on the vertical bar to the desired shade.
Step 4
Click OK.
Changing Field Formats
You can display numerical data in different format, such as hexadecimal or
binary.
To change the format of alphanumeric characters in a field,
Step 1
Under the Group and Colors column, click the plus symbol (+) next
to the group you want to reformat. The group will expand to show
the individual fields within the group.
Step 2
Click in anywhere in the row representing the field that you want to
reformat. If the field can be reformatted, the format options at the top
106
CATC
FCTracer4G and FCTracer User’s Manual
SW Version 2.10
of the dialog box will become active as shown below:
Click an item to display its current format characteristics and to display
formatting buttons. Use the formatting buttons to change the format of the
selected item.
Hiding Fields
Use this window to hide various fields, packets, messages, and protocols
from the Trace View screen. You can hide specific fields, by default, for all
recordings. Use the Show/Hide option under the View menu to hide specific
fields for the active recording.
To hide a field,
Step 1
Under the Group and Colors column, click the plus symbol (+) next
to the group that has the field(s) you want to hide. The group will
expand to show the individual fields within the group (as shown
above).
Step 2
Click in the checkbox in the row representing the field that you want
to hide.
Step 3
Click Apply or OK.
6.5 Hiding Levels
The Level Hiding page lets you hide traffic by event group. If you select one
or more event types from the Event Group list, the selected types will be
hidden from the trace.
107
CATC
FCTracer4G and FCTracer User’s Manual
SW Version 2.10
6.6 Display Options - Headers
The Headers page lets you add, remove, and reorder the fields that are
displayed when a header is in a collapsed state. You expand or collapse
headers by clicking the small triangle in the first cell of the header. by
default, a collapsed state header display three fields: the Header summary,
the Destination ID (D_ID), and the Source ID (S_ID).
If you want to add or remove header fields when a header is collapsed, you
use the Display Options Header page, shown above.
Step 1
Select Setup > Display Options > Headers to open the Display
Options Headers page.
Step 2
Select the fields you want displayed and check the boxes in the
column marked "Check to allow header when field collapsed."
Step 3
To re-order the fields, select
a a field of interest in the list
(i.e., click on it so it is
highlighted), then click the
Move Up or Move Down
buttons. In the example
shown right, the D_ID field
has been unchecked, and
the S_ID field has been
moved up.
Step 4
Click OK. The dialog box
closes. The new
configuration takes effect as
shown in the example
below:
To restore headers to their defaults, press the button marked Restore Frame
Header Defaults.
108
CATC
FCTracer4G and FCTracer User’s Manual
SW Version 2.10
6.7 The Application Preferences Dialog
The Application Preferences dialog controls how commands are listed in
menus and sets defaults for the link speed and FCP SCSI decoding.
To open the Application Preferences dialog, select Setup > Application
Preferences from the menu. The following dialog opens.
The Application Preferences
dialog has the following options:
Command Sorting
Allows commands in menus to be
sorted by name or by Opcode.
•
•
•
•
Basic Link Services
Extended Link Services
FCP SCSI
SW_ILS
FCP SCSI Default Decoding
Sets the default decoding for FCP
SCSI any time there is a conflict
due to the sharing of Opcodes by
command sets.
Select from one of the following
four command sets:
•
•
•
•
SCSI Primary Command set (SPC-3)
SCSI Block Command set (SBC-2)
SCSI Media Changer Command set (SMC-2)
SCSI Stream Command set (SSC-2)
Default Analyzer Hardware
Sets the hardware platform when an analyzer is not attached. When an
analyzer is attached to a host PC, the hardware platform is detected and the
speed set accordingly.
•
•
FCTracer 4/2/1 Gbps
FCTracer 2/1 Gbps
Number of Recent Files on File Menu
Sets how many recently opened files appear at the bottom of the File menu.
109
CATC
FCTracer4G and FCTracer User’s Manual
SW Version 2.10
6.8 Setting Channel Names
The Channel Settings dialog allows the names of the channels within the
trace window to be renamed. By default, the channels are numbered.
To customize the channel names, select Setup > Channel Settings from the
menu. The following dialog opens:
To change a channel name, select it from the list, then click Edit and enter
a new name. The new name will appear in the column marked Channel
Name. The new name(s) only affects the open trace. If you would like to
use your new settings for all traces, select Save as Default.
110
CATC
FCTracer4G and FCTracer User’s Manual
SW Version 2.10
7. Navigating a CATC Trace
7.1 Trace View Features
• The FCTracer view display uses color and graphics extensively to
fully document the captured traffic.
• Sequences are shown on separate rows, with their individual
fields both labeled and color coded.
• Frames are numbered (sequentially, as recorded), time-stamped,
and highlighted to show the device status (master or slave).
• Pop-up Tool Tips annotate frame, sequence, or exchange fields
with detailed information about their contents.
• Several fields such as Data fields can be collapsed to occupy
minimal space in the display.
7.2 Expanding & Collapsing Traffic
Sequences and Exchanges can be "opened" to reveal
their constituent packets by double-clicking the first
cell in of a Sequence or Exchange or by clicking once
on the small arrow on that same cell. The Sequence and/or Exchange will
then display below the message. The following snapshot shows an example:
Exchange
Sequence
Frame
111
CATC
FCTracer4G and FCTracer User’s Manual
SW Version 2.10
7.3 Expanded and Collapsed Field Formats
Fields that have small triangles in their top left corners can be expanded to
display greater detail or collapsed to a compact view. There are three ways
to toggle between the two views.
Left-clicking the Small Arrows in the Header and Data Fields
Some fields have small arrow in their top-left corners that allow the field to
be expanded or collapsed.
Left-facing
arrow will
collapse data
Right-facing
arrow will
expand data
Expanded Data
Collapsed
data
Double-Clicking
You can also expand or collapse a header or data field by double-clicking
anywhere in the field.
Expanding/Collapsing Fields via the Pop-up Menu
If you left-click on an expandable data or header field, a pop-up menu will
open with an option for expanding or collapsing the fields.
7.4 Pop-up Shortcut Menus
Clicking the left or right mouse button within the trace window will open
context-sensitive shortcut menus.
112
CATC
FCTracer4G and FCTracer User’s Manual
SW Version 2.10
Right Mouse Button
Clicking the right mouse button anywhere in the
trace window opens a menu with shortcuts for
changing the appearance of the trace:
•
•
•
•
•
•
•
•
•
•
•
•
•
•
Display Options - Opens Display Options dialog.
Real-Time Statistics - Opens Real-Time
Statistics window.
Zoom In - Zooms the display in.
Zoom Out - Zooms the display out.
Wrap - Wraps the frames to the next line if they
extend beyond width of the trace window.
Decoding Assignments - Opens the Decoding
Assignments dialog for setting the default FCP
SCSI decoding command set. This default is used
any time the same Opcodes are used from
different SCSI command sets.
Frame Level - Decodes trace at the Frame level.
Sequence Level - Decodes trace at Sequence level.
Exchanges Level - Decodes trace at Exchanges level
First Segment - If a multi-segment trace (*.mtt) has been opened, this
option will display the first segment file.
Previous Segment - Shows previous segment of a multi-segment trace.
Index File - Opens the index file for a multi-segment trace.
Next Segment - Opens the next segment in the multi-segment trace.
Last Segment - Opens the last segment in a multi-segment trace.
Left Mouse Button
Clicking the left mouse button in the trace window opens a context-sensitive
menu. The menus presented will vary depending on which part of the trace
has been clicked. The following screenshot shows the pop-up menus that
would occur for the different cells within a ARB primitive.
113
CATC
FCTracer4G and FCTracer User’s Manual
SW Version 2.10
7.5 Tool Tips
Tool tips are pop-up boxes that provide additional information about fields.
In some cases, tool tips function as a legend and spell out acronyms that
appear in a cell. In other cases, tool tips provide substantial additional
information about fields.
7.6 Navigating with Trace Navigator
The Trace Navigator is a navigation and display tool
designed to control the amount of trace displayed in
the main window. The Navigator is a bar that can be
displayed on the right side of the window. The bar
represents the entire trace. By dragging the top and
bottom of the Navigator bar you can restrict how
much traffic is displayed in the main window. For
example, you could reduce the displayed traffic in a
10,000 frame trace to a 100 frames.
Navigator also shows you where errors occur in the
trace. You enable Errors to display by right-clicking
in the Navigator and selecting Errors from the pop-up
menu. Errors will then display as horizontal lines
running across the width of the Navigator.
To display the Navigator bar, select Setup > Display
Options and then select the Navigation Bar
checkbox.
Scaling
The top of the Navigator bar corresponds to the first
frame in the trace, and the bottom corresponds to the last frame.
A one pixel high line in the Navigator bar represents a fraction of the trace
data. If, for example, the Navigation bar were 400 pixels high, then each bar
in this example would represent 1/400 of the trace. If the trace had 4000
frames total, each bar would represent 10 frames.
114
CATC
FCTracer4G and FCTracer User’s Manual
SW Version 2.10
Layout
The Navigator bar is made up of three parts: Pre-Trigger traffic,
Post-Trigger traffic, and errors.
To see all three components, you will need to enable them by selecting
Pre/Post Trigger and Errors from the pop-up menu.
Pop-up Menu
Right click anywhere on the Navigator to display the pop-up menu. The
following options are available:
•
•
•
•
•
Pre/Post Trigger - Shows/hides the Trigger event as a line in the
Navigator
Errors - Shows/Hides errors as red lines in the Navigator
Set Range To Whole Trace - Resets the range so all traffic is displayed
Set Range Near Frame xxx - Collapses the range so that only the frames
immediately above and below the xxx frame are displayed. The xxx
frame is whatever frame is visible at the top of the main window.
Recently Used Ranges - Displays a history of ranges that were
previously selected.
Positioning
The Navigator bar can be repositioned in the trace and can be oriented
horizontally or vertically, docked or undocked by dragging the parallel bars
at the top or side of the Navigator bar. By default, the Navigator bar appears
vertically to the right of the trace window. Drag the square at the top of
bottom to set the size of a frame range. Drag the entire square to set the
frame range to different values. A bubble appears showing the frame range
while you are setting it. Set Marker
You can define a unique marker for each frame, sequence, or exchange.
To place a marker,
Step 1
Left-click on Frame, Sequence, or Exchange # that you wish to
mark.
115
CATC
FCTracer4G and FCTracer User’s Manual
SW Version 2.10
A pop-up menu appears:
Step 2
Select Set Marker.
You see the Edit Marker Comment window where you can enter a
unique comment.
Step 3
Enter your comment.
Step 4
Click OK.
A marked frame, sequence, or exchange is indicated by a vertical red bar
along the left edge of the number (#) block:
7.7 Edit or Clear Marker
To clear or edit the comments associated with a frame, sequence, or
exchange marker,
Step 1
Left-click on the cell marked "Frame #", "Sequence #", or
"Exchange #."
116
CATC
FCTracer4G and FCTracer User’s Manual
A pop-up menu appears:
To edit the Marker Comment,
Step 2
Select Edit marker.
You see the Edit marker comment window:
Step 3
Edit the comment as desired.
Step 4
Click OK.
To clear a Marker,
Step 5
Click Clear marker.
The vertical red Marker bar disappears.
117
SW Version 2.10
CATC
FCTracer4G and FCTracer User’s Manual
SW Version 2.10
7.8 Edit Comment
You can create, view, or edit the 100-character comment field associated
with each Trace file.
Step 1
Select Edit Comment under File on the Menu Bar.
Step 2
Create, view, or edit the comment.
You see the Edit comment for trace file window:
Step 3
Click OK.
118
CATC
FCTracer4G and FCTracer User’s Manual
SW Version 2.10
8. Decoding Traffic
FCTracer has three decode levels: Frames, Sequences, and Exchanges,
The FCTracer default decode/display level is Frame, which means that
Fibre Channel Frames will be displayed when you first view a trace.
8.1 Decoding and Displaying Traffic
You can decode and display traffic through the toolbar or by selecting a
decode level from the Display Options dialog box.
Decoding Via the Toolbar
The decode buttons on the toolbar perform the following functions:
Fra (Display Frames)
Seq (Display Sequences)
Xch (Display Exchanges)
To display, for example, Sequences, click
Note
.
Once a decode has been performed, it might be
necessary to scroll through the display to find the
decoded data. You can shorten your search by first
clicking the Hide Primitives and Hide
Unassociated Traffic buttons.
Decoding Via the Display Options Dialog Box
The Display Options dialog box has options for issuing decode commands.
To issue a command,
Step 1
From the menu bar, select
119
CATC
FCTracer4G and FCTracer User’s Manual
SW Version 2.10
Setup>Display Options.
Step 2
From the checkboxes under Trace Viewing Level, select the desired
level of decoding. Your choices are:
• Frame
• Sequence
• Exchange
8.2 Viewing Details about FCP and SCSI Fields
You can get details about FCP and SCSI, by clicking on a transaction within
the trace and selecting View FCP-SCSI IU fields from the pop-up menu. A
dialog box will open with details about the selected transaction. This dialog
box lets you search, save, and reformat the displayed data.
120
CATC
FCTracer4G and FCTracer User’s Manual
SW Version 2.10
Viewing FCP-SCSI Fields
The dialog boxes for viewing details about FCP and SCSI transactions are
the same. The following steps describe viewing details about FCP and SCSI.
Step 1
Click on a FCP Command, FCP Request, or SCSI LUN to open a
pop-up menu:
Step 2
Select View FCP-SCSI IU Fields.
The following screen appears:
The window displays details about the FCP or SCSI. Field information is
displayed vertically in sections. You can scroll down through the window to
see all the fields.
121
CATC
FCTracer4G and FCTracer User’s Manual
SW Version 2.10
The bottom of the window has six buttons with the following functions:
Save As - Saves the current configuration in an HTML file.
Find - Opens a dialog box that allows you to search the window.
Layout - Opens a dialog box that allows you to set the columns that you
want to display in the View Fields for FCP-SCSI window:
The options at the bottom of the dialog box have the following functions:
•
Show only fields specified for view in collapsed state - This
option works in conjunction with the Decoder Script files. Decoder
Script files are editable files that affect how FCP and SCSI are
displayed in the trace.
The decoder files contain options for displaying FCP and SCSI
attribute fields when the FCP and SCSI is in a collapsed state. By
default, FCP and SCSI attribute fields are hidden when the FCP and
SCSI is in collapsed state.
The option Show only fields specified for view in collapsed state
looks at the View Settings options you set in the Decoder Script files
and transfers the settings to the View Fields for FCP-SCSI window.
If, for example, you specified in the Decoder Script file that Field X
should display when the FCP or SCSI is in collapsed state, AND if
you checked the box marked Show only fields specified for view in
collapsed state, then only Field X will display in the View Sequence
fields dialog box.
•
Use these settings when View Fields dialog opens - This option
saves the current settings.
122
CATC
FCTracer4G and FCTracer User’s Manual
SW Version 2.10
Previous - Displays the last table containing FCP or SCSI data.
Next - Displays the next table containing FCP or SCSI data.
Close - Closes the window.
8.3 Displaying Raw 10b Codes
To view Raw 10b Codes, left-click on the
first cell in a Frame and select Show Raw
10b Codes from the pop-up menu shown
on the right.
The 10b Codes window is laid out with
packets as rows and physical lanes as
columns.
Data Appearance - Data format is configurable. To change data format,
select from the four options:
• Byte Value - Click to show hex values.
• 10 bit code - Click the to show hex values.
• Symbol (RD) - Click to show symbol RD fields.
• Packet Fields - Click to show Packet fields.
Navigation - To move to the previous or next item in the trace, click one of
the two Packet buttons at the bottom of the window:
• Prev - Displays data for the previous packet in the trace.
• Next - Moves to the next packet in the trace.
123
CATC
FCTracer4G and FCTracer User’s Manual
124
SW Version 2.10
CATC
FCTracer4G and FCTracer User’s Manual
SW Version 2.10
9. Searching and Exporting
FCTracer and FCTracer 4G have several search commands that simplify
the job of locating events of interest such as errors and triggers. These
commands are launched from the Search menu.
9.1 Quick Search
When an event has been located, you can quickly
search for the next instance of the same type of
event by clicking in the first field of a frame (the
one with the Channel number in it) and selecting
Find next occurrence.
9.2 Search Menu
The Search feature provides several options for searching through recorded
traffic, allowing you to find specific frames, sequences, or exchanges on
triggering status, number, marking, or content.
To view the Search options,
• Click Search in the Menu Bar.
You see the Search drop-down menu:
Go to Trigger
To display a triggering event, select Go to Trigger under Search on the
Menu bar. The Trace Viewer display will reposition the trace to show the
triggering event at the top of the screen.
125
CATC
FCTracer4G and FCTracer User’s Manual
SW Version 2.10
Go to Packet
To display a specific packet,
Step 1
Select Go to Frame/Sequence/Exchange... under Search on the
Menu Bar.
Step 2
Enter the number of the Frame, Sequence, or Exchange you want to
display.
Step 3
Or
Select a value from the drop-down list.
Click OK.
The Trace repositions to show the Frame, Sequence, or Exchange at
the top of the screen.
Go to Marker
To instruct the analyzer to display a marked Frame, Sequence, or Exchange,
Step 1
Select Go to Marker under Search on the Menu Bar.
You see a menu listing the marked items in that Trace View:
Step 2
Select the desired packet from the displayed list.
The Trace repositions to show the marked item at the top of your
screen.
126
CATC
FCTracer4G and FCTracer User’s Manual
Note
SW Version 2.10
The Go to Marker feature functions in conjunction with the Set
Marker feature. The comments within the parentheses
following each marked item are added or edited with the Set
Marker feature.
Go to
The Go To feature takes you directly to an event in a Trace.
Find
Find allows searches to be conducted on an open trace using one or more
criteria. You can search by Frame, Sequence, Exchange, and by fields
within these items.
Find is run by selecting Search >Find or by clicking
on the toolbar.
Searches can combine criteria using the options Intersection and Union.
Intersection creates AND statements such as "Find all Frames, Sequences,
Exchanges with x and y." Union creates OR statements such as "Find all
frames with x OR y."
You can also perform searches whereby Frames, Sequences, Exchanges, or
events are excluded from a trace. The Exclusion allows searches to be
conducted.
To perform a search,
Step 1
Select Find... under Search on the Menu Bar
OR
Click
in the Tool Bar.
127
CATC
FCTracer4G and FCTracer User’s Manual
SW Version 2.10
You see the User-Defined Find Events screen:
Step 2
Select Frames, Sequences, or Exchanges from the top left list box.
Your choice will affect options presented in the Events Group box.
Step 3
Select one or more events from the Events Group box.
Step 4
Select one of the following options:
• Union: Find all items matching ANY of the specified events.
• Intersection: Find all items matching ALL of the specified
events.
• Exclusion: Exclude items matching any of the specified events.
Exclusion works with the other two options. You select Union
AND Exclusion to exclude items with ANY of the selected fields;
or choose Intersection AND Exclusion to exclude items with
ALL of the selected fields.
128
CATC
FCTracer4G and FCTracer User’s Manual
Step 5
If desired, set the search Direction and Origin.
Step 6
Click OK.
SW Version 2.10
After the search finishes, the items meeting the search criteria will
display.
Select the Find All checkbox to find all instances of an event group.
Select the Search in Hidden checkbox to find an event group that is hidden.
Find Next
To apply the previous Find parameters to the next search,
• Select Find Next under Search on the Menu Bar
OR
Click
on the Tool Bar.
9.3 Exporting Frames and Data
FCTracer allows users to export trace data into text files.
Step 1
From the File menu, select Packets to Text... under Export.
Step 2
In the From and To fields, enter the range.
Step 3
Click OK.
129
CATC
FCTracer4G and FCTracer User’s Manual
Step 4
Specify a path and filename, and click Save.
130
SW Version 2.10
CATC
FCTracer4G and FCTracer User’s Manual
SW Version 2.10
10. Reports
FCTracer and FCTracer 4G can generate graphs and statistical summaries
of traffic - thereby providing an alternative view of traffic to the one shown
in the trace window. Many of the utilities have hyperlinks which allow you
to reposition the trace to an event that has been located in the report window.
Reports include File Information, Error Summary, Bus Utilization, Timing
and Bus Usage Calculations, Traffic Summary, Real-Time Statistics, Link
Tracker and Frame Tracker.
10.1 File Information
The File Information report provides information about how the recording
was made, what the buffer settings were, what the trigger options were, and
what version of all the analyzer hardware was used to make the recording.
To display a File Information report,
• Select Report > File Information in the Menu Bar or click
in the Tool Bar.
Perhaps the most useful information in the dialog is the Recording Option
settings used to create the trace. These settings are shown in the above
screenshot. Also shown in the screenshot is a blue hypertext link to the
Recording Option settings themselves. The link is marked with the text
Open Recording Options in a dialog. Clicking this link causes the
131
CATC
FCTracer4G and FCTracer User’s Manual
SW Version 2.10
software to open the Recording Options dialog and automatically populate
the dialog with the settings used to create the open trace. This is a fast
method of capturing the options used to create the trace. Once the options
are in the Recording Options dialog, you can then use the Save As command
to preserve them.
10.2 Traffic Summary
Traffic Summary displays a summary of the types of traffic that occurs in
the current trace file and allows you to go to a specific frame, sequence, or
exchange.
To display an Traffic Summary report,
• Click
in the Tool Bar or select
Report > File Information from the Menu Bar
The Traffic Summary screen appears below the trace:
The left pane displays a tree of the different protocol levels. Click the plus
symbol (+) to expand the tree. The example above is fully expanded. The
right pane displays a summary of the traffic for the selected level.
132
CATC
FCTracer4G and FCTracer User’s Manual
SW Version 2.10
10.3 Error Summary
Clicking the Error Summary button
causes the Traffic Summary to
open and display a summary of errors that occurred in the current trace. The
errors are hyperlinked to the trace file - allowing you to go to a specific
Frame, Sequence, or Exchange within the trace window.
To display an Error Summary report,
• Select Error Summary under Report in the Menu Bar or click
in the Tool Bar.
The Traffic Summary window appears. Errors are shown as a
sub-set of the Traffic Summary:
10.4 Timing Calculations
The Timing and Bus Usage Calculator calculates time between frames.
To calculate timing and bus usage,
Select Report >Timing Calculations from the Menu Bar or click
the Tool Bar.
133
in
CATC
FCTracer4G and FCTracer User’s Manual
SW Version 2.10
The Timing and Bus Usage Calculator dialog appears:
To calculate bus usage and bit rate errors on a range of Frames,
Step 1
If calculating timing between Frames, enter the Frame numbers in
the two Frame text boxes.
Step 2
If calculating between markers, click the marker buttons under
"From beginning of" and "To End of" and select markers from the
lists.
Step 3
If calculating timing between time points, click the Time buttons and
enter time values.
Step 4
Click the "Calculate" button. At this point, bus usage will be
calculated.
10.5 Bus Utilization
The Bus Utilization window displays a graph of bandwidth use within a
displayed trace.
To open the Bus Utilization window, select Report >Bus Utilization or
click the button marked
. A window will open with graphs of Link
Utilization, Data Throughput, and Frame Counts:
134
CATC
FCTracer4G and FCTracer User’s Manual
SW Version 2.10
Bus Utilization Buttons
The Bus Utilization window has a row of buttons for changing the format of
the displayed data and for exporting data:
The buttons have the following functions:
Save As - Saves the graphs
as a bitmap file (*.bmp)
Vertical zoom in
Email - Creates an email
with a *.bmp file attachment
of the graphs
Vertical zoom out
Print
Click and Drag zoom - Click diagonally to
select and zoom in on part of the graph
Full Screen
Select Range
View Settings - opens a
sub-menu with options for
formatting the display. See
“View Settings Menu”
below.
Sync and Graph areas - If two or more
graphs are displayed, this button will
synchronize the graphs to one another. Once
synchronized, the positioning slider of one
graph will move the other graphs
Horizontal zoom in
Graph Areas - Presents options for
displaying additional graphs of data lengths,
frame, sequence, or exchange lengths, and
percentage of bus utilized.
Horizontal zoom out
View Settings Menu
Clicking the View settings button
causes a menu
to open with options for formatting the display.
• Orient Horizontally - changes the
orientation of bus usage to horizontal.
After selecting this option, the menu will
say "Orient Vertically."
• Tile Vertically - tiles the two graphs
vertically (i.e., side by side).
• Show Markers - Places "tick" marks along
the x axis of each graph.
135
CATC
FCTracer4G and FCTracer User’s Manual
SW Version 2.10
• Show Plumb Line - Displays a vertical line that connects your
cursor to the horizontal axis. As the mouse is moved, the status
bar will show the frame, sequence, or exchange and time frame to
which the cursor is pointing.
• Status - Opens a sub-menu with the following options:
—
Bar - Displays a status bar at bottom of graph.
—
Tooltip - Causes a tooltip to appear if you position your mouse
pointer over part of the graph and leave it there for a couple of
seconds.
—
None - Turns off tooltips and the status bar.
• Grid Lines - Opens a sub-menu with the following options:
—
Both - Displays both X and Y axis gridlines.
—
X Axis - Displays X axis gridlines.
—
Y Axis - Display Y axis gridlines.
—
None - Turns off gridlines.
• Grid on Top - Moves the grid lines above the graph.
• Fonts and Colors - Opens a dialog box for setting the colors and
fonts used in the graphs:
136
CATC
FCTracer4G and FCTracer User’s Manual
SW Version 2.10
Graph Areas Menu
The Graph Areas menu allows you to view different information in the Bus
Utilization window.
Step 1
Click the
button.
The Graph Areas menu opens.
Step 2
Select the data you want to
appear in the Graph Areas
window.
To change the properties in the Bus
Utilizations graph, right-click and
choose Properties from the pop-up
menu. The Properties dialog box opens
as shown below.
The following dialog box will open. It will display options for setting
the title, appearance, color, and line type for the graph.
137
CATC
FCTracer4G and FCTracer User’s Manual
SW Version 2.10
Excluding/Including Traffic from Graphs
In addition to the various appearance settings, the Properties dialog box has
options for hiding/showing traffic. To hide traffic from the graph, select
events from the Event Groups and Packet Types lists and then select Hide
selected items. To include traffic, select Show selected items.
10.6 Real Time Statistics
Real Time Statistics displays a summary of the traffic currently being
recorded by the analyzer.
To display the Real-Time Statistics window, click
in the Tool Bar.
The Real Time Statistics window opens:
To see a graph of traffic, start Fibre Channel link activity, and then press
to start the Real-Time statistics monitor. As traffic flows on the link,
data will stream in real-time to this window in a format of your choice.
To stop the monitor, press
.
Real-Time Statistics Buttons
The Real-Time Statistics toolbar has buttons for changing the format of the
displayed data and for exporting data:
138
CATC
FCTracer4G and FCTracer User’s Manual
SW Version 2.10
The buttons have the following functions:
Save As - Saves Real-Time
graphs as bitmap files
(*.bmp)
Vertical zoom in
Email - Creates an email
with a *.bmp file attachment
of the graphs
Vertical zoom out
Print
Click and Drag zoom - Click diagonally to
select and zoom in on part of the graph
Full Screen
Select Range
View Settings - opens a
sub-menu with options for
formatting the display. See
“View Settings Menu”
below
Sync and Graph areas - If two or more
graphs are displayed, this button will
synchronize the graphs to one another. Once
synchronized, the positioning slider of one
graph will move the other graphs
Horizontal zoom in
Graph Areas - Presents options for
displaying additional graphs of data lengths,
frame, sequence, or exchange lengths, and
bus utilization
Start. Starts the Real-Time Monitor
Horizontal zoom out
Show channel. You can
select Channel 1 through 8.
Stop Real-Time Monitoring
Reset. Resets the graphs
Real-Time Statistical Monitor Pop-up Menu
If you right-click a graph in the Real-Time window,
a pop-up menu appears with the following options:
Undo Zoom - If you have zoomed in, this command
will undo the zoom.
Fit to Graph Area - Redisplays graph so that the
entire trace fits inside graph area.
Y Scale Type:
Linear - Converts display to linear format.
Logarithmic - Converts display to logarithmic format.
Hide - Hides the selected graph.
Properties - Opens a dialog box with options for changing the colors, titles
and other features of the graphs.
139
CATC
FCTracer4G and FCTracer User’s Manual
SW Version 2.10
Displaying Multiple Graphs
The Real Time Statistics window can display up to three separate graphing
windows. The window gives you different graphing options:
To view two or three graphs simultaneously, click
the Graph Areas button.
The menu has the following options:
• Statistics Accumulation - Allows
you to display/hide the Min/Max/Avg
Area on the right side of the Bus Utilization window.
• Link Utilization % - Plots the percentage of Link utilization by
non-idle traffic for both directions of the link.
• Data Frame, Sequence, Or Exchange Count (Packets/s) Plots counts of Fibre Channel Data Packets per second for both
directions of the link.
• Data Payload Throughput (MBytes) - Plots data payload
throughput for both directions of the link.
10.7 Exporting Frames and Data
FCTracer allows you to export Frames and data into text files.
Step 1
From the File menu, select Packets to Text... under Export.
Step 2
In the From and To fields, enter the range.
Step 3
Click OK.
140
CATC
FCTracer4G and FCTracer User’s Manual
Step 4
SW Version 2.10
Specify a path and filename, and click Save.
10.8 Link Tracker Window
The Link Tracker window displays a detailed chronological view of
events. Events are shown in columns within the window, each column
representing a channel. Time is presented as rows. Idle time is shown by
empty rows in the window. Idles can be collapsed into gray strips running
across the window.
Each time slot in the vertical axis represents the minimum time that a dword
requires to traverse the bus. Time slot widths vary depending on bus speed
and on how zoomed out the display is.
When the Link Tracker window is fully zoomed in, the time slots measure
as follows:
• 1 G - 37.25 ns
• 2 G - 18.63 ns
• 4 G - 9.31 ns
When the window is fully zoomed out, the grid lines disappear and the scale
changes to 1 dword = a line measuring 1 pixel in height .
141
CATC
FCTracer4G and FCTracer User’s Manual
SW Version 2.10
Opening the Link Tracker Window
To open the Link Tracker window, select Report > Link Tracker or click
the button marked
. A window opens like the one shown below:
Window Layout
The Link Tracker window divides into two areas:
• Toolbar - Presents buttons for changing data format.
• Main Display Area - Displays traffic chronologically as it
occurred in the recording. The window divides into columns: the
first column shows time and traffic is shown on a channel by
channel basis in the columns on the right.
142
CATC
FCTracer4G and FCTracer User’s Manual
SW Version 2.10
Link Tracker Buttons
The Link Tracker window has a row of buttons for changing the format of
the displayed data and for exporting data:
The buttons have the following functions:
Full Screen. Maximizes the Link
Tracker window to fill the screen.
Collapse all Non-essential
traffic. Collapses Idles and other
non-essential traffic into grey
strips running across the
window.
Synchronize Trace View.
Synchronizes the Trace View and
Link Tracker windows so that a move
in one window repositions the other.
Because of the differences in scale
and logic between the Link Tracker
and Trace view windows, scrolling
produces different effects depending
on which window is being scrolled.
Scrolling in the trace window causes
the Link Tracker window to rapidly
jump from event to event. Long
periods of idle time are skipped.
Scrolling in the Link Tracker
window, in contrast, causes small
moves in the trace window. Scrolling
in the Link Tracker window causes
the trace window to pause until the
start of a packet is displayed. At that
point, the trace window repositions
itself. While scrolling through idle
periods or the contents of a packet,
the trace window will not move.
Show Symbolic Representation.
(text and values).
View Options. Opens a menu with
three options: Collapsible Idle Time,
Tooltip Display, and Reset Column
Widths. See View Options Menu
below for descriptions.
Show Values
Zoom In
Show 10b Codes
Zoom Out
Show Symbols
Show Continuous Time Scale. Shows
traffic in chronological order.
Show Text
Collapse Idle Time. Shows traffic in
chronological order but collapse Idles
into grey strips across the window..
143
CATC
FCTracer4G and FCTracer User’s Manual
View Options Menu
Clicking the View Options button
SW Version 2.10
causes a menu to open with options for
formatting the display.
•
Collapsible Idle Time - Opens a dialog box for setting the Idle time
value. By setting a value, you tell the analyzer when to collapse Idle
times and display them as grayed out strips within the Link Tracker
window. For example, if you had set the Idle time to value x then
any time an Idle time exceeded x it would be displayed as a gray strip
across the Link Tracker window.
•
Tooltip Display - Opens a menu with options for adding content to
tooltips. Tooltips will display when you position the mouse pointer
over an item in the Link Tracker window. The options are:
•
•
•
•
Tooltip Display Values
Tooltip Displays 10 bit Codes
Tooltip Displays Symbols
Tooltips Displays Text Decoding
The following screenshot shows a tooltip in which all options
have been enabled:
•
Reset Column Widths - This option resets column widths to their
defaults.
Docking and Undocking the Window
You can undock the Link Tracker window by double-clicking on the blue
title bar along the left side of the window. Once undocked, the window can
be dragged anywhere in the application. To redock, double-click again on
the title bar.
144
CATC
FCTracer4G and FCTracer User’s Manual
SW Version 2.10
Setting Markers
Markers can be set on any dword on any event within the Link Tracker
window. To set a marker, right-click on an event, then select Set Marker
from the pop-up menu. Once marked, events can be easily navigated to via
the Go to Marker command in the Search menu.
Calculating Time between Dwords
You can calculate time between dwords by clicking on an event and then
positioning your mouse pointer over a second event and reading the ensuing
tooltip.
Step 1
Click on the time value for the first event.
Step 2
Scroll down through the trace to the second event and position the
mouse pointer above its time value. A tooltip will appear showing
the time interval between the first and second events.
Hiding Idles and Other Traffic
You can hide Idles and other traffic in the Link Tracker window by clicking
the Hide Idles button on the Link Tracker toolbar
or any of the Hide
buttons in the Trace window - for example, Hide Channels
or by
selecting one or more of the various Hide options in the Display Options
dialog box.
Searching
When the Trace view and Link Tracker windows are synchronized, the Find
and Go To options in the Search menu will apply to the Link Tracker
window. The Trace and Link Tracker windows can be synchronized by
selecting the Synchronize button
.
145
CATC
FCTracer4G and FCTracer User’s Manual
SW Version 2.10
Zooming In and Out
Zooming out can give you a quick, high-level view of a trace. A fully
zoomed out trace will only show columns and colored lines. Using the
colors you can see what types of traffic running through the trace - for
example, brown represents data, and dark green is a Start of Frame.
Further information can be obtained on any point of interest in the trace by
positioning your mouse pointer over it. Tool tips provide detailed
description of events.
Note that when fully zoomed out, the smallest graphical unit is the dword,
represented by a single line. Zooming out makes the trace appear smaller
and increases the time scale in the first column.
10.9 Frame Tracker Window
The Frame Tracker window displays a detailed chronological view of
traffic on a Frame-by-Frame basis. Events are shown within columns
within the window, each column representing a channel. Time is presented
as rows. Idle time is shown by empty rows in the window.
Each time slot in the vertical axis represents the minimum time required by
a Frame to traverse the bus.
Opening the Frame Tracker Window
To open the Frame Tracker window, select Report > Frame Tracker or
click the button marked
. A window opens like the one shown below:
146
CATC
FCTracer4G and FCTracer User’s Manual
SW Version 2.10
Window Layout
The Frame Tracker window divides into two areas:
• Toolbar - Presents buttons for changing data format.
• Main Display Area - Displays traffic chronologically as it
occurred in the recording. The window divides into columns: the
first column shows time and traffic is shown on a channel by
channel basis in the columns on the right.
Frame Tracker Buttons
The Frame Tracker window has a row of buttons for
changing the format of the displayed data and for
exporting data:
The buttons have the following functions:
Full Screen
Zoom In
Synchronize Trace View.
Synchronizes the Trace View and
Frame Tracker windows so that a
move in one window repositions the
other.
Zoom Out
View Options. Opens a menu with
three options: Collapsible Idle Time,
Tooltip Display, and Reset Column
Widths. See View Options Menu
below for descriptions.
View Options Menu
Clicking the View Options button
causes a menu to open with options for
formatting the display.
•
Time Format- Opens a menu with options for setting the time
format. There are two options:
• Seconds
• Clocks
•
Reset Column Widths - This option resets column widths to their
defaults.
Normally, columns will automatically resize themselves if the
application window is made larger or smaller. However, if you
manually resize any columns in the Frame Tracker window, column
widths become static. Thereafter, if you resize the application
147
CATC
FCTracer4G and FCTracer User’s Manual
SW Version 2.10
window, the Frame Tracker columns will not adjust automatically.
Reset Column Widths re-enables this automatic resizing
capability.
Docking and Undocking the Window
You can undock the Frame Tracker window by double-clicking on the blue
title bar along the left side of the window. Once undocked, the window can
be dragged anywhere in the application. To redock, double-click again on
the title bar.
Calculating Time between Frames
You can calculate time between Frames by clicking on an event and then
positioning your mouse pointer over a second event and reading the ensuing
tooltip.
Step 1
Click on the time value for the first event.
Step 2
Scroll down through the trace to the second event and position the
mouse pointer above its time value. A tooltip will appear showing
the time interval between the first and second events.
Hiding Traffic
You can hide Primitives, Channels and other data from the Frame Tracker
window by clicking the Hide buttons on the toolbar in the Trace window or
by selecting one or more of the Hide options in the Display Options dialog
box.
Searching
When the Trace view and Frame Tracker windows are synchronized, the
Find and Go To options in the Search menu will apply to the Frame Tracker
window. The Trace and Frame Tracker windows can be synchronized by
selecting the Synchronize button
.
Zooming In and Out
Zooming out can give you a quick, high-level view of a trace.
148
CATC
FCTracer4G and FCTracer User’s Manual
SW Version 2.10
11. Verification Scripts
FCTracer and FCTracer 4G have a utility called the Verification Script
Engine (VSE) which allows users to run performance/validation tests on
traces. The VSE is described in detail in the Verification Script Engine for
CATC FCTracer Reference Manual.
To execute the VSE, you open a trace, then open the Verification Script
window, and finally select and execute a test script. The script runs and
prints out the results in the log window.
To open the Verification Script window, select Reports > Run verification
scripts ... from the menu. The following dialog opens:
11.1 Window Layout
The Script Verification window divides into four areas: a Script List in the
top left, a Script Description in the gray area at the top right, an Output
window at the bottom, and a toolbar along the bottom border of the window.
Script Menu area
The Script Menu area contains a list of verification scripts that can be run.
To run a script, select it, then click Run Script button.
149
CATC
FCTracer4G and FCTracer User’s Manual
SW Version 2.10
Script Menu Pop-Up Menu
Right-clicking in the Script Menu area will open
a pop-up menu with options to create, edit, and
run a script.
Run verification script(s) - Executes selected
scripts.
Edit Script - Opens the selected script in
Notepad.
New Script - Opens Notepad and displays
whatever Script template you are using.
Show Grid - Displays gridlines in the Script Menu area.
Show Description window - Shows/Hides the Description window in the
top right side of the Script Verification window.
Show Output - Shows/Hides the log window.
Settings - Opens the Settings dialog.
The Settings Dialog
The Settings dialog controls
the defaults for the Script
Verification window.
Choose Editor Application
and editing settings - Gives
the option to change the
default editor from Notepad
to an editor of your choice.
Edit all selected scripts in
one process - Automatically
opens all selected scripts
with the selected Editor.
Path to the template file for
a new script - Sets the
location of the template that
is the basis for new scripts.
Show the full path for the
trace file in dialog caption Displays the path of the open
trace in the window title bar.
150
CATC
FCTracer4G and FCTracer User’s Manual
SW Version 2.10
Restore (don’t minimize) dialog at start - Displays Verification Script
window in non-minimized size when window is first opened.
Load last output from saved log files when possible - Loads the output
from the saved log files into the output window.
Activate dialog after script(s) stop running - Brings Run VS dialog to the
foreground when the scripts stop running.
Remember dialog layout - Preserves layout of window after window is
closed.
Path to the folder where to save the output log files - Default is the
application folder.
Saves logs automatically after scripts stop running - Automatically saves
the script logs into the application folder or other location when the script
stops running.
Script Description Area
Describes the selected script. Descriptions for scripts are defined in set
DecoderDesc= "MyDescription."
Output window
Displays the output of the script as it executes.
11.2 Additional Resources
For Further Information - See the Verification Script Engine Reference
Manual.
151
CATC
FCTracer4G and FCTracer User’s Manual
152
SW Version 2.10
CATC
FCTracer4G and FCTracer User’s Manual
SW Version 2.10
10. How to Contact CATC
Contact
Type of Service
Call for technical support…
US and Canada:
1 (800) 909-2282
Worldwide:
1 (408) 727-6600
Fax your questions…
Worldwide:
1 (408) 727-6622
Write a letter…
Computer Access Technology Corp.
Customer Support
3385 Scott Blvd.
Santa Clara, CA 95054
USA
Send e-mail…
[email protected]
Visit CATC’s web site…
http://www.CATC.com/
Limited Hardware Warranty
So long as you or your authorized representative ("you" or "your"), fully
complete and return the registration card provided with the applicable
hardware product or peripheral hardware products (each a "Product") within
fifteen days of the date of receipt from Computer Access Technology
Corporation ("CATC") or one of its authorized representatives, CATC
warrants that the Product will be free from defects in materials and
workmanship for a period of three years (the "Warranty Period"). You may
also complete your registration form via the internet by visiting
http://www.catc.com/support/register/. The Warranty Period commences
on the earlier of the date of delivery by CATC of a Product to a common
carrier for shipment to you or to CATC's authorized representative from
whom you purchase the Product.
What this Warranty Does Not Cover
This warranty does not cover damage due to external causes including
accident, damage during shipment after delivery to a common carrier by
CATC, abuse, misuse, problems with electrical power, including power
surges and outages, servicing not authorized by CATC, usage or operation
not in accordance with Product instructions, failure to perform required
preventive maintenance, software related problems (whether or not
provided by CATC), problems caused by use of accessories, parts or
components not supplied by CATC, Products that have been modified or
altered by someone other than CATC, Products with missing or altered
service tags or serial numbers, and Products for which CATC has not
received payment in full.
153
CATC
FCTracer4G and FCTracer User’s Manual
SW Version 2.10
Coverage During Warranty Period
During the Warranty Period, CATC or its authorized representatives will
repair or replace Products, at CATC's sole discretion, covered under this
limited warranty that are returned directly to CATC's facility or through
CATC's authorized representatives.
How to Obtain Warranty Service
To request warranty service, you must complete and return the registration
card or register via the internet within the fifteen day period described above
and report your covered warranty claim by contacting CATC Technical
Support or its authorized representative. CATC Technical Support can be
reached at 800-909-7112 or via email at [email protected]. You may also
refer to CATC's website at http://www.catc.com for more information on
how to contact an authorized representative in your region. If warranty
service is required, CATC or its authorized representative will issue a
Return Material Authorization Number. You must ship the Product back to
CATC or its authorized representative, in its original or equivalent
packaging, prepay shipping charges, and insure the shipment or accept the
risk of loss or damage during shipment. CATC must receive the Product
prior to expiration of the Warranty Period for the repair(s) to be covered.
CATC or its authorized representative will thereafter ship the repaired or
replacement Product to you freight prepaid by CATC if you are located in
the continental United States. Shipments made outside the continental
United States will be sent freight collect.
Please remove any peripheral accessories or parts before you ship the
Product. CATC does not accept liability for lost or damaged peripheral
accessories, data or software.
CATC owns all parts removed from Products it repairs. CATC may use new
and/or reconditioned parts, at its sole discretion, made by various
manufacturers in performing warranty repairs. If CATC repairs or replaces
a Product, the Warranty Period for the Product is not extended.
If CATC evaluates and determines there is "no trouble found" in any
Product returned or that the returned Product is not eligible for warranty
coverage, CATC will inform you of its determination. If you thereafter
request CATC to repair the Product, such labor and service shall be
performed under the terms and conditions of CATC's then current repair
policy. If you chose not to have the Product repaired by CATC, you agree
to pay CATC for the cost to return the Product to you and that CATC may
require payment in advance of shipment.
154
CATC
FCTracer4G and FCTracer User’s Manual
SW Version 2.10
General Provisions
THIS LIMITED WARRANTY GIVES YOU SPECIFIC LEGAL RIGHTS.
YOU MAY HAVE ADDITIONAL RIGHTS THAT VARY BY
JURISDICTION. CATC'S RESPONSIBILITY FOR DEFECTS IN
MATERIALS AND WORKMANSHIP IS LIMITED TO REPAIR AND
REPLACEMENT AS SET FORTH IN THIS LIMITED WARRANTY
STATEMENT. EXCEPT AS EXPRESSLY STATED IN THIS
WARRANTY STATEMENT, CATC DISCLAIMS ALL EXPRESS AND
IMPLIED WARRANTIES FOR ANY PRODUCT INCLUDING, BUT
NOT LIMITED TO, ANY IMPLIED WARRANTIES OF AND
CONDITIONS OF MERCHANTABILITY AND FITNESS FOR A
PARTICULAR PURPOSE, AND ANY WARRANTIES THAT MAY
ARISE FROM ANY COURSE OF DEALING, COURSE OF
PERFORMANCE OR TRADE USAGE. SOME JURISDICTIONS MAY
NOT ALLOW LIMITATIONS ON HOW LONG AN IMPLIED
WARRANTY LASTS, SO THE PRECEDING LIMITATION MAY NOT
APPLY TO YOU.
CATC DOES NOT ACCEPT LIABILITY BEYOND THE REMEDIES
SET FORTH IN THIS LIMITED WARRANTY STATEMENT OR FOR
INCIDENTAL OR CONSEQUENTIAL DAMAGES INCLUDING,
WITHOUT LIMITATION, ANY LIABILITY FOR THIRD PARTY
CLAIMS AGAINST YOU FOR DAMAGES, PRODUCTS NOT BEING
AVAILABLE FOR USE, OR FOR LOST DATA OR SOFTWARE.
CATC'S LIABILITY TO YOU MAY NOT EXCEED THE AMOUNT
YOU PAID FOR THE PRODUCT THAT IS THE SUBJECT OF A
CLAIM. SOME JURISDICTIONS DO NOT ALLOW THE EXCLUSION
OR LIMITATION OF INCIDENTAL OR CONSEQUENTIAL
DAMAGES, SO THE PRECEDING EXCLUSION OR LIMITATION
MAY NOT APPLY TO YOU.
The limited warranty on a Product may be transferred for the remaining
term if the then current owner transfers ownership of the Product and
notifies CATC of the transfer. You may notify CATC of the transfer by
writing to Technical Support at Computer Access Technology Corporation,
3385 Walsh Avenue, Santa Clara, CA 95054 USA or by email at:
[email protected]. Please include the transferring owner's name and
address, the name and address of the new owner, the date of transfer, and the
Product serial number.
155
CATC
FCTracer4G and FCTracer User’s Manual
156
SW Version 2.10