1
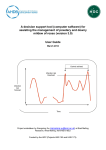
Resistan
Version 6.2
User’s Manual
Phil A. Arneson
Barr E. Ticknor
Cornell University
Cornell University
A BioQUEST Library VII Online module published by the BioQUEST Curriculum Consortium
The BioQUEST Curriculum Consortium (1986) actively supports educators interested in the
reform of undergraduate biology and engages in the collaborative development of curricula.
We encourage the use of simulations, databases, and tools to construct learning environments
where students are able to engage in activities like those of practicing scientists.
Email: [email protected]
Website: http://bioquest.org
Editorial Staff
Editor:
Managing Editor:
Associate Editors:
John R. Jungck
Ethel D. Stanley
Sam Donovan
Stephen Everse
Marion Fass
Margaret Waterman
Ethel D. Stanley
Online Editor:
Amanda Everse
Editorial Assistant: Sue Risseeuw
Beloit College
Beloit College, BioQUEST Curriculum Consortium
University of Pittsburgh
University of Vermont
Beloit College
Southeast Missouri State University
Beloit College, BioQUEST Curriculum Consortium
Beloit College, BioQUEST Curriculum Consortium
Beloit College, BioQUEST Curriculum Consortium
Editorial Board
Ken Brown University of Technology, Sydney, AU
Joyce Cadwallader St Mary of the Woods College
Eloise Carter Oxford College
Angelo Collins Knowles Science Teaching Foundation
Terry L. Derting Murray State University
Roscoe Giles Boston University
Louis Gross University of Tennessee-Knoxville
Yaffa Grossman Beloit College
Raquel Holmes Boston University
Stacey Kiser Lane Community College
Peter Lockhart Massey University, NZ
Ed Louis The University of Nottingham, UK
Claudia Neuhauser University of Minnesota
Patti Soderberg Conserve School
Rama Viswanathan Beloit College
Linda Weinland Edison College
Anton Weisstein Truman University
Richard Wilson (Emeritus) Rockhurst College
William Wimsatt University of Chicago
Copyright © 1993 -2006 by Phil A. Arneson and Barr E. Ticknor
Copyright, Trademark, and License Acknowledgments
Portions of the BioQUEST Library are copyrighted by Annenberg/CPB, Apple Computer Inc., Beloit College, Claris
Corporation, Microsoft Corporation, and the authors of individually titled modules. All rights reserved. System 6,
System 7, System 8, Mac OS 8, Finder, and SimpleText are trademarks of Apple Computer, Incorporated. HyperCard
and HyperTalk, MultiFinder, QuickTime, Apple, Mac, Macintosh, Power Macintosh, LaserWriter, ImageWriter, and the
Apple logo are registered trademarks of Apple Computer, Incorporated. Claris and HyperCard Player 2.1 are
registered trademarks of Claris Corporation. Extend is a trademark of Imagine That, Incorporated. Adobe, Acrobat, and
PageMaker are trademarks of Adobe Systems Incorporated. Microsoft, Windows, MS-DOS, and Windows NT are
either registered trademarks or trademarks of Microsoft Corporation. Helvetica, Times, and Palatino are registered
trademarks of Linotype-Hell. The BioQUEST Library and BioQUEST Curriculum Consortium are trademarks of Beloit
College. Each BioQUEST module is a trademark of its respective institutions/authors. All other company and product
names are trademarks or registered trademarks of their respective owners. Portions of some modules' software were
created using Extender GrafPak™ by Invention Software Corporation. Some modules' software use the BioQUEST
Toolkit licensed from Project BioQUEST.
LEGAL DETAILS
Resistan is a mechanistic simulation of the selection of fungicide resistance
(Arneson, et al., 1988). The simulation has been written for the Microsoft Windows
environment (ver. 3.0 or higher) by Barr Ticknor and Phil Arneson, Department of Plant
Pathology, Cornell University.
These files should be kept together in the same folder:
RESISTAN.EXE
KEYHOOK.DLL
RESISTAN.HLP
VENTURIA.RSS
- the main program
- the keyhook library which supports the context
sensitive help system.
- the help file
- the Resistan document used by the Evolution exercise
included with Resistan.
i
TABLE OF CONTENTS
ABOUT THIS MANUAL ................................................................................................................ 1
INSTALLATION AND QUICK INSTRUCTIONS.......................................................................... 1
FUNGICIDE RESISTANCE............................................................................................................ 2
MODEL DESCRIPTION ................................................................................................................ 4
THE FUNGUS LIFE CYCLE ............................................................................................................. 4
Infection................................................................................................................................. 5
Lesion Development........................................................................................................... 6
Sporulation............................................................................................................................ 6
Mortalities .............................................................................................................................. 7
OVERWINTERING ........................................................................................................................... 8
FUNGICIDAL EFFECTS .................................................................................................................... 8
PLANT FUNCTIONS .......................................................................................................................11
ECONOMICS ................................................................................................................................12
PROGRAM FEATURES ..............................................................................................................13
FILE MENU..................................................................................................................................13
FUNGICIDES MENU ......................................................................................................................15
FUNGUS MENU ............................................................................................................................16
PLANT MENU...............................................................................................................................18
SEASON MENU............................................................................................................................19
ECONOMICS MENU ......................................................................................................................19
HELP MENU ................................................................................................................................20
DURING THE SEASON..................................................................................................................20
TUTORIAL AND SUGGESTED EXERCISES ............................................................................22
REFERENCES..............................................................................................................................29
ii
ABOUT THIS MANUAL
Throughout the manual, menu names are printed in Italics. Menu commands and the
names of buttons and other controls are given in Boldface. Individual keys are
indicated by the name of the key enclosed in angle brackets; thus, <Enter> represents
the Enter key. Two or more keys joined by a "+" represent a key combination. For
example, <Ctrl>+<+> indicates that you should press and hold the Control key while
pressing the Plus key.
INSTALLATION AND QUICK INSTRUCTIONS
Resistan will run on any system which supports Microsoft Windows.
required, and a math coprocessor is strongly recommended.
A mouse i s
To install, insert the BioQUEST Library CD that is compatible with the Windows
operating system into the appropriate drive of your computer. Open the Online Guide.
Using the instructions on the first page of the Online Guide, navigate to the "Resistan "
section of the Guide. Clicking on the Install button on the bottom of the page will start
the installation process. Follow the instructions on the screen.
Note: To use the Online Guide, the Acrobat Reader must be installed on your
computer. For best results, we suggest that you install Acrobat Reader version 4.0 or
later. An installer for Reader version 4.0 is included on the BioQUEST Library CD.
Run RESISTAN.EXE just as you would any other Microsoft Windows program.
Reasonable default values are provided for all program options and parameters.
Select File Run to begin your first simulated season. At this point, a pair of axes will
be drawn. The x-axis represents time, and is labelled with dates. The y-axis is an
arbitrary scale of 0 to 100 used to display the various inputs and results of the
simulation.
The View menu allows you to choose which variables will be drawn on the graph, and
shows the units and color for each variable. Pressing the mouse button while the
cursor is on the graph area will display the coordinates of the tip of the cursor. The
scrollbar just below the x-axis is used to advance time.
Resistan features a context sensitive help system, which is accessed by pressing the
<F1> key or using the Help menu. Use the help system and this manual to learn
more about the program as you go along. By resizing and rearranging the windows,
you can keep the manual and/or help system available while you're using Resistan.
Page 1
FUNGICIDE RESISTANCE
One of the problems arising from the intensive use of fungicides is the selection of
biotypes of the target fungus that are resistant to the fungicides being used. This is
particularly a problem with the new systemic fungicides with specific, single-site
biochemical modes of action.
The only sure way to avoid problems with fungicide resistance is to avoid using
fungicides, or at least avoid using those fungicides that are "vulnerable" to fungicide
resistance. There are important reasons for using these fungicides, however, so
avoiding their use is not a satisfactory solution to the problem of resistance. The
alternative is to learn to manage the resistance and to obtain maximum benefit from
the fungicide without selecting a fungus population with a high frequency of
resistance.
Unfortunately, there are few general rules for managing fungicide resistance. First,
the fungicides themselves vary widely in their biochemical modes of action and the
spectrum of organisms against which they are effective. Secondly, different fungi
differ widely in their capacity to produce fungicide resistant biotypes. If we truly want to
manage resistance, we must consider each fungus and each fungicide on a case-bycase basis.
There are several factors that affect the rate at which the frequency of fungicide
resistance increases to the point where disease control becomes a problem. The
first is the initial frequency of resistant individuals in the fungal population. It matters
little whether those individuals existed before the fungicide was used or whether a
fungicide-resistant biotype arose by a chance mutation some time after the fungicide
had been in use. In either case what is important is the proportion of the propagules
of the fungus that are of the resistant (or, if you prefer, "less sensitive") biotype at any
point in the epidemic.
The second factor is the rate of selection of the resistant biotype, that is, its relative
success in surviving and reproducing (compared with the sensitive biotype) in the
presence of the fungicide. This is affected by the dose of the fungicide (the higher the
dose, the less chance for "escapes" of the sensitive biotype) and by the level of
resistance expressed in the resistant biotype. For example, if the lethal dose for the
resistant biotype were 100 times that required for the "wild type", we would expect to
see a faster rate of selection than if the resistant biotype were killed by only twice the
dose required to kill the wild type.
The third factor is the fitness of the resistant biotype relative to the sensitive biotype in
the absence of the fungicide. This affects the rate at which the resistant population
"reverts" to the wild type without continued selection by the fungicide to which it is
resistant. The effect of fungicide resistance on the fitness of the fungus varies quite
widely, depending on the biochemical basis of resistance. For example, many fungi
Page 2
resistant to benomyl seem to be nearly as ecologically fit as their benomyl- sensitive
counterparts, whereas some of the fungi resistant to some of the dicarboximide
fungicides appear to gain that resistance only at great metabolic cost, and they are far
less able to compete in the absence of the fungicide than are their corresponding wild
types.
Page 3
MODEL DESCRIPTION
Resistan is a mechanistic simulation model of the process of selection of fungicideresistant biotypes of a hypothetical fungal pathogen of a hypothetical crop. The
fungus is a polycyclic organism with many generations per season. There is no
genetic component in this simulator. Reproduction is assumed to be asexual. A small
proportion of the initial inoculum is designated as the fungicide-resistant biotype at
the start of the season, and the response of that population to various fungicide spray
programs is observed as the season progresses.
This section summarizes the equations that determine the general structure of the
model and its overall behavior. These equations are the quantitative relationships
that describe the key biological mechanisms in the development of the fungus and
how they are affected by the fungicides. The specific behavior of the model depends
on the values of the parameters in these equations. Resistan can be made to
simulate different fungi and different fungicides by changing these parameters. All of
the parameters in Resistan (along with several of the options and the initial values of
many of the variables) can be changed during execution of the program through the
menu system. They can be saved in a startup file with the Save As... command. (See
Program Features below.)
The Fungus Life Cycle
Development of the fungus is simulated with three life-stages (Arneson et al., 1988).
A population of spores, dispersed and landed on susceptible tissue, germinates and
infects, giving rise to a population of latent lesions. The latent lesions develop into
sporulating lesions, whose spores are then dispersed to complete the cycle. The
spore population can be augmented by spores blowing in from outside the treated
area. At each stage of development there are losses from the population, resulting
from both natural mortality and the effects of the fungicide.
The above description actually represents only one subpopulation of the fungus in the
model. The default model has four such subpopulations developing in parallel, one
sensitive to both fungicides, one resistant to each of the fungicides individually, and
one resistant to both fungicides. In the equations that follow, variables that are
calculated separately for each of the subpopulations are indicated by a subscript S.
An optional 16-subpopulation model can be selected to simulate the effects of four
fungicides simultaneously. The subpopulations differ only in their mortality rates,
both in the presence of toxic levels of the fungicides and also in the absence of
fungicides. If there is a fitness cost associated with fungicide resistance, the
mortalities of the resistant subpopulation are slightly higher. Without continued
suppression of the sensitive biotype by applications of the fungicide, the sensitive
Page 4
subpopulation will increase slightly faster than the resistant subpopulation, resulting
in a gradual reversion to a low frequency of resistance in the whole population.
By adjusting the parameters that describe the fungus life cycle, Resistan can be
made to simulate any fungus that has multiple cycles of infection during a single
season. These changes can be made by selecting Life Cycle... in the Fungus menu.
Infection
Infection is the process by which landed spores germinate and establish latent
lesions. The rate of infection is determined as follows:
InfectS = SporesS * InfEff * Suscep * (Limit - TotLes) / Limit
where
InfectS is the rate of infection for a given subpopulation of spores
Spores is the number of deposited spores per unit land area
InfEff is the Infection Efficiency, that is, the proportion of landed spores that
successfully infect per day. It is estimated by depositing a known number of
spores on a susceptible surface and counting the infections that result
following incubation in a favorable environment. The parameter is the number
of infections per deposited spore. This parameter can be changed in the
Fungus Life Cycle dialog box.
Suscep is the relative susceptibility of the crop, expressed as a proportion. A
profile of relative susceptibility throughout the season can be created using the
Susceptibility option in the Plant menu.
Limit is the Lesion Limit, the upper limit on the number of lesions per unit land
area. Its purpose is to prevent unlimited population growth in the event of an
uncontrolled epidemic. This may be an awkward unit with some fungi where
disease is measured as a proportion of tissue infected or as lesions per unit of
leaf area. However, by using an average lesion size and an estimate of total
leaf area per unit of land area, it is possible to express this value in the
appropriate units. This parameter can be changed in the Fungus Life Cycle
dialog box.
TotLes is the total number of lesions per unit land area.
Latent lesions are defined as established infections which are not yet sporulating.
The size of the population of latent lesions in each subpopulation at each time step is
determined by the infection rate and the rate of development into sporulating lesions:
LatentS = LatentS + (InfectS - DevelopS) * dt
Page 5
where
LatentS is the number of latent lesions in the given subpopulation per unit land
area.
InfectS is the rate of infection defined above.
DevelopS is the rate of development of latent lesions into sporulating lesions,
defined below.
dt is the time step of the simulation, 1/10 day.
Lesion Development
The rate of development of latent lesions into sporulating lesions per day is given by:
DevelopS = (1 - InhibLes) * LatentS / LatPer
where
InhibLes is the inhibition of lesion development by the fungicides (proportion),
defined below under Fungicidal Effects
LatPer is the Latent Period of the fungus in days, that is, the time from initiation of
infection until a sporulating lesion appears. This is an average value over a
wide range of environmental conditions.
The number of sporulating lesions in each subpopulation at each time step is
influenced by the rate of lesion development:
LesionS = LesionS + DevelopS * dt
where
LesionS represents the number of sporulating lesions in a given subpopulation
per unit land area
Sporulation
The rate of sporulation is given by the following equation:
SporulS = LesionS * RateSp * (1 - InhibSp) * Dispersal
where
Page 6
SporulS is the number of spores per day per unit land area that land on
susceptible sites
RateSp is the Sporulation Rate, the number of spores produced per lesion per
day, averaged over the infectious period
InhibSp is the inhibition of sporulation by fungicides (proportion)
Dispersal is the Spore Deposition rate. This is the proportion of the dispersed
spores that actually land on susceptible tissue. It is a very difficult parameter to
estimate empirically and may have to left as a "tuning" parameter, that is, a
parameter whose value is iteratively readjusted after comparing simulated
epidemics with real epidemics.
The total population of landed spores in each time step is determined by the
sporulation rate, the number of spores that blow in from other areas, and the infection
rate:
SporesS = SporesS + (SporulS + BlowInS - InfectS) * dt
where
SporesS represents the total population of spores landed on a susceptible site.
SporulS is the sporulation rate defined above
Blowin is the number of spores per day that blow in from outside the simulated
area and can be set using Inoculum in the Fungus menu. Blowin introduces
only spores that are sensitive to all the fungicides. Resistance will appear in
this inoculum at the Mutation Rate set in the Fungicide Characteristics dialog
box.
InfectS is the rate of infection defined above
Mortalities
The daily mortalities of spores, latent lesions, and sporulating lesions (...DeathS) are
proportions that are functions of both natural mortalities and fungicidal effects:
SporeDeathS = 1 - SurvSp * FitnesSpS * FSurvS
LatentDeathS = 1 - SurvLa * FitnesLaS
LesionDeathS = 1 - SurvLe * FitnesLeS / InfPer
where
SurvSp, SurvLa, and SurvLe are the natural daily survivals (proportion/day) of the
spores, latent lesions, and sporulating lesions, respectively. The Daily
Page 7
Survival Rates represent averages over a wide range of environmental
conditions. They can be adjusted in the Fungus Life Cycle dialog box.
FitnesSpS, FitnesLaS, and FitnesLeS represent the relative fitnesses of each of the
subpopulations. Fitness of Resistant Biotype can affect all three stages of
fungal development; spore survival, lesion development and sporulation. All
three factors are expressed as proportions ranging from 0 to 1. If the resistant
and sensitive biotypes are equally fit, the factor is one. The relative fitness of
the resistant biotype cannot be measured or estimated easily from laboratory
or field experiments. It is most easily estimated by repeatedly readjusting the
fitness factors after running Resistan until the simulated rate of reversion to the
sensitive biotype approximates that observed in the field.
FSurvS represents the daily proportion of the spores in each subpopulation that
survive the fungicide treatment. Note that the fungicides do not affect the
mortalities of latent lesions and sporulating lesions.
InfPer is the Infectious Period, the number of days that the lesion continues to
produce spores. This is an average value over a wide range of environmental
conditions.
Following fungus development in each time step, the state variables are adjusted for
mortality as follows:
SporesS = SporesS * (1 - SporeDeathS * dt)
LatentS = LatentS * (1 - LatentDeathS * dt)
LesionS = LesionS * (1 - LesionDeathS * dt)
Overwintering
The Overwintering factor is a simple proportionality factor to convert the final lesion
count in one season to initial inoculum for the following season. It is expressed as
the number of spores dispersed (not yet deposited) at the start of the following
season per sporulating lesion existing at the end of the season (not necessarily per
overwintering lesion).
Fungicidal effects
Resistan simulates the application of fungicide sprays, the weathering of fungicide
residues from plant surfaces, and the effects of the remaining fungicide residues on
spore mortality, the rate of lesion development, and the rate of sporulation. The
simulated fungicides can be made to mimic specific fungicides by changing their
parameters in the Fungicide Characteristics dialog box.
Page 8
The application dose of the fungicide is converted to a deposit on the leaf surface:
DepositF = DoseF * DosDepFactF
where
Deposit is the amount of fungicide on the plant surfaces expressed in micrograms
per square centimeter.
Dose is the number of units of measure of the fungicide applied as a spray per
unit of land area.
DosDepFact is the Dose->Deposit Factor calculated by dividing the measured
deposit in micrograms per square centimeter of plant surface by the rate of
application. The units in which the dose is expressed (both the quantity of
fungicide, and the unit of land area) may vary, as long as the same units are
used consistently throughout the program. The default doses are expressed in
pounds of active ingredient per acre.
The residues of the fungicides are weathered from the plant surfaces with a negative
exponential function:
ResidF = ResidF - WeathRateF * ResidF
where
ResidF is the residue of fungicide F in micrograms per square centimeter
WeathRateF is the Weathering Rate of fungicide F, which expresses the rate at
which the fungicide residue disappears from plant surfaces as a proportion
lost per day (the exponent in a negative exponential function). It is estimated by
regressing the natural log of the measured residue in micrograms per square
centimeter of plant surface versus time in days following the application. This
parameter is the negative slope of the regression line, and should represent
an "average" from different parts of the crop canopy and following a wide range
of environmental conditions.
The time step for this state equation is one day.
Simulation of spore mortality in response to fungicide dose assumes that the probit
kill is a linear function of the logarithm of the dose, a function that can be described
with two parameters, a slope and an ED50 intercept.
ProbitSF = 5 + SlopeF * Log10 (ResidF / (ED50)F / ResLevSF)
where
Page 9
ResLevSF is the Resistance Level, which is 1.0 for the sensitive biotype and
greater than one for the resistant biotype.
SlopeF is The Dose-Response Slope, the slope of the probit kill / log dose function
for fungicide F on the target fungus.
The ED50 Spore Mortality is the antilog of the point on the ordinate that
corresponds to probit 5 on the abscissa. Its units are micrograms per square
centimeter of leaf surface, and its values depend on the target fungus.
This function is evaluated for each fungicide and each subpopulation. Probits are
then transformed into the proportion of each subpopulation that survives each
fungicide using a logistic approximation of the cumulative normal distribution:
SurvIfSF = 1. - 1. / (1. + 19466.6 * Exp(-1.97529 * ProbitSF))
The combined effects of both fungicides (all four fungicides in the 16-subpopulation
model) on each subpopulation are the products of the daily survivorships of each of
the fungicides:
FSurvS = SurvIfSF1 * SurvIfSF2
Fungicide inhibition of lesion development is simulated as a saturation function:
InhibLeSF = ResidF / (ED50LeF * ResLevSF + ResidF)
where
ED50LeF is the/* ED50, Inhibition of Lesion Development, the*/ fungicide dose that
gives 50% inhibition of lesion development (the half-saturation constant).
ResLevSF is the Resistance Level of the subpopulation to the fungicide. The
resistance level of the sensitive biotype is 1.0. The Resistance Level of a
resistant subpopulation is the the factor by which the ED50, INHIBITION OF
LESION DEVELOPMENT, and INHIBITION OF SPORULATION of the sensitive
biotype are multiplied to get the corresponding parameters for the resistant
biotype. For example, if the resistant biotype required 100 times the dose to
achieve the same level of control as the sensitive biotype, the resistance level
would be 100. The resistance level for resistant subpopulations can be
adjusted in the Fungicide Characteristics dialog box.
Fungicide inhibition of sporulation also is simulated as a saturation function:
InhibSpSF = ResidF / (ED50SpF * ResLevSF + ResidF)
Page 10
where
ED50SpF is the ED50, Inhibition of Sporulation, the fungicide dose that gives 50%
inhibition of sporulation (the half-saturation constant).
ResLevSF is the resistance level of the subpopulation to the fungicide. (The
resistance level of the sensitive biotype is 1.0.)
The Mutation Rate is the rate at which mutation to the resistant biotype occurs. It is
expressed as a percentage, and serves as a lower limit on the percent resistance in
the fungal population.
Plant functions
Suscep is a host susceptibility factor between zero and one used to adjust the rate of
infection. The Plant Susceptibility... command can be used to create a susceptibility
profile for the entire season.
To allow comparison of spray schedules on a benefit-cost basis, Resistan has some
simple crop damage functions and a cost accounting routine that tallies up the costs
and revenue at the end of the season. The number of lesions in the subpopulations
is summed to determine the total number of lesions per unit land area. Crop damage
as a proportion of the crop lost per day is a saturation function of the total number of
lesions:
Damage = MaxLoss * (TotLes / (HalfK + TotLes))
where
MaxLos is the Maximum Crop Loss per day. The relationship between number of
lesions and crop damage is modeled as a saturation function, and this
represents the proportion of the crop lost per day at the saturation lesion count.
Estimation of the Maximum crop loss (m) is described below under Damage
Constant.
HalfK is the Damage Constant, the half-saturation constant for damage as a
function of lesion population. This parameter represents the lesion count at
which the proportion of the crop lost per day is one-half its maximum. To
estimate the Damage Constant it is necessary to estimate the crop loss at
several intensities of disease at one time during the season, measuring crop
loss as a proportion and disease as number of lesions per unit land area (acre
or hectare). Regress the inverse of proportional crop loss versus the inverse of
lesions per unit area to fit the model:
1/y = 1/m + (k/m)(1/x)
Page 11
where
y is the proportional crop loss
x is lesions per unit area
m is the Maximum Crop Loss, that is, the crop loss at the saturation level of
disease
k is the Damage Constant, the lesions per unit area at half the saturation
level of disease.
Obviously not all crops fit this crop loss model, and in general this kind of crop loss
data is very difficult to get. Remember that these functions are only used to compare
fungicide spray schedules on benefit/cost basis and do not affect the simulation of the
selection of fungicide resistant fungus populations. Crude approximations at this
point will not seriously affect the utility of the program for understanding the principles
of fungicide resistance management or even comparing specific spray programs.
The total crop loss accumulates logistically:
Loss = Loss + Damage * (1 - Loss)
where
Loss is the cumulative proportion of crop loss.
Economics
Total costs, total revenue, and profit are calculated at the end of each season, based
on the following parameters:
Fungicide Cost is used in the benefit-cost analysis at the end of the simulation.
Application Cost is the cost of a single spray application in the desired monetary
units per unit of land area (e.g., dollars per acre). This does not include the
cost of the fungicide.
Fixed Costs are the total crop production costs, excluding the fungicide spray
application cost and the cost of the fungicides, in the desired monetary units
per unit of land area (e.g., dollars per acre).
Maximum Revenue is the expected revenue from the crop without any losses
resulting from the disease (dollars per acre).
Page 12
PROGRAM FEATURES
To use Resistan you first enter the parameters appropriate for the fungus of interest
and its associated fungicides. Next, you enter the level of initial inoculum of the
fungus and the frequency of resistance to each of its fungicides. You select the
desired fungicides from the menu choices, and enter the desired spray dates and
application rates. You then run the simulation for the designated number of days. As
the simulation progresses, you can observe day by day the number of lesions and the
percent resistance to each of the fungicides in response to the spray applications. At
the end of the simulated season there is a cost accounting that you can use to
compare different spray schedules on a cost/benefit basis. If you want to test a spray
program over a period of several growing seasons, Resistan will simulate the
overwintering of the inoculum and carry over the resistant populations from one year
to the next. You might then repeat the entire sequence, testing a different proposed
spray schedule, perhaps including tank-mixes of fungicides, alternating fungicide
sprays, or implementing a program of reduced rates or fewer sprays of the at-risk
fungicide.
File Menu
Run
Once you have decided on the appropriate options and parameters, select Run from
the File menu to begin the simulated season. To advance the progress of the
simulation during the season, use the scroll bar beneath the graph. Clicking on the
arrow at the right end of this scroll bar will cause the simulation to advance by one
day. Clicking the page-up area will advance by one week; or dragging the thumb will
allow you to go to an arbitrary date. Just as in the real world, you can't go back in time.
Resistan starts with default values for all of its variables, so you can run your first
season simply by selecting Run. Once you become acquainted with the program,
you'll want to apply different fungicides, change spray schedules or even change the
characteristics of the fungus or fungicides.
Continue
Resistan will simulate the overwintering of the inoculum and carry the resistant
population over from one year to the next. Select Continue from the File menu. You
will then be given the opportunity to look at and/or change many variables, such as
spray schedules, percent resistance, and initial inoculum at the start of the coming
season. If you choose not to have access to these variables, the simulation will
continue with the next season. If you opt to look at and/or change some variables, you
will have to select Continue again to start the simulation of the next season.
Page 13
New
New allows you to begin a new simulation. It will return the program to the beginning
of year one, just as if you had exited and started over. If you have saved a file called
STARTUP.RSS, it will be loaded automatically; otherwise, the default values will be
restored. You may want to use the Save As... command before selecting New so that
you can recall the current season at a later time.
Open...
Open allows you to open a saved Resistan document in which is stored the state of
the program at the moment you executed the Save As... command in a previous run.
This includes all program options and parameter values. If the season was in
progress when the document was saved, opening it will return you to the day on which
it was saved. (This is a good way to explore and compare different management
strategies.)
Save As...
Save As... creates a Resistan document on disk using the name and extension you
provide. Use of the .RSS extension is strongly recommended to distinguish Resistan
documents from other types of files. If you add a line for the .RSS extension to the
[extensions] section of your WIN.INI file, you will be able to start Resistan simply by
double clicking a document.
A Resistan document contains the complete state of the program at the time the
document was saved. If you save a document named STARTUP.RSS, Resistan will
load it automatically when you start the program. In this way, you can override the
default values provided for the various parameters and options.
A document saved before selecting Run will contain only the program options and
initial parameter values and will take considerably less space on disk. A document
saved while a season is in progress will contain all information for that season up to
the time when it was saved.
Log to Disk...
A plain text record of all parameter values and day-by-day simulation results can be
saved to disk using the Log to Disk... selection in the File menu. This is especially
useful for preparing printed reports. Whether you choose Log to Disk before a
season is started, in the middle of a season, or at the end of a season, the log file will
include all initial values and results from the beginning of the season onward. If the
log is closed before the end of the season, only the data up to the day when the log
was closed will be saved. A single log file can be used to record the results of several
successive seasons.
Page 14
Exit
This selection terminates Resistan. The same thing can be accomplished by double
clicking the close box in the upper left corner of the Resistan window.
Fungicides Menu
Resistan offers you a choice of four different fungicides, any two of which can be
applied in any given season. The default fungicides are patterned after "families" of
real fungicides in order to make the simulation realistic, but rather than make them
represent specific fungicides, they are simply given generic names. You can simulate
any particular fungicide that you wish by entering its characteristics in the dialog box
described below.
Select
Select will bring up a dialog box with two select controls, one for either of the two
fungicides that may be applied. Clicking on the "chasing arrows" icon or the fungicide
name will scroll the selection. When you are done, click OK to accept the selections
as shown, or CANCEL to end the dialog without changing selections.
Schedules
Schedules will enable you to examine or modify the spray schedules for all of the
available fungicides. Clicking on the select control (indicated by the "chasing arrows")
at the top of the Fungicides Select dialog box will scroll you through the different
schedules. You may apply any fungicide up to 20 times in a season. Dates are
specified in days from the beginning of the season, and doses are in units of active
ingredient per unit land area. (You define the units when you enter the parameters for
the fungicide, the plant, and the fungus.) To enter a large number of dates on a
regular schedule, click the Dates button. This will allow you to set all dates based on
a beginning date and interval that you provide. If fewer than twenty applications of a
given spray are scheduled, some of the "Day" positions will be occupied by zeroes.
The Doses button allows you to specify a single dose to be used for all applications.
If the spray date for an entry is set to zero, no spray will be applied regardless of dose.
When you are satisfied that all schedules are as desired, click OK. CANCEL will
discard any changes made to the spray schedules.
The fungicide schedules set up at the beginning of the season may be changed while
the season is in progress by using the spray nozzle controls, which hang beneath the
x-asis. For more details see the section titled "During the Season", below.
Page 15
Characteristics
The parameters that characterize the fungicides can be changed to represent any
fungicide of your choice by selecting the Characteristics menu item. A dialog box will
appear showing the name of one of the fungicides and its characteristics. The
"chasing arrows" icon next to the fungicide name indicates that this is a select control.
Clicking on the chasing arrows or the name itself scrolls the fungicide. When you're
finished, click the OK button. Clicking cancel will discard all changes made since the
dialog box was opened. For a description of the various fungicide characteristics, see
the section on Fungicidal Effects under Model Description.
Fungus Menu
By selecting the appropriate dialog box in the Fungus menu, you can observe (or set)
the percent resistance to each fungicide at the start of the next season, observe (or
set) the initial inoculum for the coming season, and observe (or set) the parameters
that determine the characteristics of the fungus being simulated.
Resistance...
The percent of the spore population resistant to each fungicide can be set at the start
of each season. (The default is the mutation rate set under Fungicide
Characteristics.)
Inoculum...
The initial inoculum in spores per unit of simulated area (acres or hectares) at the
start of each season can be read (from the simulated overwintering) or can be set to
the desired value. The total number of spores given will be released uniformly over
the period given.
Inoculum blown in from outside the simulated area is sensitive to all the fungicides.
Life Cycle...
By adjusting the parameters that describe the fungus life cycle, Resistan can be
made to simulate any fungus that has multiple cycles of infection during a single
season. The life cycle parameters are described under Model Description.
4 Subpopulations
Resistan normally simulates four subpopulations of the Fungus. Each subpopulation
is either resistant or sensitive to each of the two fungicides being applied. If you
change fungicide selections between seasons, the level of resistance to the "old"
selections will not be calculated during subsequent seasons. Hence, with only four
Page 16
subpopulations you can't watch the decline in resistance to a fungicide after it is
replaced with an alternative material.
16 Subpopulations
Selecting 16 Subpopulations causes the simulator to use 16 subpopulations, each
sensitive or resistant to each of the four fungicides independently. The main window
and text log will still show daily output only for the fungicides being applied; however,
resistance values may be obtained from the subpopulation calculator or the
resistance dialog box for any of the four fungicides. Note that this option quadruples
the number of calculations that must be performed and will affect execution speed
accordingly.
The Subpopulation Calculator
When the simulator is running, the last item in the Fungus menu will be
Subpopulations.... This item invokes the subpopulation calculator with which you can
determine the size of any specific subpopulation. Use the buttons of the calculator to
enter an expression describing the subpopulation whose size you wish to determine.
The expression will be displayed as you enter it. When you hit the [=] button, the
display will show the number of sporulating lesions in that subpopulation. When you
hit the [Off] button, the calculator will disappear.
[(] and [)]
The parentheses are used as in mathematical expressions to control the order in
which operations are performed. In unparenthesized expressions, "and", represented
as '+', takes precedence over "or", represented as '|'.
[CE]
This button allows you to correct mistakes in entering an expression. Use it as you
would the backspace key on a keyboard or the CE key on a conventional calculator.
[C]
Unlike [CE], [C] clears the display completely, allowing you to begin a new expression.
[1 Dithiocarbamate]
The four keys of this form are used to represent the four fungicides. They won't all be
used unless the simulator is running in the "16 subpopulations" mode. As you enter
an expression, the number at the left will be used to represent the fungicide whose
name is shown.
[Sensitive] and [Resistant]
Page 17
These buttons indicate sensitivity or resistance to the fungicide they follow.
E.g.:
1R indicates Dithiocarbamate Resistant
1S indicates Dithiocarbamate Sensitive
S1 is an Error!
[And +] and [Or |]
These are the logical "and"/"or". 1R + 2R indicates that all individuals in the
subpopulation are resistant to BOTH fungicide 1 and fungicide 2. 1R | 2R indicates
that any individual in the subpopulation is resistant to EITHER OR BOTH of fungicides
1 and 2.
[=]
This button indicates that the expression shown is to be evaluated. The result is the
number of sporulating lesions which fit the description specified by the expression.
Examples:
(1R | 2R) + 3S
Sporulating lesions in this subpopulation are resistant to either or both of fungicides 1
and 2, and all sporulating lesions are sensitive to fungicide 3.
1R | 2R + 3S
1R | (2R + 3S)
Because + takes precedence over |, these expressions are equivalent. Sporulating
lesions in this subpopulation are either resistant to fungicide 1 or (resistant to 2 and
sensitive to 3).
Plant Menu
For simulating those diseases where the susceptibility of the host plant varies as the
season progresses, Resistan has an adjustable susceptibility profile.
To allow comparison of spray schedules on a benefit-cost basis, Resistan has some
simple crop damage functions and a cost accounting routine that tallies up the costs
and revenue at the end of the season.
Page 18
Susceptibility...
The Susceptibility Profile can be used to adjust the relative host susceptibility
throughout the season. First set the length of the season by clicking on Season in the
main menu, then click on Susceptibility in the Plant menu. Move the cross-hair
cursor to the desired coordinates and click to establish a new anchor point for the
profile. As many anchor points as desired can be established. To make fine
adjustments of each anchor point, locate the cross-hairs over the point (at which time
the cursor becomes an arrow again), and while the button is pressed down, drag the
point to the desired coordinates. (Note that the coordinates are printed on the screen
while the button is down.) Releasing the button leaves the anchor point at its new
coordinates. Remove an anchor point by double clicking while the cursor is located
on it. Exit the Susceptibility Profile window by double clicking the close box in the
upper left corner.
Damage...
Damage, defined as the proportion of the crop lost per day as a function of lesion
population, is simulated as a saturation function. The first parameter is the maximum
crop loss (proportion) per day, and the other is the damage constant (half saturation
constant), that is, the total number of lesions per unit area simulated that gives half
the maximum crop loss per day. Damage is accumulated day by day and approaches
1.0 using a multiple-hit function.
Season Menu
Length of Season...
Clicking on Season in the main menu bar will allow you to change the length of the
season.
Starting Date...
The start of the simulation can be set to any calendar date.
Economics Menu
Costs/Price...
To allow comparison of spray schedules on a benefit-cost basis, Resistan has some
simple crop damage functions and a cost accounting routine that tallies up the costs
and revenue at the end of the season. The fungicide application cost, the fixed costs
(all other costs), and the maximum revenue can be set according to the crop being
simulated.
Page 19
Show Pie Chart
At the end of each season, the Show Pie Chart menu item becomes activated. A
graphical benefit-cost analysis can be seen by selecting Show Pie Chart in the
Economics menu. Exit this window by double clicking the close box in the upper left
corner.
Help Menu
Resistan features a context sensitive help system which provides information about
all aspects of the program, To access the help system, press <F1>. This will take
you directly to the help item most appropriate for your current situation. If no specific
help item exists you will be presented with the help index. Selecting Index from the
Help menu will take you directly to the help index.
To get help on a menu command, pull down the menu and highlight the command
using either the mouse or the arrow keys. While the command is still highlighted
(don't let up on the mouse button!), press <F1>. The Help window will appear with the
appropriate information.
To get help while in a dialog box. press <F1>.
If you need more general help with the Microsoft Windows _ environment, use the
Help menu in either the Program Manager or File Manager window.
To learn more about the help system, press <F1> while the Help window is active, or
select Using Help from the Help window's Help menu.
During the Season
While the simulator is running, many of the menu items will be grayed and disabled.
This is because it would not be appropriate to change parameters in mid-season.
New may still be selected and has the same effect as at any other time: it takes you
back to the beginning of year one. You may Exit Resistan while the simulator is
running. The Subpopulation Calculator may be used during the season to determine
what percentage of the population has a specified combination of resistance
characteristics.
The main window shows a line graph where the x-axis is the day of the season and
the y-axis is a relative scale from 1 to 100. The most important control at this point is
the scroll bar just below the x-axis. Clicking on the arrow at the right end of this scroll
bar will cause the simulation to advance by one day. Clicking the page-up area will
advance by one week; or dragging the thumb will allow you to go to an arbitrary date.
Page 20
Just as in the real world, you can't go back in time. If any fungicide applications have
been scheduled, you'll see a triangular nozzle for each one hanging from the x-axis.
The nozzles can be dragged, changed, inserted or deleted to modify the spray
schedule that was set up before the season began.
While the simulation is in progress, you can change spray applications by
manipulating the spray nozzles. Note that the color of a nozzle indicates what
fungicide(s) it will apply. The colors used for the spray nozzles are the same as those
used to represent the fungicide residues on the graph. The date of an application can
be changed by dragging the nozzle to the left or right. Double-clicking a nozzle opens
its dialog box, which contains an edit control and a check box for each selected
fungicide. The edit control lets you change the rate of application while the check box
determines whether the fungicide will be applied. If no fungicide is checked when you
click the OK button, the nozzle will be removed from the graph. Double-clicking
anywhere along the x-axis (except on an existing nozzle) will create a new nozzle. Only
nozzles which have not yet discharged their spray can be changed; as in the real
world, you can't change history.
As the season progresses day-by-day, lines are plotted for the residues of the
fungicides, the frequencies of resistance to the fungicides, the number of lesions, and
the cumulative percent of crop damage. To convert the relative values plotted on the
graphs for residues to absolute units, multiply the relative value by the scaling factor
for that residue displayed in the View menu. For percent resistance and percent crop
loss, the y-axis values need no scaling.
Because the lesion population may cover a very broad range of values in a single
season, when it approaches the top of the graph it will "wrap around" to the bottom.
Each such break in the lesion line represents a ten-fold increase in the scaling factor.
Hence, if the lesion line is shown as three distinct line segments, y-axis values
should be multiplied by 1 for the first segment, 10 for the second segment, and 100
for the third segment. Rescaling without redrawing the entire graph avoids a
considerable loss of resolution in the early season part of the display. It also causes
the slope of the line plotted to decrease by a factor of ten with each rescaling. Hence,
if the lesion population is growing at a constant rate throughout the season and goes
off scale a few times, there will be an apparent leveling out toward the end of the
season. Differences in slope between discontinuous segments of the lesion line
should be interpreted with caution.
Page 21
TUTORIAL AND SUGGESTED EXERCISES
[These exercises are also available in a separate document called "Tutorial.doc".]
This tutorial assumes that you are already acquainted with Microsoft Windows.
Therefore, our instructions will focus on the simulation and the features unique to
Resistan. If you need help with the Windows environment itself, go to the Help menu
of either the Program Manager or the File Manager. The information presented there
explains the standard features of the environment.
The exercises suggested here represent only a small fraction of the versatility of
Resistan and the ways in which it can be used to explore fungicide resistance. In
addition to the structured exercises such as these, we encourage you to ask your own
questions and run the simulations necessary to answer them.
Saving a Startup File
As soon as you have started Resistan, confirm the starting values, options, and
parameters as follows:
In the Fungicides menu click on the Select menu item. The default selections are
"None" in both fungicide selections. (This would give you an unsprayed epidemic.) If,
for example, you wished to test a series of spray schedules using the Benzimidazole
alone, it would be useful to create a startup file with different defaults. Click on one of
the "chasing arrows" icons or one of the fungicide name windows until
"Benzimidazole" appears in the window, then click OK.
Again in the Fungicides menu click on Schedules to bring up the spray schedules
dialog box. Click on the chasing arrows or the fungicide name until "Benzimidazole"
appears. To create your own default benzimidazole spray schedule, click on the
Dates button and set the starting date and interval between sprays. Then click on the
Doses button and set the dose for all of the sprays. Individual dates and doses can
be changed by locating the cursor on the desired box, double-clicking on it, and then
entering the desired value. When the schedule is as you want it, click OK. Cancel will
discard any changes made to the spray schedules.
Next, in the Fungicides menu, click on Characteristics and scroll through the
fungicide names until "Benzimidazole" appears. To change one of the characteristics,
enter the new value in the edit control for that item. You can step through the items in
sequence by using the <Tab> key. If you do not understand the meaning of one of the
items, click on its edit control and then press <F1>. Double click in the close box in
the upper left corner of the window to exit the help system, or click the minimize button
near the upper right corner to keep the help application readily available but reduce it
to its icon.
Page 22
The next menu to check is the Fungus menu. Select Resistance... and set the
percent of the fungus population resistant to each fungicide that you wish in the
startup file. Under the Inoculum selection, set the number of spores to be released
and the period over which they will be released. Also set the number of nonresistant
sporers that will blow into the system each day. Select the Life Cycle... menu item and
check the characteristics of the fungus that you wish to simulate. If you do not
understand the meaning of any of the items, click on its edit control and then press
<F1>. When all of the values are as desired, click OK.
In the Plant menu select Susceptibility... to view the susceptibility profile for the
season. The default is uniform susceptibility at 100% throughout the season. If you
wish to change this for the startup file, press the <F1> key for instructions. Exit the
Susceptibility Profile window by double clicking in the upper left corner. Select
Damage... in the Plant menu to adjust the values for the function that determines the
amount of plant damage in response to the number of fungal lesions. Again the
explanation of each parameter can be found in the help system by pressing the <F1>
key. Click OK to accept the values.
In the Season menu, set the desired Length of Season and Starting Date.
Finally, in the Economics menu select Costs/Price... and set the desired values for
the economic parameters.
Once the starting values, options, and parameters are as you want them, save your
startup file by clicking on Save As... in the File menu. When the dialog box appears,
enter a file name (up to 8 characters with the usual DOS conventions) followed by
".RSS". If you use "STARTUP.RSS", Resistan will look for this file when the program
is started and load it automatically. You can also load it while the program is running
by selecting Open... from the File menu and double clicking on STARTUP.RSS (or any
other RSS file you have created) in the list box. If you wanted to run a series of
simulations with different spray schedules using the Benzimidazole, for example, a
startup file with the name "STARTBEN.RSS" would provide a convenient method
restoring the same starting values for each run.
Application of the Benzimidazole Alone
Using the Select item in the Fungicides menu, set up the simulation to apply the
Benzimidazole only. Use the default spray schedule for that fungicide. Start the
simulation by selecting Run in the File menu. Immediately the axes of a graph
appear, with calendar days along the x-axis and a percent scale as the y-axis. The
small triangles beneath the x-axis are spray nozzles indicating the days on which a
spray application will be made. Advance the simulation to the end of the season by
pressing the <End> key on the keyboard. After a few moments, during which the
simulation is executed, a graph of the year-end results appears. On it you can see the
graph of the Benzimidazole residues rising sharply with each application and
weathering away between applications. The black line rising exponentially toward the
Page 23
end of the season represents the numbers of lesions. If you accepted the the original
defaults for the parameters and starting values, you will not yet see any fungicide
resistance. (It is still below the detection threshold.)
From the Economics menu select Show Pie Chart and look at the bottom line profit for
the season. Exit the Economics window by double-clicking in the close box in the
upper left corner of the window.
Continue the simulation into the next season by selecting Continue in the File menu.
Click on No in response to "Save last season?". (Note: this would allow you to save in
a RSS file the entire state of the system at this point in the simulation.) Also click on
No in response to "Do you want to look at and/or change variable values between
seasons?". Press the <End> key again to execute the simulation to the end of Year 2.
Now we see a line rising in a logistic fashion to nearly 100%. Move the tip of the arrow
cursor to the upper right end of this line and hold down the left mouse button. You
should see the coordinates "Oct 17, Y = 96". If you have trouble distinguishing this
line from the others by the color, select Set Colors... from the View menu and click on
the button corresponding to Benzimidazole Resistance and then on the color that you
want followed by OK. Note that despite the nearly 100% resistance to the
Benzimidazole, the number of lesions at the end of the season is nearly the same as
in the previous season. This is because the excellent control during the previous
season held down the production of initial inoculum in Year 2.
Check the economic report again and compare the profit with that of the first season.
Despite the high level of resistance, there is still virtually no economic loss in the
second season.
Run a third season by clicking on File, Continue and then again pressing <End>.
Notice that the Lesions curve "wraps around" when it reaches the top of the scale and
starts a new line segment with a scale 10 times greater. The first segment
represents 100 lesions, the second 1000, and the third 10,000, so the end of the tiny
fourth line represents 11,000 lesions. Still, however, despite virtually 100%
resistance for the whole season, the losses are relatively minor. (Note the loss just
rising above the baseline at the end of the season.) Check the economic report again
to see that the profits are down only slightly.
Finally run a fourth season with the same spray schedule. Now we end the season
with over a million lesions, and the Loss graph rises to about 60%. Checking the
economic report, we see that now we have a net loss rather than a profit.
Save a log file of this season by selecting Log to Disk... in the File menu. In place of
the default name RESISTAN.TXT type BENZIMID.TXT, and click OK. Since we do not
want to log another season in this same file, click on the File menu again and close
the log file. Reduce Resistan to its icon by clicking on the small downward-pointing
triangle in the upper right corner of the window, and examine the BENZIMID.TXT file in
a text editor such as Windows Notepad. Go to the bottom of the file to find a year-end
Page 24
summary of the four consecutive seasons that you have just simulated. Exit the editor
and double click the Resistan icon to restore it to a normal-sized window.
Benzimidazole and Dithiocarbamate Tank Mix
Reset all the default values by selecting New in the File menu, choose Select... in the
Fungicides menu, and select the Dithiocarbamate as the first fungicide to be applied
and the Benzimidazole as the second. Examine the Benzimidazole spray schedule
using the Schedules... selection, but leave it as it is. Alter the Dithiocarbamate spray
schedule to apply the default dose on the same days as the Benzimidazole
application. (This will, in effect, be a tank mix of these two fungicides.) To change the
schedule, click on the Dates button, double click in the edit control for the "First Spray
Date", and enter "1". Then double click in the edit control for "Days Between
Applications", enter "14", and click OK. Now double click on the 113 in the "Days"
column and make it 0. Do the same with the 127, so that the schedule is the same
as the Benzimidazole schedule. Next click on the Doses button, and enter 3.0 for the
dose. Also change the dose of the Benzimidazole from 0.5 to 0.25. Now run the
simulation for six consecutive seasons and watch for Benzimidazole resistance.
Save the text summary of the 6th season with the Log to Disk... feature, using the file
name BENZDITH.TXT. Don't forget to close the log file! Compare the year-end results
of the Benzimidazole alone schedule with those of the tank-mix schedule.
The Fitness Cost of Fungicide Resistance
For some fungicides, particularly the systemic dicarboximides, there may be a
substantial reduction in ecological fitness in the fungal population that is resistant to
the fungicide compared to the sensitive wildtype. This can result in the apparent
"reversion" of the population to the sensitive biotype in the absence of the fungicide.
This, of course, is simply selection of the more fit sensitive biotype in the absence of
the fungicide selection in the other direction. The rate of this selection depends on
the relative reproductive disadvantage the resistant biotype has compared to the
wildtype, a factor that is often called the "fitness cost" of resistance. This exercise will
explore some of the factors involved in this reverse selection.
To reduce the amount of setup effort for the repeated runs of this exercise, we will
create a file to save some of the startup values. First reinitialize the program with New
(if you have not just restarted the program). In the Fungicides menu click on Select...
and select the Dicarboximide as the only fungicide. (In order for the graph to appear
on the screen, the fungicide must be selected, but we will not actually apply this
fungicide.) Then select Schedules..., call up the Dicarboximide schedule, and set all
the application dates to 0. Next in the Fungus menu select Resistance... and set the
resistance to the Dicarboximide to 20%. (This is just an arbitrary value, high enough to
see, but not high enough to affect the behavior of the overall population.) It also might
be helpful to set the colors of the graphs to something that will be easy to see. (We
will be observing Lesions, Dicarboximide Resistance, Loss, and also
Page 25
Dithiocarbamate Residues.) Finally, save this setup with Save as... in the File menu.
Call the file STARTFIT.RSS.
Run this program for one season without any fungicide sprays (Press <End>). Note
what happens to the incidence of resistance to the Dicarboximide and also the
number of lesions. Name this instance of Resistan FITNES90.RSS with the Save
As... command, and reduce it to its icon by clicking the downward pointing triangle in
the upper right corner of the window. (Note that the icon retains the name that you
gave it.) Now start another instance of Resistan just as you would from the beginning,
and initialize it by opening the saved STARTFIT.RSS file. This time select the
Dithiocarbamate as well as the Dicarboximide, and run the simulation to the end of
the season using the default spray schedule for the Dithiocarbamate. Name this
instance SPRAYD90.RSS with the Save As... command, reduce it to its icon also, and
start another instance of Resistan. Again initialize this instance by opening
STARTFIT.RSS, but before running it, select Characteristics... in the Fungicides
menu, and at the bottom of the dialog box for the Dicarboximide, change the Fitness of
Resistant Biotype to .99 in all three boxes. Run this instance to the end of the season
without applying any fungicide sprays, and save it under the name FITNES99.RSS.
Resistan allows you to display two or more instances on the screen simultaneously
for comparison. (Actually more than three instances divides the screen into windows
too small to be useful.) With FITNES99.RSS still active, double click on the icon of the
FITNESS90.RSS instance and the SPRAYD90.RSS instance. Now with with all three
instances of Resistan running simultaneously (one on top of the other), select
Arrange in the View menu. Now you see three windows, with a different instance of
Resistan in each. Notice that there is a scroll bar for each window as well as a (now
nonfunctional) scrollbar for each graph. Click repeatedly in the pageup area of each
window scrollbar, or drag the thumb all the way to the right, to move to the end of each
graph. Notice that in the situation where there was a rapidly growing fungus
population and a substantial fitness cost to the resistance (Fitness = .90), the
population reverted to the sensitive biotype fairly quickly. Where the rate of fungal
reproduction was reduced or the fitness cost of resistance was less, the reversion to
sensitivity occurred more slowly. Exit from two of the three instances of Resistan, and
resize the third window to a convenient size before continuing with the next exercise.
Managing Resistance "On the Fly"
Fungicide spray schedules are usually planned as a general strategy before the start
of the growing season, with the idea that specific alterations in the schedule can be
made when the situation calls for them. Resistan allows you to make some limited
changes in your planned fungicide sprays as the season progresses. Suppose that
you wanted to manage an epidemic over a period of several seasons using the
sterol-inhibitor and a dithiocarbamate. The sterol- inhibitor is far more effective than
the dithiocarbamate, so you can use it when the disease pressure starts to get high.
However, since it is vulnerable to resistance, you should use it only when necessary.
The Dithiocarbamate, though not as effective, has so far never resulted in the
Page 26
selection of a resistant fungus population. Your basic strategy, therefore, should be to
apply the Dithiocarbamate as a protectant until you see the first lesions, then you
should apply no more than two back-to-back sprays of the sterol-inhibitor, followed
again, if necessary, by the dithiocarbamate. To keep costs down, you should apply as
few sprays as possible.
To facilitate restarting the program with the same options, parameters, and starting
values, create a new startup file. Using the Select... command in the Fungicides
menu, select the Sterol- inhibitor and the Dithiocarbamate. With Schedules... set up
to apply the Dithiocarbamate from Day 1 to Day 78 at 7-day intervals and the Sterolinhibitor on Days 85 and 99. Use the default doses, 3.0 for the Dithiocarbamate and
0.25 for the Sterol-inhibitor. (This is the "basic" schedule that will be modified as the
season progresses.) To make the incidence of resistance visible at the outset, in the
Fungus menu use Resistance... to set the initial percent resistance to the Sterolinhibitor to 5%. Note the level of initial inoculum (for comparison with the seasons
that follow). To make the situation more realistic, add a small amount of inoculum
being blown in from outside the sprayed field. (Select Inoculum in the Fungus menu
and set the blowin to 1.) It may also be helpful to change the colors to something that
will provide the most visible contrast, keeping in mind that we will be following the
residues of the Dithiocarbamate and Sterol-inhibitor and the resistance of the latter,
the numbers of lesions, and the cumulative loss. Save these starting conditions as
STARTFLY.RSS.
Begin execution with Run, and to get an idea of what this spray program will do,
advance to the end of the season by pressing <End>. Place the point of the cursor on
the end of the graph of Sterol-inhibitor resistance while holding down the left mouse
button, and notice that it has risen to 14%. Do the same for the graph of lesions, and
notice that there are only 8 lesions per unit area at the end of the season. Select
Show Pie Chart in the Economics menu, and observe the costs and revenue. This
spray schedule appears to be overkill, so we will try eliminating some sprays in the
next season. Save this season as FLY1.RSS, in case we want to come back to it for a
fresh start on the second season.
Continue with the next season by clicking on Continue, and pause to take a look at the
level of initial inoculum for the coming season. (Respond Yes to "Do you want to look
at and/or change variable values between seasons?".) This time instead of
simulating the whole season at once, click in the pageup area (the grey part to the
right of the button) of the window scrollbar to advance the season one week at a time.
After 10 weeks and 10 applications of the Dithiocarbamate we see that there is still no
visible disease, so double-click on the triangular nozzle that marks the 11th
Dithiocarbamate spray, and in the dialog box that appears, click the check box that
corresponds to the Dithiocarbamate to uncheck it. Now when you click OK notice that
the spray nozzle has disappeared from the graph. Remove the 12th Dithiocarbamate
spray in the same way. Advance the season to the day before the first scheduled
Sterol-inhibitor spray. There is still no sign of lesions, so eliminate that spray also.
Advance another two weeks. There is still no sign of lesions, so eliminate the second
Page 27
Sterol-inhibitor spray as well. Notive how the percent resistance to the Sterol-inhibitor
is dropping. Advance to the end of the season, and holding down the left mouse
button, check the number of lesions. The incidence of disease is still very low (only 4
lesions/unit area), so there are no losses, and since the spray costs are less, the
profitability looks better. (Show Pie Chart in the Economics menu). Save this season
as FLY2.RSS and continue with another season.
This time eliminate every other Dithiocarbamate spray, leaving five sprays at 14-day
intervals. Again proceed week by week to the end of the season. Now that the
inoculum carrying over from the previous season has been reduced to a very low
level, no additional sprays are needed, and although the numbers of lesions are up
somewhat from the previous season, we still get adequate disease control. The
reduced spray costs without any crop loss have improved the profit picture, and the
incidence of resistance to the Sterol-inhibitor has dropped to below the detection
threshold.
Continue for a few more seasons, applying Sterol-inhibitor sprays only as needed
when the population of lesions builds up. This is what is meant by fungicide
resistance management.
Page 28
REFERENCES
Arneson, P. A., B. E. Ticknor, and K. P. Sandlan, 1988. Resistan: A Computer
Simulation Model for Fungicide Resistance Management. In: Delp, C. J. (ed.)
Fungicide Resistance: Research and Management Goals and Their
Implementation in North America. APS Press. 133 pp.
Arneson, P. A. 1990. Management of Fungicide Resistance by Using Computer
Simulation. pp 264-274 in Green, M. B., H. M. LeBaron, and W. K. Moberg.
Managing Resistance to Agrochemicals. ACS Symposium Series 421, Amer.
Chem. Soc., Washington, D. C.
Page 29