1
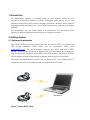
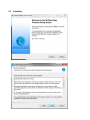
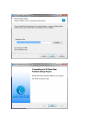
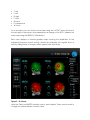
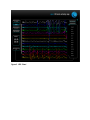
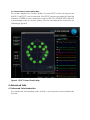
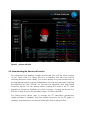
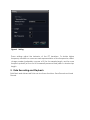
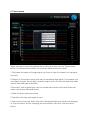
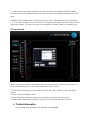
Emotiv EPOC 3D Brain Activity Map Premium Version User Manual V1.0 TABLE OF CONTENTS 1. Introduction ....................................................................................................................................... 3 2. Getting started .................................................................................................................................. 3 2.1 Hardware Requirements ........................................................................................................ 3 Figure 1 2.2 3. Emotiv EPOC Setup ................................................................................................................... 3 Installation .................................................................................................................................. 4 Basic Suite .......................................................................................................................................... 6 3.1 Basic Suite Introduction .......................................................................................................... 6 3.2 Understanding the Basic Functions ..................................................................................... 6 3.2.1 Figure 2 3D Viewer ........................................................................................................................... 6 3D Viewer .................................................................................................................................. 7 3.2.2 Chart (EEG voltage display) ......................................................................................... 8 Figure 3 EEG Chart .................................................................................................................................. 9 Figure 4 EPOC Contact Quality Map ..................................................................................................... 10 4. Advanced Suite.............................................................................................................................. 10 4.1 Figure 5 4.2 Figure 6 Advanced Suite Introduction ............................................................................................. 10 Advanced Suite ....................................................................................................................... 11 Understanding the Advanced Function .......................................................................... 11 Setting ..................................................................................................................................... 12 5. Data Recording and Playback ............................................................................................. 12 5.1 Save record .................................................................................................................................. 13 5.2 Load record .................................................................................................................................. 14 6. Contact Information ...................................................................................................................... 14 1. Introduction This application displays a real-time map of your mental activity in four significant brainwave frequency bands. Adjustable gain allows you to see detailed information and relative strengths between different brain regions. Adjustable buffer size allows you to see instant responses or average over longer periods. This application has two Suites: Basic and Advanced. The Advanced Suite allows you display significant brainwave in any frequency band. 2. Getting started 2.1 Hardware Requirements The Emotiv 3D Brain Activity Map works with the Emotiv EPOC consumer and SDK model headsets. These items can be purchased online from www.emotiv.com. The neuroheadset captures the user‟s brainwave (EEG) signals. After being converted to digital form, the brainwaves are processed, and the results are wirelessly transmitted to the USB receiver. The Emotiv 3D Brain Activity Map interprets these signals to displays mental activity in real time. At present the application functions only on Windows XP, Vista and Windows 7 machines however other platforms will be supported in the future. Figure 1 Emotiv EPOC Setup 2.2 Installation 3. Basic Suite 3.1 Basic Suite Introduction The Basic function displays brain activity in four significant brainwave frequency bands (Delta, Theta, Alpha, Beta), use headset EPOC to read data. Delta (0.5-4Hz) – indicating deep sleep, restfulness, and conversely excitement or agitation when delta waves are suppressed. Theta (4-8Hz) – indicating deep meditative states, daydreaming and automatic tasks Alpha (8-15Hz) – indicating relaxed alertness, restful and meditative states Beta (15-30Hz) – indicating wakefulness, alertness, mental engagement and conscious processing of information. 3.2 Understanding the Basic Functions 3.2.1 3D Viewer When first activated, the application shows the default startup screen, 3D VIEWER, overlaid by the Contact Quality Map which can be used to ensure the headset is properly fitted. If the EPOC has not connected, the headset icon will blink. See the EPOC User Manual for instructions on how to connect the EPOC and obtain a good fit. When you are happy with the headset setup, dismiss the Contact Quality screen by clicking the „Close‟ button. The Contact Quality Map can be recalled at any time by selecting the “View Headset” button from the menu at the top left of the main screen. The 3D VIEWER screen displays four rotatable and zoomable 3D head images, one for each of four frequency bands (Delta, Theta, Alpha, Beta). The user can zoom in and rotate each view clicking on it. Dragging the mouse rotates the selected view, while the scroll wheel can be used to zoom in and out. You can also fill the screen with a single frequency band by clicking on the required view and typing the hot key shortcut „W‟. Preset views can be selected using the hot keys listed at the lower right of the main screen. The Help area to the lower right of the screen summaries the mouse and hotkey controls. Mouse: Left mouse drag: rotates the head model in any direction. Middle mouse click: expand the head model to fill the view. Hotkeys: control the view direction of the head model. T: top L: left R: right F: front B: back P: perspective W: focus You can select one, two, three or four maps using the “ACTVE” menu buttons at the top right of the screen, and superimpose an image of the EPOC headset on each map using the 3DEPOC VIEW button. Each view displays a colored gradient map showing the distribution of the indicated frequency band activity. Where red indicates the highest level of activity, falling away to orange, yellow, green, blue then black. Figure 2 3D Viewer Note the GAIN and BUFFER controls next to each display. These can be used to change the characteristics for each chart. The GAIN control adjusts the amplification of the signal before passing to the mapping software. This allows you to adjust the signal to obtain the best contrast on each display. Maximum gain is obtained when the selector dot is fully clockwise, in about the 5-o‟clock position. This provides maximum contrast in the display and amplifies tiny signals up to show small differences in activity. Minimum gain is achieved fully anti-clockwise, at approximately the 7-o‟clock position. The BUFFER display adjusts the persistence (or averaging time) of the map. When fully anti-clockwise the signals change very rapidly and follow the behavior in real time. When fully clockwise the signals are averaged over several seconds which allows long-term activity patterns to be visualized. 3.2.2 Chart (EEG voltage display) The CHART option displays EEG voltage traces in real time. The rolling chart displays brainwave signals of 14 channels (AF3, F7, F3, FC5, T7, P7, O1, O2, P8, T8, FC6, F4, F8, AF4, according to the International 10-20 nomenclature, as shown on the Contact Quality Map). In this mode, the users can display one or more EEG channels by selecting the buttons next to the channel names in the righthand menu. Note the order of the traces from the top down starts at the frontal sensors on the left side (odd numbered traces) and wraps around the head until the traces at the bottom represent the frontal sensors on the right side. The middle traces (O1 and O2) are at the rear of the head, over the visual cortex. Figure 3 EEG Chart 3.2.3 View headset (Contact Quality Map) This screen displays the contact quality for each EPOC sensor. All sensors are BLACK if the EPOC is not connected. If the EPOC sensors are perfectly fitted the indicator is GREEN in color, otherwise it may be YELLOW, ORANGE, RED or BLACK in decreasing order of contact quality. See the User Manual for instructions on obtaining a good fit. Figure 4 EPOC Contact Quality Map 4. Advanced Suite 4.1 Advanced Suite Introduction The Advanced Suite displays brain activity in any frequency band defined by the user. Figure 5 Advanced Suite 4.2 Understanding the Advanced Function The Advanced Suite displays a single head model view with the same controls as the Basic Suite, but allows the user to redefine and add new bands, switching between them rapidly. The screen displays the head model map of the highlighted frequency band as defined by the user and selected by clicking the relevant line in the “SIGNAL” list. The user can View/Edit, Add, and Delete frequency bands. You can display either a rolling EEG chart or an FFT chart (logarithmic frequency distribution for each channel – showing the power as a function of frequency for the specified range – 0-50Hz by default). The Setting button allows users to change the FFT calculation parameters: Length (number of samples), Step (the update frequency for the FFT graph, in samples), Max frequency and active RemoveDC Filter or Window Filter. Figure 6 Setting These settings adjust the behavior of the FFT transform. To obtain higher frequency resolution or more accurate representation of low frequencies, select a large number (preferably a power of 2) for the sample length, and for more frequent updates (at the cost of increased processor load) select a shorter step length. 5. Data Recording and Playback Both Basic and Advanced Suite use two these functions: Save Record and Load Record. 5.1 Save record When users want to save the signal parts any time, the users can use “Save record” button. In the Save Record form, you can know detail functions in which. 1. File Name: the name of the signal part, you have to type the name if not the signal can save. 2. Subject ID: The subjects which user want to remember their signal . For example, you can classify to smile, clench, blink, wink left or right action. This function help user easily control their data type and review. 3. Record ID: With a signal type, user can record many times, so Record ID help user easily controls their data and review. 4. Date: the date users save record. 5. Start time: the time users begin to save. 6. Start record: when user clicks this button, the signal begin save. This button changes to “Stop and Save” button .Stopping the save process, user click “Stop and Save” button. 7. Close: when users click this button any time, the Save record form will close. When the save process is implementing, if user click this button the signal data also will do not save. 8. Marker: The marker is one of useful function for users. There are four type of markers : 1, 2, 3, 4. With one type, users can define to this type which help them can check when they review data. The users can type four numbers in the key board or in marker form. 5.2 Load record When users want to review the signal parts, the users can use “Load record” button. In the Load Record form, you can know detail functions in which. 1. Play: After choosing the record, the users click this “Play” button to play the signal record. 2. Stop: to stop the display data. 3. Next & Preview marker: moving to the marker which users want to review. 4. Close: when users click this button any time, the Load Record form will close. 6. Contact Information If you have any question, you should contact with Name: Address: Tel: Email: