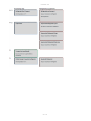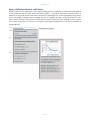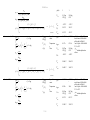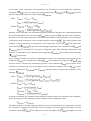
1
The FRISBEE Tool User Manual Table of contents Table of contents ............................................................................................................................................ 2 The FRISBEE tool .............................................................................................................................................. 4 A quality, energy and global warming impact assessment tool for chain optimisation .................................... 4 Contact ......................................................................................................................................................... 4 General information ......................................................................................................................................... 5 About the Frisbee project .............................................................................................................................. 5 About the FRISBEE tool ................................................................................................................................. 5 System requirements .................................................................................................................................... 5 License Agreement ........................................................................................................................................... 6 Installing the FRISBEE tool ............................................................................................................................... 7 Install the freeware MCR Installer ................................................................................................................. 7 Functionalities .................................................................................................................................................. 8 Functionalities .............................................................................................................................................. 8 FRISBEE Tool citation ....................................................................................................................................... 9 Additional research publications related to the FRISBEE Tool ......................................................................... 10 Running the FRISBEE tool ............................................................................................................................... 11 Starting a project ............................................................................................................................................ 12 Building a cold chain ....................................................................................................................................... 13 Modifying cold chain block’s properties .......................................................................................................... 15 Simulating quality evolution from temperature profile ................................................................................... 18 Adding new chains.......................................................................................................................................... 20 Modifying product properties ......................................................................................................................... 21 Chain simulations ........................................................................................................................................... 22 Plots ............................................................................................................................................................... 23 Plotting chain simulations ........................................................................................................................... 23 Emerging technologies ................................................................................................................................... 26 Superchilling and supercooling ....................................................................................................................... 27 Superchilling and supercooling ................................................................................................................... 27 Use of Vacuum Insulation Panels (VIPs) .......................................................................................................... 28 Vacuum Insulation Panel (VIP) in walls ...................................................................................................... 28 Phase Change Materials (PCMs) covers ........................................................................................................... 29 Phase Change Materials (PCM) .................................................................................................................... 29 Monte Carlo Simulations ................................................................................................................................. 31 Running Monte Carlo simulations ................................................................................................................... 32 Monte Carlo simulation plots .......................................................................................................................... 34 Multi-objective optimisation ........................................................................................................................... 38 Implementation in the QEEAT ..................................................................................................................... 38 Running multi-objective optimisation ............................................................................................................. 39 Reference information .................................................................................................................................... 42 Reference cold chains ..................................................................................................................................... 43 Apple cold chain .......................................................................................................................................... 43 FRISBEE tool Pork carcass cold chain ............................................................................................................................... 45 Sliced pork meat cold chain ......................................................................................................................... 47 Ready to eat pork meat cold chain ............................................................................................................... 52 Super chilled salmon cold chain .................................................................................................................. 66 Spinach cold chain ...................................................................................................................................... 68 Ice cream cold chain .................................................................................................................................... 72 Quality models................................................................................................................................................ 74 References .................................................................................................................................................. 82 Heat loads and energy calculation ................................................................................................................... 83 Heat Load Calculations ................................................................................................................................ 83 Total Energy ............................................................................................................................................... 87 Global warming impact assessment ................................................................................................................ 88 Superchilling and supercooling ....................................................................................................................... 89 Introduction................................................................................................................................................ 89 Superchilling and supercooling ................................................................................................................... 89 References .................................................................................................................................................. 90 Phase change materials .................................................................................................................................. 92 Introduction................................................................................................................................................ 92 PCM Materials implemented in the FRISBEE Tool ........................................................................................ 93 References .................................................................................................................................................. 93 Multi-objective optimization algorithm .......................................................................................................... 94 Introduction................................................................................................................................................ 94 Decision variables ....................................................................................................................................... 94 Objective functions ..................................................................................................................................... 94 Constraints ................................................................................................................................................. 94 Weighted multi-objective function .............................................................................................................. 95 References .................................................................................................................................................. 95 3 / 95 FRISBEE tool The FRISBEE tool A quality, energy and global warming impact assessment tool for chain optimisation In this document, you will find the following: General information Installing the FRISBEE tool Starting a project How to operate the graphical user interface How to run a chain optimisation How to simulate variability in cold chain Contact About the FRISBEE tool Annemie Geeraerd Division of Mechatronics, Biostatistics and Sensors (MeBioS) Department of Biosystems (BIOSYST) KU Leuven W. de Croylaan 42 - Bus 2428 B-3001 Leuven (BELGIUM) Tel +32-16-320591 Email: [email protected] About the FRISBEE project Graciela Alvarez Frisbee Project coordinator Irstea Research Unit GPAN Parc de Tourvoie, BP 44, 92163 Antony Cedex, FR ANCE Tel: +33 140 966 017 Email: [email protected] 4 / 95 FRISBEE tool General information About the Frisbee project The Frisbee project is a European Union funded 4-year Project to provide new tools, concepts and solutions for improving refrigeration technologies along the European food cold chain. The objective of the FRISBEE (Food Refrigeration Innovations for Safety, consumers’ Benefit, Environmental impact and Energy optimisation along the cold chain in Europe) project is to provide new tools, concepts and solutions for improving refrigeration technologies along the European food cold chain. At all stages the needs of consumer and European industry will be considered. The project will develop new innovative mathematical modelling tools that combine food quality and safety together with energy, environmental and economic aspects to predict and control food quality and safety in the cold chain. About the FRISBEE tool The FRISBEE tool is a software for assessing cold chains with respect to quality of products, energy use and the CO2 emission (environmental) impact of the refrigeration technologies involved in the cold chain. It contains validated kinetic models that can predict how the quality and safety evolve along the cold chain as a function of temperature and duration. Six main product categories have been considered: fruits, ready to eat meal, meat, fish, vegetable and milk products. Furthermore, the Monte Carlo simulation has been implemented System requirements The FRISBEE tool is developed within the MatLab environment (The MathWorks, Inc., Natick, MA, USA). From the MatLab program a Windows standalone executable has been compiled which is what is being distributed to the end users. As a result you can use the FRISBEE tool without having MatLab installed on your machine. The FRISBEE tool has been compiled to suit 32 and 64 bit Windows based systems. 5 / 95 FRISBEE tool License Agreement The FRISBEE Tool Version 1.1, hence called the FRISBEE Tool, release date July 2015, has been developed in the frame of the EU-FP7-project FRISBEE (Food Refrigeration Innovations for Safety, consumers'Benefit, Environmental impact and Energy optimisation along the cold chain in Europe). The FRISBEE tool Version 1.1 is copyrighted by the nine project partners ("Partners") that have contributed to its development: KU Leuven - Belgium, Irstea - France, TNO - The Netherlands, LSBU UK, NTUA - Greece, VCBT - Belgium, ADRIA - France, Afverial - France, SINTEF - Norway, collectively called the FRISBEE Tool Consortium. The FRISBEE Tool is freely available for download by any interested party upon acceptance of this license agreement. The FRISBEE Tool can only be used for simulating and optimizing the sustainability indicators (namely, quality and safety, energy use and global warming potential) associated with refrigeration technologies in the agri-food cold chain for the food products included in this version 1.1. Any other use of the FRISBEE tool, any part thereof or its underlying code, is prohibited. While every attempt has been made to ensure the reliability of the FRISBEE Tool, the FRISBEE Tool Consortium, its Partners or their employees cannot be held responsible for any errors or omissions, or for the results obtained from the use of the FRISBEE tool. The FRISBEE tool is provided "as is", with no guarantee of completeness, accuracy, timeliness or for the results obtained from the use of this information, and without warranty of any kind, express or implied, including, but not limited to warranties of performance, merchantability and fitness for a particular purpose. In no event will the FRISBEE Tool Consortium, its Partners or their employees, be liable for any decision made or action taken in reliance on the information provided by the FRISBEE tool or for any consequential, special or similar damages. By downloading the FRISBEE Tool you accept to indemnify and hold harmless the FRISBEE Tool Consortium, its Partners or their employees against any claim of a third party against the FRISBEE Tool Consortium or against any one of the Partners or its employees, in as far such claim results from your use of the FRISBEE Tool. On publishing or presenting the results obtained with the FRISBEE tool, the following citation should be included: S.G. Gwanpua, P. Verboven, D. Leducq, T. Brown, B.E. Verlinden, E. Bekele, W. Aregawi, J. Evans, A. Foster, S. Duret, H.M. Hoang, S. van der Sluis, E. Wissink, L.J.A.M. Hendriksen, P. Taoukis, E. Gogou, V. Stahl, M. El Jabri, J.F. Le Page, I. Claussen, E. Indergard, B.M. Nicolai, G. Alvarez, and A.H. Geeraerd, 2015. Journal of Food Engineering, Volume 148, Pages 2-12. doi:10.1016/j.jfoodeng.2014.06.021. Additional research publications related to specific parts of the FRISBEE tool that you may be using, should be referenced using the appropriate citation(s). A full list of bibliographic references is provided in the FRISBEE Tool User Manual and on the FRISBEE Tool website. Questions, remarks and suggestions regarding the FRISBEE Tool are welcomed at [email protected] 6 / 95 FRISBEE tool Installing the FRISBEE tool The FRISBEE tool is fully tested only in Windows 64 bit environment. Install the freeware MCR Installer To be able to run the FRISBEE tool, you must first install the MCRInstaller. (In the unlikely event of having already an older versions of the MCRInstaller on your PC, this older version should be removed first. Please verify with your IT manager how to properly remove it.) Go to the website http://www.mathworks.nl/products/compiler/mcr/index.html Download the 2014a version corresponding to 64-bit. Follow the instructions on the website and on the installer. Please note that you need to have administrator rights on your PC to enable installation. The whole process may take 10 minutes or even more, depending on your system specifications. 7 / 95 FRISBEE tool Functionalities Functionalities The user can select between a number of representative food products The user can select a reference cold chain for each product The user can build a tailor-made cold chain using representative cold chain blocks Simulation of quantified CO2 emissions is possible for a selected cold chain (reference or tailormade) Simulation of static energy use (in kWh/kg) is possible for a selected cold chain (reference or tailor-made) All quality indicators relevant for the specific food product can be simulated for a selected cold chain (reference or tailor-made) A user can change properties of a selected product, and also settings of cold chain block technologies Heat and mass transfer models are available for describing temperature and moisture heterogeneity The user can simulate alternative cold chains using representative cold chain blocks. The following new technologies are implemented: superchilling, supercooling, VIP in walls, PCM Simulation of energy use for new and emerging technologies for: superchilling and supercoiling, VIP in walls and PCM Monte Carlo simulation Dynamic energy use models are being used Model reduction techniques are implemented Simplified temperature model is being used Multi-objective optimization Objective technology selection algorithm 8 / 95 FRISBEE tool FRISBEE Tool citation Gwanpua, S., Verboven, P., Leducq, D., Brown, T., Verlinden, B., Bekele, E., Aregawi, W., Evans, J., Foster, A., Duret, S., Hoang, H., van der Sluis, S., Wissink, E., Hendriksen, L., Taoukis, P., Gogou, E., Stahl, V., El Jabri, M., Lepage, J., Claussen, I., Indergård, E., Nicolai, B., Alvarez, G., Geeraerd, A. (2015). The FRISBEE tool, a software for optimising the trade-off between food quality, energy use, and global warming impact of cold chains. Journal of Food Engineering, 148, 2-12. doi:10.1016/j.jfoodeng.2014.06.021. 9 / 95 FRISBEE tool Additional research publications related to the FRISBEE Tool Evans, J., and Alvarez, G., 2015. Cold Chain refrigeration innovations the FRISBEE project. Journal of Food Engineering, Volume 148, Pages 1 Couvert, O., Pinon, A., Bergis, H., Bourdichon, F., Carlin, F., Cornu, M., Denis, C., Gnanou Besse, N., Guillier, L., Jamet, E., Mettler, E., Stahl, V., Thuault, D., Zuliani, V. Augustin, J.-C., 2010. Validation of a stochastic modelling approach for Listeria monocytogenes growth in refrigerated foods, International Journal of Food Microbiology, 144 (2), 236-242. Dermesonluoglu, E., Katsaros, G., Tsevdou, M., Giannakourou, M., Taoukis, P., 2015. Kinetic study of quality indices and shelf life modelling of frozen spinach under dynamic conditions of the cold chain. Journal of Food Engineering, Volume 148, Pages 13–23 Gwanpua, S., Verlinden, B.E, Hertog, M.L.A.T.M., Nicolai, B.M., Geeraerd, A.H., 2014. Managing biological variation in skin background colour along the postharvest chain of Jonagold apples. Postharvest Biology and Technology 93, 61-71. Gwanpua, S., Verlinden, B.E, Hertog, M.L.A.T.M., Van Impe, J., Nicolaï, B.M., Geeraerd, A.H., 2013. Towards flexible management of postharvest variation in fruit firmness of three apple cultivars. Postharvest Biology and Technology 85, 18–29. Pouillot, R., Albert, I., Cornu, M., Denis, J.B., 2003. Estimation of uncertainty and variability in bacterial growth using Bayesian inference. Application to Listeria monocytogenes. International Journal of Food Microbiology, 81 (2), 87–104 Stahl, V., Ndoye, F.T., El Jabri, M., Le Page, J. F., Hezard, B., Lintz, A.,. Geeraerd, A.H, Alvarez, G., Thuault, D., 2015. Safety and quality assessment of ready-to-eat pork products in the cold chain,Journal of Food Engineering, Volume 148, Pages 43-52 Tsevdou, M., Gogou, E., Dermesonluoglu, E., Taoukis, P., 2015. Modelling the effect of storage temperature on the viscoelastic properties and quality of ice cream. Journal of Food Engineering, Volume 148, Pages 35-42 Ndoye, F.T., Alvarez, G., 2015. Characterization of ice recrystallization in ice cream during storage using the focused beam reflectance measurement. Journal of Food Engineering, Volume 148, Pages 24-34 Duret, S., Gwanpua, S., Hoang, H., Guillier, L., Flick, D., Laguerre, O., Verlinden, B., De Roeck, A., Nicolai, B., Geeraerd, A., 2015. Identification of the significant factors in food quality using global sensitivity analysis and the accept-and-reject algorithm. Part III: Application to the apple cold chain. Journal of Food Engineering, 148, 66-73. Duret, S., Gwanpua, S., Hoang, H., Guillier, L., Flick, D., Laguerre, O., El Jabri, M., Thuault, D., Hezard, B., Lintz, A., Stahl, V., Geeraerd, A., 2015. Identification of the significant factors in food quality using global sensitivity analysis and the accept-and-reject algorithm. Part II: Application to the cold chain of cooked ham. Journal of Food Engineering, 148, 58-65. Duret, S., Gwanpua, S., Hoang, H., Guillier, L., Flick, D., Geeraerd, A., Laguerre, O., 2015. Identification of the significant factors in food quality using global sensitivity analysis and the accept-and-reject algorithm. Part I: Methodology. Journal of Food Engineering, 148, 53-57. Stonehouse, G.G., Evans, J.A., 2015. The use of supercooling for fresh foods: A review. Journal of Food Engineering, 148, 74-79. 10 / 95 FRISBEE tool Running the FRISBEE tool In this section, you will learn to do the following using the FRISBEE tool: How to start a project How to build a cold chain How to modify cold chain block's properties How to start a chain simulation simulation How to view and manipulate results 11 / 95 FRISBEE tool Starting a project Step 1. Run FrisbeeTool.exe. The following window appears Step 2. Selecting a cold chain; Select a product from the product categories, e.g. Meat Select a cold chain, e.g. Raw smoked and salted ham-like bacon. Step 3. Click OK. The reference cold chain settings will be loaded, and the main environment of the QEEAT will open. Main working environment of the FRISBEE Tool 12 / 95 FRISBEE tool Building a cold chain Once a project is started, cold chain blocks can be added using the Add blocks button The user can select cold chain blocks from list of default cold chain blocks. Note that these cold chain blocks are cold chain specific. The user can load saved cold chain (e.g. the reference cold chain) using Load chain button 13 / 95 FRISBEE tool Load existing cold chain (e.g. reference cold chain) from any directory Rearrange positions of blocks using the Backward and Forward button. Delete cold chain blocks using the Delete button. The selected block will be deleted 14 / 95 FRISBEE tool Modifying cold chain block’s properties To make modifications in a cold chain block (e.g. set points, chain duration, refrigerant type, efficiencies etc.), double click on the block or select the block and click on Properties. This action opens the property window, which has two main tabs: the Cold room tab for modifying properties of the cold room, and the Refrigeration system tab for modifying properties of the refrigeration system For Domestic fridge, Display cabinets (Super market), and non refrigerated processes, the Properties windows are different from the other standard blocks 15 / 95 FRISBEE tool For non refrigerated processes such as storage on shelf, or transport, the user is required only to provide ambient conditions and duration, without any need for information on the technology Once all changes have been made, select OK to apply changes. This action will close the Properties window. When the chain has been built completely, you can save the cold chain using the Save chain button 16 / 95 FRISBEE tool The save dialogue box opens, asking you to give a name to your chain and also to select a location to Save chain. 17 / 95 FRISBEE tool Simulating quality evolution from temperature profile The temperature profile can be loaded into the FRISBEE tool via the cold chain block settings window. The time must be the first column, and the temperature the second column. also, the time must be monotonically increasing. Data format accepted are .xls, .xlsx, and .csv. To load data, click on the Load data button. This button is only enabled when the Use Temperature profile checkbox is checked. 18 / 95 FRISBEE tool Select temperature profile file, and click Open. NB: The energy use and CO2 emission calculations for a cold chain block in which the temperature profile has been loaded is based on assumption of a steady state temperature equal to the weighted average of the temperature profile. This should not be relied upon. Our advice is use temperature profile only to simulate quality. 19 / 95 FRISBEE tool Adding new chains With the FRISBEE Tool, up to 6 cold chains can be built and simulated at once. This offer the possibilities of comparing several cold chain scenarios. To add new chain, click on A dialogue Window opens, from which the name of the cold chain can be entered. Once the name of the cold chain is entered, click OK. A new chain is added, with the first block added by default. The first block is the starting block for the reference cold chain. 20 / 95 FRISBEE tool Modifying product properties The product properties within each cold chain can be modified by clicking on the "Product" button at the bottom of the cold chain blocks. The "Product property" window opens. This window display the product characteristics: loading product temperature (temperature at which the product entered the cold chain), the conservation temperature, the unit mass of the product. These properties can be changed by the user, simply by entering other values. Additionally, the starting values of the quality indicators can be modified by the user. finally, the thermophysical properties are also displayed, although these values cannot be changed by the user. 21 / 95 FRISBEE tool Chain simulations Click on Calculate button to simulate cold chain. The software will simulate the energy use, CO2 emission and quality evolution along the cold chain(s). note that it is possible to build more than one chain (up to six chains can be added) and run all simulations at once. If the simulation is too slow, or if the simulation gets interrupted, try other ODE solver. This is particular important when running simulations involving temperature profile. Different ODE solvers can be selected 22 / 95 FRISBEE tool Plots Plotting chain simulations Once the simulation is completed, the plot windows pops open. The plot Window can also be called from the main GUI, but this will give an error message if a user attempts to call the plot window without first performing any simulations. The Plot window is shown below: All chains that were simulated are displayed in (1), from which the user can select which chain to plot. The user can also chose to plot the simulations for a single cold chain block, by specifying in options (2). If a complete chain is selected in (2), the user can chose to plot two chains on the same axis, by specifying which chain to compare with in (3). For any plot, the indicator must be specified in (4). This can be one the quality indicators, energy use, CO2 emission, or product core temperature. When all selections have been made, the use can then display plot by clicking on "Update plot" (5). The plot(s) is then display on (6). 23 / 95 FRISBEE tool For example, the figure below shows the firmness of two cold chain scenarios. From the File menu or the tool bar in the figure plot, a user can chose to save plot, print plot, or export the plot data. 24 / 95 FRISBEE tool Export plot data The plot data can be exported to an excel data file by clicking on the Export data icon on the plot tool bar. A dialogue box opens, requested the user to specify where to store data. Save plot figure The plot can be saved as an image file (png, tiff, jpg) or a Matlab figure Print figure Send a print command for the plot by selecting Print figure 25 / 95 FRISBEE tool Emerging technologies The following new and emerging technologies have been implemented in the FRISBEE tool Simulations of superchilling and supercooling processes The use of Vacuum Insulation Panels (VIPs) in the walls of cold rooms The use of Phase Change Materials (PCMs) covering around food 26 / 95 FRISBEE tool Superchilling and supercooling Superchilling and supercooling A product heat and mass transfer model has been implemented in the FRISBEE tool. To achieve superchilling and supercooling, the user can play around the cooling rate. To achieve this in the FRISBEE tool, the user can specify different values for the heat transfer coefficient and air temperature, using the properties window. Example Graphical output from FRISBEE tool. chain simulations showing product temperature. 27 / 95 FRISBEE tool Use of Vacuum Insulation Panels (VIPs) Vacuum Insulation Panel (VIP) in walls VIP in walls can be simulated using the FRISBEE tool by selecting Vacuum Insulation Panel (VIP) from the list of Insulation in the properties window: Example Graphical output from FRISBEE tool chain simulations during two cold chain scenarios: Polyethylene was used as wall insulation for CA storage in one chain, while Vacuum Insulation Panel (VIP) was used in the other chain. 28 / 95 FRISBEE tool Phase Change Materials (PCMs) covers Phase Change Materials (PCM) Users can down simulate the use of PCM covers in cold rooms by selecting the checkbox “Use PCM cover around product” in the properties window. The PCM types and properties can be modified by clicking on “Edit PCM”. The window PCM material properties opens. Different PCM can be selected. In addition, the thermophysical properties of the selected PCM is displayed, but cannot be modified. Users can specify the thickness of the PCM and the melting of the PCM is calculated. The product temperature can be simulated based on the melting time and the melting temperature of the selected PCM. Example: Consider the following two cold chain scenarios 29 / 95 FRISBEE tool The resulting effect of using the PCM cover can be seen in the figure below: Graphical output from FRISBEE tool chain simulations during two cold chain scenarios: No PCM was used for distribution storage of ice cream at -15°C for 7 days in one chain, while PCM cover was used in the other chain for same storage temperature and duration. 30 / 95 FRISBEE tool Monte Carlo Simulations The Monte Carlo option was not implemented for all food products and for all quality models. Table 2 presents the products and quality models available for the Monte Carlo simulation Safety and Quality Indicators for the selected food Category Meat Fruit Milk products Vegetables Food product Pasteurized ham Apple Ice cream Safety Indicator Listeria monocytogenes Spinach - - Quality Indicator firmness, colour texture, colour, sensory attribute, ice crystal size vitamin C, colour, texture Cold chain blocks: Some equipment are not available in the Monte Carlo simulation. Table 2 presents the available links. Cold chain links in Monte Carlo simulation Product Links Apple chilled chain Spinach & Ice cream Pre-cooling Pasteurized cooked ham Chilled storage CA storage Refrigerated transport Refrigerated transport Refrigerated transport Expedition storage Distribution center Wholesale Display Cabinet Super market Non-refr transport Non-refr transport Domestic fridge Domestic fridge Domestic fridge 31 / 95 Frozen storage FRISBEE tool Running Monte Carlo simulations Click on Monte Carlo to open Monte Carlo Simulation window for the selected cold chain. Monte Carlo simulation window Select a link to modify its temperature and residence time distribution. 32 / 95 FRISBEE tool Classical Analysis (Accept and reject algorithm) The simulation is performed from the first to the last equipment for 2000 food products (Note: the number of simulation runs can be changed, “number of simulation runs” (2)). Food products of which final quality respects the quality criterion are “accepted”. Food products of which final quality do not respect the quality criterion are “rejected”. To run a simulation, click on the radio button “classical analysis” (3) and then click on the start button (6). Only the evolution of the selected quality model (17) is calculated. 33 / 95 FRISBEE tool Monte Carlo simulation plots The window “Monte Carlo results” is opened automatically after the calculation. The histograms of the initial and final product quality are displayed. Figure type 5 different figures can be selected (5) (histograms, Temperature evolution, Quality evolution, Rejected Probability, Scatter plots). The figure can be opened in a new window by clicking on the checkbox “Display figure in a new window” (7). a) Rejected probability The rejected probability shows the proportion of products of which final quality (at the end of the chain) do not respect the quality criteria along the range of the temperature or the duration in the cold chain link. Example (firmness of apple): The CA storage, all products stored during 50 days were accepted (Pnc =0) while 15% of products stored during 200 days do not respect the quality criteria at the end of the cold chain (Sub figure top-right). It shows the impact of the duration in the CA storage. On the contrary, the temperature in the precooling step (sub figure bottom left) had no impact because the probability of non-compliance is constant (10%) in the range of variation of this input. 34 / 95 FRISBEE tool b) Scatter plot The scatter plot shows the interaction between the temperature and the duration in a link. Blue points are the accepted products (of which the quality at the end of the chain respects the quality criteria) and the red square are the rejected products (of which the quality at the end of the chain does not respect the quality criteria), the percentage represents the proportion of rejected products. Example (firmness of apples in CA storage): 0% of product stored below the mean duration are rejected, 11.4 % of products stored below the between 1.1°C and 0.7°C and 120 and 250 days are rejected. 16.4 % of products stored between 1.1°C and 1.45°C and between 120 and 250 days are rejected are rejected. 35 / 95 FRISBEE tool Show/hide legend and grid Click on options to hide or show the legend and the grid. Save plot figure The figure can be saved as an image file (png, tiff, jpg, Matlab fig) Print figure Send a print command for the plot by selecting Print figure Global Sensitivity analysis To run the global sensitivity analysis, click on the radio button “Global SA” (3 on the Monte Carlo simulation window). The results are presented in a table, two indices are presented. - Si (First order index): This index represents the impact of the parameter on the product final quality without the interaction with the other parameters. The value of Si is included between 0 and 1. If Si is closed to 0, the parameter has no impact on the final quality, if Si is closed to 1; the parameter has a great impact on the product final quality. - Sti (Total effect index): This index represents the impact of the parameter on the final quality of the products with the interactions with the other parameters. If Sti < 0.1 the parameter has no impact of the final quality, if Sti > 0.1 the parameter is signicant. Two options are possible: 36 / 95 FRISBEE tool a) All equipment are considered as one parameter called “Itinerary” This solution should be chosen first. If the itinerary has a great impact as in the table below, the option can be simulate to identify which link has the greatest impact. b) Each equipment is considered as one input. 37 / 95 FRISBEE tool Multi-objective optimisation Implementation in the QEEAT The multi-objective optimization has been implemented in the FRISBEE tool. The Global optimization tool box of the Matlab was used. Therefore, except for the compiled version, the multi-objective optimization of the FRISBEE tool can only run if the user has the global optimization tool box installed in his/her Matlab. 38 / 95 FRISBEE tool Running multi-objective optimisation The following steps are involved in running the multi-objective optimisation algorithm . After building a cold chain, and modifying properties to desired set points, the multi-objective optimisation can be run by clicking the "Optimise" button from the Chain optimisation panel Fig. 1. The Main window of the FRISBEE tool. User can begin multi-objective optimisation by clicking on "Optimise" The following window opens. Fig. 2. Chain optimisation window 39 / 95 FRISBEE tool From the chain optimisation window, a user can select one or more objective functions by selecting the checkboxes for “Product quality” (3), “Energy use” (4) and “CO2 emissions” (5). The temperature bounds are specified by entering an upper and a lower temperature bound (1 and 2). Default values are provided. If product quality is selected as an optimization criterion, the user needs to specify which quality indicator should be considered as the critical indicator for quality (6), and the critical limit (7) and price per kg of the product (8). If energy use is selected as an optimization criterion, the user needs to specify the cost of electricity (9). If a CO2 emission is selected as an optimization criterion, the user needs to specify the cost of the emission right of one ton of CO2 (10). Additionally, a user can chose to manually enter the weights of each objective function in case he/she does not want to use the weighted multi-objective function (11). In this case, he/she must select the radio button “Manual entry” and the option will be provided to enter weights (11) Once all these have been specified for each cold chain block, the user can begin the optimisation by clicking on the “Start” button. The follwoing windows pop opens, and display the progress of the optimisation Fig 3. Progress of optimisation The user may click on the "stop" button to manually terminate the optimisation. 40 / 95 FRISBEE tool After optimisation, the pareto solution, together with the optimised temperature is displayed in a table in the chain Optimisation window (Fig. 4). Fig. 4. Example of chain optimisation: apple cold chain. Both the optimal (maximum) chain profit and the corresponding temperature is shown in Fig. 4. NB: The multi-objective optimisation works only for refrigerated blocks, since in the FRISBEE Tool we calculate energy and CO2 emission by refrigeration equipment. 41 / 95 FRISBEE tool Reference information In this section, some background information about the FRISBEE Tool is provided. These include: Definition of the FRISBEE referenece cold chain Kinetic models for different quality indicators Heat loads and energy calculations Global warming impact assessment Superchilling and supercooling Phase Change Materials (PCM) Multi-objective optimisation 42 / 95 FRISBEE tool Reference cold chains Apple cold chain The apple cold chain plays a role in one of the innovative technologies that are under study in the Frisbee project: Dynamic Controlled Atmosphere storage. It is therefore necessary to define a reference cold chain for apple storage, with which the innovative technology can be compared in terms of Quality, Energy consumption and environmental impact. Apple reference cold chain; harvest (outside cold chain) and steps 1-6 of the cold chain 43 / 95 FRISBEE tool 44 / 95 FRISBEE tool Pork carcass cold chain The pork carcass cold chain features in innovative technologies for fast chilling of meat products, such as vascular perfusion chilling. The chain is depicted in the figure below. The first three stages indicated below do not belong to the cold chain – as they are not temperature conditioned – but these stages do include factors that affect initial quality, such as microbiology, texture, temperature etc. Pork Carcass Reference Cold Chain; process steps before the cold chain and steps 1-10 of the cold chain 45 / 95 FRISBEE tool 46 / 95 FRISBEE tool Sliced pork meat cold chain Non frozen sliced pork meat Sliced pork meat is a “candidate” for the super chilling process, which has so far been mostly applied to fish (salmon). The first part of the cold chain, before cutting, is identical to the pork carcass cold chain, described in paragraph 3.2. In this paragraph, the process before the rapid continuous batch chilling process is assumed the same as that described for the pork carcass, and the further process starts with the rapid continuous batch chilling process (option 2), at an air temperature of -20°C (i.e. not equal to the typ ical temperature of -30°C as mentioned in 3.2). Sliced pork meat Reference Cold Chain, non frozen. 47 / 95 FRISBEE tool 48 / 95 FRISBEE tool 49 / 95 FRISBEE tool Frozen sliced pork meat The first part of the cold chain, before packaging, is identical to the sliced pork meat, described in paragraph 3.2. In this paragraph, the process before the freezing process is assumed the same as that described for the sliced pork meat, and the further process starts with the rapid freezing IQF process at an air temperature of -30/-40°C. Sliced pork meat Reference Cold Chain, frozen. 50 / 95 FRISBEE tool 51 / 95 FRISBEE tool Ready to eat pork meat cold chain The first part of the cold chain for ready to eat pork meat, follows the cold chain for sliced pork meat products (section 3.3). Of course, in the sliced pork meat products cold chain the attention is focused on the neck cutlet; whereas in this case the focus is on the ham. Ready to Eat (RTE) pork meat Reference cold chain for COOKED HAM 52 / 95 FRISBEE tool The reference cold chain for another ready to eat pork meat product, pate, generally follows the same process route as the cooked ham cold chain; and the process equipment for refrigeration is exactly the same. Ready to eat pork products Reference cold chain: PATÉ 53 / 95 FRISBEE tool 54 / 95 FRISBEE tool 55 / 95 FRISBEE tool 56 / 95 FRISBEE tool In the cold chains for “ready to eat pork meat” the last steps are “expedition”. From the expedition, the products are brought to the distribution center, or directly to the supermarket. The Reference cold chain steps for the second option (directly to the supermarket) are described in Table 40 below. Process steps after expedition in the RTE pork meat cold chains. 57 / 95 FRISBEE tool 58 / 95 FRISBEE tool Super chilled pork meat cold chain Sliced pork meat is a “candidate” for the super chilling process, which has so far been mostly applied to fish (salmon). The first part of the cold chain (steps 1 – 6), before entering the shock freezer, is identical to the pork carcass cold chain, described in paragraph 3.2. In this paragraph, the process before the Rapid continuous batch chilling process is assumed the same as that described for the pork carcass, and the further process starts with the rapid continuous batch chilling process (option 2), at an air temperature of -20°C (i.e. not equal to the typical temperature of -30°C as mentioned in paragr aph 3.2). Super chilled pork meat reference cold chains 59 / 95 FRISBEE tool 60 / 95 FRISBEE tool 61 / 95 FRISBEE tool 62 / 95 FRISBEE tool Salmon (chilled) cold chain Chilled Salmon Reference Cold Chain 63 / 95 FRISBEE tool 64 / 95 FRISBEE tool 65 / 95 FRISBEE tool Super chilled salmon cold chain Super chilled Salmon reference cold chain 66 / 95 FRISBEE tool 67 / 95 FRISBEE tool Spinach cold chain Frozen spinach reference cold chain 68 / 95 FRISBEE tool 69 / 95 FRISBEE tool 70 / 95 FRISBEE tool 71 / 95 FRISBEE tool Ice cream cold chain Ice Cream reference cold chain 72 / 95 FRISBEE tool 73 / 95 FRISBEE tool Quality models A summary of the quality models implemented in the FRISBEE tool is shown in the table below: 74 / 95 FRISBEE tool Apple Quality indicator 1Firmness Model structure d P dt Model variables Variable Meaning k pect P E pect d E pect dt d Eth dt kE pect Eth k E pect Eth Eth Vm , Eth pO 2 Eden ref K m ,O , Eth pO 1 2 2 F (N) Firmness P Pectin integrity kE pect ,ref 0.00029 d-1 E pect kEdeg ,ref 0.1 d-1 Vm, Eth 13.51 mmol d-1 T (°C) Pectin degrading enzyme Internal ethylene concentration Temperature Eth 1 t (d) Time K m,O2 , Eth 4.44 kPa Kmu ,CO2 , Eth 0.76 kPa k Diff m 0.0014 d-1 Ea , pect 90021 J mol-1 Ea , E pect 59798 Ea , Edeg 65241 J mol-1 R Tref 8.314 J mol-1 K-1 10 °C Fc kChl kChlase 39.44 N kChlasedeg 0.73 d-1 Vm, Eth 13.51 Eth 1 K m,O2 , Eth 4.44 Kmu ,CO2 , Eth 0.76 Eth pCO 2 K mu ,CO , Eth 2 k Eth Eth Eth Ea ,i 1 1 R T ref T F Fc P 2Backgroun d skin colour PEth A Eth d Chl dt m d Chlase dt a kChl Chl Chlase kChlase Eth kChlase deg Chlase * Chl Chlase Eth a* -value of the CIE T (°C) Chlorophyll concentration Chlorophyllase enzyme Internal ethylene concentration Temperature t (d) Time 75 / 95 pect , ref 1 Model validity range 0 °C to 25 °C 1 % to 21 % O2 0 % to 10 % CO2 ref ki ki , ref exp Eth Model parameter Paramete Estimate r 0.00027 d-1 nmolk 0.2 kg 1254 N mmol-1 0.21 d-1 nmol-1 0.0023 ref d-1 0 °C to 25 °C 1 % to 21 % O2 0 % to 10 % CO2 FRISBEE tool d Eth Vm , Eth pO 2 Eth Eth ref pCO K m ,O , Eth pO 1 K mu ,CO , Eth Ea ,i 1 1 ki ki , ref exp R T ref T a* ac Chl dt k Eth Eth Eth k Diff m 0.0014 Ea ,Chl 35323 J mol-1 Ea ,Chlase 119080 J mol-1 Ea , Eth 71403 J mol-1 R 8.314 J mol-1 K-1 Tref 10 °C ac 11.55 0.2 2 2 2 2 Eth Weight loss PEth A Eth m p ( kg m-3) dm kta A( p p ) dt mH O Psat xw p 2 RT p ( kg m-3) T (°C) m (kg) Psat (Pa) xw water vapour density of apple water vapour density of surrounding atmosphere Temperature Unit mass of apple Saturated vapour pressure Moisture content t (d) Time Modified atmosphere packed cooked ham, and Modified atmosphere packed cooked pâté Quality indicator Model structure Model variables Variable Meaning 3L. monocytogenes dN dt 0 dN µmax N 1 N dt N max if t lag if t lag N (log CFU/g) T (°C) t (h) 76 / 95 Population count Temperatur e Time -3.07 kta 0.1825 d-1 1 °C to 25 °C A 0.02 m2 0 to 100 % RH mH 2O R 18 × 10-3 8.314 J mol-1 K-1 Model parameter Paramete Estimate r Ham 0.7525 h-1 opt Model validity range Pâté 0.7537 h1 lag min 3.55 h 1.17 h ( pH ) 0.9329 0.9574 ( aw ) 0.6212 0.7902 pH for ham: 6.31± 0.04 aw for ham: 0.980 ±0.005 pH for pâté 6.45±0.01 aw for pâté : 0.986 ±0.003 5 °C to 15 °C FRISBEE tool µopt lag lag T T T T Tmin T opt lag max Tmin Topt -2.47 °C -2.47 °C 38.2 °C 38.2 °C Tmax 43.3 °C 43.3 °C Population count opt 0.6029 h-1 0.6521 h- Temperatur e Time lag min 0.17 h 0.79 h N max 9.07 log CFU/g 9.18 log CFU Tmin -0.53 °C -0.53°C Topt 28.04 °C 28.04 °C Tmax 36.05 °C 36.05 °C Population count opt 1.3408 h-1 1.1804 h- Temperatur e Time lag min 0.58 h 3.0 h N max 8.91 log CFU/g 8.67 log CFU Tmin 0.25°C 0.25 °C Topt 33.02 °C 33.02 °C 2 min Tmin T Topt Topt Tmax Topt Tmin 2T for Tmin T Tmax Otherwise N (log if t lag CFU/g) if t lag T (°C) t (h) 1 pH for ham: 6.43± 0.04 aw for ham: 0.980 ±0.006 pH for pâté 6.45±0.01 aw for pâté : 0.984 ±0.004 5 °C to 15 °C opt includes pH and aw effects lag min (T ) T T T T Tmin T opt dN dt 0 dN µmax N 1 N dt N max µopt 9.18 log CFU (T ) opt sakei 1322 9.11 log CFU/g µmax T T 0 4Lb. N max (T ) ( pH ) (aw ) (int) dN dt 0 dN µmax N 1 N dt N max µopt 1 lag min opt mesenteroïdes 74 1 (T ) ( pH ) (aw ) (int) T T 0 4Lc. (int) µmax max min 2 Tmin T Topt Topt Tmax Topt Tmin 2T for Tmin T Tmax Otherwise if t lag if t lag N (log CFU/g) T (°C) t (h) µmax (T ) 1 lag min (T ) 77 / 95 pH for ham: 6.43± 0.04 aw for ham: 0.980 ±0.006 pH for pâté 6.45±0.01 aw for pâté : 0.984 ±0.004 5 °C to 15 °C opt includes pH and aw effects FRISBEE tool T T 0 opt T T T T Tmin T max opt Salmon fillets Quality indicator Spoilage lactic acid bacteria 5Sensory perception 0.2607e T (°C) t (d) T (°C) t (d) k 0.9732e0.2497T Model structure Sicecrystals So a 1 exp(kt ) Ea 1 R T E k k ref exp a R 5Viscoelasticity/ Damping factor 39.12 °C Tmax 39.12 °C 1 Tref 1 1 T T ref tan Tref 8 C1 C2e kt Model validity range -18°C to -1°C Temperature Time Model variables Variable Meaning Inoculum N N N 0 ek (t ) aref exp Tmin T Tmax Model variables Variable Meaning Drip loss Y (%) Model structure a for Otherwise 5.55731e0.31T Ice cream Quality indicator min Tmin T Topt Topt Tmax Topt Tmin 2T Frozen pork neck cutlet Quality Model structure indicator Drip loss dY (0.1096T ) dt 2 Model validity range -1.7°C to 2°C Temperature Time Model variables Variable Meaning Model parameter Parameter Value Model validity range S Score for overall acceptability (1-9) So 1 -5 °C to -30 °C T (°C) t (d) Temperature Sf 6.5 Time Ea [a(T)] aref 51.4 kJ mol-1 2.10 kref 0.0082 d-1 Ea [k(T)] 78.1 kJ mol-1 Tref -18°C tan f 0.76 C1 0.76 tan Tref 8 T (°C) Damping factor measured at reference temperature -8°C Temperature 78 / 95 -5 °C to -30 °C FRISBEE tool k k ref 5Firmness E exp a R 1 1 T T ref t (d) Ft ,T F t0 ,T k * t E a k k ref exp R 1 1 T T ref F (g) T (°C) t (d) Time Firmness Temperature Time C2 0.40 kref 0.0211 Ea 23.1 kJ mol-1 Tref Fto -18°C 873 g Ff 6000 g 47.5 kJ mol-1 Ea kref Tref R Spinach leaves Quality indicator Model structure 6Vitamin C C0 e kt C content k k ref 6Chlorophyll content C C0 e k k ref 6Sensory evaluation E a exp R 1 1 T T ref kt E a exp R 1 1 T T ref S S 0 (k sensoryattribute * t ) 23.2 d-1 -12°C 8.314 J mol-1 K-1 Model variables Model parameter Variable Meaning Paramete r Values C (mg/100g) T (°C) t (d) Vitamin C/L-ascorbic acid content C0 Cf 25.89 mg/100g Ea kref 132.0 kJ mol-1 Tref -18°C Total chlorophyll content (mg/100g) R C0 8.314 J mol-1 K-1 37.4 mg/100g Temperature Cf 22.4 mg/100g Time Ea kref 70.3 kJ mol-1 Tref R S0 -18°C C (mg/100g) T (°C) t (d) S Temperature Time Score for overall acceptability (1-9) 79 / 95 Model validity range -5 °C to -30 °C 7.77 mg/100g 0.0029 d-1 -5 °C to -30 °C 0.0011 d-1 8.314 J mol-1 K-1 9 -5 °C to -30 °C FRISBEE tool E a k k ref exp R 1 1 T T ref T (°C) t (d) Temperature Sf 6 Time Ea kref 61.26 kJ mol-1 Tref R -18°C 0.0077 d-1 8.314 J mol-1 K-1 Table S1. Model structure, model parameter values, and validity range of the quality models implemented in the FRISBEE tool 1 For details of model development and experimental design, see Gwanpua et al. (2013). 2 For details of model development and experimental design, see Gwanpua et al. (2014). 3 For details of model development and experimental design, see Stahl et al. (2014). T opt and Tmax were obtained from Couvert et al. (2010), while al. (2003) 4 For details of model development and experimental design, see Stahl et al. (2014). 5 For details of model development and experimental design, see Tsevdou et al. (2014). 6 For details of model development and experimental design, see Dermesonluoglu et al. (2014). 80 / 95 Tmin was obtained from Pouillot et References Couvert, O., Pinon, A., Bergis, H., Bourdichon, F., Carlin, F., Cornu, M., Denis, C., Gnanou Besse, N., Guillier, L., Jamet, E., Mettler, E., Stahl, V., Thuault, D., Zuliani, V. Augustin, J.-C., 2010. Validation of a stochastic modelling approach for Listeria monocytogenes growth in refrigerated foods, International Journal of Food Microbiology, 144 (2), 236-242. Dermesonluoglu, E., Katsaros, G., Tsevdou, M., Giannakourou, M., Taoukis, P., 2015. Kinetic study of quality indices and shelf life modelling of frozen spinach under dynamic conditions of the cold chain. Journal of Food Engineering, Volume 148, Pages 13–23 Gwanpua, S.G., Verlinden, B.E, Hertog, M.L.A.T.M., Nicolai, B.M., Geeraerd, A.H., 2014. Managing biological variation in skin background colour along the postharvest chain of Jonagold apples. Postharvest Biology and Technology 93, 61-71. Gwanpua, S.G., Verlinden, B.E, Hertog, M.L.A.T.M., Van Impe, J., Nicolaï, B.M., Geeraerd, A.H., 2013. Towards flexible management of postharvest variation in fruit firmness of three apple cultivars. Postharvest Biology and Technology 85, 18–29. Pouillot, R., Albert, I., Cornu, M., Denis, J.B., 2003. Estimation of uncertainty and variability in bacterial growth using Bayesian inference. Application to Listeria monocytogenes. International Journal of Food Microbiology, 81 (2), 87–104 Stahl, V., Ndoye, F.T., El Jabri, M., Le Page, J. F., Hezard, B., Lintz, A.,. Geeraerd, A.H, Alvarez, G., Thuault, D., 2015. Safety and quality assessment of ready-to-eat pork products in the cold chain, Journal of Food Engineering, Volume 148, Pages 43-52 Tsevdou, M., Gogou, E., Dermesonluoglu, E., Taoukis, P., 2015. Modelling the effect of storage temperature on the viscoelastic properties and quality of ice cream. Journal of Food Engineering, Volume 148, Pages 35-42 FRISBEE tool Heat loads and energy calculation Heat Load Calculations The main factors that contributed to the heat load were the product load (kg), area of the walls, floor and ceiling, type and thickness of insulators, door dimensions, number and frequency of door openings, relative humidity outside and inside the storage rooms, temperature outside and inside the storage rooms, rate of respiration, and expected weight loss. The heat of respiration was given by; The respiratory parameters and are specific for apples. The heat transmission through the walls, ceiling and floor was given by; Where: was the overall heat transfer coefficient of the walls of the cold room, given by; With the surface heat transfer coefficient inside the cold room given as the thickness of the wall insulation given in the conductive heat transfer coefficient of the insulator With the surface heat transfer coefficient outside the cold room given as (assuming no wind movements with the envelop of the storage facility) was the overall heat transfer coefficient of the roof of the cold room, given by; is the thickness of the roof insulation given in is the conductive heat transfer coefficient of the insulator is the overall heat transfer coefficient of the roof of the cold room, given by; 83 / 95 FRISBEE tool is thickness of the floor insulation given in the conductive heat transfer coefficient of the insulator thickness of the wearing surface is the conductive coefficient of the wearing surfae is the total wall area in contact with the outside air temperature. is the total wall area in contact with the outside air temperature. is the total wall area in contact with the outside floor temperature. For the heat load that resulted from the defrost unit, the following equation was used for the computation: Where; is the mass flow rate through the open door is the outside absolute humidity computed from the and . is the absolute humidity inside the storage room computed from the humidity in the storage room and and the relative . are the duration and frequency of door openings respectively. is the weight loss in is the latent heat of fusion of water, given as is the efficiency of the defrost unit The heat load that resulted from door opening as well as the door seals was computed using the equation below: Where: is the sensible heat load from the door opening and depends on the specific heat capacity of air, is the is the latent heat load from door opening and depends on and , , , . is the sensible heat load through the door seals and depends mass flow rate through the door seals, , . and the latent heat of vaporisation of water, , in , and the . is the is the latent heat load through door seals and depends on , , , and . The heat load from the evaporator fans was also accounted for using the equation below; Where is the fan power given in Each storage cell contained four evaporator fans for air cooling as well as defrost system which could be alternated. The heat load produced by lighting within the cold room was is also assumed to be zero. The total heat load in required to be removed by the system during the desired storage duration was thus given by: 84 / 95 FRISBEE tool Cooling Requirements Cooling involved the removal of the entire heat load within the storage rooms. For this studies, the cooling was achieved through the vapour compression cycle. This cycle transferred heat energy from the region of low temperature (inside the storage rooms), to the region of higher temperature (outdoor) using a working fluid (refrigerant). A schematic diagram of a vapour compression cycle is shown below: (A) (B) Conventional vapour compression cycle The working principle of a refrigeration cycle was based on the following: Low pressure superheated vapour (1) was compressed isentropically (1-2) to a high pressure vapour with high temperature (3) by the compressor. This compression was achieved by supplying work to the compressor. This hot vapour stream was then cooled to the saturation temperature in the first part of the condenser (2-3) by removing the superheat, condensed isothermally in the middle part (3-4), and sub-cooled in the last part (4-5) to give the liquid (5). The pressure was then lowered isenthalpically to its original value in the expansion valve, resulting in a two-phase mixture (1). This mixture was then vaporized isothermally and then heated in the evaporator to give a super-heated vapour, and hence closing the cycle. For this studies, we considered a one-stage direct-expansion system with multiple evaporators distributed in the various storage rooms. The flow of refrigerant to the various evaporators was regulated by independent controllers. Since it was difficult to keep track of the temperature of the refrigerant in the evaporator and condenser, we used a desired temperature difference between both the evaporator and condenser, and their surrounding air. At the evaporator, the intended temperature difference between the storage room and the temperature of the evaporating fluid was denoted and was given in inlet, the saturation temperature of the refrigerant ( ) was calculated by subtracting from the set storage temperature ( the evaporator, . The ). This . At the evaporator also corresponded to the inlet temperature of was intend used to compute the saturation pressure at the evaporator ( ). But using this to compute the enthalpy was difficult because this region consisted of a mixture of liquid and vapour, and we didn’t know yet the proportions of this mixture. Hence we had to rely on computing the condenser outlet enthalpy, which was assumed to be isenthalpic with this region. 85 / 95 FRISBEE tool At the outlet of the evaporator, the temperature was increased by a factor called the evaporator superheat ( ) to give the evaporator outlet temperature, used to compute the evaporator outlet enthalpy, . This was then . Inlet: Outlet: Similarly at the condenser, the intended temperature difference between the condensing fluid and the surrounding ambient air was denoted and was given in . At the inlet of the condenser, the fluid was in the superheated form. The fluid was assumed to have undergone a non-isentropic compression at the compressor, with a certain isentropic efficiency, . The suction pressure and enthalpy of the compressor corresponded to the evaporation pressure outlet enthalpy and evaporator , respectively. The discharge temperature was calculated from and , and also depended on the type of refrigerant used. This discharge temperature and enthalpy corresponded to the condenser inlet temperature and condenser inlet enthalpy , respectively. In the middle part where isothermal condensation occurred, the condensation temperature of the refrigerant ( ) was calculated by adding to the ambient air temperature ( was then used to compute the condensation pressure of the condenser ( ). At the outlet of the condenser, the temperature was decreased by a factor called the condenser subcool ( an outlet temperature enthalpy, . This ). ) to give was then used to compute the condenser outlet . Inlet: Outlet: As earlier mentioned, the condenser outlet and the evaporator inlet were assumed to be isenthalpic; hence the evaporator inlet enthalpy and the condenser outlet enthalpy are equal. The COP is defined as the ratio of the heat load removed to the electrical power consumed as work by the compressor. A higher COP will mean a lower operating cost for the system. The efficiency of the compressor motor also influences the COP. The higher the 86 / 95 , the higher COP and FRISBEE tool vice-versa. The COP was calculated from the changes in enthalpy in the evaporator and compressor, and the motor efficiency. denoted the COP of the compressor, which involved solely removal of the heat load within the storage rooms. Generally, the COP should include all addition loads incurred from ancillary components such as the condenser fans, pump and evaporator fans. Hence the equation for computing the overall COP is written thus; Where is the sum of the power of all ancillary components in . consistutes the evaporator fan power ( ), condenser fan power ( ) and pump power ( ). This determines the amount of heat load which is removed from the system as work (electrical power). Total Energy The energy used was calculated from the heat load, together with the additional load incurred from the ancillary components such as the condenser fans, pump and evaporator fans. Converting this to electrical energy terms was attained by dividing the heat load by the measured in . 87 / 95 . The energy used was FRISBEE tool Global warming impact assessment TEWI stands for Total Equivalent Warming Impact. The concept was developed as a comparative index of the global warming impacts of applications by accounting for both the direct contributions from refrigerants and the indirect contributions from energy consumption. It provides a useful tool to compare various technologies. The calculation and definition of the TEWI value is: where GWP : Global Warming Potential of the refrigerant. GWP values depend on the infrared absorption properties of the gas and the elapsed time before it is purged from the atmosphere L : leakage rate per year (%/year) n : operating life (years) m : refrigerant charge (kg) a : recycling factor (%) Eannual : energy consumption per year (kWh) b : CO2 emission per kWh (kg CO2 / kWh) 88 / 95 FRISBEE tool Superchilling and supercooling Introduction Fresh foods demand good methods to keep food products at an acceptable low temperature all through the production line, transport and storage. Storage temperature is important in all stages of the products shelf life, and storage by producer, the retailer and the consumer. The market opinion is still that fresh foods are better than frozen foods. Thus, the demand for keeping the food fresh is increasing, and the requirement for keeping the right temperatures are essential. It is therefore important to measure and show that superchilled products with a low content of ice do have the same quality characteristics as fresh products. Research and development of new and improved methods for chilling have resulted in the concept of superchilling. Literature report has several terms to describe superchilling, including deep chilling, partial chilling, partial freezing and even supercooling (Nordtvedt, 2003). Supercooling is not partly frozen, but chilled under the initial freezing point without ice formation. Superchilling and supercooling Superchilling and supercooling have great potential to enable safe, high quality and long term storage of foods without the consumer perceived detrimental effects of freezing. If these technologies were combined with perfusion chilling for meat and fish, then additional benefits such as rapid cooling, low weight loss and novel products could result. Depending on the perfusion fluid there is the potential to cure pork in line or to rapidly chill to a low temperature using a cryoprotectant without actually forming ice crystals. Energy and environmental benefits are envisaged due to reduced heat loads and higher storage temperatures (compared to frozen food). During superchilling and supercooling factors such as cooling rate and temperature will be of great importance to achieve the defined ice-level (superchilling) ortemperature without freezing (supercooling) in the final product. The degree of superchilling that will improve the shelf life sufficiently whilst fulfilling the demands regarding process ability and quality attributes need to be determined for the set product groups. Efficient and flexible superchilling processes that preserve premium product quality must be designed and basic data for calculation of chilling time and temperature and refrigeration load must be found. Effective technical tools for measuring the amount and distribution of ice inside the product on-line are required. Superchilling is a conservation method for foods where some of the water in the food product is frozen. The product is then held at a temperature between -0.5 and -4 °C. The concept of superchilling has been under continuous development for the last 10 - 20 years. Even today, superchilling of foods is performed in different ways; superchilled storage of foods without any pre treatment and superchilled storage after initial surface freezing followed by temperature equalization. 89 / 95 FRISBEE tool Practical superchilling methods reported in literature are refrigerated sea water (RSW), air blast tunnels and contact chilling (Winther et al., 2009). During storage, the ice distribution equalizes and the product obtains a uniform temperature at which it is maintained, the ice fraction in the acts as a cold buffer during further storage and transportation (Magnussen et al., 2008). When the temperature is kept at superchilling storage temperatures, there is no need for additional crushed/flaked ice on the fish to keep the temperature low. Chilled fresh fish is normally packed in boxes filled with approximately 30 % ice to keep the temperature low during transport and storage This addition of ice increases the weight and dimensions of the product to be transported, so reducing efficiency meaning potentially more deliveries and greater fuel use. Nordtvedt (2003), Duun et al., (2007), Duun et al., (2008), and Stevik et al., (2010) state that superchilling is a method for increasing the shelf life of food products. Several different methods for superchilling have been demonstrated on an experimental basis, and the main effort now is to use the research knowledge on an industrial scale in the food industry. Supercooling has shown high potential for certain kinds of vegetables, and development for supercooling technologies for meat products are now a focus. References Duun A.S, A.K.T. Hemmingsen, A. Haugland, T. Rustad, (2008). Quality changes during superchilled storage of pork roast, Food Science and Technology, Volume 41, Issue 10, Pages 2136-2143 Duun A.S, Rustad T, (2007). Quality changes during superchilled storage of cod (Gadus morhua) fillets, Food Chemistry, Volume 105, Issue 3, Pages 1067-1075 Magnussen, O.M., Haugland, A.,Hemmingsen, A.K.T., Johansen, S., Nordtvedt, T.S. (2008). Advances in superchilling of food - Process characteristics and product quality. Trends in Food Science & Technology 19:418-424. Nordtvedt, T.S. (2003). Super chilling - State of the art review. In SINTEF Energy Research, Trondheim - Norway. Stevik A.M, Duun A.S, Rustad T, O’Farrell M, Schulerud H, Ottestad S, (2010). Ice fraction assessment by near-infrared spectroscopy enhancing automated superchilling process lines. Journal of Food Engineering, Volume 100, Issue 1, Pages 169-177 90 / 95 FRISBEE tool Winther, U., Ziegler, F., Hognes, E.S., Emanuelsson, A., Sund, V., Ellingsen, H. (2009). Carbon footprint and energy use of Norwegian seafood products. In SINTEF Fisheries and Aquaculture, Trondheim. 91 / 95 FRISBEE tool Phase change materials Introduction Several reviews have been published in the last ten years about Phase Change Materials (PCM'S). One of the first review has been carried out by (Zalba et al., 2003). In this work a list of available PCM'S from 0°C to 850°C is given, including organic and inorganic, commercial and non-commercial materials. The thermophysical properties listed are the melting temperature, the heat of fusion and the thermal conductivity (mainly liquid). Only one paraffin (tetradecane) is identified in this work as a storage material below 5°C. The most common and the most used phase change material for cooling applications is water. The use of large quantities of chilled water or ice for thermal energy storage has been widely developed for years, especially in air conditioning applications. Many cold storage tanks for building cooling applications have been built and studied. The advantages and drawbacks of the thermal energy storage strategy have been identified through the use of this inexpensive and widely available material. A review on cool thermal storage technologies as a tool for electrical load management was published by (Hasnain, 1998a, b) with a specific study on the pros and cons of the two most common thermal energy storage technologies: chilled water and ice storage. The identified advantages of a system using a cooling storage capacity compared to a conventional one are pointed out by the author: a reduction of the refrigeration plant capacity which cas no longer to cope with the peak load a 100% load operating condition (at its optimum efficiency) for the chillers plant an improvement of the chillers efficiency by operating it during night hours a reduction of the refrigerant charge due to the reduction of the refrigerating capacity : this last advantage is of high importance regarding the environmental impact of the refrigerating system Since it shifts the electricity requirement from peak to off-peak hours, both technologies (chilled water or ice) have demonstrated savings in energy, but also in initial capital costs in the case of large applications. Hasnain also points out the enormous volume requirement of chilled water storage compared to ice storage, and more generally to phase change materials. A suitable phase change temperature is an obvious requirement of a phase change material. The range of temperature corresponding to food cold chain applications is from -60°C (fast freezing processes) to 6°C (fresh food preservation). Other requirements on a phase change material can be grouped in physical, technical and economic requirements: large phase change enthalpy cycling stability small supercooling good thermal conductivity small volume change during the phase change transition chemical stability compatibility with other materials safety constraints low price good recyclability 92 / 95 FRISBEE tool There is not a material fulfilling all those criteria. For low temperatures, usually water-salt solutions at their eutectic concentration are used. Paraffin waxes, fatty acids and sugar alcohols are also potential candidates for cooling applications. Organic, in contrast to nonorganic PCM'S usually show less supercooling or phase separation and, consequently, often eliminate the need for a nucleating agent. But their thermal conductivity and phase change enthalpy are usually lower than water-salt solutions. PCM Materials implemented in the FRISBEE Tool PCM name type Composition Tmelt H density Thermal Cp liq (kJ/kg) liq conductivity liq URL/Reference E.00 Salt solution Water + additive 0.0 334 1.000 0.58 4.19 www.cristopia.com E.3 Salt solution -3.7 314 1.062 0.6 3.84 www.cristopia.com E.6 Salt solution Water + sodium carbonate + additives Water + potassium hydrogenocarbonate + additives -6.0 276 1.115 0.56 3.84 www.cristopia.com E.11 Salt solution -11.0 303 1.134 0.56 3.33 www.cristopia.com E.12 Salt solution Water + potassium chloride (~19,5%) + additives Water + urea + additives -12.0 301 1.092 0.57 3.55 www.cristopia.com E.15 Salt solution Water + ammonium chloride + additives -15.0 303 1.055 0.53 3.87 www.cristopia.com E.18 Salt solution -18.0 255 1.285 0.56 3.86 www.cristopia.com E.21 Salt solution Water + sodium nitrate + additives Water + sodium chloride (~22,6% eutectic) + additives -21.0 233 1.165 0.57 3.35 www.cristopia.com E.26 Salt solution -26.0 255 1.249 0.58 3.65 www.cristopia.com E.29 Salt solution Water + sodium chloride + sodium nitrate + additives Water + sodium hydroxide + additives -29.0 222 1.201 0.64 3.69 www.cristopia.com E.33 Salt solution Water + ammonium chloride + sodium nitrate + additives -33.0 243 1.288 0.56 2.95 www.cristopia.com References Hasnain, S. M. (1998a). Review on sustainable thermal energy storage technologies, Part I: heat storage materials and techniques. Energy Conversion and Management 39, 1127-1138. Hasnain, S. M. (1998b). Review on sustainable thermal energy storage technologies, Part II: cool thermal storage. Energy Conversion and Management 39, 1139-1153. 93 / 95 FRISBEE tool Multi-objective optimization algorithm Introduction Low temperature storage is widely employed to increase the storage life of apples. However, the use of refrigeration accounts for up to 15% of the global use of electricity and is also a major contributor to environmental pollution. Increasing the storage temperature by 1°C can significantly reduce the total cost of electricity during apple storage. Several studies have either focused on optimising product quality, Energy use or environmental impact. However, no single study has been performed to simultaneously optimizing all these three parameters. It is generally not possible to obtain a single solution that is optimal for all these objectives, improving one objective usually means degrading others. In tackling such problem, a multi-objective optimization approach can be used. In this approach, a set of solutions that presents the best alternatives, the pareto optimal, is obtained (Deb, 2001; Ehrgott and Gandibleux, 2002). Multi-objective optimization aims at minimizing or maximizing more than two objective functions and may be subject to a set of constrains. In attaining this objective, a decision variables must be defined. Decision variables The decision variables are variables that are being changes during the optimization process in order to minimize or maximize the objective functions. For example, in optimizing the quality of a product during refrigerated storage, the control variables may be the initial product quality, the storage temperature, packaging materials etc. As a matter of fact, the decision variables are any variables that can be altered to optimize a particular objective. The most important control variable in the refrigeration process is the process temperature, and therefore the temperature was selected as the Decision variable in the FRISBEE project for optimization of a particular technology. Objective functions The objective functions are the functions that is to be optimized in the optimization problem. They can idea be algebraic or differential equations, and must be a function of the decision variable (i.e. in this case, they must be a function of temperature). In principle, the can be any number of objective functions in an multi-objective optimization process. However, the complexity of the optimization process increases with the addition of more objective functions. In practice, the number of objective functions should be limited to 3, and it because impractical to interpret the results graphically when the number of objective functions is greater than 3. In developing the multi-objective optimization algorithm in this study, the main objective functions were identified as the models for energy use, CO2 emission and quality loss. These models were developed in D.3.2.1.5 and D.3.2.4.9. The software is developed in such a way that a user can select any two or all three of the different objective functions. For the quality evolution, the user will have to define (by selecting) which quality indicators will be used for the optimization problem. Constraints The best solutions may not usually be the most practical. For instance, the optimal storage temperature of a freezing process might be -90°C, but the power of the compressor might not allow the temperature to go below -30°C. Another example is apple storage, where storing at sub-zero 94 / 95 FRISBEE tool temperatures might suggest better firmness, but that will also mean the apples will suffer from chilling injury (Watkins and Jackie Nock, 2004). This means therefore that, for every optimization problem, there are certain constraints may be defined. Constraints may be defined on the decision variables (as bound constraints) or directly on the objective functions. In this study, the constraints are only defined as temperature bounds. Weighted multi-objective function Product quality, energy use and CO2 emission are three objectives that are contrasting in that minimising losses in product quality will most often require storing at lower temperatures, which will result in a higher energy usage and emission of CO2. This means that no single solution might be considered optimal, but a set of optimal solutions (pareto optimal) are possible. To get that unique optimal solution, taking into account trade-offs in all three objectives, we defined a weighted multi-objective function by assigning different weights to product quality, energy use and environmental impact. The following guidelines were used: € values (±) are assigned to each objective, since all three objectives can be expressed in terms of €. o For the product quality, a price (€ / kg) is assigned, and this may vary from one quality grade to another. Critical quality limits are provided, beyond which it is assumed the product has no value. o Energy is assigned a cost (€ / kWh) based on the electricity pricing. o Emission is a assigned a cost (€ / ton of CO2 emitted) based on the emission rights. A user can altogether eliminate one or more objective function(s), meaning he/she has literally assigned a zero weight to this objective function(s), if he/she wishes to do so. The weighted objective function is the following, which calculates the “chain profit”: if Qproduct Qproduct crit f profit = U product - EuseU electricity - CO2 ,emissionU emission rights else (1) f profit = 0 - EuseU electricity - CO2 ,emissionU emission rights end where f profit (€ / kg) is the cold chain block profit; U product (€ / kg) is the unit price of the product; Euse (kWh / kg) is the energy use in cooling, U electricity (€ / kWh) is the electricity pricing, CO2,emission (kg CO2 / kg) is the CO2 emission and U emission rights (€ / kg CO2) and is the expected cost from the emission of CO2 to the environment (CO2 emission rights). References Deb, K., 2001. Multi-objective Optimization using Evolutionary Algorithms (Chichester: John Wilet & Sons). Ehrgott, M. and Gandibleux, X. (Eds), 2002. Multiple Criteria Optimization – State-of-the-art Annotated Bibliographic Surveys (Dordrecht, Kluwer Academic Publisher). 95 / 95