1
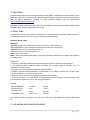
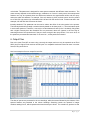
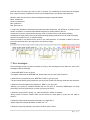
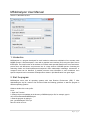
MS2Analyzer User Manual
Version 1.0, November 22, 2013
1. Introduction
MS2Analyzer is a program developed for small molecule substructure elucidation from accurate mass
MS/MS spectra. It was developed in Java with a graphical user interface (GUI) using the Open Source
IDE Eclipse. The main function of the software is to search mass spectral features such as neutral losses,
product ions, m/z differences, and precursor ions in a large number of MS/MS spectra. Combining the
searching results and feature-substructure/compound class relationships knowledge, substructure or
compound class can be identified. If possible precursor mass information is also considered, even
specific compound can be annotated. Examples were shown in lipid identification from green algae.
2. Start the program
MS2Analyzer works with all operating systems with Java Runtime Environment (JRE) 7. After
downloading the zip file, extract it first and then follow the following guidelines to start the program in
different operating systems.
Window: double click on the jar file.
Linux:
1. Open the Terminal
2. Change the current pathway to the directory of MS2Analyzer jar file, for example, type in:
cd /home/vm/Downloads/MS2Analyzer
3. Start the program by typing in:
java –jar MS2Analyzer-ver2-1.jar
Mac OS: similar to Linux
1|Page
3. Input Files
Tandem mass spectra stored in NIST Mass Search format (MSP) or Mascot generic format (MGF) can be
processed. MGF can be exported from raw data file using software provided by instrument manufacturer,
such as Agilent MassHunter software, or freely available software such as ProteoWizard
(http://proteowizard.sourceforge.net/).
Due to the limitation of the output Excel 2003 files, the maximum number of input spectra is 65534. Data
files with a larger number of spectra have to be split.
4. Query Files
Query files are text files that contain the information of mass spectra features that users want to search. It
can be easily written by users, as long as the following format is followed.
Definition Name Mass
Definition:
"NEUTRAL-LOSS": the m/z difference between precursor ion and product ions
"MZ-DIFFERENCE": the m/z difference between the product ions in a spectrum
"PRECURSOR-ION": the m/z of the precursor ion
"PRODUCT-ION": the m/z of the product ion
Name: Name of the feature
Mass: Mass of the feature. Both integer and decimal numbers are allowed, but comma is not allowed in
the mass number.
Please note:
1. Each query starts with a definition keyword and takes a single line. Keyword is case sensitive.
2. The separator between Definition, Name and Mass can be space (single or multiple), tab, or a
combination of space and tab.
3. No space or tab is allowed inside Definition, Name and Mass.
4. Optional: separate intensity threshold of each product ion by adding a number (0.0-1.0) after mass.
This will overwrite the universal threshold in GUI.
5. Optional: Any line that starts with "REM" is considered as a comment.
6. If any line is written in query file without or keyword, MS2Analyzer will give a warning message, but it
can still continue working if you click "OK" and ignore that line.
Example:
MZ-DIFFERENCE
NEUTRAL-LOSS
PRODUCT-ION
PRECURSOR-ION
HCOOH
NH3
46.005
DGTS
PG18:1/16:1
236.150
745.502
17.027
0.5
The maximum number of queries in one query file is 255, due to the limitation of the Excel 2003 output
file.
5. m/z window and intensity threshold
2|Page
m/z window: This parameter is designed for mass spectra measured with different mass accuracies. The
mass accuracy depends on the instrument type, calibration, etc. Once it is set by users, the mass spectral
features can only be reported when the differences between the experimental values and the query
values are within this window. For example, if the m/z window is 0.005, and we want to look for product
ion of 236.150, only product ion m/z between 236.145 and 236.155 can be found. Please note that in this
example, 236.145 and 236.155 cannot be found.
Intensity threshold: This parameter can be used to reduce the effect of the noisy peaks in the spectra.
The intensity threshold is actually a relative intensity based on the base peak, i.e., the most intense peak
in each mass spectrum. Therefore, it can only be a value between 0 and 1(0 and 1 included). Only peaks
with a higher intensity than the threshold can are processed; others are ignored in the first step of
searching and won’t be reported even if they are close enough to the query values. If it is set to be 0, all
the peaks are processed and searched; if it is set to be 1, all the peaks are excluded.
6. Output Files
Due to the Java Excel API we were using, currently the output result can only be exported as an Excel
2003 (.xls) file. Higher Excel versions can still open it in compatible mode and users can save it as other
format, if they would like to.
Here’s an example of how an output file look like:
The titles of spectra are presented in the row headings, while the names followed by the masses of the
spectral features are presented in the column headings. Searching results are reported in integer
numbers starting from 0, which represent the times that they are found. For neutral loss, product ion and
3|Page
precursor ions, the number can only be 0 and 1. However, for m/z difference, sometimes it can be higher
than 1 since the same m/z difference can be found multiple times in one tandem mass spectrum.
Different colors are used in the names to distinguish the type of spectral features.
Black: neutral loss
Green: m/z difference
Blue: product ion
Red: precursor ion
To help users validate the searching result manually, when neutral loss, m/z difference or product ion are
found in a spectrum, a comment with detailed information is usually written to the cell.
neutral loss: precursor m/z (its relative intensity, often 0.0)-product ion m/z (its relative intensity)
m/z difference: larger product ion m/z (its relative intensity)-smaller product ion m/z (its relative intensity)
product ion: product ion m/z its relative intensity
When more than 3 m/z differences are found in one mass spectrum, no comment is added or else the
text in the comments will be too long and file size will be too large.
Example:
7. Error messages
Error messages will pop up when something is wrong in the searching process. Below are some error
messages and their meanings.
1. When MSP/MGF file are not found:
“The system cannot find the MGF/MSP file, please make sure you select the correct file.”
2. When there’s no keyword such as “NEUTRAL-LOSS” in your query file:
“The tool cannot find any query keyword in your query file. Please note that key words are case sensitive.”
3. When there are lines without any keyword or “REM” in your query file:
“Warning: your query file contains contents that are not query or comments. MS2Analyzer will keep
processing, but we recommend you to check your query file format.”
4. When the query format is wrong, e.g., there are spaces in names or numbers:
“Query format is incorrect. Please make sure the there's no extra space in query line and mass is
numeric.”
5. When the input intensity threshold is less than 0 or larger than 1:
"Please make sure intensity threshold are within 0.0-1.0."
6. When the output file pathway is not valid or the file is open in Excel:
4|Page
“Exception occurs in writing files: Please make sure your output file pathway is correct and the file is not
used by another process.”
7. When the MGF file format cannot recognized:
"Unrecognized MGF file format: Please check the file format."
How to solve it: Make sure the file format is correct. Try to open it with other software, such as NIST
search, or open it with NotePad or TextPad. MS2Analyzer can only read MGF file in the following core
format:
BEGIN IONS
PEPMASS=740.5181274
CHARGE=1+
TITLE=MS/MS of 740.5181274 1+ at 11.1204666666667 mins
28.9527430249094
9.05
43.2779406334487
8.160714
277.21431070736
1499.587
740.518886551048
923.6494
END IONS
Other optional parameters are also allowed in the beginning of the data file. If your MGF file is different
from the above format, but is still correct, please contact us with your format. We will update the software
to read customer files.
8. When the MSP file format cannot recognized:
“Incorrect MSP file format, please make sure the file format is correct and there's no extra blank line in the
file.
How to solve it: Similar to the error of MGF file format, first make sure the format is correct. MS2Analyzer
can only read MSP file in the following format:
Name: MS/MS of 740.5181274 1+ at 11.1204666666667 mins
PrecursorMZ: 740.5181274
Num peaks: 4
28.9527430249094
9.05
43.2779406334487
8.160714
277.21431070736
1499.587
740.518886551048
923.6494
Again, the above format only contains the necessary part of the data and some optional parameters are
allowed. If your MSP file is different from the above format, but is still correct, please contact us with your
format. We will update the software to read custom files.
8. Run in batch
In order to run the program in batch mode, you can use the command line version of the program, which
can only be started in command line window or batch files.
.
From command window:
5|Page
1. Open the command window (cmd in windows) and change the current directory to the directory of
MS2Analyzer_commandline.jar, e.g., cd D:\Projects\MS2Analyzer\Commandline
Or go to the folder containing the jar file, and "open command window here" (shift+ right click on the
folder name).
2. Start the java program with the following arguments.
java -jar MS2Analyzer_commandline.jar argument1 argument2 argument3 argument4 argument5
argument1: the full pathway and name of MSP/MGF file, e.g., D:\Projects\Data\lipids.mgf
argument2: the full pathway and name of the text query file, e.g., D:\Projects\Data\query.txt
argument3: the full pathway and name of the output excel 2003 file, e.g., D:\Projects\Data\lipids.xls
argument4: m/z window, e.g., 0.005
argument5: intensity threshold, e.g., 0.05
Using batch file:
Open a text editor such as Notepad, and put in the following text:
java -jar MS2Analyzer_commandline.jar argument1 argument2 argument3 argument4 argument5
Save it as .bat file in the same folder of the jar file and double click to run it. If the file is not saved in the
same folder, the full pathway of the jar file also needs to be included.
9. FAQ
1. What kind of analysis can MS2Analyzer perform?
Any kind of small molecule substructure identification from tandem mass spectra can be performed, as
long as the relationships between mass spectral features and substructures/ compound classes are well
understood. Some manual work has to be done after search by MS2Analyzer. The examples of lipid
identification are shown in another tutorial.
2. Does MS2Analyzer only work for accurate mass MS/MS spectra?
No. Although it is designed for accurate mass MS/MS spectra, it can also work with low mass accuracy
spectra by setting a high m/z window. However, it is noteworthy that with a higher mass accuracy, the
searching results are more specific and fewer candidates will be found.
3. What m/z window and intensity threshold should I use?
They are experiment dependent and have to be decided by users. For example, mass accuracy is not
only related to the type of instrument, but also how well it is calibrated. Mass accuracy can be determined
by measuring reference ions during the run. Intensity threshold, on the other hand, it is more of an
arbitrary decision. Users can look at the data and decide which level of peaks is not important to them.
4. How long does it take to use MS2Analyzer to analyze my data?
The time it takes to finish processing data depends on the speed of CPU, the data file size, the number of
queries and the parameters you are using. For example, with a 8 core i7 CPU @3.60 GHz, it took about 1
min to search 165 neutral losses in 19329 MS/MS spectra in a 26.4 MB file. The m/z window was 0.01
and intensity threshold was 0.02
6|Page
9. Contact us
To report bugs, ask questions and offer suggestions, please contact us by email: [email protected]
Thanks for using MS2Analyzer!
7|Page