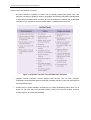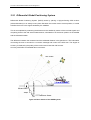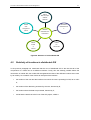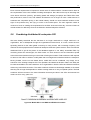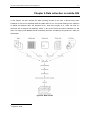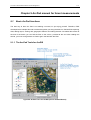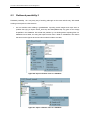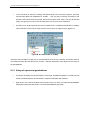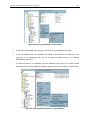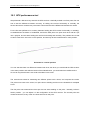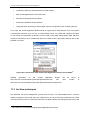
1
The use of ArcPad® and ArcGIS® in
Forest Management
Supervisor at TAMK:
Authors:
Mrs. Eeva Sundström
Pieter Dejonghe
Jeroen François
Supervisor at KHBO:
Mr. Luc Boehme
The use of ArcPad® and ArcGIS® in
Forest Management
THESIS
submitted in partial fulfilment of the
requirements for the degree of
MASTER
in
CONSTRUCTION ENGINEERING
OPTION: SURVEYING
Supervisor at TAMK:
Authors:
Mrs. Eeva Sundström
Pieter Dejonghe
Jeroen François
Supervisor at KHBO:
Mr. Luc Boehme
Abstract
This final thesis consists out of two main parts. The theoretical part examines techniques that made
mobile GIS reality, techniques that can make mobile GIS more performing and some information on
forestry to make the non-expert reader ready for the practical part. We start the theory with basics on
PDA’s and on the MobileMapper CE. GPS plays a central role in mobile applications; a good
understanding of this is from great importance to know what you are doing in the field and how to
interpret data like PDOP, DGPS … This makes the next chapter. These techniques made mobile GIS
possible. Distributed GIS and Enterprise GIS can make mobile GIS more performing. These are both
database-connected ways of working to enable lots of users to work with the same data. The basic
information on forestry introduces the reader to the technical terms, techniques and devices used in
forestry. This is necessary to know what we’re doing in the practical part.
The practical part starts with an overview of all the materials and methods we use to set up the project.
This goes till the map document in ArcView. Next step in the project was learning to work with ArcPad,
adapting the system to our work and using it in the field. The manual for this, the tests in the fields and
the results we booked with the MobileMapper CE and ArcPad are described in last chapters of this
thesis.
Acknowledgements
First of all, we like to thank Mr. Luc Boehme, our teacher GIS in the department of Construction of the
Catholic Institute for Higher Education in Bruges and Ostend and supervisor in our home polytechnic.
He was the stimulus to take this thesis and to go studying at Tampereen Ammatikorkeakoulu (TAMK).
Without him, this thesis wouldn’t have existed because he bought the MobileMapper CE for us.
We can’t forget our supervisor in TAMK, Mrs. Eeva Sundström. She introduced us to the Finish forests
and woke our interest to get ArcPad working in the forest management.
We also want to thank our parents, Mr. and Mrs. François – Vernieuwe and Mr. and Mrs. Dejonghe –
Hoste. They supported us through our studies, encouraged us to keep working on our final thesis
project and most important of all, they gave us the chance to go studying in Finland.
Also thanks to our fellow student and flatmate Hannes Van de Casteele for the wonderful time in
Tampere and for the support during moments our work didn’t go the way we wanted.
Jeroen François & Pieter Dejonghe
Tampere – Finland
April 19th, 2006
Contents
ABSTRACT........................................................................................................................................................... 4
ACKNOWLEDGEMENTS.................................................................................................................................. 5
CONTENTS........................................................................................................................................................... 7
LIST OF FIGURES ............................................................................................................................................ 12
CHAPTER 1 WHAT IS MOBILE GIS? AN INTRODUCTION ................................................................... 16
1.1
BACKGROUND........................................................................................................................................ 16
1.2
WHAT IS MOBILE GIS ? .......................................................................................................................... 17
1.2.1 Defining mobile GIS............................................................................................................................. 17
1.2.2 Terminology: mobile, wearable or wireless GIS ?............................................................................... 19
1.2.3 Why using ArcPad ?............................................................................................................................. 20
1.3
APPLICATION AREAS ............................................................................................................................. 22
1.4
MOBILE GIS IN FORESTRY ..................................................................................................................... 24
1.5
MOTIVATION FOR RESEARCH IN MOBILE GEOGRAPHIC INFORMATION SYSTEMS ..................................... 26
1.6
AIMS OF THE THESIS ............................................................................................................................... 27
1.7
CONTENTS OF THE THESIS ...................................................................................................................... 28
1.7.1 Backbone.............................................................................................................................................. 28
1.7.2 Overview of the chapters...................................................................................................................... 29
CHAPTER 2 PDA............................................................................................................................................... 31
2.1
WHAT IS A PDA..................................................................................................................................... 31
2.2
HARDWARE............................................................................................................................................ 32
2.2.1 The processor ....................................................................................................................................... 32
2.2.2 The memory.......................................................................................................................................... 32
2.2.3 The screen ............................................................................................................................................ 32
2.2.4 The input .............................................................................................................................................. 33
2.3
SOFTWARE ............................................................................................................................................. 33
2.3.1 Operation systems ................................................................................................................................ 33
2.4
MOBILEMAPPER CE .............................................................................................................................. 34
2.4.1 Mobile Mapping platform .................................................................................................................... 35
2.5
HIGH PERFORMANCE GPS...................................................................................................................... 35
2.6
RUGGED AND WATERPROOF ................................................................................................................... 36
2.7
HIGH PERFORMANCE-TO-PRICE RATIO ................................................................................................... 36
2.8
SPECIFICATIONS ..................................................................................................................................... 37
2.8.1 System features..................................................................................................................................... 37
2.8.2 GPS ...................................................................................................................................................... 37
2.8.3 Software ............................................................................................................................................... 37
2.8.4 Standard accessories............................................................................................................................ 38
2.8.5 GPS characteristics.............................................................................................................................. 38
2.8.6 User Interface....................................................................................................................................... 38
CHAPTER 3 THE GPS SYSTEM..................................................................................................................... 39
3.1
WHAT IS GPS?....................................................................................................................................... 39
3.2
PARTS OF THE GPS SYSTEM................................................................................................................... 39
3.2.1 The satellites ........................................................................................................................................ 39
3.2.2 The Control Stations ............................................................................................................................ 40
3.2.3 The Receiver......................................................................................................................................... 41
3.3
TRIANGULATION .................................................................................................................................... 41
3.3.1 Two-dimensional .................................................................................................................................. 41
3.3.2 Three-dimensional................................................................................................................................ 42
3.4
MEASURING DISTANCES ......................................................................................................................... 43
3.4.1 Mathematical idea................................................................................................................................ 43
3.5
PSEUDO RANDOM CODE ........................................................................................................................ 45
3.6
GPS SIGNALS IN DETAIL ......................................................................................................................... 46
3.6.1 Carrier signals ..................................................................................................................................... 46
3.6.2 Pseudo Random Codes......................................................................................................................... 46
3.6.3 Code-Phase GPS vs. Carrier-Phase GPS ............................................................................................ 47
3.6.4 3.6.4 A higher frequency ...................................................................................................................... 48
3.6.5 Receiving the right wave ...................................................................................................................... 49
3.7
EXACT TIME MEASUREMENT .................................................................................................................. 49
3.8
EXACT POSITION OF THE SATELLITES ..................................................................................................... 50
3.9
POSSIBLE ERRORS IN GPS SIGNALS ........................................................................................................ 51
3.10
DIFFERENTIAL GLOBAL POSITIONING SYSTEM ...................................................................................... 53
3.10.1 Referential stations............................................................................................................................. 54
3.10.2 Radio transmitter ............................................................................................................................... 54
3.10.3 DGPS receivers.................................................................................................................................. 54
3.11
POSSIBLE GPS ERRORS .......................................................................................................................... 54
3.12
WAAS/EGNOS .................................................................................................................................... 55
CHAPTER 4 A NEW WAY OF WORKING WITH GIS ............................................................................... 56
4.1
DISTRIBUTED GIS .................................................................................................................................. 56
4.2
RELATIVITY OF LOCATIONS IN DISTRIBUTED GIS................................................................................... 57
4.3
BENEFITS OF DISTRIBUTED GIS.............................................................................................................. 59
4.3.1 Data exchange...................................................................................................................................... 59
4.3.2 Distributing the data ............................................................................................................................ 60
4.3.3 Location-based services ....................................................................................................................... 61
4.4
BACK TO OUR MOBILE GIS .................................................................................................................... 63
4.5
WHEN DOES A DISTRIBUTED GIS MAKE SENSE? ..................................................................................... 63
4.6
PROSPECTS ............................................................................................................................................. 64
CHAPTER 5 ENTERPRISE GIS...................................................................................................................... 65
5.1
INTRODUCTION ...................................................................................................................................... 65
5.2
WHAT IS AN ENTERPRISE GIS? .............................................................................................................. 65
5.3
ASPECTS OF AN ENTERPRISE GIS........................................................................................................... 66
5.3.1 Conceptual framework ......................................................................................................................... 66
5.3.2 Five-step design process ...................................................................................................................... 69
5.4
WHY ENTERPRISE GIS........................................................................................................................... 70
5.5
ENTERPRISE GIS & THE MOBILE USER ................................................................................................... 71
5.6
COMBINING DISTRIBUTED & ENTERPRISE GIS ....................................................................................... 73
CHAPTER 6 DATA COLLECTION IN MOBILE GIS ................................................................................. 74
6.1
GIS DATA COLLECTION VS. MOBILE GIS................................................................................................ 75
6.1.1 GIS Data Collection............................................................................................................................. 75
6.1.2 Mobile GIS ........................................................................................................................................... 76
6.2
ADVANTAGES OF MOBILE GIS ............................................................................................................... 76
6.3
IMPROVED FIELD PROCESSES .................................................................................................................. 77
6.4
THE USE OF ON-THE-FIELD QUALITY IMPROVEMENT .............................................................................. 78
CHAPTER 7 FORESTRY ................................................................................................................................. 80
7.1
INTRODUCTION TO FINNISH FORESTS ..................................................................................................... 80
7.1.1 Forestry areas ...................................................................................................................................... 80
7.1.2 Forest structure.................................................................................................................................... 80
7.1.3 Growing stock, increment and drain.................................................................................................... 81
7.1.4 Employment.......................................................................................................................................... 81
7.2
MAIN GOALS OF FOREST MANAGEMENT ................................................................................................. 81
7.2.1 Definition ............................................................................................................................................. 82
7.2.2 Timber and peat production................................................................................................................. 82
7.2.3 Carbon sequestration ........................................................................................................................... 82
7.2.4 Non-wood forest products and recreation............................................................................................ 82
7.2.5 Reindeer husbandry ............................................................................................................................. 83
7.2.6 Multiple use.......................................................................................................................................... 83
7.3
MANAGEMENT ....................................................................................................................................... 83
7.3.1 Ownership ............................................................................................................................................ 83
7.3.2 Management practices ......................................................................................................................... 83
7.3.3 Harvesting............................................................................................................................................ 84
7.4
MEASURING AND MONITORING FOREST RESOURCES .............................................................................. 84
7.4.1 Land surveying and mapping ............................................................................................................... 84
7.4.2 Measurement of forest resources with a focus on timber ..................................................................... 85
7.5
GIS AND REMOTE SENSING IN FORESTRY ............................................................................................... 90
7.5.1 GIS ....................................................................................................................................................... 90
7.5.2 Remote sensing..................................................................................................................................... 90
7.5.3 Aerial photography .............................................................................................................................. 91
CHAPTER 8 MATERIALS AND METHODS ................................................................................................ 93
8.1
COMPARTMENT MAPS AND COMPARTMENT DATA .................................................................................. 93
8.1.1 Compartment maps .............................................................................................................................. 93
8.1.2 Compartment data................................................................................................................................ 94
8.2
OTHER MAPS .......................................................................................................................................... 97
8.2.1 Base maps ............................................................................................................................................ 97
8.2.2 GT maps ............................................................................................................................................... 97
8.3
AERIAL IMAGES ..................................................................................................................................... 98
8.4
PDA AND ARCPAD ................................................................................................................................ 99
8.4.1 Setup of the PDA and ArcPad .............................................................................................................. 99
8.4.2 Preparing data: ArcPad Tools for ArcGIS ........................................................................................ 102
8.5
ARCVIEW............................................................................................................................................. 103
8.5.1 Manual for setting up Arc View ......................................................................................................... 103
8.6
CONCLUSION........................................................................................................................................ 109
CHAPTER 9 ARCPAD MANUAL FOR FOREST MEASUREMENTS .................................................... 110
9.1
BASIC ARCPAD FUNCTIONS ................................................................................................................. 110
9.1.1 The ArcPad Tools for ArcGIS ............................................................................................................ 110
9.2
FIELDWORK POSSIBILITY 1................................................................................................................... 111
9.2.1 Preparing data for field work............................................................................................................. 111
9.2.2 Copying data to the PDA ................................................................................................................... 114
9.2.3 Collecting data in the field ................................................................................................................. 116
9.2.4 Synchronising data between the PDA and the PC ............................................................................. 121
9.3
FIELDWORK POSSIBILITY 2................................................................................................................... 122
9.3.1 Setup of a personal geodatabase........................................................................................................ 123
9.3.2 Building the ArcView map.................................................................................................................. 125
9.3.3 Transferring and synchronising data ................................................................................................. 125
9.3.4 Collecting data ................................................................................................................................... 129
CHAPTER 10 FURTHER DEVELOPMENTS ............................................................................................. 141
10.1
ARCPAD APPLICATION BUILDER .......................................................................................................... 141
10.2
ARCVIEW TECHNIQUES ........................................................................................................................ 142
10.2.1 Check in / check out macro .............................................................................................................. 143
10.2.2 Calculation macro’s......................................................................................................................... 143
10.2.3 Tforest functionality ......................................................................................................................... 144
10.3
DATABASES ......................................................................................................................................... 144
10.4
MOBILEMAPPER BEACON .................................................................................................................... 144
10.5
GPSDIFFERENTIAL FOR ARCPAD......................................................................................................... 145
CHAPTER 11 PROJECT TESTING PHASE................................................................................................ 130
11.1
FOREST TEST 1 ..................................................................................................................................... 130
11.1.1 Field work report ............................................................................................................................. 130
11.1.2 Issues................................................................................................................................................ 134
11.1.3 Solutions........................................................................................................................................... 136
11.2
FOREST TEST 2 ..................................................................................................................................... 137
11.3
GPS PERFORMANCE TEST..................................................................................................................... 138
CHAPTER 12 CONCLUSIONS ...................................................................................................................... 146
REFERENCES.................................................................................................................................................. 148
LIST OF APPENDICES .................................................................................................................................. 154
APPENDIX I: PERFORMANCE TEST IN THE FOREST ......................................................................... 155
APPENDIX II: TRANSLATION COMPARTMENT DATA....................................................................... 157
APPENDIX III: QUICK-START TUTORIAL ARCPAD ............................................................................ 159
APPENDIX IV: EXPORT SUMMARY ......................................................................................................... 169
APPENDIX V: MAP PROJECTION.............................................................................................................. 170
List of figures
figure 1: Schematic overview of the possible tools in ArcPad............................................................... 21
figure 2: Schematic view of the main use of ArcPad - ArcGIS .............................................................. 22
figure 3: Schematic summary of the application areas of mobile GIS (ESRI ®) ................................... 24
figure 4: the six components of a GIS ................................................................................................... 28
figure 5: Examples of different kind of PDA’s ........................................................................................ 31
figure 6: Screenshot of the start menu of the MobileMapper CE .......................................................... 34
figure 7: Thales MobileMapper CE........................................................................................................ 34
figure 8: Built-in alphanumeric keypad with backlight ........................................................................... 35
figure 9: Easy to use input keyboard on the touch screen .................................................................... 35
figure 10: Rugged and waterproof......................................................................................................... 36
figure 11: The routes of the satellites .................................................................................................... 39
figure 12: Position of the Monitor Stations............................................................................................. 40
figure 13................................................................................................................................................. 42
figure 14................................................................................................................................................. 42
figure 15................................................................................................................................................. 43
figure 16................................................................................................................................................. 44
figure 17: Summary of the GPS signals ................................................................................................ 46
figure 18: Frequencies and parameters of the signals .......................................................................... 47
figure 19: Code frequency vs. Carrier frequency................................................................................... 47
figure 20: Delay of the signal ................................................................................................................. 47
figure 21: Match of the signals............................................................................................................... 48
figure 22: A higher frequency of the carrier wave.................................................................................. 48
figure 23: Satellite routes projected on the earth surface...................................................................... 50
figure 24: Multipath error ....................................................................................................................... 51
figure 25: Basic sketch of the DGPS system......................................................................................... 53
figure 26: Maximum errors for Standard GPS and DGPS..................................................................... 54
figure 27: WAAS system....................................................................................................................... 55
figure 28: Structure of a distributed GIS ................................................................................................ 57
figure 29: Scheme of the different locations in DGIS ............................................................................ 58
figure 30: Positioning by mobile antennas............................................................................................. 61
figure 31: Onstar system ....................................................................................................................... 62
figure 32: geospatial data cycle ............................................................................................................. 67
figure 33: GIS data flow ......................................................................................................................... 68
figure 34: structure of an EGIS, based on ESRI-software..................................................................... 71
figure 35: Mobile GIS in and DGIS and EGIS environment .................................................................. 73
figure 36: Data stream ........................................................................................................................... 74
figure 37: Forestry land areas................................................................................................................ 80
figure 38: Tree species dominance ....................................................................................................... 81
figure 39: Forest management practices other than fellings in 1999 .................................................... 84
figure 40: Schematic view of a stereoscope.......................................................................................... 85
figure 41: Example of a tree calliper...................................................................................................... 86
figure 42: Height measurement based on geometric principles (similar triangles) ............................... 86
figure 43: Height measurement based on trigonometric principles (angles)......................................... 87
figure 44: Important tree measurements ............................................................................................... 87
figure 45: Relascope.............................................................................................................................. 88
figure 46: Use of the relascope ............................................................................................................. 89
figure 47: Random sampling vs. Systematic sampling......................................................................... 90
figure 48: zoom on the aerial image and the compartments ................................................................. 94
figure 49: zoom on the basemap and compartments............................................................................ 97
figure 50: Base map vs. GT map........................................................................................................... 98
figure 51: aerial image of the environment of our compartments.......................................................... 98
figure 52................................................................................................................................................. 99
figure 53............................................................................................................................................... 100
figure 54: Tools icon ............................................................................................................................ 100
figure 55............................................................................................................................................... 101
figure 56............................................................................................................................................... 101
figure 57............................................................................................................................................... 102
figure 58: folder structure..................................................................................................................... 104
figure 59: Raster Dataset Properties ................................................................................................... 105
figure 60: Shapefile properties window ............................................................................................... 106
figure 61: Data frame properties window............................................................................................. 107
figure 62: layer structure...................................................................................................................... 108
figure 63: Screenshot form the finished map document...................................................................... 108
figure 64: Zoom on our compartments ................................................................................................ 109
figure 65: ArcPad Tools for ArcGIS (source ArcPad Manual) ............................................................. 110
figure 66: Screenshot ArcMap ............................................................................................................. 111
figure 67: ArcPad Map Wizard............................................................................................................. 112
figure 68: ArcPad Map Wizard start screen......................................................................................... 112
figure 69: ArcPad Map Wizard screen 2.............................................................................................. 113
figure 70: ArcPad Map Wizard screen 3.............................................................................................. 113
figure 71: ArcPad Map Wizard report .................................................................................................. 114
figure 72: PDA connected.................................................................................................................... 114
figure 73: Microsoft ActiveSync ........................................................................................................... 115
figure 74: The PDA works like an external drive ................................................................................. 115
figure 75: ArcPad toolbars and icons .................................................................................................. 116
figure 76: ArcPad layers screen .......................................................................................................... 116
figure 77: ArcPad Layer Properties – Symbology tab ......................................................................... 117
figure 78: ArcPad Layer Properties - Polygon Style ............................................................................ 117
figure 79: ArcPad options pull down menu.......................................................................................... 118
figure 80: ArcPad options button and Options window ....................................................................... 118
figure 81: ArcPad no position fix.......................................................................................................... 119
figure 82: ArcPad Feature Properties window..................................................................................... 119
figure 83: ArcPad main screen after adding points ............................................................................. 120
figure 84: ArcPad - change attributes.................................................................................................. 120
figure 85: ArcPad Features Properties window with keyboard............................................................ 121
figure 86: import a feature class in a database ................................................................................... 122
figure 87: export a feature class to a database ................................................................................... 122
figure 88: Arc Pad toolbar in ArcMap .................................................................................................. 123
figure 89: making a geodatabase in ArcCatalog ................................................................................. 124
figure 90: Importing Raster Datasets in a geodatabase...................................................................... 124
figure 91: ArcPad toolbar in ArcMap ................................................................................................... 125
figure 92: Get Data for ArcPad screen 1 ............................................................................................. 126
figure 93: Get Data for ArcPad screen 2 ............................................................................................. 126
figure 94: Get Data for ArcPad screen 3 ............................................................................................. 127
figure 95: Get Data for ArcPad Report ................................................................................................ 127
figure 96: Check In Edits from ArcPad window ................................................................................... 128
figure 97: Check In Edits from ArcPad verification request................................................................. 128
figure 98: Feature Properties form when adding a new point ............................................................. 129
figure 102: The relascope we used in the forest ................................................................................. 130
figure 103: Detail of the slot of the relascope ...................................................................................... 131
figure 104: The tree calliper................................................................................................................. 132
figure 105: Measuring the distance to the tree .................................................................................... 132
figure 106: The Haglöf Electronic Clinometer...................................................................................... 133
figure 107: Pointing towards birch point & top of the tree ................................................................... 133
figure 108: The display of the Clinometer – direct reading of the height............................................. 133
figure 109: The compartment layer is not transparent ...................................................................... 135
figure 110: The message on the PDA when there was no position fix................................................ 136
figure 111: Coordinate table ................................................................................................................ 140
figure 99: Custom form made with ArcPad Application Builder (source ERSI)................................... 142
figure 100: MobileMapper Beacon ...................................................................................................... 144
figure 101: GPSDifferential for ArcPad................................................................................................ 145
The use of ArcPad and ArcGIS in forest management
16
Chapter 1 What is mobile GIS? An introduction
1.1
Background
Emerging technologies as the internet, wireless communications and mobile computing have changed
the way we think, the way we asses problems and the way we work. So, also Geographic Information
Systems have gone mobile by moving GIS from the desktop into the field worker’s hands. This poses
a few challenging questions. What technologies are best suited to the mobile environment? What are
the capabilities of mobile GIS? During this thesis we will provide an overview of these technologies
and the capabilities of mobile GIS in a theoretical and practical way.
The vision is to present the user always right information in the right moment at the right place. This
sentence says everything about the two major application areas of mobile GIS: field-GIS and Locationbased services (LBS). This will be explained later on this chapter.
We mentioned already the move of GIS into fieldworker’s hands. They not only get empowered by a
new way of collecting data but also with editing and verification. Mobile GIS brings the office in the
field to improve productivity, decrease costs and minimize project time. If this is incorporated in an
enterprise GIS, a company can even get more advantages of the mobile GIS.
GIS architectures have traditionally focussed on a static environment in which users perform spatial
analysis at their workstation. By using mobile GIS this setting can change dramatically. By combining
PDA, GPS and wireless internet connections, users are able to access and collect (semi) real-time
data.
With this final thesis, we want to examine the acquisition and maintenance of spatial and non-spatial
data used in a mobile GIS.
The use of ArcPad and ArcGIS in forest management
1.2
17
What is mobile GIS ?
1.2.1 Defining mobile GIS
Describing GIS into a good, comprehensive definition can be very challenging. Many scientists tried to
do, but less of them succeeded in defining the total concept of a GIS1. Some remarks why this is quite
difficult:
•
Defining GIS as a Geographical Information System could be to narrow. Maybe that’s why
Longley (2005) titled his book “Geographical information systems and science”. By doing that,
he caught much more than only a system. The word science contains those systems, but puts
also an accent on research.
•
There are so much GIS’s, for every field of usage one can build another definition and can put
the accent on another part of the GIS.
What’s the link of the difficult defining of a GIS with defining a mobile GIS? Well, both have just the
same problems as mentioned above. As traditional GIS, mobile GIS is difficult to define, just because
of the reasons above, but there is also another issue uniquely for the mobile application: there is a
lack of non-ambiguous terminology. This will be explained in the next paragraph. This problem deals
with the use of terms like mobile and wearable GIS.
The most conspicuous characteristic of mobile GIS, referred to the characteristics of traditional GIS, is
certainly the mobility of the whole GIS-process. This means that hard- and software have to be
designed to fit the field workers. This has of course a few implications for the network connecting the
components of our GIS. It isn’t only hard-wired anymore and we must use technologies like Bluetooth,
WiFi or disconnected editing. These will be discussed later on. These two main changes have there
impact on technology and generate a few unique properties for mobile applications:
•
In a mobile service environment, there will be a plethora of terminals (devices). Services must
be able to present themselves on many of these, with consistent functionality and
understandable interfaces.
•
In the mobile “always on” world, people access services and information independent of
location and time.
•
1
Access issues for mobile applications trough wireless technologies.
Boehme, 2005
The use of ArcPad and ArcGIS in forest management
•
18
In stationary designs, the digital and the physical realms are more or less separated. By
contrast, in mobile systems they may be combined. Involving real world data such as
geographic position, temperature, time and traffic gives us the chance to have more real time
applications.
•
Data must be scaled or adapted to fit the mobile devices and their communication protocols.
We need content that provides enough level of detail that can be provided through the
wireless networks and shown on the mobile computing environment.
We mentioned already about the mobility of hard- and software, but there’s also a possibility of using
“mobile data”. We can summarise this type of mobility with the term “distributed GIS”. Because by
using a mobile GIS, there’s always a certain mobility of data and distributed data will gain interest, this
will be discussed in chapter 4.
Mobile GIS is the expansion of a geographic information system (GIS) from the office into the field. A
mobile GIS enables field based personnel to capture, store, update, manipulate, analyse, and display
geographic information. Mobile GIS integrates one or more of the following technologies:
•
Mobile devices
•
Global Positioning Systems (GPS)
•
Wireless communications for Internet GIS access
Traditionally, the processes of field data collection and editing have been time consuming and error
prone. Geographic data has travelled into the field in the form of paper maps. Field edits were
performed using sketches and notes on paper maps and forms. Once back in the office, these field
edits were deciphered and manually entered into the GIS database. The result has been that GIS data
has often not been as up-to-date or accurate as it could have been.
ESRI's developments in mobile GIS have enabled GIS to be taken into the field as digital maps on
compact, mobile computers, providing field access to enterprise geographic information. This enables
organizations to add real-time information to their database and applications, speeding up analysis,
display, and decision making by using up-to-date, more accurate spatial data.
After all these defining issues, we could say that mobile GIS can be defined as a software/hardware
GIS-framework for the access of spatial data and services through mobile devices via wired or
wireless networks.
The use of ArcPad and ArcGIS in forest management
19
1.2.2 Terminology: mobile, wearable or wireless GIS ?
Mobile GIS can be defined as an integrated software/hardware GIS-framework for the access of
spatial
data
and
services
through
mobile
devices
via
wired
or
wireless
networks.
Wireless and wearable GIS are subcategories of mobile GIS technology.
"Wireless GIS" is a subcategory of mobile GIS technology that focuses on the wireless networking
capability of mobile GIS services.
Wearable GIS: S. Mann defines a wearable computer as “a small body-worn computer system that is
always on and always ready and accessible”2 .
From the human point of view, he describes wearable computing with the following six attributes:
•
Unmonopolising the user’s attention: it does not cut you from the outside world like
virtual reality. It is built with the assumption that computing is a secondary activity.
•
Unrestrictive to the user: he can do other things while using it.
•
Observable by the user: it can get the user’s attention continuously if he desires.
•
Controllable by the user: he can have control of it at any time he wishes.
•
Attentive to the environment.
•
Communicative to others.
Especially the attributes unmonopolising, unrestrictive and controllable are essential for the use of GIS
in outdoor applications.
Software for wearable computers has to be developed taking into account these attributes. Traditional
GIS are impracticable for wearable computers because they lack of the above attributes of wearable
computing, e.g. they monopolize the user’s attention.
Innovative GIS front ends and interaction techniques have to be developed to make use of the
geographical information on wearable computers. In the following, we call these next-generation GIS;
wearable GIS. With wearable GIS, the user will be able to access on demand geographical information
any time at any location.
2
Mann, 1998
The use of ArcPad and ArcGIS in forest management
20
Egenhofer and Kuhn3 foresee several wearable GIS applications like:
•
smart horizons, which allow a user to actually look beyond his or her field of view,
•
magic wands, pointing devices to identify geographic objects by pointing to them, and
•
smart glasses to augment reality
by superimposing a digital image into the field of view.
With a wearable GIS, the user does not only get access to the geographical data which is locally
stored on the system. Such systems must be able to deal with highly distributed data and even
distributed GIS functionality.
Advanced computational models are needed to integrate different geographical data sources and to
respond in near real time.
1.2.3 Why using ArcPad ?
ArcPad is a mapping tool for working with your GIS data in the field. Field GIS tasks are often quite
different from the GIS tasks performed in the office and so the computers are used in these different
environments. Desktop computers usually have fast CPU’s, large amount of RAM memory and disk
space, and large display monitors. In contrast, field computers (PDA’s) have relatively slow CPU’s and
limited RAM and storage capacity. Furthermore, the fieldwork environments ranges from working in
bright sunlight to rain to subzero snowy conditions, this compared to the constant temperature and
lightning conditions in an office environment. Therefore you need to consider all of these factors
before preparing your GIS data for the use in the field with ArcPad.
ArcPad is software for mobile GIS and field mapping applications using handheld and mobile devices.
ArcPad provides field-based personnel with the ability to capture, analyse, and display geographic
information, without the use of costly and outdated paper map books.
With ArcPad, you can perform reliable, accurate, and validated field data collection. Integrate GPS,
rangefinders, and digital cameras into GIS data collection. Share enterprise data with field-workers for
updating and decision making. Improve the productivity of GIS data collection. Improve the accuracy
of the GIS database and make it more up to date.
3
Egenhofer, 1998
The use of ArcPad and ArcGIS in forest management
21
Here are some key features of ArcPad:
•
GIS data collection: possibility to create, edit and display spatial data (points, lines, and
polygons), the ability to display a variety of geographic and attribute information (Attribute data
is descriptive information about a location and can be edited and collected with ArcPad data
collection forms), it supports vector and raster data in a multilayered environment…
figure 1: Schematic overview of the possible tools in ArcPad
•
Integrate external hardware: ArcPad supports field devices, such as GPS receivers,
rangefinders, and integrated digital cameras with GIS data collection. Input from these devices
is stored within the GIS.
•
ArcPad tools for ArcGIS Desktop: ArcPad tools for mobile geodatabase editing allow you to
check out your GIS data using ArcGIS Desktop, edit in the field with ArcPad, and post
changes back to the central GIS database.
The use of ArcPad and ArcGIS in forest management
22
figure 2: Schematic view of the main use of ArcPad - ArcGIS
•
Symbology and style sheets: ArcPad enables high-quality mapping on mobile devices through
supporting ArcGIS symbology and style sheets.
•
Language support: the ArcPad user interface is available in a number of languages, making it
easier for mobile GIS workers whose native language is not English.
•
ArcPad Application Builder: is the development framework for building custom ArcPad
applications for mobile GIS. Effective mobile GIS workers require applications and tools that
have been customized for a specific field task or project. ArcPad Application Builder is the
development framework for creating custom solutions for mobile GIS applications and tasks.
1.3
Application Areas
There are two major application areas of mobile GIS.
•
Field-based GIS: which focuses on GIS data collection, validation and update (spatial and
attribute).
The use of ArcPad and ArcGIS in forest management
•
23
Location-based services (LBS): which focus on business-oriented location management
functions, such as navigation, street routing, finding a specific location or tracking a vehicle.
Fire-fighters, police officers, engineering crews, surveyors, utility workers, soldiers, census workers,
field biologists, and more use mobile GIS to complete the following tasks:
•
field mapping: create, edit, and utilise GIS maps while in the field;
•
asset inventories: create and maintain an inventory of asset locations and attribute
information;
•
asset maintenance: update asset location, condition, and schedule maintenance;
•
inspections: maintain digital records and locations of field assets for legal code compliance
and ticketing;
•
incident reporting: document the location and circumstances of incidents and events for further
action or reporting;
•
GIS analysis and decision making: perform measuring, buffering, geoprocessing, and other
GIS analysis while in the field.
The application areas and industries of mobile GIS can summarised in this scheme:
The use of ArcPad and ArcGIS in forest management
24
figure 3: Schematic summary of the application areas of mobile GIS (ESRI ®)
1.4
Mobile GIS in Forestry
The new generation of compact PDA’s and GPS receivers incorporate GIS into the palm of your hands
and into the forest, this gives clearly more value for the forest planners.
The use of GIS in forestry is quite obvious (and deeper explained in the chapter about Forestry), but
also Mobile GIS is used more and more in Forestry. Roughly, Mobile GIS is more specific for Forestry
in some fields like: timber, stand & forest management in general, forest planning & protection, fire
management, ecology, waterways and even urban forestry…
When you think about Mobile GIS in forestry, you can think about some applications that are quite
obvious, such as defining and finding back the borders of the forests (jurisdictional) and the
compartments (tree attributes), pointing some sample plots,… These properties are linked to the
georeferenced position.
The use of ArcPad and ArcGIS in forest management
25
But the thing that makes it the most interesting is the possibility to complete and change the data,
which is georeferenced (linked to the sample points). By having this opportunity, the person who is
making the forest samples is able to fill in the data in the database in the PDA immediately, instead of
filling in listings by hand and copy that to the pc later on. In fact he can pass one step in the project, a
step that takes a lot of time. So the use of these mobile devices saves time (and money). Afterwards
it’s also possible to track back where you have walked and taken the sample plots. You can also
import that information into ArcGIS, directly on the map or aerial image, so you have a visual of the
situation.
The use of the PDA – GPS evades also the use of large, unhandy paper maps to see where the
compartments are. Also possible errors of positioning are evaded by the accuracy of the GPS.
Questions like “in which compartment am I?” belong to the past (sometimes it’s not easy to know your
exact location in the forest).
Apart from the direct advantages, there are some possibilities incorporated by GIS in general, more
likely the larger cases, such as the overall forest planning of an area, including harvesting, log
production, growth, death, thinning, reforestation,…
Here we will point out the two most important:
1.
Timber Management
GIS-based spatial modelling allows managers to maintain stand information to meet shifting
market demands. It also provides the appropriate records for contract administration and fiscal
accounting generated by harvest activities. Logging engineers can develop solutions that best
fit harvest designs to topography and stand objectives.
Application areas include:
2.
•
Logging Engineering
•
Harvest Scheduling
•
Contract Administration
Logging Engineering
•
Harvest Scheduling
•
Contract Administration
•
Stand Management
GIS provides a means to track all the elements of forest prescriptions and schedules for a
multitude of stand activities. In the field, Mobile GIS gives you the tools for accurate inventory
control and management.
Application areas include:
The use of ArcPad and ArcGIS in forest management
1.5
•
reforestation;
•
stand tending;
•
thinning and
•
silvicultural prescriptions.
26
Motivation for research in mobile geographic information
systems
There are some different reasons and motivations why we chose this subject for the final thesis. First
of all in Belgium we are in Industrial Engineering in Construction, with an option for surveying (in the
last year), so we have courses about GIS in our home institute. The real start was when our teacher
(Mr. Luc Boehme) in our home institute started talking about the MobileMapper. He said he was
interested to use this device, as part of the didactic material for the students and to get on with time.
The school didn’t want to buy this device just to have it, so our teacher asked around if somebody was
interested in writing a final thesis about this device, because the school wanted to buy the
MobileMapper when it would be used in a thesis. We reacted on his call.
The main reason for that was our interest for GPS and GIS in general. Pieter’s interest went out mostly
to GIS and the informatical part, while Jeroen’s interest mostly was about GPS receivers and the
practical part, so in fact we would complete each other in this project. When we got the thesis subject
we didn’t know about the practical part here in Finland, but we could start with reading about (mobile)
GIS, PDA’s and so on. When we heard here in Finland that it the thesis would deal with Forestry, we
needed to inform about it, but we saw no problems, because we both like being outdoors.
At last we liked the thought of helping and providing both our home institute in Ostend (Belgium) as
well as TAMK in Tampere (here in Finland) with some valuable information for the future, because
these types of devices get more and more spread around.
For Belgium our work and research had mostly to do with the MobileMapper, the use of it and the use
of ArcPad – ArcGIS, so there was a kind of manual how to use it and what the performance is. For
Finland, our thesis was also quite important, because they want to change their own Tforest database
into ArcGIS/ArcCatalog, and this in the whole of Finland. They are also looking for PDA’s to
incorporate in their forest management system. So with our information we hope they have an idea
about what to do in the future.
The use of ArcPad and ArcGIS in forest management
1.6
27
Aims of the thesis
The aim of this thesis is ambiguous. When we got the subject of our thesis back in Belgium, the main
aim was to test the PDA – GPS and the software. The reason therefore was the more upcoming use of
GPS receivers and PDA’s in GIS and surveying in general. There are already some professional
surveyors which use PDA/GPS (this mostly in city environments), so it’s a good idea to get students to
know this “new” technology, because it gets more and more spread around.
Testing the PDA and GPS consisted of different parts. The main thing to test was the GPS receiver.
This included testing the accuracy of the receiver. It’s one of the recent GPS receivers, it’s made by a
good brand and it’s equipped with WAAS/EGNOS – DGPS – post-processing possibilities, so
theoretically it shouldn’t be a problem. But as you know reality differs from theory, that’s why some
field testing is necessary. The second thing that needs to be tested is the new ESRI software: ArcPad,
which is a smaller version of ArcGIS, specially designed for the use on PDA’s (less possibilities, but
the basics remain the same). Also the link between PDA and pc (ArcPad – ArcGIS) is important. Most
important thing in the software-hardware part is the connection and the ease of use of everything.
In Finland we got more information about the thesis, because we have to finish the thesis here.
We got to know that the thesis should deal about Forestry, something that is very important in Finland
and other Scandinavian countries (the forested area in Finland is about 75%), but in Belgium people
never heard about that… so that made it also more interesting for us. Before we could start we needed
to inform about forestry.
The reason for the thesis here was the use of the PDA – GPS receiver and the use of ArcPad and
ArcGIS in forestry. Today they use some PDA’s in forestry, but none of them linked with a GPS
receiver. They only use the PDA here to correct and complete the compartment data, so for them it’s a
new idea, maybe with some options for the future… So the use of the PDA and the accuracy of the
GPS receiver (even under dense tree canopy) were an important point for them. But the most
important aim here was the use of ArcGIS. Now they are using a Finnish made forest program, named
Tforest.
Within the near future they want to change everything in the whole of Finland from the Tforest
database to ArcGIS, because this is a more universal program, so in this case we looked at the
opportunities for the conversion and the ease of use. In fact we are doing some research work before
they start the conversion; we check the possibilities of the combination PDA - GPS and ArcPad ArcGIS.
We hope that we can give some valuable information, here in Finland for their conversion to ArcGIS as
well as in Belgium for the use of the PDA - GPS and ArcPad - ArcGIS.
The use of ArcPad and ArcGIS in forest management
1.7
28
Contents of the thesis
1.7.1 Backbone
According to Longley (2005), GIS contains six parts (figure 4). These six parts will be the basic
structure of our final thesis. The main piece in a GIS today is a network. This can be the internet, an
intranet or whatever network one could imagine. This is the most fundamental part without which no
rapid communication or sharing of digital information could occur. This network connects the five other
parts and will also form the backbone of our thesis.
figure 4: the six components of a GIS
The network doesn't function only as a backbone but it's also of great importance for the positioning
system of the MobileMapper CE. This uses GPS to get an accurate absolute position. These
techniques will be discussed in chapter 3.
The second piece of the GIS anatomy is the user’s hardware. This is the device that enables the user
to interact by directly carrying out GIS operations. Traditionally this device sat on an office desktop, but
due to the introduction of mobile GIS today's user has much more freedom. We will examine these
devices and take a closer look at the MobileMapper CE from Thales Navigation in chapter two. In the
language of the network, the user's device is the client, connected trough a network to a server that
can probably handle many other clients simultaneously.
The third piece of our GIS anatomy is the software that runs locally in the user's machine. For our
thesis we use ArcGIS as server application and ArcPad as client application.
The fourth piece of the anatomy is the database, which consists of a digital representation of selected
aspects of some specific area of the Earth's surface, built to serve some problem solving or scientific
purpose. The whole process of database design won't be discussed in this thesis. We focus on the
use of ArcPad and the MobileMapper. So data collection and data quality are more of importance
here. We examine the new way of collecting data by GPS-enabled PDA and link this to some issues in
data quality and maintenance of data.
The use of ArcPad and ArcGIS in forest management
29
During the whole text, we have tried to focus on the use of mobile GIS through the theoretical study. In
chapters 8 to 10 we bring the first chapters together in order to bring the theory in practice.
During chapter 10, we reintroduce chapter 6 to see where we can improve our application and to
examine what we can say about accuracy and quality. At last we finish our final thesis with a view on
what could be possible with mobile GIS in future and a conclusion on our work with the MobileMapper
CE.
1.7.2 Overview of the chapters
In this part we want to give a little overview of the different chapters, why we describe them and the
links between the chapters.
The thesis exists of two main parts; the first it the theoretical part with necessary background
information and the second is the practical part, with the test, results, further possible developments
and finally the conclusion.
After this introduction, we start with a little description of PDA’s in general and the MobileMapper CE
specific, because this is the most important piece of hardware we use (next to the pc, the only
hardware). Also because the PDA/GPS configuration is one of the things that has to be tested.
A logical consequence of the PDA is the link with GPS, which is the second chapter. In this chapter
the system and working of GPS is explained, starting with the satellites, ground stations, going over
the electronic components and the different kinds of signals, to the accuracy, possible errors and ways
to improve the accuracy. With this background of GPS, you can understand more of the whole concept
and the use of GPS receivers in this field of work and in GIS.
The next two chapters deal with some database techniques. When the project becomes bigger and
bigger, the amount of data will get bigger and bigger, so more advanced techniques must be
incorporated in order to be able to have a well organised and maintainable database that is open for
several users at the same time. That’s why we write one chapter about distributed GIS or the use of
data on several servers and a chapter on enterprise GIS or data use within an organisation.
Without collecting data, there can’t be data on the server. To produce quality data, one has to follow
some basic rules and you have to think about how to improve the quality of you data. That’s why we
added the chapter on data collection.
The use of ArcPad and ArcGIS in forest management
30
Because the thesis deals with forestry and we didn’t know anything about it, we had to get informed
about that subject. After reading some texts, we summarised the most important things down to a
chapter about forestry. It deals with forestry in Finland, forest planning & management in general,
forest measuring, GIS and remote sensing in forestry and aerial images. This is the last chapter in the
theoretical part.
The chapter about methods and materials concerns all types of data, materials and methods we use.
This is in fact the basis for our project. A good understanding of the different data types and methods
is a key word in the setup of the fieldwork. That’s why we will describe this in detail.
The next chapter is a Field manual for ArcPad. This part is basically the description how you get the
data, maps, images and other from ArcGIS (pc) to ArcPad (PDA). In fact this is a kind of step-for-step
guideline to install everything for the practical work in the field. Also the problems we had are
described.
Another thing that has to be incorporated in our thesis is of course the results of the field tests, which
we wrote down in the following chapter. We describe the way how we work in the field, step-for-step
and also the issues we have while accomplishing the tests in the forest.
Next chapter is the one that holds all the results of our field work and summarises some issues and
good points in the work with ArcPad.
After this practical part we will tell something more about the future of mobile GIS, and in special the
possible further developments with the MobileMapper CE, such as ESRI’s Application Builder.
We will finish our final thesis with a conclusion on the whole project.
The use of ArcPad and ArcGIS in forest management
31
Chapter 2 PDA
2.1
What is a PDA
PDA is the abbreviation of ‘Personal Digital Assistant’. In fact it is a small handheld computer that
combines computer, telephone, fax and internet functions.
The development of the PDA started back in the nineties, first as a gadget but not long thereafter
business people discovered the power of the little machine. The idea is simple; easy data
management combined with telephone and internet connection.
Two kinds of PDA’s exist: those with a keyboard and those with a touch screen, mostly operated with
a stylus (pen).
The PDA is a personal, wearable organiser and is repulsing its paper pastor bit by bit. It incorporates a
maximum of functions, such as: address book, agenda and telephone list. But most of the PDA’s offer
more applications, such as: spreadsheets, memo pad, calculator, task list, clock, games,… There are
some which incorporate GPS navigation, camera or cell phone. Most of the PDA’s have connections
to wireless Internet and an email manager.
figure 5: Examples of different kind of PDA’s
The use of ArcPad and ArcGIS in forest management
32
What makes it so attractive is the possibility to exchange data between PDA and PC, for example
automatic synchronisation of memo pad, new incoming emails, ... so changes made on the PC will
automatically being updated on the PDA and the other way around. Most PDA are linked to the PC
with an USB-cable, but nowadays wireless applications are possible (like Bluetooth or Infrared).
2.2
Hardware
PDA’s are in fact very similar to desktop-pc’s; they have a processor and a memory. Input occurs by a
small keyboard or a touch screen. Output is by a small flat screen, which in some cases is very good
quality. Noteworthy is that there is no hard disk as in a normal PC, but instead the PDA uses an
alternative memory, sometimes partly combined with the RAM-memory. Of course the different parts
aren’t the standard parts you find in a desktop PC, hereby some explanation.
2.2.1 The processor
PDA-processors are built differently from desktop processors, because of mobility, durability and
lifespan are important. Thereby the processors in a PDA aren’t as fast as those in a desktop PC, top of
the line PDA have a clock speed of more than 600MHz.
2.2.2 The memory
Considering RAM-memory, the PDA has a lot less than PC’s: 64-128 MB is standard. This explains
why specific software has to be designed for these devices.
When you open a PDA, you normally won’t see a hard disk, because all data is saved on memory
chips. In most of the times it is possible to expand the memory of your PDA, by means of the so called
‘Flash’ memories. Some of the newest have a shock resistant hard disk.
2.2.3 The screen
It’s obvious that a handheld device can’t be equipped with a 17 or 19 inch screen.
The size, the number of colours they can render and the number of pixels depends on the model.
Values between 160 x 160 with 16 grey values and 640 x 240 with 65536 colours are most common.
The use of ArcPad and ArcGIS in forest management
33
2.2.4 The input
The PDA has a hardware and/or a software keyboard. During development of PDA’s, designers need
to find the right relation between simplicity of input and the space the keyboard will take up. Normally
these are simplified keyboards; no numeric or function keys.
2.3
Software
2.3.1 Operation systems
Microsoft is always trying to get the biggest share on the market, so with PDA’s it’s nothing different.
The war of the operation systems is expanded to the world of small computers. At this moment the
biggest part of the PDA’s is equipped with the ‘Symbian’ operating system. Microsoft’s ‘Windows CE’
has the other share in the operating systems.
2.3.1.1 Symbian
Symbian is the operation system with the biggest share, mostly because it hasn’t got high system
requirements so designers can make a good system without very powerful hardware. Another thing
that makes it one of the best operation systems is the compatibility with other operation systems and
PDA’s.
2.3.1.2 Windows CE
When Microsoft started producing Windows CE, a lot of companies intended to join by developing
hard- and software. The first PDA’s working with Windows CE had a lot of shortcomings; the operation
system wasn’t to the point and it was non economical hardware, it was too expensive. A lot of
companies quit the cooperation with Microsoft.
Many people consider Microsoft’s decision to copy the ‘look and feel’ of the traditional Windows
environment as the cause of the errors the system contains. That’s why Windows CE is simply to
complex for PDA’s. Microsoft’s solution was to develop two different versions of CE: ‘Handheld PC’ for
PDA’s with a keyboard and ‘Pocket PC’ for PDA’s without a keyboard.
The MobileMapper CE uses Microsoft Windows CE .NET 4.2 as operation system.
The use of ArcPad and ArcGIS in forest management
figure 6: Screenshot of the start menu of the MobileMapper CE
2.4
MobileMapper CE
The PDA’s we use in our experiments is the ‘MobileMapper CE’, made by Thales Navigation.
figure 7: Thales MobileMapper CE
Hereafter a little description of the PDA and some specifications, important for this thesis.
34
The use of ArcPad and ArcGIS in forest management
35
2.4.1 Mobile Mapping platform
The MobileMapper CE has an open-platform design operated by Microsoft’s Windows CE, which
supports Windows CE software for GIS and other mobile mapping applications.
The MobileMapper CE offers features like sub-meter GPS positioning, integrated Bluetooth wireless
technology, removable SD memory card, touch screen, field replaceable all day runtime battery and
built-in alphanumeric keypad.
figure 8: Built-in alphanumeric keypad with backlight
figure 9: Easy to use input keyboard on the touch screen
2.5
High performance GPS
The simple all-in-one design of MobileMapper CE allows you to focus on the task instead of the
configuration of the device. It has fully integrated 14-channel GPS receiver and offers real time submeter position accuracy through WAAS/EGNOS or post-processing differential corrections.
The use of ArcPad and ArcGIS in forest management
36
MobileMapper CE GPS technology provides multipath mitigation to overcome the environmental
challenges in ‘urban canyons’ and dense foliage.
2.6
Rugged and waterproof
Designed for extreme outdoor and industrial environments, the MobileMapper CE offers professionals
the rugged features they need without sacrificing size, weight or affordability.
Fully submersible in one meter of water, the MobileMapper CE is waterproof in accordance with the
IEC-529 IPX7 standard. It is also tested to withstand accidental drops on concrete from 1,5 meters
and has an operational temperature range from -10° to +60° C.
figure 10: Rugged and waterproof
The MobileMapper CE affords even the most demanding user’s peace of mind in extreme field
conditions.
2.7
High performance-to-price ratio
MobileMapper CE offers best-in-class performance for the price with user-friendly features and
dedicated support from Thales Navigation. With so many integrated features in a highly shock
resistant and waterproof device, MobileMapper CE is the next generation mobile mapping tool built to
The use of ArcPad and ArcGIS in forest management
37
survive the hazards of professional fieldwork. MobileMapper CE - the features and performance you
demand at the price you want.
2.8
Specifications
2.8.1 System features
•
Microsoft Windows CE .NET 4.2
•
ARM920T processor
•
64 MB SD RAM, 128 Flash Memory
•
Removable SD card
•
Colour display
•
Touch screen
•
Removable, rechargeable battery
•
Integrated alphanumeric keyboard
•
Rugged design and waterproof
•
Integrated Bluetooth
•
Built-in speaker and microphone
2.8.2 GPS
•
Sub-meter accuracy
•
14 parallel channels with integrated WAAS/EGNOS
•
External antenna connector
2.8.3 Software
•
GPS utilities – initialisation, setup, mission planning and configuration
•
Bluetooth manager
The use of ArcPad and ArcGIS in forest management
•
Microsoft Word, Excel, Image Viewer, WordPad, Internet Explorer, Windows Media Player,
Inbox and ActiveSync
•
38
Software Development Kit & GPS Application Programming Interface
2.8.4 Standard accessories
•
A/C adaptor
•
Removable, rechargeable lithium-ion battery
•
32 MB SD memory card
•
USB data cable
•
Stylus pens
2.8.5 GPS characteristics
•
DGPS position accuracy: sub-meter (RMS)
•
14 parallel channels (L1 code and carrier phase)
•
Integrated real-time DGPS: WAAS or EGNOS
2.8.6 User Interface
•
Full colour TFT liquid crystal display (LCD) with backlight
•
320 x 240 resolution with 262144 colours
•
Resistive touch panel
•
Keyboard with backlight: 18 buttons
•
Battery life with GPS on: 8 hours
•
Operating temperature -10° to + 60° C
•
Shock resistant: 1,5 m drop to concrete
•
Waterproof: IEC-529 IPX7 standard (depth of 1m)
The use of ArcPad and ArcGIS in forest management
39
Chapter 3 The GPS System
3.1
What is GPS?
GPS is the abbreviation of “Global Positioning System”. The system was invented and is still operated
by the Department of Defence (DoD) of the United States of America. Initially the system was
designed to enlarge the military possibilities (i.e. the exact location where a missile has to strike…),
but it didn’t take a long time to develop the system for civilian use.
3.2
Parts of the GPS System
The GPS System consists of three segments: the satellites in the sky, the control stations on earth and
the GPS receiver, operated by the user. Now we are going to take a closer look at those segments.
3.2.1 The satellites
The system consists of 27 satellites (24 active and 3 ‘spare’), also known as NAVSTAR-satellites
(Navigation by Satellite Timing and Ranging). These satellites are rotating in six different routes with
each 4 satellites around the earth. The angle between these routes and the equator is 55°.
figure 11: The routes of the satellites
The use of ArcPad and ArcGIS in forest management
40
The routes are calculated in such a way that every GPS receiver can receive can receive at least four
satellites at every moment of the day, so the positioning will be accurate. The satellites rotate at a
height of 22240 km above the earth surface at a velocity of 12950 km/h, so their circulation time is
about twelve hours (they circle around the earth twice a day)
3.2.2 The Control Stations
There are five control stations on earth (a.k.a. Ground Stations or Control Segments). These stations
are monitoring the satellites and control their ‘health’ (possible damage, electrical problems) as well as
their exact position.
There is one Master Control Station that is collecting data from the other four Ground Stations. The
Master Control Station is responsible for the entire preservation of the monitoring of the place- and
signal data. It calculates every position or error in the atomic clock, for each satellite individually,
based on the information from the Monitor Stations. It sends the signals back to Monitor Stations,
which send the corrected data to the satellite.
The Monitor Stations control the exact height, position, velocity and “health” of the rotating satellites,
they also take care that the errors in the orbital routes and the atomic clock are minimal. Occasional
errors can be evaded. These check-ups are accomplished twice a day, when the satellites are in the
visual of the Monitoring Stations.
figure 12: Position of the Monitor Stations
The use of ArcPad and ArcGIS in forest management
41
3.2.3 The Receiver
The GPS receiver is in fact a special kind of radio receiver, which has been developed to receive the
signals emitted by the satellites and to calculate the exact position with this information. The receivers
differ in size, possibilities and price (which is mostly linked to the accuracy of the receiver).
Most receivers can receive data from four or more satellites and switch between satellites during
surveying.
There is a difference between civilian and military receivers, because the latter ones use encrypted
data, so only the desired authoritative sources can use these signals.
3.3
Triangulation
The basics of the GPS system is in fact simple triangulation. The task of the GPS receiver is to
localise four or more satellites, to calculate the distance to these satellites and use this data to
calculate its own position. The difficulty here is that the triangulation is three-dimensional instead of
two-dimensional, therefore a little explanation.
3.3.1 Two-dimensional
When you know for example that you are at a distance x from place A, you can be everywhere on the
circle with radius x, so you don’t know your exact position.
Now when you know you are also at a distance y from place B, you know you have to be at the
intersection of these two circles. But there are two intersections, so you still don’t know the exact
position.
A third circle can solve the problem, because this one can eliminate one of the intersections of the first
two circles. So when you know you are at a distance z from place C, this circle will intersect at one of
the two points. Distances to other places will give even more accurate information.
The use of ArcPad and ArcGIS in forest management
42
3.3.2 Three-dimensional
Three-dimensional triangulation is initially not very different from two-dimensional, but might be a little
harder to imagine. Imagine the radiuses from the example above are not in a surface but are threedimensional, so we get three spheres instead of three circles.
When you know the distance to satellite A (i.e. 20000 km), your position will be somewhere in space
on a sphere with radius 20000 km. (Figure 13)
figure 13
Subsequently we calculate the distance to a second satellite B en we find a distance from 23000km.
Thereby we know that our position is not only on the surface of the first sphere, but also on the surface
of the sphere with centre satellite B and a radius of 23000km. The possible location is one of the
intersecting points of these two spheres. These points are located on a circle which is the profile of the
two spheres. (figure 14)
figure 14
The use of ArcPad and ArcGIS in forest management
43
When we achieve a third measurement, we know the distance z to a third satellite C (i.e. 18000km).
This sphere will intersect the circular profile of the other two spheres at two points. Now the possible
locations are limited to these two points. (figure 15)
figure 15
To know on which of the two points we are located, the earth surface can act as a fourth sphere (one
of the points is located in space, the other on the earth surface) or we can make a measurement to a
fourth satellite, which will both intersect at one of the points. More satellites will improve the position
accuracy.
3.4
Measuring distances
We talk about measuring distances from earth to the satellites that are moving in an orbital route
around the earth, but it is not that simple, and it needs some explanation.
3.4.1 Mathematical idea
The idea behind the GPS system is measuring how long it takes for a signal, emitted by the satellite,
to reach the receiver. In fact it is based on a simple equation (figure 16):
Velocity x Time = Distance
The use of ArcPad and ArcGIS in forest management
44
figure 16
In the case of the GPS system we are measuring radio signals, from which the velocity is the speed of
light, about 300000 km/s, which makes measuring time not easy.
First of all the times are very short; when a satellite is above the receiver, it would take approximately
only 0,06 seconds, which will make ultra precise time measuring necessary. The satellite as well as
the receiver need a clock that can be synchronised on the nanosecond. An error of one thousand of a
second causes an error of almost 200 meters.
To achieve this level of accuracy both the receiver and the satellite should be equipped with an atomic
clock. But only the satellites are equipped with atomic clocks, not the receivers, because it would
make the receivers unaffordable. The GPS system uses a normal quartz-clock but with a smart
system that is very accurate too.
We can represent this idea in a simple way; imagine we have very precise clocks at our disposal.
Now both the satellite and the receiver can send out the same signal at exactly the same time. When
the signal should be able to reach us here on earth, we would hear two versions of that signal, they
wouldn’t sound simultaneous. The signal from the satellite would have a little delay, because it has to
travel the distance to earth.
When we want to see the delay of the signal from the satellite, we can delay the signal emitted by the
receiver so the signals would sound simultaneous. Now we know that then delay is equal to the time
the signal needs to reach us from out of space.
When we multiply this time by the velocity of light (300000 km/s), we have the distance from the
satellite to the earth surface. This is the basic explanation of how it works.
The use of ArcPad and ArcGIS in forest management
45
We can abstract this in a few lines:
•
The distance to the satellite is determined by measuring how long it takes for a radio signal to
reach the earth.
•
To make this measurement, we assume that both satellite and receiver generate the same
signal at exactly the same moment.
•
By comparing the delay of the signal emitted by the satellite, we can calculate how long it
takes to reach us.
•
When we multiply this by the speed of light we get the exact distance.
The signal that is used by the GPS system is not a simple radio signal, but a complicated signal which
is called the “Pseudo Random Code”, explained in the next part.
3.5
Pseudo Random Code
The Pseudo Random Code is a fundamental part of the GPS system. Fiscally spoken it is just a very
complicated digital code, in fact an order of ‘on’ and ‘off’ signals, also known as ‘0’ and ‘1’ signals.
The signal is so complicated that it resembles electrical noise, hence the name “Pseudo Random”.
There are a few different reasons for this complexity. First of all, the complexity of the pattern prevents
that accidentally another signal is picked up. The complexity of the pattern is that high that it’s almost
impossible that there exists a similar signal.
Every satellite has also its own Pseudo Random Code, so the receiver wouldn’t accidentally pick up a
signal from another satellite, and all satellites can use the same frequency without disturbing each
other.
But there is another reason for the complexity of the Pseudo Random Code, and that is to make the
GPS system economical. These codes make it possible to amplify the signals, whereby it stays
possible to make our GPS receivers quite compact, so we don’t need big antennas to receive the
signals.
We forgot one thing, we acknowledged that both the satellite and the receiver start sending out their
codes at exactly the same moment, but how everything is synchronised?
The use of ArcPad and ArcGIS in forest management
3.6
46
GPS signals in detail
3.6.1 Carrier signals
Each satellite has an oscillator and emits carrier signals in two frequencies, named L1 and L2.
On the carrier signal L1 there is a user code (C/A code) and a precision code (P-code) modulated,
together with information about navigation. The carrier signal L2 contains the P-code and further
information concerning synchronisation, route data and atmospherical corrections.
figure 17: Summary of the GPS signals
3.6.2 Pseudo Random Codes
The first Pseudo Random Code is called the C/A-code (Course/Acquisition) and is modulated on the
L1 code, and is the base for civilian GPS navigation. A low-frequent signal is added to the L1 code,
and gives information about the route of the satellite, the clock corrections en the system status of the
satellite.
The second Pseudo Random Code is called the P-code (Precise) and is modulated on the L1 as well
as on the L2. This code is destined for military use en can be converted in a secret code en is than
called Y-code, so possible enemies can’t decode the signal.
The use of ArcPad and ArcGIS in forest management
47
figure 18: Frequencies and parameters of the signals
3.6.3 Code-Phase GPS vs. Carrier-Phase GPS
These terms refer to the specific signal we use to measure time. By making use of the GPS Carrier
Signal frequency we can strongly improve the accuracy of the GPS system. The idea is simple, but it
needs some more explanation.
figure 19: Code frequency vs. Carrier frequency
As we described above, the GPS system calculates the time it takes for the signal (Pseudo Random
Code) to reach the earth. Therefore the signal, emitted by the receiver is being retarded until both
signals are synchronised. The time of delay equals the time the signal needs to cover the distance.
figure 20: Delay of the signal
The problem is that the bits (different cycles) from the Pseudo Random Code are very broad, even if
they are synchronised and that there is a certain space. Let us look at the next figure:
The use of ArcPad and ArcGIS in forest management
48
figure 21: Match of the signals
When you compare both signals it seems that they are analogous; when signal A is ‘1’ signal B is ‘1’
and when signal A is ‘0’ signal B is also ‘0’. But as you can see both signals are not perfectly in phase,
notice signal B is slightly in front of signal B. In fact you can move signal A almost half a cycle and the
two signals will still correspond. (see figure 21 above)
This is the problem with Code-Phase GPS. It compares the Pseudo Random Codes, which have as
width of the cycle almost one microsecond. When signals travel at the speed of light, it will conduct to
an error of about 300m, which is unacceptable.
3.6.4 3.6.4 A higher frequency
The receivers start receiving and recognizing the Pseudo Random Code and commute to
measurements based on the carrier wave for this Pseudo Random Code. The frequency of the carrier
wave is much higher so these waves are much closer together subsequently it is far more accurate
(see figure 22).
figure 22: A higher frequency of the carrier wave
The use of ArcPad and ArcGIS in forest management
49
We can compare the design to a normal radio receiver. The music we hear is a modulation in the
carrier frequency. GPS works similar, the Pseudo Random Code has a bit rate of about 1 MHz, but the
carrier frequency has a cycle of more than one GHz (Gigahertz), which is more than thousand times
as fast. By taking the velocity of light, the GPS signal has a wavelength of about twenty centimetres so
the carrier frequency can serve as a much more accurate referential than the Pseudo Random Code
itself.
3.6.5 Receiving the right wave
In essence this method ensures that the exact amount of carrier wave cycles between the satellite and
the receiver are being counted. But the carrier frequency is very hard to count because it is a very
uniform signal, every signal resembles another.
On the other hand, the Pseudo Random Code is made very complex to make it easier to know in
which cycle you are, but it is less accurate. So the trick with the Carrier-Phase GPS (most accurate) is
to use the Code-Phase techniques to get close and then we only need to consider a few wavelengths
of the carrier frequency to see what the end of our measurement is.
3.7
Exact time measurement
As mentioned before, exact time measurement is important. In a satellite we get this by the very
accurate atomic clock, but in the receiver it is a simple quartz clock. Some explanation is necessary.
When the clocks in the receivers were accurate, all the measured distances would intersect in one
point. With non-accurate clocks there would be a fault in the measuring, it wouldn’t intersect in one
point when we handed out a fourth measurement (as a control). The receiver’s computer will notice
the clock isn’t synchronised with universal time.
Because every small aberration from the universal time would influence our measurements, the
receiver will look for a correction factor. This correction will set the atomic clock back to universal time,
and so you have the accuracy of an atomic clock in the palm of your hand.
As a result of this every decent GPS receiver needs at least four channels to hand out four
measurements (distance to at least four satellites) at one time. With the Pseudo Random Code as a
fixed time signal and this little trick to perfectly synchronise the receiver with universal time, we have
every factor to calculate the exact distance to the satellite in space.
In this case we consider that we know the exact position of these satellites, but how do we know
where these satellites are, rotating around the earth.
The use of ArcPad and ArcGIS in forest management
3.8
50
Exact position of the satellites
The satellites circle at a height of about 22240 km above the earth surface, and this is even an
advantage, because there is no atmosphere whereby the satellite will describe a simple mathematical
route.
figure 23: Satellite routes projected on the earth surface
The satellites are launched into exact position by the Department Of Defence (USA).
Every GPS receiver has a logbook containing the perfect routes of the satellites, so the receiver knows
where every satellite is at any moment.
To make everything accurate there is a permanent monitoring of the satellites by the Department Of
Defence, which contains, exact location, height and velocity. The errors which are corrected are called
ephemerical errors, because they influence the route of the satellite (or ephemeris) and are caused by
gravitational attraction from both moon and sun and by pressure from solar radiation on the satellites.
When the correction is made, the information is send back to the satellite which will take notice and
use it in the time signals it sends.
The use of ArcPad and ArcGIS in forest management
3.9
51
Possible errors in GPS signals
Despite all the electronics and solutions to improve the accuracy of the GPS system, there are some
factors which influence the signals and thus make the system less accurate. Here a little summary of
possible errors and their solutions:
•
One of the basic information we took for granted during this whole explanation, is in fact not
fully true. We told that we calculate the distance to the satellite by multiplying the time of
travelling by the velocity of light, but this velocity is only constant in a vacuum.
GPS signals pass through the loaded particles of the ionosphere and through the vapour
particles in the troposphere and will hereby be slowed down. This causes the same sort of
aberration as incorrect clocks.
There are a few ways to decrease these errors. We can predict what the average retardation
would be on a given day. Therefore the GPS system uses a built-in model and so part of the
error will be corrected. But everybody knows that atmospheric conditions are rarely equal.
Another way of correcting these atmosphere related errors is to compare the relative velocity
of two different signals. This “Dual Frequency” measurement is quite complicated and only
possible with advanced receivers. Further explanation about this would lead us too far in the
subject of electronics.
•
The problems for GPS signals don’t stop when they reach the earth surface.
Those signals do pass clouds, glass and plastic, but are reflected by massive objects such as
large buildings and mountains. Because of this reflection the signal will travel a longer way
before it reaches the receiver hereby causing an error.
figure 24: Multipath error
The use of ArcPad and ArcGIS in forest management
52
These kinds of errors are called “Signal Multipath Errors”. Good receivers use sophisticated
techniques to minimalise this problem, but again this is more related to electronics than the
surveying applications of the GPS system.
•
The satellites are sophisticated and use very exact atomic clocks, but miniscule discrepations
can still occur, which is translated into very little errors in time measuring.
•
Although the positions of the satellites are constantly being controlled, they cannot be
monitored every second. So little errors in the route of the satellite can occur (called epimeric
errors).
•
Most of the time there are more satellites ‘visible’ to the receiver than strictly necessary to
calculate the position. The receiver picks out the best signals or uses more signals for
correction and so a more accurate positioning. Open terrains are best; forests, densely built
and mountainous areas can decrease the ‘visibility’. Also under dense tree canopy there may
be some problems, which could give some problems in our case (use of GPS in forestry).
Electrical interference can also cause some errors in positioning; the receiver won’t work
indoors, under ground level or under water.
•
Also the geometry of the satellites takes a part. This resembles the relative position of the
satellites at a certain moment (positions of the satellites in relation to each other and the
receiver).
Point Dilution of Precision, or PDOP, is a general indicator of the accuracy of a GPS
measurement as determined by satellite geometry. Low PDOP values are reported by a
receiver when satellites are widely spaced in the sky above the user. The best possible
satellite geometry, one that gives the lowest PDOP, can be found when one satellite is directly
overhead and the remaining three satellites are equally spaced around the horizon. High
PDOP’s occur when satellites are close together or when they form a line in the sky. Only in
very rare cases are satellites arranged in a configuration that prevents the receiver from
obtaining a position.
Most of these problems can be decreased by using “Differential Global Positioning System”.
The use of ArcPad and ArcGIS in forest management
53
3.10 Differential Global Positioning System
Differential Global Positioning System (DGPS) works by placing a high-performing GPS receiver
(referential station) in an exactly known place. Because the receiver knows it exact position, it is able
to define the errors in the signals emitted by the satellites.
This is accomplished by measuring the distances to the satellite by means of the received signals and
comparing these to the real actual measurements, calculated out of the known position of the satellite
and the referential station.
The difference between the measured and the calculated distance is the global error. This information
concerning the error is encoded in a correction message and is sent to the GPS user. The degree of
accuracy is obtained by the quality of the receiver and is less than half a meter.
Accuracy with DGPS is estimated about 3-5 meters.
figure 25: Basic sketch of the DGPS system
The use of ArcPad and ArcGIS in forest management
54
3.10.1 Referential stations
The referential stations know the exact position of their antenna (obtained from standard surveying)
and they calculate the distance to the satellite so they know what the measured distance should be. It
measures its distance to the satellite by making use of the received signals, just as a normal receiver
does. Now the measured distance is subtracted from the calculated (= exact) distance, and the result
is the error on this distance. This information is sent to the user and not to the satellite.
In fact it is a kind of real-time correction of the signals.
3.10.2 Radio transmitter
The radio transmitter is an amplifier that is connected to the antenna. The modulated signal is
amplified and is sent to the antenna. The transmitter has an output of 250-1000 Watt and makes use
of the 300 KHz frequency. The amplified signal is now sent to all DGPS receivers via the antenna, for
‘real-time’ position corrections.
3.10.3 DGPS receivers
The DGPS receiver decodes the signal received from the referential station. This information is used
in the positioning to make a more accurate positioning.
Also post-processing differential corrections are possible and are even more accurate.
Disadvantages of post-processing are: no real time corrections, takes more work and time
3.11 Possible GPS errors
Here is a small list with some possible GPS errors, and the differences between normal standard GPS
receivers and those with Deferential GPS. You can clearly see that there is a big improvement in
accuracy between the two, only the multipath errors can’t be corrected by DGPS.
Maximum errors (meter)
Satellite Clock
Errors in the route
Ionosphere
Troposphere
Noise
Multipath errors
Standard GPS
Differential GPS
1.5
2.5
5.0
0.5
0.3
0.6
0
0
0.4
0.2
0.3
0.6
figure 26: Maximum errors for Standard GPS and DGPS
The use of ArcPad and ArcGIS in forest management
55
3.12 WAAS/EGNOS
Receivers equipped with WAAS/EGNOS will make even more accurate measurements possible.
WAAS is the abbreviation of ‘Wide Area Augmentation System’ (USA) and EGNOS is ‘European
Geostationary Navigation Overlay System’ (Europe). Both are based on a network of ground stations
(with an exact known location) and satellites. Hereby most of the errors due to the atmosphere are
eliminated. It doesn’t need any form of subscription or extra receivers.
You can compare this system with the differential GPS system, but here the corrections of the ground
stations are first sent to the geostationary satellites, which send the corrected information to the user
on earth. Each receiver which supports WAAS/EGNOS can make use of these corrections. Accuracy
with WAAS/EGNOS is less than 3 meters.
figure 27: WAAS system
The use of ArcPad and ArcGIS in forest management
56
Chapter 4 A new way of working with GIS
Until recently, the only way we could use GIS to solve a problem was to assemble all of the necessary
pieces in one place, on a user's desktop. But recent advances now allow all of the parts – the data and
the software – to be accessed remotely, and allow the user to move away from the desktop and hence
to apply GIS anywhere. This is called distributed GIS (DGIS). This chapter describes the current
capabilities in distributed GIS, the place of mobile GIS and what distributed GIS has to do with our
project.
4.1
Distributed GIS
We have already explained the six components of a GIS as its hardware, software, data, users,
procedures and network. In this paragraph, we describe how an extended network has enabled a
vision of distributed GIS, in which the component parts no longer are located in the same place. The
new technologies in information technology, together with a more and more mobile society are moving
us to the point where we can operate and conduct a GIS project not only from our desktop, but
anywhere we choose to be, using data anywhere on the network and using software, provided by sites
on the network or installed on a (mobile) device. So, in distributed GIS, the six components may be at
different locations. This poses a few challenging questions, such as one about locations. In the next
paragraph, we examine this “location problem.”
The use of ArcPad and ArcGIS in forest management
57
USER1
data for project
software
hardware
USER4
SERVER2
data
datawarehouse
management
2
SERVER
system
datawarehouse
websoftware
USER3
USER2
ArcGIS
PC
&
web access
intranet
figure 28: Structure of a distributed GIS
4.2
Relativity of locations in distributed GIS
In the previous paragraph we mentioned that the core of distributed GIS is the fact that all of the
components of a DGIS can be at different locations. Partly, this was already possible before the
introduction of mobile GIS, but mobile GIS strengthened the idea of the different locations even more
by its mobility. Let us take a closer look at an example of the locations:
•
the location of the user and the interface from which the user is operating his GIS, let us call it
U;
•
the location of the data being accessed by the user, denoted by D;
•
the location where the data are processed, denoted by P;
•
and at last the area that is the focus of the GIS project, called A.
The use of ArcPad and ArcGIS in forest management
58
User (e.g.
with his
PDA in the
Processing
network
Area of
focus
unit
Data
ware
house
figure 29: Scheme of the different locations in DGIS
In traditional GIS, U, D and P are the same location and are almost never the same as location A. By
the introduction of fast network connections it isn't necessary any more that U, D and P, D are in the
same location. It's even possible that D hasn't one central location or even a distributed static location.
This is the point where mobile GIS interferes. By using mobile devices like handhelds, tablet pc's or
cell phones, that also can store data, the data can be distributed over a wide area without any static
location. Part of the GIS might be held in the user's hand, stuffed in a backpack, or even mounted on a
vehicle. The place of the data will be maintained by a central server that holds all the connections to
certain datasets. This means that, as never before, in distributed GIS, the user’s location and the focus
area can be the same.
Mobile GIS not only acts as a distributed data warehouse, it also makes the processing unit (P) being
distributed. The progression in mobile devices gives PDA’s faster and faster processors. This enables
the user to do also some simple queries and statistical calculations in the field. So distributed GIS
reinforces the notion that today's computer is not simply the device on the desk, but something more
extended and much more mobile. Computing becomes ubiquitous or location independent. We can
state that distributed GIS is one of the technologies that brings GIS into the fieldworker’s hand.
The use of ArcPad and ArcGIS in forest management
4.3
59
Benefits of distributed GIS
Distributed GIS has many potential benefits, these are discussed in the following paragraphs. First we
will explain the feasibility of distributing data. Afterwards, we discuss the mobile technologies within a
distributed GIS and the benefits for the user particularly within area A. In the following text, we try to
distinguish the vision of distributed GIS and what is practical at this time.
4.3.1 Data exchange
In most cases, users use a homogeneous GIS model. In the simplest case of software form, one
vendor is used on one operating system (OS). This means that also a certain software-specific file
format is used. On first sight, there’s nothing wrong with this, but functionality is restricted to that
specific system. The internal data standard is difficult to share with other users, who use other
software or another OS. To share your data, human processing and the right software will be needed.
This is costly and time consuming as well as open to errors. A homogeneous approach can just be
used as long as one doesn’t have to interact with non-aligned systems.
In an attempt to diminish the restrictions of a homogeneous GIS model, distributed GIS or
heterogeneous GIS is introduced. The terms distributed and heterogeneous not only refer to the
location problem we mentioned above but also to a computing environment in which a variety of
software and hardware co-exist and interact. In such an environment, users are not restricted to
vendor systems or formats. This is interoperable GIS. The major benefit is the ability to distribute and
combine separate data to produce new datasets, independent of the original format, not only to
decrease conversion cost within an organisation but also to enable multidisciplinary teams with
members from several organisations to work together without dependency on one software package.
The use of ArcPad and ArcGIS in forest management
60
4.3.2 Distributing the data
Since the popularization in the early 1990s, the internet has had a tremendous influence on the
accessibility of GIS data and on the ability to share data. Many websites provide GIS data, for free, for
sale or for temporary use. The vision of distributed GIS goes beyond the access and retrieval of
remotely stored data. In the world of distributed GIS, users can search for data, on their own servers,
on remote servers and examine their fitness for use. To get these search and examination commands
done from our PDA, three concepts are very important:
•
Object-level metadata (OLM) describe the contents of a single dataset. OLM are needed to
search through the archives. It's comparable to a library's catalogue, where books are
organised by author, title and subject. This makes it easy to find a particular book. When we
find our dataset, the OLM will help us to determine whether the data could fit our requirements
- like resolution and quality - or not, in other words, to examine the fitness for use. When we
select a book on a certain subject, by a certain author, we like to know if we understand the
language in which it is written. This is the third goal of OLM. It provides the information needed
to handle the dataset. This may include format, compatible software, location, volume. Finally,
OLM provides information on the dataset's contents. In case of remotely sensed images, we
talk about percentage of cloud or shadowing. So, object-level metadata are formal
descriptions of datasets that satisfy many different requirements.
•
Geolibraries are the digital technology to support search and discovery. We can do searches,
but we can also reorder the catalogue by any property of the OLM, add our own collections.
The sorting by location or data are for example of great use for GIS users. Longley says: “The
term geolibrary has been coined to describe digital libraries that can be searched for
information about any user-defined geographic location”.
•
Collection-level metadata (CLM) are metadata that describe entire collections of datasets,
rather than individual datasets as OLM do. Many geolibraries exist on the internet, but this
abundance of accessible data presents a problem. How does the user know which collection
to search for a given dataset? So, the CLM defines the information needed to make an
intelligent choice, based on the information of each collection’s contents. This seems all very
logical, but CLM is still largely unorganized. A possible solution, according to Longley, could
be to develop internet wide search engines to discover geographic datasets directly on the
level of OLM.
The use of ArcPad and ArcGIS in forest management
61
This collection of metadata is of capital importance for a smooth operating distributed GIS. Without
good metadata, a user cannot find the right dataset to serve his goals. The metadata helps users
understand the data. It provides consistency in terminology, focuses on the key elements of data and
helps to determine the fitness of use. Metadata enables people to use data in an ecological way by
protecting from investment in data as well. The metadata sets the stage for a data re-use and update
and provides documentation of data sources and quality. And, last but for surely not least, it cuts down
the overall costs an organisation has for maintaining and providing their data.
4.3.3 Location-based services
One of the four big trends in software is location-based applications4.
In this age of a significant telecommunications competition, mobile computing world continuously
seeks new and innovative ways to create differentiation and increase profits. One of the best ways to
do accomplish this is through the delivery of personalised services. One of the most powerful ways to
personalise mobile services is based on location. We will discuss these Location Based Services
(LBS), but we will first discuss the basis of LBS - location technology.
Traditional computing devices, such as desktops or laptops, have no way of knowing where they are,
and their functions are not changed when they are moved. But increasingly, the essential information
on a device’s location is available, and is used for a wide variety of purposes.
One of the most obvious technologies behind LBS is positioning, with the most widely recognized
system being the Global Positioning System (GPS). There are however, other means of positioning in
addition to GPS. These other technologies are network based positioning and typically rely on various
means of triangulation of the signal from cell sites serving a mobile phone. In addition, the serving cell
site can be used as a fix for location of the user.
figure 30: Positioning by mobile antennas5
4
Bill Gates, Wireless 2000 Conference, March 2000
The use of ArcPad and ArcGIS in forest management
62
One of the strongest motives driving this process is emergency response. A large and growing portion
of emergency calls come from cell phones, and while the location of each land-time is likely to be
recorded in a database available to emergency responder, in a significant proportion of cases the user
of a cell phone is unable to report his or her current location with sufficient accuracy to enable effective
response. One solution to this problem is to install a GPS in the vehicle that communicates its position
to the dispatcher. The Onstar system is one such system. OnStar's in-vehicle safety, security, and
information services use GPS and cellular technology to link the vehicle and driver to the Onstar
Centre. At the Onstar Centre, advisors offer real-time, personalized help 24 hours a day, 365 days a
year. In the event of a moderate to severe frontal or side-impact crash, data is transmitted from the
affected sensors to the SDM. Regardless of whether the air bags deploy, the SDM transmits crash
information to the vehicle's Onstar module. Within seconds of a moderate to severe crash, the Onstar
module will send a message to the Onstar Call Centre through a cellular connection, informing the
advisor that a crash has occurred. A voice connection between the advisor and the vehicle occupants
is established. The advisor can conference then in 911 dispatch, which determines if emergency
services are necessary. If there is no response from the occupants, the advisor can provide the
emergency dispatcher with the crash information from the SDM that reveals the severity of the crash.
The dispatcher can identify what emergency services may be appropriate. Using the Global
Positioning System (GPS) satellite, Onstar advisors are able to tell emergency workers the location of
the vehicle.
figure 31: Onstar system
There are many other examples of LBS that take advantage of location enabled cell phones, e.g.
yellow page services, trip planning or even games like Undercover.
5
http://www.evaluationengineering.com/archive/articles/e10-wire1.jpg
The use of ArcPad and ArcGIS in forest management
4.4
63
Back to our mobile GIS
Computing has become so much part of our lives that for many people, life would be difficult without it.
We use it to communicate, to shop, to work, to entertain ourselves. In the early days, the only place
one could compute was in a computing centre, within a few meters of the central processor.
Computers have been extended to the office is the 1970s and to the home in the 1990s. The portable
computers opened the possibility of computing anywhere in the house, in the garden, on the beach, in
the park etc. Wireless communications now allow also broadband connections anywhere near the socalled “hot-spots.” The range of these mobile devices is also multiplying rapidly, from a heavy laptop to
a PDA, tablet pc or even a cell phone. Within a few years, we might see the convergence of these
devices in one powerful mobile personal device.
For our project, we use a MobileMapper CE from Thales as mobile computing device. The connection
between our device and the main database to participate in the distributed network, is made hardwired. This means we use a cable to load data into the memory of our PDA. We don’t take advantage
of the wireless communications or Bluetooth6 because of the wide area of usage. Forests in Finland
take approximately 70% of the area, so our GIS must be used in this whole area and that would ask
for too much technology to get a full coverage of the area. If many people are working in the same
area, let’s say at about 300 m round a central communication post, e.g. a car, it could be possible and
might be useful to setup a wireless local area network (WLAN) that holds all the necessary data to do
the fieldwork. This makes it possible to take more data with you than the memory of the PDA accepts.
If there’s no way of using a WLAN, this connection to the laptop, holding all the necessary data, can
also be made hard-wired.
4.5
When does a distributed GIS make sense?
The continued advances in remote sensing, mapping and geospatial technologies, including an
increasing variety of data acquisition capabilities and low cost and more powerful computing capacity,
coupled with the development of GIS technology, have increased the demand for geographic
information. As the importance of geographic information in solving complex social, environmental,
and economic issues around the globe is growing, the establishment of a DIGS to support the sharing
and use of this data locally, nationally and internationally makes increasing sense.
6
Link, info over wat bluetooth is
The use of ArcPad and ArcGIS in forest management
64
Without a coherent and consistent DGIS, and spatial data infrastructure, we lose opportunities and
create more efficiency in the use of geographic information to solve problems. Furthermore, as spatial
technologies are increasingly being used by diverse organisations in developed and developing
countries, a number of obstacles add up to a geographic information bottleneck. Lack of institutional
co-ordination, insufficient flow of information, overlapping of initiatives, duplication of field activities and
results and poor management of resources are some of the most pressing problems. In addition, there
can’t be a lack of standardised metadata system and poor documentation on who is doing what and
the types of available information. This could have a double negative effect. On the one hand,
potential data and information users have difficulties finding or having access to the needed relevant
information and, on the other hand, information suppliers do not know what they have which in turn
prevents better organisation of information and enhanced value of the information.
It is important to take into account that the longer the harmonisation of stand-alone databases is
delayed, the more difficult it will be to make them interoperable. Costs for integrating stand-alone
systems into a distributed GIS are increasing exponentially with time and the number of data sets. This
suggests that a co-ordinated initiative should be considered as soon as possible.
4.6
Prospects
Distributed GIS offers enormous advantages in reducing duplication of effort, allowing users to access
remotely located data and services through simple devices, and providing ways of combining
information gathered through the senses with information provided from digital sources. Many issues
continue to impede progress like complications resulting from the difficulties of interacting with devices
in the field, limitations placed on communication bandwidth and reliability and limitations inherent in
battery technology. Perhaps this time, more problematic than any of these is the difficulty of imagining
the full potential of distributed GIS. We are used to associating GIS with desktop, and conscious that
we have not fully exploited its potential.
The use of ArcPad and ArcGIS in forest management
65
Chapter 5 Enterprise GIS
5.1
Introduction
In business and government agencies, GIS is often developed with diverse departments relying on a
mix of software and information systems. Each department uses its individual system to increase
efficiency, but sharing data and applications across the enterprise is nearly impossible. The resultant
redundancy prevents local governments and industry from realising business goals, leveraging
investment in data and technology, and controlling costs.
5.2
What is an Enterprise GIS?
Enterprise GIS (EGIS) uses a shared central geodatabase that allows integration and dynamic
updating of multiple GIS data sources without time-consuming compatibility and translation issues. It is
based on IT standards and web services so it also enables non-GIS applications and systems to easily
access GIS functionality, and GIS applications to easily access the functionality of mainstream
business applications and IT systems. With an enterprise GIS, users of spatial data spend more time
on the analytical capabilities and business functions of a GIS and less time searching for, compiling,
and integrating the data they require.
An EGIS delivers many benefits, increasing worker productivity and capacity to deliver goods and
services to customers:
•
support for the best tools for any job - each department can use its preferred software and
data types, while working from a shared enterprise database;
•
increasing productivity - eliminate the time wasted to convert or translate data and eliminate
out-of-sync data or errors;
•
increasing data accessibility - when data is stored in an enterprise database, all users and key
decision makers have quick access to the most accurate and up-to-date data;
•
improving communication among departments - an enterprise system requires that all
independent systems communicate quickly and effectively, regardless of data format;
•
increasing data security - by storing spatial data in a central database, your organization will
maintain secure, high-quality data;
The use of ArcPad and ArcGIS in forest management
•
enhance speed and reliability;
•
enable easy web-based access for data sharing and community participation.
5.3
66
Aspects of an Enterprise GIS
The goal of this paragraph is to provide a comprehensive synthesis of the current knowledge on EGIS.
First we set out a conceptual framework for an EGIS and then we describe a five-step process for
implementing an EGIS.
5.3.1 Conceptual framework
To develop a good conceptual framework, we must consider some main aspects:
•
technical needs: what’s the goal of our EGIS? How many users will use the EGIS? What
software and hardware will we use;
•
business needs: what goal will our EGIS serve;
•
current needs: what are we going to do with the GIS today and in near future;
•
future needs: what’s on the idea list in the development of the EGIS;
•
emerging technologies: you have to take full advantage of the emerging technologies in order
to build a modern and future resistant EGIS.
The three concepts we’re using are the role of the stakeholders, a complete geospatial data cycle and
the design of data warehouses.
5.3.1.1 The role of the stakeholders
The design of an EGIS begins with understanding the needs of the different participants or
stakeholders.
Data providers need consistent standards and effective tools to prepare, organize, and document their
data, as well as to ensure that the data will be responsibly managed. So they receive and review the
data, rename them according to a chosen standard, add metadata and themes and then, after
reviewing again, transfer them to the data warehouse where data managers organise the data in the
data warehouse.
The use of ArcPad and ArcGIS in forest management
67
Data managers need consistent workflow procedures that ensure efficient, standardised means to
manage and deliver data. GIS users are professionals and analysts who need consistent mechanisms
to locate and access well-documented and reliable data to recombine them in their work.
Customers must benefit from timely and reliable service.
GIS stakeholders share common needs, such as data quality standards, data documentation
(metadata), consistent data formats, and data archiving. However, each stakeholder has unique goals
and requirements, in terms of infrastructure (hardware/software) and data, as well as unique ideas
about the value of enterprise GIS to his or her goals and willingness to participate in data sharing.
Successful EGIS design means facilitating every stakeholder’s task in the geospatial data cycle.
5.3.1.2 The geospatial data cycle
A complete, or unbroken, geospatial data cycle involves flows of data from data source to database,
from database to applications, and, if modifications have been made, from applications back to the
database, with necessary steps to ensure that data are complete, secure, documented, and
accessible. These steps include some data operations: formatting, quality assurance, documentation,
cataloguing, tracking, backup, delivery, and updating.
figure 32: geospatial data cycle
The use of ArcPad and ArcGIS in forest management
68
This circle is formed by three main aspects: source, database and applications. Every aspect has its
own responsibilities and its own stakeholders:
•
source: stewardship is the generator of the responsibility. This includes quality and assurance
of the up-to-date data, good data documentation by a set of metadata;
•
database: data management means ensuring organisation, access, delivery and monitoring of
changes in the up-dating process. This is mostly the domain of IT specialists and data
managers;
•
applications: here we can find most of the efforts in GIS. This could be caused by the instant
solving of problems, leading to a wide variety of specialised application.
In this cycle, the importance of quality control cannot be overstated. This involves standardised
procedures for ensuring data needs and for communication about quality. A useful way to do this is
metadata or “data about the data”. Metadata document essential characteristics of data, including
source, content, geospatial extent, format, quality and means for access.
5.3.1.3 Data warehouse design
The role of a spatial data warehouse within an EGIS is to provide a clean structure for the
management of geospatial data and consists of three main steps: staging, storage, and delivery. The
three steps that define data flow within the context of the work performed are as follows:
•
staging involves receipt of data and preparation for placement in the data warehouse;
•
storage involves the actual housing of data in the data warehouse; and
•
delivery involves distribution of warehoused data to GIS users.
A spatial data warehouse can provide access to shared data necessary to perform the day-to-day
operations and research and development (R&D) activities.
figure 33: GIS data flow
The use of ArcPad and ArcGIS in forest management
69
When using ESRI-software, as in our project, the data warehouse is normally an ArcSDE driven
database. The software, ArcSDE has following tasks:
•
managing large GIS databases that are stored physically on the servers;
•
holding the links of the distributed data parts together.
When we combine this with for example the ArcIMS (Internet Mapping Service) then the following
tasks are added tot the data warehouse:
•
internet delivery of geographic information;
•
hosting central GIS Web portals for information discovery and use;
•
centrally hosting GIS functions that are accessed by many users in an organization;
•
back-office processing of enterprise GIS databases;
•
internet delivery of comprehensive GIS functionality.
Looking at the tasks, we can summarize the task of the data warehouse as delivering data to anyone
who has access to the data.
5.3.2 Five-step design process
Jack Dangermond7, CEO of ESRI, Inc., (2002) proposes the following five elements for the success of
enterprise GIS:
•
attain management support;
•
develop a plan;
•
be customer focused;
•
ensure in-house “ownership” for the process;
•
build a “team of two” of technical expertise and management support to make enterprise GIS
a reality.
7
Keating, 2003, Challenges for Enterprise GIS
The use of ArcPad and ArcGIS in forest management
70
According to Dangermond (2002), the plan should address five aspects:
•
definition and design specifications for enterprise GIS;
•
description of internal and external databases being managed;
•
plan for conceptual applications and database architecture;
•
system architecture, including hardware, software, and applications;
•
implementation plan. The scope of the implementation plan encompasses tasks, methods,
and activities; a schedule; funding sources; and organizational responsibilities. While the
details are outside the scope of this article, this outline provides the basis for the development
of the geospatial information management plan.
5.4
Why Enterprise GIS
There is a trend towards the integration of information through internet and intranet. This is a
challenge for further development of local GIS teams into true enterprise resources. The use of
geographical data is increasing beyond the capabilities of individual departments and the value of
geographical data is increasingly being recognized. So there’s a need to leave the small projectoriented GIS applications and let GIS teams work together across several departments, e.g. to
develop a good regional transportation system. It focuses on the consistency, integration and
extensiveness of agency-wide applications of GIS. By using an EGIS, the ability to access shared GIS
resources, including data, analysis software, and computing capacity, can greatly increase efficiency
and flexibility to complete a wide variety of GIS tasks. Enterprise design can enable a GIS user to
access clean, consistent and properly documented spatial data from institutional servers 24 hours a
day without the assistance of data specialists. Such resource sharing, with access by multiple users
with multiple access rules, is surely the number one among the advantages of an EGIS.
An EGIS also diminishes in a very important way the costs of data exchange. When ad hoc projectoriented systems are used, every system needs its own data set, made by collecting, copying and
exporting data. This is a time and money consuming process that isn’t free from errors at all. So by
setting up an EGIS, where an unbroken data cycle is of great importance, an organisation can
diminish the setup cost of a system and spend this money on e.g. quality control and quality
assurance.
The use of ArcPad and ArcGIS in forest management
71
figure 34: structure of an EGIS, based on ESRI-software8
5.5
Enterprise GIS & the mobile user
Many mobile users welcome mobile computing devices and see the value of having such power,
performance and capacity. At the same time, some software solution vendors focus on the form factor
of such devices and loose sight of the true mobile requirements in the field and the problems involved
with it. It's crucial to step back and evaluate mobile solutions from a field user's point of view, to better
understand what exactly the pain points are. Vendors who create the mobile software solutions need
to first focus on what is needed by an enterprise's mobile and field users. Understanding those needs
is paramount to providing solutions that will be adopted in the mobile market. Technology should be
seen as an enabler not as the main driver of the end solution. This doesn't mean technology cannot
drive some parts of the process. Without innovative technology vendors the industry would not have
many of the mobile solutions it has today. But we need to be careful not to lose sight of what problems
we are trying to solve in this space. Some of the high level requirements for mobile users are:
•
software and hardware tools that enable jobs to be done better and faster;
•
access to corporate information when needed;
•
automate and enhance the process of incorporating captured field data into a corporate
system or incorporate into a streamlined workflow that enables quick access to the most upto-date corporate information;
•
solutions that are easy to use, efficient and stable. The ease of use is a crucial requirement
that can mean acceptance of the solution;
•
device independency. Field users have many different tasks with varying degrees of
complexity and device requirements and mobile crews need to be agile in response. Solutions
8
Keating, 2003, Challenges for Enterprise GIS
The use of ArcPad and ArcGIS in forest management
72
that are device independent enable mobile crews to respond without having to take another
tool each time;
•
network independence. Mobile users need software solutions that are network independent
and occasionally connected. This means users can continue performing tasks when there is
no network coverage without losing any of their work.
Some of these requirements are delivered by the idea of the EGIS, other require investigations in the
field of the distributed GIS and even IT plays a big role in developing a properly functioning EGIS
that’s suitable for mobile applications. The combination of DGIS and EGIS will be discussed in § 1.6.
The mobile staff supervisors who are responsible for managing the field crews have another set of
requirements that must be adequately addressed by the solutions they use. Some of those
requirements include:
•
mobile crews presence management, also called "tracking and management." Supervisors
need to know
•
where their field crews are and;
•
what their progress is in their daily tasks along an assigned route;
•
dispatching jobs or tasks to the mobile crew in real time, based on pre-defined business rules;
•
adaptive systems to respond to unplanned events or situations;
•
five rights of mobile solutions. The ability to assign the right job to the right resource with the
right equipment in the right location at the right time;
•
incorporating information about location, job asset, and field status in real time;
•
full audit and reporting to enable planning and process improvements.
In addition to mobile users and supervisors, the IT staff responsible for maintaining and managing
mobile solutions has requirements that must be addressed. Some of those requirements are:
•
solutions based on open standards to guarantee future IT investment and improved IT
support;
•
commercial-off-the-shelf (COTS) mobile software solutions;
•
scalability to meet future demands and growth;
•
security solutions should extend over potentially unprotected networks while still preserving
the integrity of user data and protect against security breaches.
The use of ArcPad and ArcGIS in forest management
73
Each of these requirements is important to actual users of mobile solutions. Vendors need to listen to
the requirements of the users instead of making assumptions. Don't fall into the trap of assuming that
more device resources (memory, processing speed and storage) for laptops and Tablet PCs mean
that performance, ease of use, and software architecture are no longer an issue. Advancements in
hardware and competitive pricing in the mobile industry should not cause software vendors to lose
sight of the problems they are trying to solve in the mobile space. The main approach needs to
continue to focus on meeting the requirements for the field. At the end of the day, success or failure of
mobile solutions is defined by those in the field who need and adopt the solutions.
5.6
Combining distributed & enterprise GIS
We have already examined the fact that data is no longer restricted to a single machine in an
organisation, but is widespread through the organisational network and, of course, across the ever
spreading internet for the wider global community to freely access, with increasing frequency. GIS
reaches the same people that the institutional enterprise business system reaches. Here we need the
distributed GIS to get all the pieces of the database together in one widely accessible EGIS. By
combining these two technologies, the field worker can have access to all the information spread
around the network without having much trouble of finding the location. Field workers are still required
to return to their office to utilise or modify data that is managed and maintained within the enterprise.
Moving forward, into the not too distant future, mobile GIS can be considered, very simply, as an
extension of the existing enterprise GIS. The operations and data that decision makers use today will
be made accessible to the entire workforce of an organisation in both the office and field environments
without any hard-wired connection. The entire workforce will become knowledge-enabled, to the extent
that they will no longer be dependent on others to assign tasks or to carry out spatial queries. The field
workforce will have access to the same information that everyone else in the office environment has
made use of for many years now.
figure 35: Mobile GIS in and DGIS and EGIS environment
The use of ArcPad and ArcGIS in forest management
74
Chapter 6 Data collection in mobile GIS
In this chapter, we don’t describe the data encoding process for the GIS. In almost every basic
handbook on GIS, this is explained better and wider than we can. For further reading on the collection
of spatial and attribute data, see Heywood et al., 2002 and Longley et al., 2005. We start our
discourse with a ready-to-use database, where, in fact, there will be the need to add data. To add
data, or to setup a new database and fill it with data, we follow, as stated by Heywood et al., 2002, this
data stream:
figure 36: Data stream9
9
Heywood, 2002
The use of ArcPad and ArcGIS in forest management
75
Before implicating mobile GIS, it’s needed to make a distinction between the types of data we need in
our GIS:
•
spatial data: maps, satellite data. These data can be analogue or digital, or of course in both
formats. The maps and aerial images serve as a background while collecting and retrieving
data with our mobile GIS;
•
attribute data where in the past collected in an analogue way by surveying. This is the place
where mobile GIS has some great advantages in the digitising process, but this will be
explained in the next paragraphs.
6.1
GIS data collection vs. mobile GIS
With the growing diversity of GPS, form factor often is confused for function. Just because two
products use GPS for positioning, that doesn't mean they're developed with the same application in
mind. Two such applications that have emerged from the GPS positioning market are "GIS data
collection" and "mobile GIS," but GPS is where the similarities diverge.
6.1.1 GIS Data Collection
There are many ways to populate a GIS, and one of the more costly methods in time and money is
infield data collection. However, after a GIS becomes mature or populated, field data collection often
becomes the most cost-effective method and sometimes even the only one, to maintain and update an
existing database.
Onsite collection becomes a necessity, because it's often the only way to ensure the accuracy of
location and provide the ability to add site-specific database information and keep it up to date.
GIS data collection usually begins with a library of feature templates that's representative of feature
classes in a GIS. The feature template defines the geometry of an object (i.e., point, line or polygon)
as well as the attribute data structure. When the template is ready, it can be populated with positional
and attribute data.
GIS data collection can be considered a one-way data flow: field to office. However, most GIS data
collection applications provide the ability to take data into the field to update position and attribution.
The use of ArcPad and ArcGIS in forest management
76
6.1.2 Mobile GIS
A GIS is populated so it can be used for query, analysis and modelling. The idea of an enterprise GIS
working from a multi-user database, along with Internet and wireless technology, makes mobile GIS
an exciting reality. We explained the use and advantages of an enterprise GIS in Chapter 5. Multiple
users have access to a common dataset, and real-time connectivity can provide a live workflow
between field and office.
Unlike GIS data collection, a mobile GIS benefits from an already populated and mature geographic
database. Although this doesn't require taking the entire GIS into the field, it demands that the needed
dataset is available to perform the necessary tasks on the field. Mobile GIS can so, in relation to GIS
data collection, be seen as a two-way data flow: from field to office and from office to field.
Another important aspect in considering GIS data collection vs. mobile GIS is the workforce that will be
using the technology. Full-time field data collection isn't a job to be carried out by GIS professionals.
This doesn’t make sense as we know a GIS serves some economical goals. Those who collect data,
however, often face adverse conditions and unreasonable deadlines. Therefore, the main criteria for a
field data collector should be accuracy, simplicity and, if possible, indestructibility.
If you're using a mobile GIS, you need to determine what form factor best suits your needs. Will you
need to collect data in a vehicle or on foot? Is screen size important? Do you need your GPS
integrated inside, instead of connected to, your computer, or do you require the flexibility to work with
multiple devices and the freedom to upgrade your computer to respond to the fast-paced market?
Where Windows CE once appeared to be the panacea for mobile applications, advancements in chip
technology and power management now have created the possibility of bringing desktop power into
the field. Tablet PCs have hit the market strong and are available from several vendors.
Tablet PCs boast processor speeds greater than one gigabyte, seemingly unlimited RAM, full screen
size, built-in wireless capabilities and the Windows XP operating system. ESRI, for example,
developed a free set of downloadable tools for ArcGIS that take advantage of the Windows XP Tablet
operating system.
6.2
Advantages of mobile GIS
The most important reason to use mobile GIS is the two-way data flow. But what is this? How can we
translate a two-way data flow in advantages of mobile GIS? During this paragraph, we take a closer
look to the possibilities of the data flow and show how we can take advantage of it to make our mobile
GIS competitive to other techniques.
The use of ArcPad and ArcGIS in forest management
6.3
77
Improved field processes
A mobile data collection system fastens the collection of data. According to ESRI, we can divide this
advantage into four main processes:
•
inventory: recording the location and attribute information of an asset on a digital map;
•
maintenance: managing asset location, condition, and maintenance schedules in the field;
•
inspections: maintaining digital records of field assets for legal code compliance;
•
incident reporting: spatially recording accidents or events.
Some examples of these processes
•
inventory: street sign inventory, storm water inlet inventory, mineral exploration;
•
maintenance: road condition surveys, crop management;
•
inspections: road pavement management, housing conditions, habitat studies, damage
assessment;
•
incident reporting: well sampling, property damage assessment.
These are only a few examples of the use of a PDA in the field and there are many more (see figure 3)
The main reason why field processes are improved lies in the two way data flow. Mobile GIS makes It
possible to capture data (spatial or attribute) directly in the field. A properly managed mobile GIS offers
considerably improved data retrieval, database searching, archiving and remote accessibility
compared to conventional paper-based methods. There is not only the capability to collect data and
bring it to the office, you can also easily navigate to earlier collected data, check it, keep it up to date
… When we combine this with the field-based analysing methods, built-in in the mobile GIS software
package, it’s clear that field processes, that take a lot of digitising work after the data collection, are
improved by the use of a GPS-enabled PDA.
The efficiency of fieldwork can be thought of just in terms of the time it takes to collect the field data. In
the experience of general digital fieldwork, the time savings made during acquisition of field data are
often marginal when compared with traditional methods of data collection. However, the digital nature
of the acquired data gives large time savings because there’s no need for digitising, when
subsequently carrying out detailed analysis (e.g. producing maps, spatial analyses) and producing
reports.
The use of ArcPad and ArcGIS in forest management
6.4
78
The use of on-the-field quality improvement
Quality of data plays a very important role in the development of a GIS in any area. This is one of the
prime factors securing the reliability of information as obtained from the GIS and quality of the decision
making. Reliability of a GIS mainly depends upon the data quality with which the GIS is arranged and
the way it is integrated and displayed for the purpose of extracting information for decision making.
Since decision depends on the information contents, the quality of data must be effectively
controlled10. Mobile GIS offers a great opportunity to do this on-the-field. First there is the fully digital
data flow that reduces already every error occurring during digitising. This can be stated as the most
important advantage of mobile GIS. Another less known possibility to improve the quality of the
collected data is programming semantic controls. This means that during the data collection process,
the software constantly controls every entry, e.g. by the use of statistics or algorithms, on
inconsistencies. The codeword here is “fitness for use.” Data collection with semantic plausibility
control aims to supply enough information, based on error calculations, to come to increased data
applicability and a better decision making.
6.4.1.1 Data quality
For about 30 years, two different meanings have been associated with the term ‘quality’ in the
literature, the first one restricting quality to the absence of errors in the data (i.e. internal quality) and
the second one looking at how data fit the user’s needs (i.e. external quality) (Van Maercke) . This
second definition, usually identified as the concept of ‘fitness for use’ (Juran et al. 1974; Van
Maercke), is the one that reached an official agreement by standardisation organisations (e.g. ISO)
and international organisations (e.g. IEEE). More precisely for the latter case, we define quality as the
closeness of the agreement between data characteristics and the explicit and/or implicit needs of a
user for a given application in a given area.
For more than 20 years, standardisation bodies have identified characteristics describing internal
quality (e.g. ICA, FGDC, CEN, ISO, OGC). If these characteristics differ between standards, there is
however an agreement on most of them and common criteria are often identified as the ‘famous five’:
positional accuracy, attribute accuracy, temporal accuracy, logical consistency and completeness
(ISO-TC/211 2002). It is intended to document these criteria within the metadata provided with
datasets by data producers.
10
This can be done by using ISO 19101 to ISO 19135. This International Standard defines the
framework for standardisation in the field of geographic information and sets forth the basic principles
by which this standardisation takes place. More information on ISO: http://www.iso.org
The use of ArcPad and ArcGIS in forest management
79
6.4.1.2 The famous five for data quality
There exist several criteria to describe the quality of spatial data. These are called “the famous five”
and are:
•
lineage is a record of the data sources and of the operations which created the database. The
means that we keep track of all digitising methods, when en who did the surveys, what steps
were taken to process the data … ;
•
positional accuracy. This is defined as the closeness of the measured location information to
the true position of the object;
•
attribute accuracy, defined as the closeness of attribute values to their true value. Note that
while positional accuracy does not change true time, attribute accuracy can change true the
time. Attribute data are usually obtained through a combination of field work and interpretation
and the categories used in the representation may not always be easy to check;
•
logical consistency refers to the internal consistency of the data structure, particularly applies
to topological consistency. E.g. do the polygons close;
•
completeness concerns the degree to which the data exhausts the universe of possible items.
The widespread acceptance of these quality elements does not necessarily bear any relation to their
suitability of the task to describe the quality of any dataset to allow the users to determine the fitness
of use. So, by adding semantics, we get information about the number of correctly encoded entities
according to a set of representation or integrity rules.
6.4.1.3 Semantic accuracy
To improve the semantic accuracy, we can use a more knowledge-enabled way of capturing data. The
automatic plausibility controls in the field enable the field worker to correct errors in the field, thus
guaranteeing a higher quality of data. This can be implemented in field GIS to warn the observer if
inaccuracies occur in the database. The use is very knowledge based and fits only one particular GIS
but they let the observer reconsider the database outdoors en let him find reasons why the
inaccuracies occurred in the database. He can correct the database seeing the reality, not later in the
office where it is difficult to bear all relevant facts in (human) memory.
The use of ArcPad and ArcGIS in forest management
80
Chapter 7 Forestry
7.1
Introduction to Finnish forests
7.1.1 Forestry areas
Finland is situated in northern Europe and reaches from the Baltic Sea to above the Artic Circle,
therefore the climate varies greatly from south to north (semi-maritime climate). The average altitude is
only 120-180 metres above sea level and there are 60000 lakes estimated throughout the country.
About three-quarters of the total land area is covered by forests. Forestry land is divided into
forestland (volume increment more than 1 m³/ha/year), scrub land (volume increment 0,1 – 1
m³/ha/year), wasteland (increment < 0,1 m³/ha/year) and roads.
The soil is more fertile in the south than in the north.
figure 37: Forestry land areas
7.1.2 Forest structure
Pine and spruce dominate Finnish forests. Some 48% of the growing stock volume is pine, 33%
spruce and 19% deciduous trees (mostly birch). Forests are also quite pure (dominance of one tree
species in a forest) and young (67% of the forests are under 80 years old), mostly in northern Finland
old-grown forests can be found. Forests are also to a very large extent even-aged, due to the
management practices.
The use of ArcPad and ArcGIS in forest management
81
figure 38: Tree species dominance
7.1.3 Growing stock, increment and drain
Growing stock is 2091 million m³ o.b. The annual increment of the growing stock has been bigger than
the drain since the 1970’s. The annual increment is 86,7 million m³ o.b. per year and the growing stock
drain was 69,9 million m³ o.b. per year in 2004.
7.1.4 Employment
The forest sector employs 91500 persons (2000), which is 4,1% of the national total.
The national forest programme predicts that the number of employees will drop in the future.
7.2
Main goals of forest management
The forests make up one of the earth’s greatest reservoirs of renewable natural resources. Managed
properly, they can provide us with essential products and at the same time they can remain home for
wildlife and outdoor use and a vital source for water supplies. However, the management of the forests
for each of the many products, services and benefits presents a complex problem. Management of
forest becomes especially important as human population increases and forest area decreases.
According to the Eurostat environmental inquiry, forested land was estimated to fall into four
categories by its main function: 19,3 million ha of forestry, 1,7 million ha of reindeer husbandry, 1,3
million ha of protection and 0,7 million ha of recreation. One of the main goals is to increase
roundwood production. The state subsidies to forest management and protection will increase without
losing ecological sustainability.
Forest management would be simple if all forest resources were readily renewable and if it were
possible to use one resource without affecting other resources. Virtually all timber management
practices affect the wildlife and fish in forest ecosystems. The interactions can be ‘neutral’ (one does
not affect another i.e. a photographer and a fisherman), it can be ‘compatible’ (i.e. small clearcuts on
The use of ArcPad and ArcGIS in forest management
82
wildlife) or it can be ‘incompatible’ (i.e. wilderness and intensive timber management). Incompatible
uses may result in conflicts.
7.2.1 Definition
Forest management planning is the process of organizing a collection of forest stands so that they
produce the resources that the landowner wants from that forest. The landowner may be a private
person, a forest industry, state, government,… The resources might be timber products, wild life,
recreation, aesthetics or any combination of these. Production of biodiversity
Production areas and guidelines in production forests ensure that biodiversity is protected. Forest
management in production forests is controlled by forest law and nature conservation law. Nature
conservation law defines nine protected nature types and forest law defines seven environments of
special importance and five other valuable environments, which have to be treated with special care.
7.2.2 Timber and peat production
Other than the protected area, the forest area is in timber production (most of the forests are seminatural). In Lapland poor growing conditions and reindeer husbandry set restrictions to timber
production. The main goal in wood production is to increase annual roundwood production to 63-68
million m³ per year, which will be sustainable in the long run.
7.2.3 Carbon sequestration
Finland has agreed to decrease emissions of greenhouse gases. The national forestry programme
(which will obtain to increase the roundwood production) will influence it significantly.
7.2.4 Non-wood forest products and recreation
Finland, like other Nordic countries has public rights of access to both public and private forests, which
includes picking berries, mushrooms and herbs from the forests. Other forms of forest recreation are;
hiking, cross-country skiing, hunting, mountain biking, orienteering… Also timber production area can
be used for recreation.
The use of ArcPad and ArcGIS in forest management
83
7.2.5 Reindeer husbandry
Reindeer husbandry is an important activity in the northernmost part of Finland. There is also a cultural
value, as most of the reindeer owners are Sami people. It is also the only form of forest grazing in
Finland. In Lapland all forests should be managed in a way that reindeer herding is taken into account.
7.2.6 Multiple use
A forest has a great variety of uses. Trees can be used for furniture, construction elements or
firewood. An outdoor enthusiast will enjoy flora and fauna during hiking, mountain biking or
orienteering. This variety of uses reveals the challenge to modern forest management, both in
choosing which resources should be used and in giving society access to them.
Also combinations of for example recreation and wood production are possible.
7.3
Management
7.3.1 Ownership
The majority of the Finnish forest owners are private owners. In southern Finland private owners own
73,5% of the forestry area, companies 12,2% and the state 8,2%. In northern Finland the state owns
54,6% of the forest, private owners 37,1% and companies 4,2%.
All together private and company forests are situated on more fertile soil and state owned forest on
poor soil in Lapland.
The difficulty of the management depends on the size of the forest, the value of the wood products
involved and the resources and tasks the forest has to support.
7.3.2 Management practices
Management practices do not differ considerably by forest owner.
The private owners have forest management guidelines, which are based on forest law and
certification requirements. Companies and Finnish Forrest & Park Service have their own
management guidelines, but they are quite similar to the guidelines of the private owners.
Guidelines contain the main principles according to which the forests could be treated.
When there will be an increment in the roundwood production, there will be more trees felled.
Therefore artificial regeneration of trees (seeding and planting) is necessary.
The use of ArcPad and ArcGIS in forest management
84
Natural regeneration is used where it is possible and economical.
figure 39: Forest management practices other than fellings in 1999
Also precommercial thinnings are achieved and are based on the number of stems at a certain
dominant age. Other thinnings are based on the basal area and height of the stand. There are
different thinning models for southern and northern Finland, different tree species and site soil types,
so there are three curves in thinning models. When the upper curve is exceeded, thinning is
recommended.
7.3.3 Harvesting
Only the commercial part of the trees is harvested, the cut-to-length method is used.
Trees are felled, delimbed and cross-cut into logs in the forest (most of this is mechanised).
Haulage is done with forwarders and only few with farm tractors. Most of the long distance
transportation is made by truck. The transportation used to be done by floating, but nowadays it isn’t
that popular anymore, because it’s slow and a lot of work.
7.4
Measuring and monitoring forest resources
There are as many reasons to measure forests as there are uses of forests, and each use has its own
specific needs for information.
7.4.1 Land surveying and mapping
Forest type maps are very useful to forest managers because they show the locations and boundaries
of individual compartment maps (areas with similar species, size and density of trees). These maps
also show non-forested areas such as lakes, rivers and fields. Vertical aerial photographs can be
useful for preparing forest maps because they can be viewed with a stereoscope to provide a threedimensional picture of the forest. Trained interpreters are able to identify forest stands on the
photographs and outline their boundaries.
The use of ArcPad and ArcGIS in forest management
85
figure 40: Schematic view of a stereoscope
7.4.2 Measurement of forest resources with a focus on timber
There are many variations in the types of timber focused surveys, such as precise measurement of
individual trees or measuring a large forest.
7.4.2.1 Standing trees
Most timber surveys require the measurement of individual trees. Standing tree measurement may be
required to estimate the volume or mass (weight) of various products obtainable from trees or to know
the relative sizes of trees to aid the forest management.
Diameter at breast height (dbh): one of the most useful measurements is the diameter at breast
height, this is the diameter of the tree stem at a height of 1,3 meters above the ground.
The tree calliper is one of the most accurate instruments for obtaining this measurement. Another
instrument, but not really accurate is the Biltmore stick, and is based on the principle of similar
triangles.
The use of ArcPad and ArcGIS in forest management
86
figure 41: Example of a tree calliper
Basal area: the diameter at breast height (dbh) is frequently converted to basal area, which is the area
(in square meters) of the cross section of the tree at breast height. The formula for the area is: (π *
dbh) / 4
The basal area of a forest stand is expressed as the sum of the tree basal areas divided by the area of
the stand and is expressed in square meters per hectare (m²/ha).
Height: there are a number of different instruments for measuring tree height and the required level of
accuracy dictates the instrument of choice. Height poles (direct measuring) provide very accurate
measurement for trees that are not too high, otherwise it becomes too awkward. Tree heights can be
measured indirectly with instruments called hypsometers. They work either on geometric (similar
triangles) or trigonometric (angles) principles. Mostly the result of the tree height is directly visible on
the scale of the device.
figure 42: Height measurement based on geometric principles (similar triangles)
The use of ArcPad and ArcGIS in forest management
87
figure 43: Height measurement based on trigonometric principles (angles)
When trees are measured to access the volume or weight of merchantable products in the tree, the
‘merchantable height’ or ‘length’ is more important instead of the total height (this is the height
between the stump and the point where the diameter becomes too small to be utilised).
Therefore tables with percentages are used.
figure 44: Important tree measurements
The use of ArcPad and ArcGIS in forest management
88
Volume and mass: there are at present no instruments that allow the direct measurement of the
volume or mass (weight) of a standing tree. Instead, volume and mass must be estimated from other
tree dimensions. Tree height and diameter at breast height are most frequently used for this purpose
and tree volume tables giving the average volume for trees of different diameters and heights have
been developed. In most cases forest management planning programs calculate the volume based on
mean height and basal area of the stand.
Age and radial increment: tree age can be measured by counting the annual rings in the tree stem.
This can be done by using an increment borer, which takes a horizontal sample of the tree.
Volume increment of a forest stand is calculated by models (formulas).
7.4.2.2 Forest sampling: Estimating stand characteristics
It is seldom necessary or desirable to measure every tree in a forest. Accurate estimates can be
obtained from measurements of a subset or sample of the trees in the forest. This process of selecting
a representative sample of trees and obtaining the required estimates is called forest sampling.
Measuring distances in forests is not that important, but when it needs to be done, pacing is the most
common way.
Sampling units: sample trees are usually selected in groups at different locations throughout the forest.
Each group of trees is called a sampling unit and may be selected in a variety of ways. Sample plots
may be square, rectangular or circular and are usually between 0,01 and 0,20 acre in area. Circular
plots are often preferred because of their ease of installation. All trees with a midpoint at breast height
lying in the plot boundary are tallied.
These data can be used to calculate estimates of the average number of trees, basal area and volume
per hectare. The most widely used method to take samples, is to make use of the relascope.
figure 45: Relascope
The use of ArcPad and ArcGIS in forest management
89
The relascope is a very simple but at the same time ingenious little and cheap device. The use of the
relascope is very simple: Position yourself in the centre of a tree stand that is representative for the
average of the forest. Hold the end of the chain against your cheek and sight through the slot on the
edge of the relascope towards a position 1,3 meters up the tree (breast height).
All trees wider than the slot are counted. Every second tree having the same thickness as the slot is
also counted. Trees which are smaller than the slot are not counted. Proceed counting trees as
explained as you turn around (360°). The number of trees counted represent the current basal area of
the forest.
figure 46: Use of the relascope
Sampling methods: once appropriate sampling units have been selected it is necessary to decide how
many units to measure and how they will be located in the forest. The total number of sample units is
called the sample size and the manner in which they are located is called the sampling method.
Random sampling is a method in which sample units are located completely random within each
stand. This ensures that the result will tend toward the true stand values. Systematic sampling is often
preferred because it is easier to implement, the time it takes to walk between plots is usually less and
sketching field maps and adjusting type lines on aerial photographs is more easily done. An exercised
person can point sample plots in the forest in a way that he becomes a mean value (5 – 8 relascope
sample plots per compartment is a good average).
The use of ArcPad and ArcGIS in forest management
90
figure 47: Random sampling vs. Systematic sampling
Statistics: Estimates obtained from forest sampling are called statistics and they will vary in detail
according to the type of timber survey. In the forest management planning, when timber production is
the main goal, the timber volumes per timber assortment, tree species, age, tree size, volumes and
site are the basis for treatment suggestions. In addition, of particular importance to management
planning are the rate of growth of timber and the rate of loss through natural mortality, insects,
decease, fire, weather and harvesting.
7.5
GIS and remote sensing in forestry
7.5.1 GIS
The explanation about GIS in its different forms will be explained in the chapter on GIS.
7.5.2 Remote sensing
Remote sensing is the measurement of characteristics from a distance. Practically defined for forest
science applications, remote sensing is the use of airborne cameras, scanners and satellite imaging
devices to gather information on forest resources. Aerial photographs have been used since the
1930’s and widely applied. The use of satellite and airborne scanner imagery in forestry is more
recent, having begun in the 1970’s. Whatever the medium, remotely sensed imagery is a unique and
valuable data source that is used worldwide.
The use of ArcPad and ArcGIS in forest management
91
All remote sensing is based on the detection of electromagnetic energy. Electromagnetic energy is
defined by wavelengths and may be categorized into spectral regions. Different wavelengths have
different energy intensities and are sensed as different colours. Differences in reflected
electromagnetic energy forms the basis for remote sensing. Sunlight falling on the forest is either
absorbed or reflected. Different materials have different spectral reflectance patterns across the
electromagnetic spectrum and these different patterns lead to different colours, allowing a photointerpreter to distinguish between different surface features.
7.5.3 Aerial photography
Four types of photographic film are commonly used.
•
Black-and-white panchromatic film has approximately the same electromagnetic spectrum as
the human vision.
•
Black-and-white infrared film is sensitive for the infrared reflections from many vegetation
types, so infrared films are desirable when the photographs are used primarily for vegetation
mapping.
•
True colour photographs are sensitive to the same wavelengths as the human eye, so the full
range of visible colours.
•
Colour infrared films have three dye layers. Broadleaved tree and grass reflects infrared light
more strongly than visible light, so colour infrared photographs are typically red in areas of
dense vegetation. That’s why broadleaved and conifer forests can be distinguished.
The scale of an aerial photograph is important, but is rarely constant within a photograph, because
planes may fly at nearby constant height, the elevation of the earth surface varies below the aircraft.
Photograph scale may also be affected by camera tilt, the film plane is not parallel with the earth
surface so there will be some perspective distortion. In Finland orto-rectified aerial images are used (=
corrected images), so there is no distortion anymore. Increasing the flying height, hence decreasing
the scale, increases the area covered in each photograph and the other way around. Also the degree
of overlap among adjacent photographs is another factor which will affect the number of photographs
required to cover an area.
Photo-interpretation involves converting the variation in colour and tone on aerial photographs into
information about the location and characteristics of important resources. Forest photo-interpretation is
most often performed to produce a vegetation type map. The boundaries of homogeneous vegetation
units are based on cues in the photograph. Colour, brightness, texture or pattern, size, shape,
topographic position and proximity to other features are all used to define the boundaries between
different vegetation types. The art of photo-interpretation is gained throughout experience.
The use of ArcPad and ArcGIS in forest management
92
Forest managers and scientists are often interested in mapping forest types by species and
sometimes age classes, timber volume, soil type, etc… Aerial photographs are also extensively used
for regenerating surveys, forest health monitoring and to assess disease, insect, storm and fire
damage. Other uses of aerial photographs are harvest planning, property lines surveys, timber and
land appraisal, road design an layout, erosion evaluation, estimating wildlife population and recreation
planning.
In the last two decades we have seen a rapid development of imaging systems that not depend on
film. One of the most amazing achievements is the engineering of image scanners that collect millions
of observations in only a few seconds, reconstructed to form geometrically accurate images. These
sensors can detect wavelengths well beyond the capabilities of the human eye or film and in
wavelength ranges specifically chosen to provide the most information. These scanners are mostly
used in satellites for remote sensing, such as Landsat, SPOT and Radarsat. Laserscanning is the
newest method, whereby immediately the type and height of trees can be extracted, and that because
the difference in wavelength.
As you can see, remote sensing is a very important aspect in forestry. Without remote sensing and
mapping, forestry wouldn’t be that evolved as it is today.
The use of ArcPad and ArcGIS in forest management
93
Chapter 8 Materials and methods
This chapter concerns all types of data, materials and methods we use. This is in fact the basis for our
project, a kind of manual on getting the data ready for the fieldwork. A good understanding of the
different data types and methods is a key word in the setup of the fieldwork. That’s why we will
describe this in detail.
8.1
Compartment maps and compartment data
The management objectives of forest owners have become diversified. Forest management planning
is an effective tool to integrate these objectives into estate and stand level operational
recommendations. Planning also makes systematic data collection and management possible.
The data collection described in the field manual consists of two parts:
•
the compilations of estate and owner data;
•
and the collection of forest stand data.
We don’t take a closer look to the estate and owner data. Only some parts of the forest stand data are
from a certain importance for our project.
8.1.1 Compartment maps
All forest areas are divided into compartments. These are drawn on a map, usually with an aerial
image as background to distinguish the different parts in a forest. Afterwards, these compartments can
be stored as a shape-file to use in ArcPad and ArcGIS.
The use of ArcPad and ArcGIS in forest management
94
figure 48: zoom on the aerial image and the compartments
8.1.2 Compartment data
The data start with some identification data (municipality, area, planner code, …) followed by site
information (compartment number, main land group, development class, …). For the core of the
project, these data, except of the compartment number, have a secondary importance. In this part of
the text, we focus on the tree stand stratum and the tree species stratum.
The tree stand characteristics are collected by strata in all the compartments of the forest land. A
stratum can be a tree stand or a tree species stratum. According to the characteristics, several tree
stand or tree species strata are defined. We use one tree stand stratum and three tree species strata
per sample. In the tree stand stratum, we enter the mean tree stand characteristics. The three tree
species we use are pine, spruce and birch.
The use of ArcPad and ArcGIS in forest management
95
8.1.2.1 Tree stand stratum
This paragraph is an explanation of the tables above.
•
Stratum number. Every stratum / sample gets a number. This is automatically given by the
software under the form of a unique identifier, given by ArcPad / ArcView.
•
Tree storey. Tree storey tells, which canopy layer each tree stand stratum and tree species
stratum belongs to. If necessary a planner can define three types of storeys: dominant tree
storey, undergrowth and predominant tree storey.
•
Age. The mean age of each tree stand stratum is determined. Mean age can be entered with
the accuracy of one year, but in practice, using age classes of 5 years is satisfactory.
Age is determined by age-boring of one representative basal area median at breast height11
tree within each tree stand stratum.
•
Basal area. Basal area is measured at a height of 1,3 m from germination level, namely from
the starting point of the stem. Basal area and number of stems are alternatives, so the planner
estimates either the basal area or the number of stems of each tree stand stratum, according
to that, which is easier to measure. The basal area is determined by measuring relascope
sample plots, which are located either in a systematic grid or otherwise evenly distributed in
the forest stand. There have to be at about 4 to 8 sample plots per hectare to achieve a
satisfactory accuracy of mensuration results.
•
Number of stems. Number of stems is entered by tree stand stratum with the accuracy of 10
stems/ha. It is an alternative characteristic for the basal area. So, for every tree stand stratum
either the basal area or the number of stems is estimated, according to that, which is easier to
measure. The number of stems is measured on circular sample plots, distributed evenly in
every part of the compartment. E.g., if the area of the circular plot is 50 m², the number of
stems on the sample plot multiplied by 200 gives the number of stems per hectare.
•
Mean diameter. The diameter of the basal area median tree among the living trees in the tree
stand stratum is meant by mean diameter.
•
Mean height. This is determined by measuring the height of the median tree of the tree stand
stratum, and then by estimating the mean height of tree stand stratum with the accuracy of
1m.
11
Breast height is 1,3m high from the germination point, to the pith)
The use of ArcPad and ArcGIS in forest management
96
8.1.2.2 Tree species stratum
•
Tree species stratum number. Tree species stratum number is always the same as the tree
stand stratum number. A tree stand stratum can have a maximum of nine tree species strata.
•
Tree species. Different tree species are named according to a numerical coding system.
•
Tree species percentage. The percentage of a tree species in the forest stand is determined in
percents based on basal area/number of stems of the tree stand stratum.
•
Logwood percentage. Determined in percents based on the volume of the median tree of each
tree species. In logwood percentage estimation the general quality requirements and minimal
log dimensions of the given tree species are followed. It is possible to let the calculation
program accomplish the logwood calculations.
8.1.2.3 Sampling process
To take sample plots in the forest, we need following devices:
•
GPS-enabled PDA with ArcPad to enter data;
•
relascope;
•
device to measure the diameter of a tree, see figure 34;
•
device to measure height of the trees, see figure ;
A sufficient amount of relascope sample plots (4 – 8 plots / compartment) are defined to estimate the
mean tree stand stratum characteristics as reliable as possible. The development stage, the structure
of the forest stand and the need of operation affect the recommended determination method of mean
characteristics.
The use of ArcPad and ArcGIS in forest management
8.2
97
Other maps
8.2.1 Base maps
This layer is useful to get a good view on the environment. In the field it is from time to time useful
having this layer around to find out where you are walking around. Base maps are high-scale
topographic maps on building level.
figure 49: zoom on the basemap and compartments
8.2.2 GT maps
GT Maps give a wider view on the project area. The helps to stimulate the location awareness during
the project and it is useful to plan the road before measuring in the forest.
The use of ArcPad and ArcGIS in forest management
98
figure 50: Base map vs. GT map
8.3
Aerial images
Information on the use of aerial images in forestry can be found in chapter 7. We used following aerial
image:
figure 51: aerial image of the environment of our compartments
The use of ArcPad and ArcGIS in forest management
8.4
99
PDA and ArcPad
The PDA and ArcPad are almost the goal of our project. We made the database and file setup as easy
as possible to be able to concentrate on using the PDA and ArcPad.
8.4.1 Setup of the PDA and ArcPad
8.4.1.1 installation
Step 1: set up the PDA according to the manuals delivered with it. Don’t forget to set the DGPS
corrections.
Step 2: installing ArcPad on the PC
First install the Microsoft Active Sync12 to make synchronised connections with the PDA.
Install ArcPad on the pc following the instructions given during the installation process.
Step 3: Installing ArcPad on the PDA
All instructions are clearly explained in the PDF files provided with the PDA. The only remark we have,
is to look carefully where to install Arc Pad on the PDA. The program will ask if you want to install
ArcPad into a default directory (see figure 52 below). Click No.
figure 52
The installation program will ask you into which destination directory, called “Destination Media”, you
wish to install ArcPad on the MobileMapper CE. The default is "Main Memory" but you should click the
down arrow next to “Main Memory” for more options and select "MyDevice." See figure 53 for that.
After highlighting “MyDevice” on the Select Destination Media window, click OK and follow the rest of
the instructions for installing ArcPad on your MobileMapper PC.
12
More info on Microsoft Active Sync on:
http://www.microsoft.com/windowsmobile/downloads/activesync41.mspx.
The use of ArcPad and ArcGIS in forest management
100
figure 53
A note on installing ArcPad into MobileMapper CE’s “MyDevice” directory PDA’s typically store their
software programs within "Main Memory."
Main memory on a Windows CE device is volatile - which allows programs to launch rapidly.
To prevent the programs being erased upon power down, PDA’s never really turn off. This is
why you must reinstall all PDA programs when their internal batteries fail. Fortunately, it is
easy to continuously power the volatile main memory because PDA’s are typically returned to
a synchronization/recharge cradle daily.
MobileMapper CE, however, is designed so you can take it to the field for weeks at a time, and
store it for months between uses. To permit this mode of usage, it is important to shut the
power off completely to conserve power. To keep ArcPad from being erased when the
MobileMapper CE is shut down, you should install it into the “MyDevice” directory. This
directory resides on an internal non-volatile NAND flash card and so is never erased, except
deliberately by the user.
8.4.1.2 Setup of the GPS
Once ArcPad is installed, we need to configure the GPS to get it working properly. Run ArcPad and
tap the down arrow to the right of the Tools (figure 54) icon.
figure 54: Tools icon
Select Options. Tap the Protocol tab and set the protocol to NMEA 0183 and the GPS datum to
WGS84 (figure 55).
The use of ArcPad and ArcGIS in forest management
101
figure 55
Tap the GPS tab and configure GPS communications as indicated on figure 56 below and tap the OK
button.
figure 56
If you wish to average a number of GPS positions over a point feature, tap the Capture tab, check the
Enable Averaging option and input the number of positions you wish to average at each point feature.
MobileMapper CE outputs a GPS position every second. Averaging for 30 seconds improves accuracy
(figure 57).
The use of ArcPad and ArcGIS in forest management
102
figure 57
8.4.2 Preparing data: ArcPad Tools for ArcGIS
ArcPad tools for ArcGIS is a toolbar for ArcGIS Desktop that provides tools for preparing data for use
with ArcPad. The toolbar has following functions:
•
export ArcMap layer symbology to ArcPad layer files;
•
create an ArcPad map;
•
create subsets of large datasets and, if necessary, convert the data to shapefiles;
•
provide a summary of the data and fonts used by the ArcPad map;
•
and packing shapefiles.
This toolbar has the basic functions built-in. All other tools needed for data preparation can be found in
ArcMap, ArcCatalog and ArcToolbox, e.g. setting coordinate systems.
8.4.2.1 Setting up the ArcPad Tools toolbar in ArcGIS
•
Start ArcMap.
•
Click the Tools menu.
•
Click Customize.
•
Click Add from file.
•
Navigate to the installation folder of ArcPad.
The use of ArcPad and ArcGIS in forest management
103
•
Open the apTools8 subfolder.
•
Click the apTools8.dll and click Open. The Added Objects dialog box appears and reports
which new objects have been registered.
•
Click OK.
•
Click the toolbars tab and check the ArcPad Tools custom toolbar check box. The toolbar is
now added to ArcMap.
•
Click Close.
8.5
ArcView
ArcView is full-featured GIS software for visualizing, managing, creating, and analyzing geographic
data. Using ArcView we manage the compartment data and we can understand the geographic
context of the data. In our project ArcView serves as a platform to export and import data to the PDA.
Further developments can enable ArcView to manage a whole forest management geodatabase.
Although this has some very powerful characteristics to make management much easier, we
concentrated on the data collection with the PDA. For more information on the capabilities of the
ArcGIS software family, read the information on http://www.esri.com.
8.5.1 Manual for setting up Arc View
8.5.1.1 File conversion
The original Finnish forest management system is built in Tforest with an underlying Solid13 database.
At first, we taught that would give some exporting troubles, but there’s a built in export function to the
common Dbase and ESRI-formats. The export of data was made very easy in that way. This gave us
a Dbase table with all the attribute data and a shape file with the compartment borders.
The shape file has another very useful function in it. In fact of using the join or relate function, we used
the built-in attribute table from the shape file. When you perform an attribute join, the data is
dynamically joined together. This means that nothing is written to disk and edits on the underlying join
tables appear in the appended columns. Relates let you associate data with a layer. The associated
data isn’t appended into this layers data attribute table like it is in a join. Instead you can access the
related data when you work with this layers attributes or vice-versa. So, the exported shape file had
already all attribute data in its layer attribute table.
13
More information on Solid databases can be found at http://www.solidtech.com.
The use of ArcPad and ArcGIS in forest management
104
8.5.1.2 Structure of the data folder
We organised all data in one folder (see figure 58). This is the easiest way to set up a small project.
The bigger the project becomes, the more advanced the database technologies can be. Then, it’s
getting useful to use some distributed and/or enterprise techniques to make the database open to
many users. For our project, it wasn’t necessary to set up a database and our knowledge does not
reach far enough to build a performing database.
figure 58: folder structure
8.5.1.3 Setup of Arc View
Fist step here is creating the sample data layer. As explained before, this layer is needed to create the
points where we take the samples in the field. Therefore, we make, via ArcCatalog, a new shapefile in
the data directory. We add the fields, right the same as the fields of the compartment shape file. To do
this:
•
browse in ArcCatalog to the project folder;
•
right click in the contents window – New – Shapefile;
•
the name for this layer is “SampleData” and the feature type “point.” Select the following
coordinate system: click [edit] – [select] and browse to projected coordinate systems –
national grids and select “Finland Zone 3”. Click [OK];
•
Right click in the contents window on the shapefile you just created and click in the context
menu on “Properties”. Go to the Fields tab and add all the necessary fields. A list of all the
fields can be found in appendix II.
•
The second step in setting up Arc View is providing all the images (aerial image and base
maps) and the compartment shapefile “arcview_kuvio” with the right coordinate system. For
images follow these steps:
•
right click the image in the content window of ArcCatalog;
•
click [edit] in the field next to “Spatial Reference”, as shown on the figure below;
The use of ArcPad and ArcGIS in forest management
•
105
select the coordinate system as explained in the part on creating the SampleData Shapefile
(see also figure 59);
figure 59: Raster Dataset Properties
•
click [OK].
•
Adding the right coordinate system to a shapefile works this way:
•
right click the shapefile that needs a coordinate system and select “Properties” (see figure 60);
•
Browse to the “Fields” tab and select the row where the field name is “Shape”;
The use of ArcPad and ArcGIS in forest management
106
figure 60: Shapefile properties window
•
Click […] near “Spatial Reference” and select the “Finland Zone 3” coordinate system.
Now we made all the layers ready to be used in ArcView. As we explained already, ArcView serves for
us as a desktop application to import and export data from Arc Pad and the PDA. Therefore, we make
a new basic ArcView Map Document:
•
create a new map in ArcView;
•
right click on “Layers” in the Display tab and select “Properties”;
•
click the “coordinate system” tab;
•
select “Finland Zone 3” as shown on the figure 61 below;
The use of ArcPad and ArcGIS in forest management
107
figure 61: Data frame properties window
•
click [OK]
Now we can add the layers (see figures 62, 63 and 64) to the map document:
•
Top layer: sample data (SampleData.shp) This is the only layer we created ourselves. We
needed a way to add samples, with the same attribute data as the compartments without
letting the sample data interfere with the compartment data. A separate layer for samples was
the best solution for this problem. Later on, we can calculate the new compartment data by
adding the data of the sample layer. This layer is only meant to capture data on the PDA, so,
except of removing sample points that are calculated, this layer needs no editing in Arc View.
•
Layer 2: compartments (arcview_kuvio.shp). The compartment layer holds the compartment
borders and an attribute table with all the compartment attribute data. Why we use the built-in
table and not an external database is explained earlier.
•
Aerial image. All info on the why of aerial images in forestry is explained in chapter 7.
The use of ArcPad and ArcGIS in forest management
•
108
Base maps. This layer is useful to get a good view on the environment. In the field it is from
time to time useful having this layer with you to find out where you are walking around.
•
GT maps. GT Maps give a wider view on the project area. The helps to stimulate the location
awareness during the project and it is useful to plan the road before measuring in the forest.
figure 62: layer structure
figure 63: Screenshot form the finished map document
The use of ArcPad and ArcGIS in forest management
109
figure 64: Zoom on our compartments
8.6
Conclusion
This is the whole setup part for the project. This part of the project was mainly about reading manuals,
installing software, thinking about project organisation and getting the GPS working. To make the
chapters not too long and to make the differentiation between the setup of the project and the testing
part, the Arc Pad manual for forest measurements, is written in a separate, next chapter.
The use of ArcPad and ArcGIS in forest management
110
Chapter 9 ArcPad manual for forest measurements
9.1
Basic ArcPad functions
The best way to learn Arc Pad is not reading a manual, it’s just trying yourself. Therefore, ESRI
developed some sample files and a tutorial that guides you along the basic Arc Pad stuff like exploring
data, adding layers, working with geographic features and editing features. We added this tutorial at
the end of the thesis; you can find the files on the cd-rom, provided at the end. After reading this
tutorial, you know enough about Arc Pad to get in the field with the PDA.
9.1.1 The ArcPad Tools for ArcGIS
figure 65: ArcPad Tools for ArcGIS (source ArcPad Manual)
The use of ArcPad and ArcGIS in forest management
111
The ArcPad Tools for ArcGIS form the basic ArcPad functions. We mainly use the ArcPad Map Wizard
to create an ArcPad Map from our current ArcMap file and Export Shapefile Symbology to export the
symbology of ArcMap layers.
9.2
Fieldwork possibility 1
9.2.1 Preparing data for field work
9.2.1.1 Setting up the ArcPad map
The first step in preparing data for field work is zooming to the needed data. The more accurate your
zoom is, the less storage space is needed on the PDA. Taking the limited storage space into account,
this is a very important step in the field work process. In the following example, we want to do some
measurements in compartment 124. So, we will restrict the view to this compartment and a little bit of
the environment. This can be seen on the following screen shot (figure 66).
figure 66: Screenshot ArcMap
Next step in the preparation of data is the ArcPad Map Wizard. This is the link between the ArcGIS
*.mxd-files and the ArcPad *.apm-files.
The use of ArcPad and ArcGIS in forest management
112
Step 1:
Click the ArcPad Map Wizard icon (figure 67) to start the wizard that guides you through the steps to
create ArcPad-ready files. The start screen will be shown as on figure 68.
figure 67: ArcPad Map Wizard
figure 68: ArcPad Map Wizard start screen
Step 2:
Click “Next” in the start screen. Then you can select the layers (figure 69) you want to be exported and
the output extent. Be aware of this last! The output extent is only available for vector-type files. All
rasters will be exported at the full layer extent. This will not only take quite a lot of memory, this slows
also the PDA remarkably down while working in the field. Also: the harder the PDA has to work, the
shorter the battery time. Click again “Next” to go to the following step in the export process.
The use of ArcPad and ArcGIS in forest management
113
figure 69: ArcPad Map Wizard screen 2
Step 3:
Specify an output folder and a map file name (figure 70). Be aware of this restriction and from our view
even a big mistake: the pad to the output folder can’t have any spaces! Click “Finish” and the files will
be converted and a summary is shown (figure 71 and appendix IV).
figure 70: ArcPad Map Wizard screen 3
The use of ArcPad and ArcGIS in forest management
114
figure 71: ArcPad Map Wizard report
9.2.2 Copying data to the PDA
9.2.2.1 Connecting the PDA
To make a connection between the PDA and the PC:
•
clip the I/O module on the PDA;
•
connect the power cable and boot up the PDA;
•
connect the USB cable between the PDA and the PC and wait till Microsoft Active Sync and
the PDA give you the audio signal that the connection has been established. The Microsoft
Active Sync icon and screen will look like this:
figure 72: PDA connected
The use of ArcPad and ArcGIS in forest management
115
figure 73: Microsoft ActiveSync
Connection has been correctly established.
9.2.2.2 Copying data to the PDA
Copying ArcPad data from the PC to the PDA is as easy as copying between folders on the pc. Copy
the necessary data from the source folder on the PC to e.g. “My Documents” on the PDA. The PDA
can be found in Windows Explorer as “Mobile Device” or in Dutch “Mobiel Apparaat” (see figure è’)
figure 74: The PDA works like an external drive
The use of ArcPad and ArcGIS in forest management
116
9.2.3 Collecting data in the field
Data collection can be split in two parts: one that has to do with the forest measurements and on that
has to do with the PDA. In this part, we concentrate on the work with the PDA. This will keep this
manual as general as possible. Further readings on the forest measurement techniques we use in the
forest can be found in chapter 7 on forestry.
9.2.3.1 Get the PDA ready
When arriving at about the compartment, start up the PDA and ArcPad, open the map you copied to
the PDA and set the GPS status Active by clicking the GPS icon (figure 75).
figure 75: ArcPad toolbars and icons
Click the layer icon and mark the SampleData layer edit property (figure 76) to make this layer editable
and mark the identify property for arcview_kuvio and SampleData layers.
figure 76: ArcPad layers screen
The use of ArcPad and ArcGIS in forest management
117
Double tap the arcview_kuvio layer to make the layer properties appear and browse to the symbology
tab to uncheck “Use symbology” (figure 77).
figure 77: ArcPad Layer Properties – Symbology tab
Browse back to the “Polygon Style” tab and set the characteristics in that way that there’s no fill colour
and that the border is clear to see on the aerial image. This can be seen on figure 78 below.
figure 78: ArcPad Layer Properties - Polygon Style
Click OK. You go back to the main screen and the edit toolbar will be visible or make it visible through
the options button – toolbars (figures 79 and 80).
The use of ArcPad and ArcGIS in forest management
118
figure 79: ArcPad options pull down menu
Click the options button and go to the capture tab. Mark the checkbox for Enable Averaging and set
the textbox to the value you want the GPS to repeat the point measuring.
figure 80: ArcPad options button and Options window
Don’t walk around until the alert (see figure 81 below) doesn’t appear anymore. This means that the
GPS found enough satellites to calculate and fix an accurate position. Now we’re ready to get samples
in the forest.
The use of ArcPad and ArcGIS in forest management
119
figure 81: ArcPad no position fix
9.2.3.2 Adding a sample point and entering the attribute data
Once the PDA is ready to operate in the field, you can walk through the forest to take samples.
•
Once you chose the place where you want to take a sample, check the number of the
compartment where you are now. This can be done by using the identify button and then
clicking the compartment where your GPS marker is in.
•
Click the GPS point icon to add a sample point on the current GPS coordinates.
•
The Feature Properties window (figure 82) will pop up. You can now fill out the table. Click on
the desired property and the input panel will appear to enter a value.
figure 82: ArcPad Feature Properties window
•
After entering al the values, click OK. The new sample point is added to the SampleData
layer. Back on the main screen, you will see that a point is added (figure 83).
The use of ArcPad and ArcGIS in forest management
120
figure 83: ArcPad main screen after adding points
9.2.3.3 Changing the attribute data of a sample point
From time to time, it can be necessary to change the attribute data of a previously added sample
point. Maybe you entered a wrong value in the attribute table, you forgot to fill out some properties or
you tapped the OK button by accident. To change the data:
•
Activate the select arrow.
•
Double tap the sample point you want to change or tap the sample point and click the
Properties button.
figure 84: ArcPad - change attributes
•
Click the property (first column of the attribute table) you want to change. The value will
become editable and the input panel will appear.
•
Change the value and tap [OK].
The use of ArcPad and ArcGIS in forest management
121
figure 85: ArcPad Features Properties window with keyboard
9.2.4 Synchronising data between the PDA and the PC
9.2.4.1 Synchronising in our project
There are different ways of synchronising data, depending on the place where you save your data:
you use the MobileMapperCE_MyDocuments directory. This means that you can use the
synchronisation function in Microsoft Active Sync. The major problem here is that you have to copy the
data manually from the folder where you exported the ArcPad files to this MyDocuments folder
because the ArcPad Map Wizard isn’t able to export to this folder. This is due to the problem with
spaces in directory names we mentioned before.
You use the ArcPad Map Wizard in ArcMap only once. For copying the data from and to the PDA, you
can just copy from the folder where you stored your original data to the folder on the PDA. This is only
suitable for small projects like the one we are working on;
If you use a geodatabase, you can use the check in/check out functions. This is far most the best way
to keep your data synchronised, especially when you’re working with multiple PDA’s at the same time.
The use of ArcPad and ArcGIS in forest management
9.3
122
Fieldwork possibility 2
Fieldwork possibility 1 is a very easy way of working, although not the most catholic way. We started
working on that path for a few reasons:
•
we had troubles with building a geodatabase. Importing aerial images and maps was no
problem but trying to import arciew_kuvio.shp and SampleData.shp only gave us two empty
shapefiles in the database. We solved this problem by not thinking about importing files in a
database from a folder, but using the export function from a folder to a database. This seems
the same but the figures 86 and 87 below make this idea more clear;
figure 86: import a feature class in a database
figure 87: export a feature class to a database
The use of ArcPad and ArcGIS in forest management
•
123
in the ArcPad 6.03 manual is nothing mentioned about how to structure projects, importing
and exporting data from databases to ArcPad … The only way of working according to the
manual is the ArcPad Tools for ArcGIS. And even this lacks some clarity. You can get the files
ready, but copying from PC to PDA and the other way round is never mentioned;
•
we didn’t know anything about the second toolbar that is installed automatically in ArcMap.
This one doesn’t have only an export function, there’s also an import function (figure 91).
figure 88: Arc Pad toolbar in ArcMap
These are major mistakes, maybe not in ArcPad itself but for sure in the manual. This means that we
can restart the setup process almost from scratch. I start the description of the steps from the setup of
the geodatabase.
9.3.1 Setup of a personal geodatabase
•
Put all the necessary files (aerial images, base maps, shapefiles) together in a folder and set
all the coordinate systems as mentioned in Chapter 8 materials and methods.
•
Right click in the contents window of the location where you want your personal geodatabase
(see figure below) and select New > Personal Geodatabase (figure 89).
The use of ArcPad and ArcGIS in forest management
124
figure 89: making a geodatabase in ArcCatalog
•
A new Personal Geodatabase file appears, rename it and your database is created.
•
To fill the database with your shapefiles (be aware of the problems we mentioned in the
beginning of this paragraph) right click on the files and select Export > To Personal
Geodatabase (figure 87).
•
To add the images to your database, open the database, right click in the contents window
and select Import > Raster Datasets (figure 90) and select the raster images you want to add.
figure 90: Importing Raster Datasets in a geodatabase
The use of ArcPad and ArcGIS in forest management
•
125
All files are imported and the database is ready to use now.
9.3.2 Building the ArcView map
The layers are added to an ArcMap map document in the same way as we described in chapter 8
Materials and methods. The only difference is the location where the data are stored. In this case, you
have to pick the files from the geodatabase.
9.3.3 Transferring and synchronising data
9.3.3.1 Overview
In conjunction with ArcMap’s ArcPad toolbar, the Custom Toolbar also allows data to be output to and
input from a handheld device.
Getting data to a handheld involves only 1 step: use the ArcMap ArcPad toolbutton to “Get Data for
ArcPad” (see figure 91 below). This will prepare the base maps and aerial image and the sample
points to be sent to the PDA. It also flags sample points as being “Checked out for editing in ArcPad”.
This flagging process allows ArcMap to later check in the edited and added sample points and
reconcile any changes made to them with the main project geodatabase.
figure 91: ArcPad toolbar in ArcMap
Getting data from a handheld involves also only 1 step: use the ArcMap ArcPad toolbutton to “Check
in Edits from ArcPad” (see figure 91 above). This step utilizes ArcMap’s ArcPad tools to reconcile any
sample points that were edited in ArcPad with the main ArcMap project geodatabase.
9.3.3.2 Getting data from ArcView to ArcPad
•
Cradle the PDA and wait for all synchronization to finish (monitor the Active Sync window to
verify that the device has synchronized).
•
Zoom to a given work area that you would like to take into the field. Recall that smaller areas
are less taxing on the PDA’s resources.
•
Click the “Get Data for ArcPad” button, and the following dialog box appears:
The use of ArcPad and ArcGIS in forest management
126
figure 92: Get Data for ArcPad screen 1
•
You will see the SampleData layer and any other base map layers listed (see figure 92
above). Check the layers you will need in the field on the PDA and then click the Next
(“Volgende” in Dutch) button.
figure 93: Get Data for ArcPad screen 2
•
The ensuing, critical dialog box (see figure 93 above) allows you to choose which database
will be “Checked Out for Editing”. Make sure you select the SampleData layer from the project
geodatabase. Click “Next” to continue to the next step.
The use of ArcPad and ArcGIS in forest management
127
figure 94: Get Data for ArcPad screen 3
•
The last dialog box that appears (see figure 94 above) allows you to verify if the current
display extent is to be output to ArcPad. Also make sure that the “Only get selected features”
checkbox is NOT selected here. Verify that the “Create an ArcPad Map (.apm) file” checkbox
is checked. You can also browse to an output location to store the ArcPad data folder. The
folder’s default name is DataForArcPadx where x is some number. For auto synchronization
with
in
your
general:
handheld,
C:\documents
your
and
target
settings\
folder
username\my
storage
location
will
documents\pocketpcname
be
My
under:
Documents
in our case: pocketpcname is MobileMapperCE
•
Click [Finish] ([Voltooien] in Dutch) and if everything’s successful, you get report like this
(figure 95):
figure 95: Get Data for ArcPad Report
The use of ArcPad and ArcGIS in forest management
128
9.3.3.3 Getting data from ArcPad back to ArcView
•
Cradle the Handheld and wait for all synchronisation to finish (monitor the Active Sync window
to verify that the device has synchronised).
•
Start an ArcMap Editing Session by clicking Editor > Start Editing on the ArcMap Editor
toolbar. (You may have to under View Menu > Toolbars to turn on the Editor toolbar.)
•
Click the “Check In Edits From ArcPad” toolbutton and the following dialog box (see figure 96
below) allows you to select the proper PDA ArcPad “Check Out Session”. Check
“SampleData” and click [Check In].
figure 96: Check In Edits from ArcPad window
•
Click “Yes” (“Ja” in Dutch) on the resulting verification request (see figure 97 below).
figure 97: Check In Edits from ArcPad verification request
After a successful Check In operation you get an “Operation successful”-message. Check in process
is finished after you save the edits.
The use of ArcPad and ArcGIS in forest management
129
9.3.4 Collecting data
This process is very similar to the one described at paragraph 9.2.3 Fieldwork possibility 1.
9.3.4.1 Get the PDA ready
Follow the same steps as mentioned in 9.2.3.1 Get the PDA ready under Fieldwork possibility 1.
9.3.4.2 Adding a new sample point to the layer
Once the PDA is ready to operate in the field, you can walk through the forest to take samples.
•
Once you chose the place where you want to take a sample, check the number of the
compartment where you are now. This can be done by using the identify button and then
clicking the compartment where your GPS marker is in.
•
Click the GPS point icon to add a sample point on the current GPS coordinates.
•
The Feature Properties window will pop up. You can now fill out the attribute form. Click on the
desired property and the input panel will appear to enter a value (figure 98).
figure 98: Feature Properties form when adding a new point
•
After entering al the values, click OK. The new sample point is added to the SampleData
layer. Back on the main screen, you will see that a point is added.
9.3.4.3 Changing the attribute data of previously captured points
This process is the same as the one in 9.2.3.3, the only change is the look of the table. In this way of
working, you don’t see a long attribute table. In fact ArcPad generates a very clear form, as seen in
figure 98 above.
The use of ArcPad and ArcGIS in forest management
130
Chapter 10 Project testing phase
10.1 Forest test 1
10.1.1 Field work report
Before we could do some practical things, we need to make the PDA ready. This part consisted of
transferring the aerial images into the right format so that they can be read by the PDA (ESRI-format),
database (already filled in) and making a new layer to put the sample points on. This is all described in
the two chapters before. After preparing the PDA, we went to the forest for some first measurements,
to collect data.
With the help of a Finish student we managed to understand more about forest sampling and forestry
in general. He started to show us some basic things we knew from the theoretical part, but only now
came clear.
There are a few measurements that are important for getting al the data needed (here in our project
only the most important measurements are used to put in the database, because forestry is in fact
‘just’ an application to test the use of ArcPad-ArcGIS & the PDA-GPS).
We started with picking a good point to make a first sample plot. To do this you need a trained eye to
take a point that positions in a mean part of the forest, so the most global data is gathered (a place not
near the border, mixed trees, a point that resembles the consistency of the forest in a true way). When
we found a good point, the fellow student showed us the use of the relascope, which we only knew
from the theory.
figure 99: The relascope we used in the forest
The use of ArcPad and ArcGIS in forest management
131
figure 100: Detail of the slot of the relascope
We tried to use the relascope on the sample point, and it worked quite well (for the information about
the working of the relascope; see the chapter about forestry: count all the trees that fit in the slot on
the relascope). We found some values that were possible, when u compare them with the given
values in the existing database.
After counting the trees with the relascope, we had to look for a tree in the sample plot that was about
the mean tree, and which gave a good example of the sample plot. This tree was important for the
diameter at breast height, which was measured with a tree calliper, from which u could read directly
the diameter on the curved part of the device (and the surface of the section on the silver table).
The use of ArcPad and ArcGIS in forest management
132
figure 101: The tree calliper
The chosen tree was also important for the height.
We first had to pick a point at a certain distance of the tree (at least 10m – the further the point, the
accuracy will improve). This distance was measured with a normal roll meter.
figure 102: Measuring the distance to the tree
To determine the height of the tree, we used a little device (6 x 4,5 x 2 cm – 50g), called Haglöf
Electronic Clinometer (Swedish brand), which has a built-in display.
The use of ArcPad and ArcGIS in forest management
133
figure 103: The Haglöf Electronic Clinometer
With this device measuring the height of the tree was simple, quick and accurate. The use of this kind
of clinometers eliminates counting errors when using formulas to define the height of the tree. We had
to input the distance to the tree, than point towards the birth point of the tree (point above the crotch –
few decimetres above the ground) and than point the device to the top of the tree and fix.
figure 104: Pointing towards birch point & top of the tree
Now we could read the accurate height of the tree directly from the screen.
figure 105: The display of the Clinometer – direct reading of the height
The use of ArcPad and ArcGIS in forest management
134
Once we knew this information (number of trees trough the relascope, diameter at breast height and
height) we could calculate the other data to put in the database (timber volume, number of stems,…)
What is more important for us was the use of the GPS receiver and the database, the forestry part was
just to provide us with some data.
During the use of the PDA while forest sampling and entering the data, we had some issues. Globally
the PDA worked perfectly, but there were some small things which could be improved, making the use
of the programs and the input easier and faster.
10.1.2 Issues
Here is a little enumeration of the issues we found:
•
The size of the maps and aerial images is too large, which makes the PDA slow, especially
when you have to zoom in/out or move the images. This is quite irritating and slows down the
work when walking around and taking sample points.
In this case we thought we used only a small part of the aerial image and the map to cover the
area we needed for the test and even then the files are too big. The aerial image was already
14 Mb large. This made us thinking and zooming to the full extent of the ArcPad layer
confirmed our ideas: the shapefile is packed to the current extent, but the images are exported
in full extent. Later on, we saw it was mentioned in the ArcPad Map Wizard (see figure 64 in
chapter 8).
The size of the images makes the device not only slow, but also the memory is quite small
(128 Mb internal – SD card 32Mb), so there are not many images that can be saved on the
memory. Or there would be the need to buy larger (and fast) SD memory cards, which would
make everything more expensive. If you would measure a whole day, the memory is not
sufficient to fit all the maps and aerial images.
A solution for this problem could be to resize the pictures in a way that the quality is not
affected and still sufficient for the use on the PDA. When the size would be smaller, the
zooming and moving will be faster and thereby the use of the PDA in general. More images
could be saved on the provided memory, so a bigger area can be covered, which makes the
autonomy of the device larger.
The use of ArcPad and ArcGIS in forest management
•
135
Another thing we noticed was that the compartment layer was not transparent, so when you
put the compartment layer on you only see the compartments as a white area on top of the
aerial images. This is not easy, because in this way you miss all the information from the
aerial image of the compartments, such as forest structure, roads, small waterways, etc…
The compartments should be transparent, so you would see the aerial image or map. So the
only thing what should be seen, should be the borders of the compartments. We don’t know
yet how to solve this problem.
figure 106: The compartment layer is not transparent
•
During the measuring, we could easily create a new point on the layer and input the data in
the database. The only problem with the database was, when we closed it (after input) we
couldn’t change or complete the database. Clicking on the sample point gave us the list, but
this was uneditable. This should be arranged, so when you forget something you can enter it
into the database.
•
Another issue with the database is that it’s too large, there are too many columns in it (for this
project). This makes the whole system slower again, and also the ease of use is affected,
because you have to scroll the whole time. A solution for this problem could be to just delete
the rows we don’t need, and only save these who are necessary for this project.
The use of ArcPad and ArcGIS in forest management
•
136
The GPS receiver was quite accurate, and had a good view of the satellites, even under tree
canopy. The only problem with the GPS receiver was that it couldn’t fix its position while
walking through the forest (see figure). When we stopped (to take a sample plot), the receiver
fixed immediately its position, so we didn’t have to wait. We consider this not as an important
problem.
figure 107: The message on the PDA when there was no position fix
•
exporting the files back from the PDA was our last issue during the first test. When we start up
ArcMap, we only found export wizards, no import wizards to find, anywhere. The only way we
could get the data in ArcMap again was doing a normal copy and paste from the PDA’s data
folder to the PC. It worked out, but we know this is an non-catholic way. As long as you’re
working with normal files in a folder, it is works fine, but the moment the project gets bigger
and bigger and you’re using a geodatabase, the troubles will start to arise. In fact, how could
you copy and paste the ArcPad files to a geodatabase?
Considering all these (smaller) problems, we can improve the system bit by bit, making it better
and faster, so we can do more tests in an easy way.
10.1.3 Solutions
Although the problems we had during the first test are quite small, they needed a solution. We
browsed around through the ArcPad manual and found for every ArcPad problem, except of the GPS
fix, a solution. Some were more catholic than others, but we solved all problems.
In this first test, we had all the single files organised in one folder and we used the way of working
(except for some minor differences that caused the issues mentioned above) as described in the
previous chapter under 9.2 Field work possibility 1. This way worked out, but we felt that it wasn’t the
right way of working. The aerial images stay too big, you have to change the symbology of the
arcview_kuvio layer every time you load new data into the PDA. So, we were quite sure that there’s
another way to use ArcPad. Browsing through the manual didn’t help us further. Next step was
messing around in ArcMap and exploring all the toolbars. There we found out that there’s another
ArcPad toolbar. The reason we didn’t saw it before, is the fact that it disappears from the screen every
time you start up ArcMap but it stays marked as on in the pull down menu. Switching it off and on
The use of ArcPad and ArcGIS in forest management
137
again makes this toolbar again visible. This discovery lead to the field work possibility 2 as mentioned
in the previous chapter. This methods helped us a lot more forward and fixed all the problems except
the GPS fix problem, which is not really a problem because the GPS finds his fix back quite quickly
10.2 Forest test 2
After finding the solutions for the issues we had in the first test, we could go into the forest for a
second test. This time we went alone in the forest, without help of a student, because we already know
how to take samples in the forest.
We started to walk around the compartments and took some sample plots in all compartments, to
have a good view of the trees in the compartments. It was easier to see now, because the
compartments are now transparent, so you can see the underlying map or aerial image. Everything
went fine, once we got some routine in taking the samples, it went quite fast. Now the database was
easier to fill in and more clearly; only the things we needed (for this project) were in the table, so we
didn’t had to scroll down the whole time. When we had enough data for the test, we could return.
The only things we could remark were some minor things; the lines (which are the borders of the
compartments) that were too thick (it was less clear when not zoomed in totally), and also the sample
points were too large, so we can make them smaller. Also the keyboard that appears on the touch
screen when you want to input some value in the table, is quite stodgy. It covers a big part of the
screen, so when u want to type something in the table, sometimes that keyboard covers the table.
You can put it of, but if you click the table it flips on. You can also move it across the screen, but it still
stays stodgy.
Now we have the data we can use it and incorporate it into the project.
The use of ArcPad and ArcGIS in forest management
138
10.3 GPS performance test
We performed a little accuracy test with the GPS receiver. It basically existed out of two parts; first one
was to test the difference between accuracy in holding the receiver horizontally or vertically, the
second test was to measure two points each 9 times and check the differences between the results.
For the first test (difference in accuracy between holding the GPS receiver horizontally or vertically),
we walked down the border of a sidewalk, and let the GPS place one point each other and let it put
into a polyline, and this both holding the receiver horizontally and vertically. The problem here is that
we don’t know which one is the correct position, and we only did one measurement in each position.
Horizontal vs. vertical position
You can see that there is a difference between both lines, but when you would hold the GPS receiver
in the same position and walk the border of the sidewalk twice, you would also have a different line.
So we can say that this test is not worth to be taken into account.
The second test existed of measuring two different points each 9 times, and compare the results.
The points were next to the school, so quite close to building and thus more vulnerable for multipath
errors.
The first point was measured ten times per time we were standing on the point - internally, before it
fixed it position - you can adjust it in the configuration of the GPS receiver. The second point was
measured 20 times, every of the nine times we were on the point.
The use of ArcPad and ArcGIS in forest management
139
Performance test of two points
When you take a look at the figure, you can clearly see which one of the two points was measured
twenty
times
per
point
by
the
GPS
receiver,
and
which
one
only
ten
times.
The point on the left (point A) was measured twenty times, the one on the right (point B) only ten
times. You can clearly see that the accuracy is much better in the point that has been internally
measured twenty times.
When you take a look at point B, you can clearly see that there are two points which are quite at a long
distance from the mean point B (take a look at the scale bar). Now it’s no problem, because we have
some other measurements that show us that these two are not really reliable. But when u only have
that measurement as an only point, it’s not correct!
The measurements at point A are denser, because the GPS took the double of points (twenty instead
of ten). There is also only one point that differs a lot from the position of the others.
In the table you can find the exact X and Y coordinate positions of the measurements. Also the mean
value and the standard deviation are calculated. You can clearly see in point B that there is a value
which differs a lot from the others (highlighted in red), and that’s why that standard deviation is very
large. When you let the worst point out, you can clearly see that de standard deviation is much more
less than with that point.
The use of ArcPad and ArcGIS in forest management
Coordinates:
1
2
4
5
6
7
8
9
10
Mean value:
Standard
deviation:
140
Point B
X
(10
times
before fix)
Y
Point A
X
(20
times
before fix)
Y
3330126,256
3330127,199
3330118,708
3330124,651
3330125,644
3330112,018
3330084,727
3330121,637
3330124,097
6826071,253
6826074,603
6826076,653
6826076,912
6826070,053
6826065,899
6826067,528
6826073,59
6826073,706
3330082,324
3330077,37
3330080,506
3330080,056
3330080,287
3330080,974
3330081,25
3330081,572
3330081,565
6826089,021
6826101,706
6826093,144
6826092,785
6826093,339
6826088,989
6826089,561
6826092,014
6826091,646
3330118,326 6826072,244
3330080,656 6826092,467
13,455
3,857
1,424
3,872
5,046 > without measurement nr 8 (large difference)
figure 108: Coordinate table
After this little test, you can clearly see that the amount of measurements the GPS takes before it fixes
a point, is decisive for the quality and accuracy of the result.
The use of ArcPad and ArcGIS in forest management
141
Chapter 11 Further developments
In the previous chapters, we proved that, if you skip the manual and find the right tools, ArcPad is a
performing piece of software that makes the fieldwork lots easier. In this chapter, we describe some
techniques and theories about things we didn’t, wanted or couldn’t realise because of lack of
knowledge or lack of time.
11.1 ArcPad application builder14
ArcPad Application Builder is the development framework for ArcPad. With the Application Builder you
can program custom toolbars, and custom data collection forms. This makes the fieldwork lots and lots
more effective.
With ArcPad Application Builder you can:
•
design custom forms to streamline data collection and ensure data integrity in the field;
•
create new toolbars that contain built-in and custom tools;
•
build applets for field specific applications and tasks;
•
write scripts that interact with ArcPad software's internal objects;
•
develop extensions to support new file formats, GPS receivers, rangefinders, cameras,
projections, and datum transformations;
Many of the customisation tasks in ArcPad are performed directly using ArcPad Studio and require
little or no programming. For more complex tasks, ArcPad exposes an extensive object model that can
be accessed by writing VBScript or JScript code. Developers can build custom applications within this
environment and deploy them on numerous ArcPad software-based devices in their organisations.
With ArcPad Application Builder, you can
•
improve the accuracy of GIS data collected in the field;
•
convert paper-based field data forms, permits, and reporting methods into mobile GIS
applications;
14
http://www.esri.com/software/arcgis/arcpad-appbldr/index.html
The use of ArcPad and ArcGIS in forest management
142
•
increase the efficiency and effectiveness of field-workers;
•
tailor ArcPad applications to user skill levels;
•
automate ArcPad tasks and processes;
•
extend GIS capabilities to field-workers;
•
incorporate other technology such as digital cameras, rangefinders, and monitoring devices.
In our case, the ArcPad Application Builder would do a great job for data collection if we can program
a custom data collection form. For sure a custom toolbar will be very useful and creates more space
on the screen and eliminates all buttons we don’t really need while taking sample data. Maybe a
module to calculate the new compartment data on the field can be a good idea, although this is also
possible in ArcView.
figure 109: Custom form made with ArcPad Application Builder (source ERSI)15
Detailed
information
on
the
ArcPad
Application
http://www.esri.com/software/arcgis/arcpad-appbldr/index.html
Builder
can
and
case
be
found
studies
at
at
http://www.esri.com/software/arcgis/arcpad-appbldr/about/case-studies.html.
11.2 ArcView techniques
We described the forest management process with the help of a GPS-enabled PDA in previous
chapters (chapters 8 and 9) and above we explained how we can increase the productivity in the field.
That only leaves ArcView to make improvements in the data collection and management process. And
15
http://www.esri.com/software/arcgis/arcpad-appbldr/about/forms.html
The use of ArcPad and ArcGIS in forest management
143
there can be made quite a lot of improvements in fact. These improvements are all located in the field
of programming macro’s to make frequent steps easier.
11.2.1 Check in / check out macro
The check in / check out process could be made faster and easier and more automated. Every time
you check in or check out data, you have to fill out the same fields, probably with the same names,
and mark the same check boxes. This asks for automation. With the use of one form where you have
to fill out the export folder name (this can’t be the same every time if you have more ArcPad sessions
running at the same on different PDA’s) or, in the case of importing data, a single form where you can
select the right folder, this steps can be made lots faster.
11.2.2 Calculation macro’s
After collecting data all the new sample points should be used to calculate (updated) compartment
data. Now we had to do it by hand, this can be programmed in a single “update compartment data
macro.”
11.2.2.1 Structure for this macro
1.
To build this macro, we have to add an extra column to the SampleData layer with a title as
calculated. This can be checked or text set to “done” if the sample data of a point are added to
the compartment data.
2.
Check which sample points are not yet added = get the rows where the field “calculated” is not
equal to “done.”
3.
Take the first unadded sample point
4.
Get the compartment where the sample point is taken = point-in-polygon query.
5.
Recalculate all the data and change the compartment data.
6.
Set the “calculated” field to “done.”
7.
Take the next point and go back to step 4 until all points are calculated.
The use of ArcPad and ArcGIS in forest management
144
11.2.3 Tforest functionality
All functionality that is available in Tforest should be translated to ArcView, probably in the form of
macro’s.
11.3 Databases
When the project grows bigger and when data of other regions of the country are needed, there will
come the need for more advanced database techniques, as we described in chapters 4 and 5. This
will enable every forest management centre to share data with other centres and get data from other
centres. Aerial images, base maps and GT maps can be shared across Finland.
11.4 MobileMapper Beacon16
The MobileMapper Beacon is a Bluetooth-enabled wireless differential correction receiver that
improves the real-time positioning accuracy of GPS receivers by providing DGPS corrections.
Specifically designed for Thales mobile mapping solutions, and compatible with most other GPS
receivers, MobileMapper Beacon provides access to standard RTCM SC-104 DGPS corrections
broadcast by beacon networks around the world. It can be easily connected to your GPS receiver
using the integrated Bluetooth® wireless technology or the included serial cable.
figure 110: MobileMapper Beacon
16
http://products.thalesnavigation.com/en/products/product.asp?PRODID=1022
The use of ArcPad and ArcGIS in forest management
145
11.5 GPSDifferential for ArcPad17
GPSDifferential™ for ArcPad® adds the power of post-processing to your ESRI® ArcPad software on
MobileMapper™ CE. This extension software offers integration of ArcPad and the included
MobileMapper Office suite to provide reliable, sub-meter, post-processed positioning data results,
according to Thales.
GPSDifferential for ArcPad automatically logs raw GPS measurement data in the field for postprocessing back in the office. With GPSDifferential for ArcPad you can always acquire the most
accurate data for all your GIS and mapping needs even where real-time differential corrections are not
available.
The MobileMapper CE offers proven real-time, sub-meter positioning accuracy. Now the postprocessing option provided by the ArcPad extension makes sub-meter mapping possible in areas
where real-time differential corrections are unavailable. The logging of raw data required for postprocessed differential correction happens behind the scenes of ArcPad without interrupting your
workflow. Back in the office, MobileMapper Office post-processes the data and enables export to
shapefiles or other industry standard formats.
figure 111: GPSDifferential for ArcPad
17
http://products.thalesnavigation.com/en/products/product.asp?PRODID=1225
The use of ArcPad and ArcGIS in forest management
146
Conclusions
Our conclusion will exist of two parts, one for Belgium and one for Finland, because they both have
different purposes with the thesis.
The intention of our thesis for Belgium was to test the possibilities from the PDA-GPS and the
combination ArcPad-ArcGIS. We can conclude that the performance of the GPS is sufficient. Maybe
some more practise to make it more exact; the quality of the device is very good and the possibilities
of the PDA are almost unlimited. We strongly suggest to procure the Application Builder from ESRI,
because this makes the use easier and faster in bigger projects.
In Finland the most important purpose of our thesis was to digitalise the forest management system,
and to see if it’s possible to use ArcGIS (in combination with ArcPad) to put up the database and to
administer all data, aerial images, maps, etc… Finland, on national level, wants to change their
existing, more out of date, forest management system, called Tforest into the more universal ArcGIS
system. If we put this together with all the possibilities of databases, ArcGIS can serve as a great base
for a national forest management system where all national files can be kept in one place. In that way,
a huge amount of storage space can be saved because there won’t be double files anymore.
This in combination with GPS receivers is completely new. We tested some things and found out that
it makes forest management not only quicker (once programmed), but also more accurate, easier to
use and re-use the data, to import everything to the network (no paper and pen, no more overflowing
writing and typing), etc…
In general we can state that the combination PDA-GPS receiver is a good and useful invention, in this
case specially for mobile GIS purposes. Also the use of ArcPad and ArcGIS is a good combination
and gives a lot of opportunities.
For the future we are quite sure that the use of these devices will increase a lot and also quality and
compactness will enhance. It is a good thing to let students work with PDA-GPS, because these are
the devices for the (nearby) future.
Also the use of ArcGIS (and ArcPad) instead of the Tforest program here in Finland will be well
possible, and it will make it only better, quicker easier to use and more universal (which will help for
the overall knowledge of the people who use it).
The use of ArcPad and ArcGIS in forest management
147
We would like to end with saying that the future of these devices and ArcPad/ArcGIS is bright, and that
not all things have been said about the subject, there is much room for extension, further development
and more investigation and exploration to improve the future of GIS and PDA/GPS-receivers. You can
see this as a beginning, an introduction into a fascinating new world of digitalised and compact use of
GIS, anywhere at anytime.
The use of ArcPad and ArcGIS in forest management
148
References
Alberda, J.E. and Ebbinge, J.B. (2004): Inleiding Landmeetkunde (In Dutch). p 203-207.
Baldegger, J. and C. Giger (2003). Wearable GIS: A smart assistant in disaster management [On-line].
Swiss federal institute of technology Zurich. Available from
http://www.geoit.ethz.ch/staff/PDF/Joachim/2003_agile_baldegger.pdf; accessed 10 October 2005.
Beard, K.M., Buttenfield, B.P. and B.S., Clapham (1991) NCGIA Research Initiative 7 Visualization of
spatial data quality [On-line], NCGIA. Available from
http://www.ncgia.ucsb.edu/Publications/Tech_Reports/91/91-26.pdf; accessed 22 February 2006.
Binkley M.R. (2004). Tree management system for ArcMap [On-line]. Davey Resource Group.
Available from http://www.davey.com/pdf/TMS_ArcMap.pdf; accessed 15 April 2006.
Boehme, L. (2005) Geo-informatica (in Dutch), Lecture handout, KHBO.
Chrisman, N.R. (ed.) Accuracy of spatial databases [On-line]. NCGIA. Available from
http://www.geog.ubc.ca/courses/klink/gis.notes/ncgia/u45.html#SEC45.1; accessed 12 February 2006.
Coors, V. and U. Jasnoch (1999). Using wearable GIS in outdoor applications [On-line]. CG. Available
from http://www.inigraphics.net/press/topics/1999/issue2/2_99a04.pdf; accessed 21 November 2005;
Corbley, K.P. (2003). Mobile GIS improves data collection [On-line]. ESRI. Available from
http://www.esri.com/news/arcuser/0103/elephants1of2.html; accessed 14 February 2006.
Couclelis, H., Board, K. and W. Mackaness (1992) Two perspectives on data quality [On-line]. NCGIA.
Available from http://www.ncgia.ucsb.edu/Publications/Tech_Reports/91/92-12.pdf, accessed 1
December 2005.
de Montalvo, U.W. ‘Outreach and capacity building’ in Douglas D.N. (2000). Devoloping spatial data
infrastructures: the SDI cookbook [On-line]. Geospatial Data Infrastructure Association. Available from
http://www.gsdi.org/pubs/cookbook/ accessed 20 February 2006.
Devillers, R. (2004). Conception d’un système multidimensionnel d'information sur la qualité des
données géospatiales (in French) [On-line], Université de Marne-la-Vallée ; Available from
http://www.theses.ulaval.ca/cocoon/meta/2004/22242.xml; accessed 23 February 2006.
The use of ArcPad and ArcGIS in forest management
149
Doyle, S. and M. Daly. Enabling Distributed GIS . OpenGIS in the Real World [On-line]. Cadcorp Ltd.
Available from http://www.cadcorp.com/pdf_downloads/TPOpenGIS%20in%20the%20real%20world.PDF; accessed 8 February 2006.
Egenhofer, M.J. and Kuhn,W. (1998). Beyond Desktop GIS, Proceedings of GISplanet 98, Lisbon,
Portugal. Available from http://www.igd.fraunhofer.de/igda5/press_media/topics/1999/wearable_gis.pdf; accessed 24 February 2006.
Ellum, C.M. (2001). The development of a backpack mobile mapping system [On-line]. University of
Calgary. Available from http://www.geomatics.ucalgary.ca/Papers/Thesis/NES/01.20159.CEllum.pdf;
accessed 30 November 2005.
François, J. (2005). Het GPS-systeem (in Dutch). Topografie, KHBO Ostend.
Gates, B. (2000) Wireless 2000 Conference.
Harrington, A. and Lauer G. (2000). Mobile GIS: using your enterprise GIS in the field [On-line]. GIS
development. Available from
http://www.gisdevelopment.net/technology/mobilemapping/techmp007pf.htm; accessed 6 March 2006.
Heywood, I., Cornelius, S. and Carver, S. (2002). An introduction to geographical information systems.
Pearson Prenctice Hall.
Hunter, A.J.S. (2002). Mobile GIS as if field users mattered: Small is ubiquitous but can speech be
recognized? [On-line]. University of Calgary. Available from
http://www.geomatics.ucalgary.ca/Papers/Thesis/NES/02.20165.AHunter.pdf; accessed 28 November
2005.
Joshi, M.D. and R. Sivakumar. Analysis for quality control in database input for making GIS [On-line],
GIS development. Available from
http://www.gisdevelopment.net/policy/india/technology/mi03007pf.htm; accessed 10 February 2006.
Keating, G.N., Rich, P.M. and Witkwoski, M.S. (2003) Challenges for Enterprise GIS. URISA Journal
[On-line], 2 (15), Available from http://www.urisa.org/Journal/Vol15No2/Keating.pdf; accessed 10
February 2006.
Keating, G.N., Rich, P.M. and Witkwoski, M.S. (2003) A prototype for Enterprise GIS [On-line]. Los
Alamos National Laboratory Report. Available from http://gislab.lanl.gov/docs/LA-14027.pdf; accessed
11 February 2006.
The use of ArcPad and ArcGIS in forest management
150
Longley, P.A., Goodchild, M.F., Maguire, D.J. and Rhind, D.W. (2005). Geographic Information
Systems and Science, John Wiley & Sons.
Mann, S. (1998) Wearable Computing as means for personal empowerment, Proceedings of the 1998
International Conference on Wearable Computing, Fairfax, Virginia [On-line]. Available from
http://wearcam.org/icwc/empowerment.html; accessed 8 March 2006.
Montoya, L. (2003). Geo-data acquisition through mobile GIS and digital video: an urban disaster
management perspective. Environmental Modelling 18 (10).
Nusser, S.M., Miller, L.L., Covert, G.F., Goodchild M.F. and K.C., Clarke (1999). Collecting and using
geospatial data in the field: An extensible framework and testbed [On-line]. NSF. Available from
http://hobu.stat.iastate.edu/dg/research/funding/nsfproposal.pdf; accessed 21 November 2005.
Nusser, S., Miller, L, Clarke, K. and M. Goodchild (2001). Geospatial information technologies for
mobile field data collection [On-line]. Available from
http://hobu.stat.iastate.edu/dg/papers_presentations/pdfs/nusser_et_al_acm_paper.pdf; accessed 21
November 2005.
Oksanen-Peltola, L., Paananen, R., Schneider, H. and Ärölä, E (1996). Solmu Field Manual. Forest
Development Centre Tapio.
Pendleton, G. (2003). GPS/GIS integration [On-line]. GEO World, Available from
http://www.geoplace.com/gw/2003/0305/0305gint.asp; accessed 14 february 2006.
Pundt, H. (2002). Field data collection with mobile GIS: Dependencies between semantics and data
quality. GeoInformatica 6 (4).
Ramsaran, R.M. (2002). Development of a mobile equipment management system [On-line].
University of Calgary. Available from
http://www.geomatics.ucalgary.ca/Papers/Thesis/YG/00.20146RMRamsaran.pdf; accessed 28
November 2005.
Rich, S., Das, A. and K. Christopher, Spatial data management in an Enterprise GIS [On-line]. Maine
Department of Environmental Protection. Available from
http://gis.esri.com/library/userconf/proc01/professional/papers/pap742/p742.htm; accessed 11
February 2006.
Van Maercke, R., Kwaliteitsmanagement (in Dutch), Lecture handout, KHBO.
The use of ArcPad and ArcGIS in forest management
151
von R Meyer, Nancy and Scott Oppmann, R. ‘Enterprise GIS Introduction’. In: Enterprise GIS Eds: von
R Meyer, Nancy and Scott Oppmann, R. [On-line] URISA. Available from
http://www.urisa.org/store/table_of_contents/enterprise_gis.pdf; accessed 11 February 2006.
Wadhwani, A. Recent advances in mobile GPS/GIS mapping technology [On-line]. GIS development.
Available from http://www.gisdevelopment.net/technology/mobilemapping/techmp005pf.htm; accessed
20 June 2005.
Wahi, R.C. (2000). Managing GIS projects [On-line]. GIS development. Available from
http://www.gisdevelopment.net/technology/gis/techgi0041pf.htm; accessed 10 February 2006.
Xiao, B., Zhang, K., Grenfell, R. and T. Norton (2002). Handheld GPS – Today and tomorrow [Online]. FIG XXII International Congress. Available from http://www.fig.net/pub/fig_2002/Ts513/TS5_13_xiao_zhang_etal.pdf; accessed 28 November 2005.
Young, R.A. and Giese, R.L. (2003). Introduction to forest Ecosystem Science and Management (3rd
edition). John Wiley & Sons, 560 p.
Yrjölä, T. (2002). Forest management guidelines and practices in Finland, Norway and Sweden.
European Forest Institute Internal Report no. 11. European Forest Institute.
Zahran, M. (2004). Mobility Revisited for the Enterprise. Available from
http://www.directionsmag.com/article.php?article_id=599; accessed 31 December 2005.
Zhong-Ren, P., Groff, J.N. and K.J. Dueker (1998). An enterprise GIS database design for agencywide transit applications. URISA Journal [On-line], 2 (10). Available from
http://www.urisa.org/Journal/protect/vol11no1/agencywidetransit.htm; accessed 11 February 2006.
ESRI: Mobile GIS [On-line]. Available from
http://www.esriuk.com/products/ArcGIS/overview_mobileArcGIS.asp; accessed 19 November 2005.
ESRI: About ArcPAD [On-line]. Available from http://www.esri.com/software/arcgis/about/arcpad.html;
accessed 19 November 2005.
ESRI: Mobile GIS in Forestry [On-line]. Available from
http://www.esri.com/industries/forestry/business/timber_stand.html; accessed 19 November 2005
Forest measurement and resources [On-line]. Available from
http://sres.anu.edu.au/associated/mensuration/overview.htm; accessed 26 February 2006.
The use of ArcPad and ArcGIS in forest management
152
Finland's Sustainable Indigenous Forest Management and Economy [On-line]. Available from
http://homepages.caverock.net.nz/~bj/beech/pressrel/press12.htm; accessed 2 March 2006.
FreeFlight Systems: GPS control [On-line]. Available from www.freeflightsystems.com/
gps_control.htm; accessed on 5 November 2005.
Garmin: What is GPS? [On-line]. Available from http://www.garmin.com/aboutGPS/; accessed 23
November 2005.
GISLab Information Management [On-line], GISLab, Available from
http://gislab.lanl.gov/info_mgmt.html; accessed 20 February 2006.
Haglöfs Sweden: Clinometer [On-line]. Available from
http://www.haglofsweden.com/products/hec/index.asp# ;accessed 19 March 2006.
Howstuffworks.com: How GPS receivers work [On-line]. Available from
http://electronics.howstuffworks.com/gps.htm; accessed 27 October 2005.
Location-based services [On-line]. Mobile in a minute. Available from
http://www.mobilein.com/location_based_services.htm; accessed 15 February 2006.
Meta education project [On-line]. University of Wyoming. Available from
http://www.sdvc.uwyo.edu/metadata/why.html; accessed 23 February 2006.
OnStar [On-line]. Available from http://www.onstar.com; accessed 15 February 2006.
Server GIS [On-line]. ESRI. Available from http://www.esri.com/software/arcgis/about/server.html;
accessed 3 March 2006.
Silva outdoor equipment: Relascope [On-line]. Available from www.silva.se/outdoor/
products/prof_intro.htm; accessed 27 February 2006.
Starlink Incorporated [On-line]. Available from
http://healthweb.ofs.gov.za/othersites/hwm/Medical%20Waste%20Management/Differential%20GPS_f
iles/dgpsexp.htm; accessed 13 November 2005.
Thales Navigation: MobileMapper CE Datasheet (2005) [On-line].
MobileMapper Office User Manual English revB (2005) [On-line]. Available from
http://products.thalesnavigation.com/assets/datasheets/MobileMapperCE_EN_l.pdf; accessed 17
November 2005.
The use of ArcPad and ArcGIS in forest management
153
Thales Navigation: Installing and Using ArcPad on MobileMapper CE (2005) [On-line]. Available on
http://products.thalesnavigation.com/assets/datasheets/Installing_and_Using_ArcPad_on_MMCE.pdf;
accessed 20 November 2005.
The What and Why of Farallon's Enterprise GIS Approach [On-line]. Farallon. Available from
http://www.fargeo.com/enterprise_gis/; accessed 18 February 2006.
Trimble Navigation: All about GPS (2005) [On-line]. Available from http://www.trimble.com/gps/;
accessed 27 October 2005.
University of Jordan: GPS systems [On-line]. Available from http://www.ju.edu.jo/; accessed 25
October 2005.
Wikipedia Encyclopedia: Personal Digital Assistant (2006, 20 April – last update) [On-line]. Available
from http://en.wikipedia.org/wiki/Personal_digital_assistant; accessed 12 February 2006.
The use of ArcPad and ArcGIS in forest management
154
List of appendices
1. Performance test in the forest
2. Translation compartment data
3. Quick-start tutorial ArcPad
4. Export summary
5. Map projection
Appendix I: performance test in the forest
Appendix II: Translation compartment data
Appendix III: Quick-start tutorial ArcPad
Appendix IV: Export summary
Summary
------Output Folder:
C:\ThesisProject\ToArcPad
Map Name:
Test02.apm
Projection:
Finland_Zone_3
Total File Size:
(20921 kb)
Total Layers:
4
Feature Layers:
2
Image Layers
2
Label Fonts:
Arial
Symbol Fonts:
ESRI Default Marker
Feature Layer Name: SampleData
Number of Features: 2
Size of -shp:
(1 kb)
-dbf:
(1 kb)
-shx:
(1 kb)
-apl:
(1 kb)
Feature Layer Name: arcview_kuvio
Number of Features: 9
Size of -shp:
(4 kb)
-dbf:
(4 kb)
-shx:
(1 kb)
-apl:
(1 kb)
Image Layer Name:
Size of -sid:
(14959 kb)
Image Layer Name:
Size of -sid:
image.sid
c212312.sid
(5948 kb)
Appendix V: Map Projection
KKJ – Finland Zone 3 (27°E); Gauß-Krüger; Hayford 1909 Ellipsoid
Name:
GCS_KKJ
Projection:
TRANSVERSE – Gauß-Krüger
Zunits:
NO
Units:
METERS
Spheroid:
INT1909
Xshift:
0.0000000000
Yshift:
0.0000000000
Parameters:
1.00000
(scale factor at central meridian)
27 00 00
(longitude of central meridian)
0 00 00
(altitude of origin)
3500000.00000 (false easting - meters)
0.00000
(false northing - meters)
Angular Unit:
Degree (0.017453292519943299)
Prime Meridian: Greenwich (0.000000000000000000)
Datum:
WGS84
Spheroid:
WGS84
Semimajor Axis: 6378388.000000000000000000
Semiminor Axis: 6356911.946127946500000000
Inverse Flattening: 297.000000000000000000