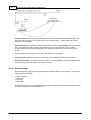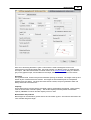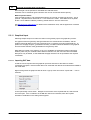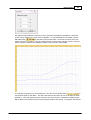
1
SlopeFE
Version 20.0
Oasys Ltd
13 Fitzroy Street
London
W1T 4BQ
Central Square
Forth Street
Newcastle Upon Tyne
NE1 3PL
Telephone: +44 (0) 191 238 7559
Facsimile: +44 (0) 191 238 7555
e-mail: [email protected]
Website: http://www.oasys-software.com/
© Oasys Ltd. 2014
SlopeFE Oasys GEO Suite for Windows
© Oasys Ltd. 2014
All rights reserved. No parts of this work may be reproduced in any form or by any means - graphic, electronic, or
mechanical, including photocopying, recording, taping, or information storage and retrieval systems - without the
written permission of the publisher.
Products that are referred to in this document may be either trademarks and/or registered trademarks of the
respective owners. The publisher and the author make no claim to these trademarks.
While every precaution has been taken in the preparation of this document, the publisher and the author assume no
responsibility for errors or omissions, or for damages resulting from the use of information contained in this
document or from the use of programs and source code that may accompany it. In no event shall the publisher and
the author be liable for any loss of profit or any other commercial damage caused or alleged to have been caused
directly or indirectly by this document.
This document has been created to provide a guide for the use of the software. It does not provide engineering
advice, nor is it a substitute for the use of standard references. The user is deemed to be conversant with standard
engineering terms and codes of practice. It is the users responsibility to validate the program for the proposed
design use and to select suitable input data.
Printed: July 2014
I
SlopeFE Oasys GEO Suite for Windows
Table of Contents
1 Welcome to SlopeFE
1
2 What's New
1
3 Essential Background Theory
3
3.1
Method ...................................................................................................................................
of Slices
3
3.1.1 General Equations
......................................................................................................................................................... 4
3.1.1.1
Method of Iteration
.................................................................................................................................................. 5
3.1.1.2
Interlock .................................................................................................................................................. 5
3.1.1.3
Positioning ..................................................................................................................................................
of Slices
7
3.2
Bishop's...................................................................................................................................
Methods
7
3.2.1 Bishop's Sim plified
.........................................................................................................................................................
7
Method - Horizontal Interslice Forces
3.2.2 Bishop's Method
.........................................................................................................................................................
8
- Parallel Inclined Interslice Forces
3.2.3 Bishop's Method
.........................................................................................................................................................
8
-Variably Inclined Interslice Forces
3.3
Reinforcement
...................................................................................................................................
Calculations
8
4 Getting Started
12
5 Entering Data
18
5.1
New model
...................................................................................................................................
wizard
18
5.1.1
5.1.2
5.1.3
5.1.4
......................................................................................................................................................... 18
Titles Page
Materials Page......................................................................................................................................................... 19
.........................................................................................................................................................
20
Stratum Definition
Page
.........................................................................................................................................................
22
Slip Surface Definition Page
5.2
Importing
...................................................................................................................................
Slope files
23
5.3
Direct data
...................................................................................................................................
entry and editing
25
5.3.1 Titles
......................................................................................................................................................... 25
5.3.1.1
Titles Window
..................................................................................................................................................
- Bitmaps
26
5.3.2 Units
......................................................................................................................................................... 26
5.3.3 Specification ......................................................................................................................................................... 28
5.3.4 Material Properties
......................................................................................................................................................... 29
5.3.5 Perm eabilities ......................................................................................................................................................... 29
5.3.6 Water data
......................................................................................................................................................... 31
5.3.7 Strata
......................................................................................................................................................... 32
5.3.8 Slip Surface Definition
......................................................................................................................................................... 32
5.3.9 Surface Loads ......................................................................................................................................................... 34
5.3.10Reinforcem ent......................................................................................................................................................... 35
5.3.11Graphical Input......................................................................................................................................................... 37
5.3.11.1 Importing DXF
..................................................................................................................................................
data
37
5.3.11.2 Groundw ater
..................................................................................................................................................
boundary conditions
40
5.3.11.3 Mesh generation
.................................................................................................................................................. 41
6 Analysis and Results
42
© Oasys Ltd. 2014
Contents
II
6.1
Analysis
...................................................................................................................................
and Data Checking
42
6.2
Tabular...................................................................................................................................
Output
43
6.2.1 Sum m ary of Results
......................................................................................................................................................... 44
6.2.2 Full Results
......................................................................................................................................................... 45
6.3
Graphical
...................................................................................................................................
Output
47
6.4
Edit Graphics
...................................................................................................................................
Settings
48
7 List of References
7.1
49
References
................................................................................................................................... 49
Index
© Oasys Ltd. 2014
51
1
1
SlopeFE Oasys GEO Suite for Windows
Welcome to SlopeFE
SlopeFE is a new program which combines finite element steady state seepage analysis with
analysis of slope stability by traditional limit equilibrium methods. Soil reinforcement can be
included.
The main features are:
· The ground section is built up by specifying each layer of material, from the surface downwards,
as a series of x and y coordinates. The stratum information is then used to generate a 2D
problem domain, which is used to create the finite element mesh for steady state seepage
analysis.
· The strength of the materials is represented by specifying cohesion and an angle of shearing
resistance. Linear variations of cohesion with depth can also be entered. Material permeabilities
are also required.
· Fixed head, fixed flow or phreatic groundwater boundary conditions should be specified. Slopes
which are submerged or partially submerged can be analysed.
· The location of circular slip surfaces is defined using a rectangular grid of centres (optionally
inclined) and then either a number of different radii, a common point through which all circles must
pass or a tangential surface which the circle almost touches.
· Any combination of reinforcement, consisting of horizontal geotextiles or horizontal or inclined
soil nails, rock bolts or ground anchors, can be specified. The restoring moment contributed by
the reinforcement is calculated according to BS8006.
· External forces can be applied to the ground surface to represent building loads or strut forces in
excavations.
· Analysis first carries out a steady state seepage analysis, then uses the resulting pore pressures
in the soil mass as input to a method of slices limit equilibrium slope stability analysis.
· Output includes plotting of pore pressures and other water data, and display of the analysed slip
circles with their factors of safety against failure.
2
What's New
SlopeFE is a new program which combines finite element steady state seepage analysis with
analysis of slope stability by traditional limit equilibrium methods. Soil reinforcement can be
included.
The program introduces a new user interface with a ribbon menu and windows which can be docked,
floated on screen or minimised to the edge of the screen.
© Oasys Ltd. 2014
What's New
2
The ribbon contains all the commands available in the program, organised into tabbed groups. The
most frequently used commands are on the Home tab. Opening some views automatically switches
to show the tab most applicable to that view, but the tab can always be manually changed by the
user.
Some ribbon tabs are “context-sensitive” and only appear when specific views are open. These are
highlighted in a different colour at the top of the main screen.
The Gateway navigation view has links to the various data entry screens and output views. It is
“docked” to the left of the main view, but can be moved to another location, closed, or set to autohide if required. Setting auto-hide is done using the push-pin symbol at the top of the Gateway. It
will then minimise to the side of the main window unless you hover over the minimised view title bar.
The Gateway can also be closed or re-opened using a check box on the Home tab of the ribbon.
The “application button” at the top left of the main window takes the place of the File menu. Clicking
this button opens a menu with access to file operation commands (New, Open, Save etc.), some
view commands (Export, Print etc.) and quick access to recently opened files.
© Oasys Ltd. 2014
3
SlopeFE Oasys GEO Suite for Windows
3
Essential Background Theory
3.1
Method of Slices
The following provides details of the basic annotation and sign convention for the method of slices:
All forces are given as total forces (i.e. including water pressure).
F - Factor of Safety
Ph - Horizontal component of external loads
Pv - Vertical component of external loads
E - Horizontal Interslice Force
X - Vertical Interslice Force
W - Total weight of soil = g bh
N - Total normal force acting along slice base
R - Distance from slice base to moment centre
S - Shear force acting along slice base
h - Mean height of slice
b - Width of slice
L - Slice base length = b/cos a
© Oasys Ltd. 2014
Essential Background Theory
4
u - Pore pressure at slice base
a - Slice base angle to horizontal
x - Horizontal distance of slice from moment centre
y - Vertical distance of slice surface from moment centre
g - Unit weight of soil
c - Cohesion at base
f - Angle of friction at base
3.1.1
General Equations
The general expression to calculate the average overall factor of safety for a circular slip circle is:
Where
S = cL + (N - uL) tan f
and
N = (W + Pv + Xn - Xn+1) cos a - (En - En-1 + Ph) sin a
Note : As the factor of safety (F) is directly related to c and tan f, it is a factor of safety on material
shear strength.
For models which include soil reinforcement, the additional restoring moment contributed by the
reinforcement is added to the soil strength restoring moment. For details of the method of
calculation, see Reinforcement Calculations.
In addition other expressions for equilibrium are as follows:
For vertical equilibrium:
N cos a = W + Pv + (Xn - Xn+1) - (S sin a) / F
For horizontal equilibrium:
N sin a = (En+1 - En) – Ph + (S cos a) / F
For full details of notation see Theory of Slices.
© Oasys Ltd. 2014
5
3.1.1.1
SlopeFE Oasys GEO Suite for Windows
Method of Iteration
Slope uses iteration to reach convergence for each of the Bishop methods as follows:
Factors of safety
For each iteration i, Slope calculates a new factor of safety Fi using the ratio of restoring moment to
disturbing moment (which is a function of Fi-1). when the difference between Fi and Fi-1 is within the
specified tolerance, the calculation is complete.
The factor of safety, F, is the ratio of restoring moment to disturbing moment. However, this ratio is
itself a function of F, (except in the Swedish circle method) so an iterative solution is necessary.
Horizontal interslice forces
1.
2.
Slope starts at slice 1 (Note : Slices are numbered from left to right) and, by maintaining
vertical equilibrium it calculates the resultant horizontal force.
The program then uses this as the interslice force with slice 2. The process continues until the
last slice which ends up with a resultant horizontal force.
In this method each slice and the slope as a whole is in vertical equilibrium, with zero vertical
interslice forces. Horizontal equilibrium is not achieved within each slice or the slope as a whole.
Therefore the only force check within each slice is for vertical equilibrium.
Constant inclined interslice forces
In this method Slope varies the ratio (which is constant), between the vertical and horizontal
interslice forces, until the resultant of each is reduced to zero.
For this method each slice is not in equilibrium, only the slope as a whole. In the calculation
equilibrium is effectively maintained for each slice in the direction normal to the interslice forces.
Variably inclined interslice forces
The variably inclined method is superior as it keeps every slice in horizontal and vertical equilibrium
at all times. However, it can exceed the soil strength along the slice interface as it does not check
the vertical interslice forces against the shear strength of the material. The results should therefore
be checked for this criterion.
The interslice force is adjusted separately, for both the vertical and horizontal direction, by adding
the fraction of the residual values from the previous iteration. The fraction is determined by the
horizontal length of the slip surface represented by that slice. The interslice force direction can vary
by this method, but each slice is in equilibrium at all times as is the slope as a whole.
3.1.1.2
Interlock
Bishop (1955) pointed out that there are a variety of force distributions which will satisfy the
conditions of equilibrium. In many cases the assumption of horizontal or parallel inclined interslice
forces is reasonable and leads to sensible results.
© Oasys Ltd. 2014
Essential Background Theory
6
An important case where errors can occur for horizontal or parallel interslice forces, is that of
'interlock'. This arises in the case of a deep slip with a low factor of safety, where the toe of the slip
surface passes through a dense granular material.
If the deep slip emerges at a steep angle and has a high mobilised angle of friction fm where:
tan fm = (tan f) / F
Then the direction of the resultant force, R, on the base of the slice may be almost horizontal or even
pointing downwards.
In order to satisfy equilibrium of this slice the interslice force, X, must point upwards. This direction
is not consistent with the assumption of either horizontal or parallel inclined interslice forces.
In such cases the method of variably inclined interslice forces should be used.
© Oasys Ltd. 2014
7
SlopeFE Oasys GEO Suite for Windows
Note : Slope does not provide a warning when this problem may occur.
3.1.1.3
Positioning of Slices
Slope divides each slip mass into a number of slices. The resulting slice boundaries are located at
the following points:
·
·
·
·
·
at
at
at
at
at
the left and right hand extent of the slip surface.
the change in gradient of a stratum.
each slip surface/stratum intersection.
each slip surface/phreatic surface intersection.
the mid point of a slice whose width is greater than the average slice width given by:
(Xright – Xlef t ) / Minimum number of slices
3.2
Bishop's Methods
Bishop's methods (Bishop AW, 1955) are applicable to circular slip surfaces.
Three methods of solution are available. These are:
Horizontal Interslice Forces
Parallel Interslice Forces
Variably Inclined Interslice Forces
3.2.1
Bishop's Simplified Method - Horizontal Interslice Forces
Assumptions:
1. The interslice shear forces are assumed to sum to zero. This satisfies vertical equilibrium,
but not horizontal equilibrium, where;
{Xn - Xn+1} = 0
This leads to errors in the calculated factors of safety, but these are usually small and on the
safe side (Spencer 1967).
2.
The method satisfies overall moment equilibrium.
The limitations of the method have been investigated by Whitman and Bailey (1967). They
concluded that the method can occasionally give misleading answers particularly in the case of
interlock, see Interlock.
If it is suspected that this may be a problem then the user should select the method of Variably
Inclined Interslice Forces.
© Oasys Ltd. 2014
Essential Background Theory
3.2.2
8
Bishop's Method - Parallel Inclined Interslice Forces
This method (also known as Spencer's Method) is a refinement of Bishop's Simplified Method and
satisfies conditions of horizontal, vertical and moment equilibrium for the slip as a whole.
Assumptions:
1.
The program assumes that all the interslice forces are parallel, but not necessarily horizontal,
i.e. at a constant inclination throughout the slope. Where:
tan q = Xn / En = Xn+1 / En+1
q = angle of resultant of the interslice forces from the horizontal.
2.
3.
This satisfies the condition of overall horizontal and vertical equilibrium.
The method also satisfies overall moment equilibrium.
This method has been assessed by Spencer (1967). He has shown that in most cases the results
differ only slightly from those obtained by the simplified method, which assumes only horizontal
interslice forces.
The differences between the two methods increase with slope angle. For steep slopes Spencer's
method is more accurate and is therefore recommended.
This method can have problems of interlock, see Interlock. If it is suspected that this may be a
problem the method of variably inclined interslice forces should be used.
3.2.3
Bishop's Method -Variably Inclined Interslice Forces
This method is a further refinement of Bishop's method designed to over-come the problems of
interlock.
Assumption:
· In this method the program calculates the interslice forces to maintain horizontal and vertical
equilibrium of each slice .
The inclinations of the interslice forces are then varied in each iteration until overall horizontal,
vertical and moment equilibrium is also achieved.
3.3
Reinforcement Calculations
If reinforcement is specified and active, the forces in the reinforcement are calculated and can be
either specified as contributing additional restoring moment (hence increasing the factor of safety)
or as surface loads, where the surface load applied equals the capacity of the reinforcement derived
for the current slip surface.
If the reinforcement is used to contribute additional restoring moment, the soil restoring moment is
calculated as usual (but with any partial factors taken into account), then divided by the moment
correction factor. The reinforcement restoring moment is then added and the factor of safety
calculated.
© Oasys Ltd. 2014
9
SlopeFE Oasys GEO Suite for Windows
Calculation of design capacity of reinforcing elements where they cross the slip surface
For end anchored elements (rockbolts Type B):
Tj = T/S
For ground anchors without pre-stress or soil nails, capacity is the minimum of design pullout force,
tensile force and stripping force, so
Tj = min{T/S, BLO/S,(P+BLi)/S}
For ground anchors with prestress, the applicable prestress cannot exceed this value. The input
prestress is reduced in proportion to the amount of fixed length outside the slip surface. In the
output, the applicable prestress and any additional capacity are shown separately. The applicable
prestress per m run of slope is:
Tpj = min{Tj, (Tp/S x LO/L)}
and the additional capacity is (Tj - Tpj).
For geotextiles, capacity is the minimum of design tensile force and pullout force, so
Tj =min{T, 2LOt}
where
T is design tensile capacity per m run of slope (Tult x fcr/(fm11 x fm12 x fm21 x fm22 x fn x fs ))
where
fcr is the partial factor for creep reduction
fm11 is the partial factor for manufacture
fm12 is the partial factor for extrapolation of test data
fm21 is the partial factor for damage
fm22 is the partial factor for environment
fn is the partial factor for economic ramification of failure
fs is the partial factor for material strength
Tp is input prestress per anchor
S
B
P
Li
is
is
is
is
out-of-plane spacing
bond strength (force per unit length of anchor/nail)
design surface plate capacity
bonded length within the slip circle
LO is bonded length or length outside the slip circle
L is total bonded length
The calculation of pullout and stripping forces are mentioned above. To calculate them the shear /
bond strength of the appropriate soil strength model has to be applied to the material the
reinforcement is in (linear, hyperbolic etc).
B is bond strength (force per unit length of anchor/nail), which can be calculated or specified by the
user. If calculated, the value is based on equation 12 from BS8081 or section 4.3.2 of BS8006-2.
© Oasys Ltd. 2014
Essential Background Theory
10
For BS8081 the equation to calculate bond strength is:
pD(sn'tand + c a)/(fp x fn)
where
sv' = gh + wv ertical
h is vertical distance between reinforcement and slope surface
For BS8006-2 the equation to calculate bond strength is:
pD(sr'tand + c a)/(fp)
where
sr'=sn'(1 + KL)/2
and KL= (1 + Ka)/2
Shear strength of soil = t = (sn' .a. tand + c a)/(fp x fn) (for drained linear strength model). It should be
noted that a reduced pullout factor is adopted in this analysis as the factored strength and
friction angle are used.
d
is factored soil friction angle (tan-1(tan f'/fmsphi)) where fmsphi is factor on friction angle
ca
is factored soil cohesion ( ( ac c)/fmsc )
gh
is weight of soil above the reinforcement behind the slip surface - soil unit weight is multiplied
by the applicable partial factor
is surcharge on the surface above reinforcement behind the slip surface - with factors on dead
and live load applied, so w = (dead load x dead load factor)+(live load x live load factor)
is coefficient of interaction between reinforcement and soil relating to the j' of soil
is coefficient of interaction between reinforcement and soil relating to the c ' of soil
w
a
ac
Ka is the Rankine active earth pressure coefficient
fp
is partial factor on pull-out (BS8006 =1.3)
fn
is partial factor for structure importance (BS8006 =1-1.1)
If the bond strength is specified, the value B used in the calculations is the user's specified value
divided by
(fp x fn).
The only partial factor not used at the moment is fs – sliding along reinforcement, which will be
added in a later stage of development. This would apply if the slip surface is within a certain distance
from the reinforcement, to reduce strength on slip surface.
Surcharges are excluded from the pullout calculation by default, but can be included by setting the
field "Use in pullout calc" in the Materials table to Yes.
© Oasys Ltd. 2014
11
SlopeFE Oasys GEO Suite for Windows
Calculation of additional restoring moment due to reinforcing elements
The additional restoring moment due to the reinforcement is defined as
MRR = MRT + MRV
where MRT is the sum of moments due to tension in the nails/anchors, and MRV the sum of
moments due to shear in soil nails.
Calculation of shear developed in soil nails is not included, so the equation reduces to:
The component 'X' represents the nail tension increasing the normal force on the slip surface, these
are adapted from Figure 18 of BS8006-2:2011.
For anchors with prestress, BS 8081 applies and an additional restoring moment due to prestress is
:
where Tpj is the applicable prestress as defined above.
Figure 1.
© Oasys Ltd. 2014
Essential Background Theory
12
Tj = design tensile capacity of the reinforcing element
Sj = the horizontal spacing of reinforcement
Vj = design available shear resistance
Rdj = radius of the slip circle
qj = angle of the radius from the horizontal
wj = angle of the reinforcing element from the horizontal.
Application of reinforcement forces as surface loads
If the "Apply as Surface Loads" box is ticked (currently available for soil nails and ground anchors)
then the design capacities Tj and Tpj will be resolved into horizontal and vertical load components
and applied at the point where the reinforcing element intersects the ground surface. The load
applied to each slice will be shown in the "Point Loads" columns of the detailed results output table.
4
Getting Started
Navigation around the program is done using the commands on the ribbon toolbar and the left
navigation panel (called the Gateway).
On first opening the program, a welcome screen is shown followed by a start-up dialog (unless these
options have been switched off by the user in the Preferences settings dialog).
The "Welcome screen" with options for technical support and obtaining information.
© Oasys Ltd. 2014
13
SlopeFE Oasys GEO Suite for Windows
The Start dialog
File commands (New, Open, Save, Save As etc.) are also available from the application button menu
at the top left corner of the program main window:
© Oasys Ltd. 2014
Getting Started
The application menu available from the Application button at top left of the ribbon
There are three ways to enter basic data into SlopeFE:
· the New Model Wizard for new files
© Oasys Ltd. 2014
14
15
SlopeFE Oasys GEO Suite for Windows
· import an existing Slope (.sld) file
© Oasys Ltd. 2014
Getting Started
16
· enter or edit data directly in tables and the graphical input view.
These methods are described in more detail in the following sections.
The basic data consists of material parameters including permeability, stratum coordinates and slip
circle definition. Surface loads and reinforcement are optional. Once the basic data has been
defined, groundwater boundary conditions must be entered in the graphical input view and the finite
element mesh generated and reviewed.
Selecting Analyse on the ribbon toolbar then carries out a steady state seepage analysis, and the
© Oasys Ltd. 2014
17
SlopeFE Oasys GEO Suite for Windows
resulting pore pressures are used in a limit equilibrium slope stability analysis. The progress of the
analysis, including how many slip circles have been analysed or rejected, is shown on screen:
On completion of analysis, the analysis progress dialog closes and the Gateway and ribbon toolbar
will be updated to allow access to the tabular and graphical output options.
Analyse / Report tab on the ribbon
Output options on the Gateway
© Oasys Ltd. 2014
Getting Started
5
Entering Data
5.1
New model wizard
18
Selecting the option to create a new file will open the New Model Wizard. If direct data entry is
preferred, the wizard can be dismissed using the Cancel button.
The wizard has four pages which are described in the following sections. If the Cancel button is
pressed before completion of the final page, no data will be created.
5.1.1
Titles Page
The title data entered here are reproduced in the title block at the head of all printed information for
the calculations. An additional field for notes has also been included to allow the entry of a detailed
description of the calculation. This can be reproduced at the start of the tabular output if required.
Selection of units for data display can also be done from here. More detail on the options available
is in the main Units topic.
© Oasys Ltd. 2014
19
SlopeFE Oasys GEO Suite for Windows
Click the Next button to move to the materials page.
5.1.2
Materials Page
This page allows specification of material parameters. Some default values for the first material are
initially shown. To add more materials, expand the dropdown box next to Material Name and select
<New...>. This creates a new material with a default name which can be edited to have the required
parameters. Continue to add materials until they are all defined.
The following should be entered for each material:
· A description of the stratum.
· The bulk unit weight (kN/m3) of the material above and below the ground water table.
Shear Strength Parameters
· The condition of the material i.e. undrained, drained with linear strength, or drained with
strength calculated using a power or hyperbolic function. Choose the required option from the
drop-down list.
For drained, linear strength materials enter the angle of friction f' (deg) and a value for drained
cohesion c'.
For drained, power curve strength materials, enter the angle of friction at which a linear
© Oasys Ltd. 2014
Entering Data
20
relationship takes over, plus the two constants a and b. Slope calculates the material strength
using a relationship of t = asnb.
Then (dt /ds) = absnb-1, which is equal to tan(f') at sn. The associated c' is given by c' = absbn(1-b).
The linear relationship t = c' + sn tan(f') takes over at some predetermined f', say f'0. When sn
exceeds the stress at which this transition takes place, the strength relationship reverts to MohrCoulomb.
For drained, hyperbolic curve strength materials, enter values for c' and f 0 as follows. We
assume a relationship of
t = c¥ sn tan(f0) / (c¥ + sn tan(f0))
Then
(dt / ds) = tanf = [(c ¥ tan(f0)) / (c ¥ + sn tan(f0))] - [(c ¥ sn tan2(f0)) / (c ¥ + sn tan(f0))2]
f0 is the angle at sn = 0 and c ¥ = value of c when sn = ¥ . Both f0 and c ¥ are constants.
c can be calculated from c = t - sn tan f .
For undrained materials enter:
1. A single value of undrained shear strength c.
2. Alternatively a value of undrained shear strength c 0, which varies linearly with elevation y.
Where:
c = c 0 + k(y 0 - y)
c = undrained shear strength at any elevation y
c 0 = undrained shear strength at a specified elevation y 0
k = the rate of increase of shear strength with depth
3. A ratio of c u/p' for normally consolidated soils, where p' is the effective vertical stress which is
calculated by the program at the point on the slip surface for each slice.
4. A combination of 2. and 3. If both are selected then the higher value of strength is used.
Once all required data has been entered, click the Next button to move to the stratum definition
page.
5.1.3
Stratum Definition Page
This page allows specification of stratum coordinates and their materials, and also the base level of
the problem. An empty "Stratum 1" is created on moving to this page for the first time. Coordinates
of the stratum should be added in increasing x coordinate order. To add more strata, expand the
dropdown box next to Name and select <New...>. This creates a new stratum with a default name.
Continue to add strata and their coordinates until they are all defined.
© Oasys Ltd. 2014
21
SlopeFE Oasys GEO Suite for Windows
Enter the base level of the problem (this will be used in mesh generation later) and click Next to
move to the Slip Surface Definition page.
© Oasys Ltd. 2014
Entering Data
5.1.4
22
Slip Surface Definition Page
The final page of the new model wizard allows setting of options for the slip circles. For more
details, see the main data entry Slip Surface Definition.
.
Click Finish to exit the wizard. The program will then create data for the finite element analysis for
groundwater flow, and open the graphical input view to show it.
© Oasys Ltd. 2014
23
5.2
SlopeFE Oasys GEO Suite for Windows
Importing Slope files
Selecting "Open an existing file" on the Startup dialog, or the Open command on the application
menu (see Getting Started), opens the File Open dialog.
This offers various file types in a dropdown list. To import an existing Slope file, select the "Slope
Data Files (*.sld)" option. This will allow you to browse to the required file location and select the
Slope file to be imported.
Another dialog describing the data which will be imported and explaining how to complete it for the
seepage analysis is then shown. The base level of the problem is entered in this dialog to provide a
lower level for the geometry data generation. (If this level is above any of the existing Slope strata,
the program will calculate it's own base level.)
© Oasys Ltd. 2014
Entering Data
24
The program generates geometry data for mesh generation using the Slope strata coordinates, and
imports material parameters, surface loads, slip surface data and reinforcement data. Default
permeability values are created for all materials. If the "Import water table(s)" option is ticked, the
program will also create fixed head boundaries on the geometry data corresponding to the water
tables defined in the Slope file. On completion of the import, the Graphical Input view will open and
show the generated geometry data. The example below shows a file with a surface load and a grid
of slip circle centres.
© Oasys Ltd. 2014
25
SlopeFE Oasys GEO Suite for Windows
You can now continue to add (or check and revise) the groundwater boundary conditions and
generate the finite element mesh for the steady state seepage analysis. See Graphical Input for
more details.
5.3
Direct data entry and editing
Options on the Gateway and commands on the Home category of the ribbon will open tables and
dialogs for editing or entering data directly.
Boundary conditions and some mesh generation data is entered via the Graphical Input view.
Limited data editing can also be done in the graphics. Some data edits in the tables will cause the
mesh data to be deleted and re-generated.
The following topics describe each of the data items in detail.
5.3.1
Titles
The Titles dialog allows entry of identification data for each program file.
The following fields are available:
Job Number
allows entry of an identifying job number.
Initials
for entry of the users initials.
Date
this field is set by the program at the date the file is saved.
Job Title
allows a single line for entry of the job title.
© Oasys Ltd. 2014
Entering Data
Subtitle
allows a single line of additional job or calculation information.
Calculation Heading
allows a single line for the main calculation heading.
26
The titles are reproduced in the title block at the head of all printed information for the calculations.
The fields should therefore be used to provide as many details as possible to identify the individual
calculation runs.
An additional field for notes has also been included to allow the entry of a detailed description of the
calculation. This can be reproduced at the start of the data/results output by selection of notes
using the Print Selection option.
5.3.1.1
Titles Window - Bitmaps
The box to the right of the Titles window can be used to display a picture beside the file titles.
To add a picture place an image on to the clipboard. This must be in a RGB (Red / Green / Blue)
Bitmap format. Select the "Paste" button to place the image in the box.
The image is purely for use as a prompt on the screen and can not be copied into the output data.
Care should be taken not to copy large bitmaps. These can dramatically increase the size of the file.
To remove a bitmap select "Remove".
5.3.2
Units
The Units dialog is accessible via the Gateway, or by choosing Data | Units from the program menu.
It allows the user to specify the units for entering the data and reporting the results of the
calculations. These choices are stored in, and therefore associated with, the data file.
© Oasys Ltd. 2014
27
SlopeFE Oasys GEO Suite for Windows
Default options are the Système Internationale (SI) units - kN and m. The drop down menus provide
alternative units with their respective conversion factors to Newtons and metres.
Standard sets of units may be set by selecting any of the buttons: SI, kN-m, kip-ft kip-in.
Once the correct units have been selected then click 'OK' to continue.
SI units have been used as the default standard throughout this document.
© Oasys Ltd. 2014
Entering Data
5.3.3
28
Specification
The Specification command opens this dialog from either the ribbon or the gateway.
The options for full finite element analysis are disabled as SlopeFE is limited to only allow slope
stability analysis combined with a steady state groundwater flow calculation. At the moment the
program also analyses only circular slip surfaces using Bishop's methods.
Minimum Weight
This option will discard slip circles with lower weights - this can be useful to exclude small surface
slips from the calculations.
Maximum Number of Iterations
All the methods of solution iterate to reach a solution. The program defaults to 100 iterations, but
the user can specify any number.
© Oasys Ltd. 2014
29
SlopeFE Oasys GEO Suite for Windows
Minimum Number of Slices
The program requires the minimum number of slices for each slip surface to be specified. The
default value is 10.
Soil Nail Analysis
These options allow the user to specify the method for calculating the bond stress and restoring
moment attributable to soil nails. Details of the analysis options are included in the Reinforcement
Calculations section.
5.3.4
Material Properties
The Materials command opens this table from either the ribbon or the gateway. This table shows
the same information as the New Model Wizard material page, with the addition of a colour assigned
to each material for shading on the graphical input view.
For details of the parameters, see the Materials Page topic.
5.3.5
Permeabilities
The Permeabilities command opens this table either from the ribbon or the gateway. Permeability
information is required for every material and will be automatically created with the values specified in
the New Model Wizard, or with default values if a Slope file has been imported.
Drainage condition
"Drained" means constant pore pressure.
"Undrained" means that no volume change will occur and pore pressures
are computed.
"Consolidating" means that time-dependent consolidation is to be
computed.
"No water" means that there is no water pressure and no flow of water.
© Oasys Ltd. 2014
Entering Data
30
Thus it could be used to model, for example, an impermeable concrete
wall. The behaviour is essentially drained, i.e. volume change can occur,
but unlike other drained zones, a no water zone does not interact with
consolidation or seepage. That is, its nodes do not become fixed head
nodes forming a drainage boundary.
Drained, undrained and consolidating materials may be used together in
the same run. Drained elements provide additional fixed heads at their
nodes.
Unit weight of pore
fluid
gw
The unit weight of pore fluid with depth, which is used to calculate pore
water pressures from specified data. Only in hydrostatic conditions is this
equal to the weight density of the water.
gw should be set to zero for layers of soil above the water table which are
unable to sustain suction.
Bulk mod Kw
Used for undrained materials. Repeated from the general materials table for
convenience.
If Kw is positive, it represents the bulk modulus of pore water, usually
taken to be 2200MN/m². For Water or Void materials, an appropriate value
must always be quoted.
Permeabilities
k1, k2
Orthogonal principal permeabilities.
k1 - horizontal, if inclination is zero
k2 - permeability at right angles to k1
Inclination
Inclination of the first principal permeability, measured anticlockwise from
the x-axis (specified in degrees).
Level y0,
Beta
Set these values if the permeability varies with depth within the material.
y0 is the reference level at which k1 and k2 have been defined, and Beta
describes the relationship between that and permeability at other depths:
b = - (dk / dy) / K(y0)
(where K(y0) is K at y0)
Desensitising factor F This must be set to 1.0 for all materials for which an accurate consolidation
analysis is required. However, it will sometimes be the case that the
problem involves low cv materials, for which accurate consolidation is
required, and high cv materials which provide boundary conditions to the
others, and for which some error in pore pressure could be tolerated. In
this case, it is desirable that the time steps are suited to the low
permeability materials, and the desensitising factor is used to keep the
high permeability materials in a stable state.
In effect, for each iteration, the coefficient of consolidation of the high cv
materials is decreased by this factor; however the overall effect is made
less severe as iterations proceed within each time increment. Users must
inspect the results for materials with values of F greater than 1.0, and
satisfy themselves that they are appropriate for the problem.
Min pwp
© Oasys Ltd. 2014
Minimum pore water pressure attainable by the material. This is the
pressure at which the material becomes unsaturated; it will generally be
zero or negative, representing suction. For unlimited suction, leave blank.
31
SlopeFE Oasys GEO Suite for Windows
Permeability factor
5.3.6
If the pore pressure in the element tends to fall even lower than that
specified above, it will be held at the specified minimum, and the
permeability of the element will also be reduced by this user-specified
factor. This represents conditions in a non-saturated zone. In simple
cases, the factor should be set very low: the default is 10E-6 meaning that
the permeability of the unsaturated material is one millionth of the saturated
value. Other values could be used, given a proper understanding of
unsaturated flow.
Water data
This command opens a read-only view of the water boundary conditions. These will usually have
been assigned to lines or nodes in the Graphical Input view.
© Oasys Ltd. 2014
Entering Data
5.3.7
32
Strata
The Strata command opens this table either from the ribbon or the gateway. The table shows a
page for each stratum entered, with the x and y coordinates and the material type (in the first record
only). The stratum name can be edited by right-clicking on the tab and choosing Modify. To delete a
stratum, right-click on the tab and choose Delete.
If the finite element mesh has already been created, editing the stratum data will cause it to be
deleted and the basic geometry data will be re-created using the new stratum information.
5.3.8
Slip Surface Definition
The Slip Surfaces command opens this dialog from either the ribbon or the gateway.
A circular slip surface is defined by the x and y co-ordinates of the centre of the circle and the
specification of the circle radius.
The centre of the circle is specified in terms of a single point, by x,y coordinates, or a grid, using
the x,y coordinates of the bottom left corner of the grid and the inclination of the grid about this point,
positive in the anticlockwise direction.
© Oasys Ltd. 2014
33
SlopeFE Oasys GEO Suite for Windows
The extent of the grid is given by specifying the number of columns and the spacing of each grid line
in the x and y directions.
There is an option to let the program extend the grid (at the same grid spacing and inclination) to find
the minimum factor of safety. If this option is used the program will extend the grid (in any direction)
if it is found that the centre of the slip surface with the minimum factor of safety is on the edge of the
grid. This process is repeated until the minimum centre is no longer on the edge of the grid..
The radius of the slip circle(s) must be specified as one of the following:
· The co-ordinates of a common point through which all circles must pass.
· Defined radii of the circles.For this case user can limit the radius value beyond which slips are
not generated. Slips which do not intersect the ground (e.g. A and B in the diagram) will be
ignored.
© Oasys Ltd. 2014
Entering Data
34
· A tangent surface, defined as a stratum boundary. In this case the circle stays just above the
boundary. For sloping strata boundaries, as shown in the diagram, SlopeFE will calculate the
shortest radius to the boundary for each centre and take this as the location of the tangent.
The calculated circle can therefore never cross the strata boundary line.
5.3.9
Surface Loads
The Surface Loads command opens this table either from the ribbon or the gateway. Surface loads
can be added by defining the left and right x coordinates of the loaded area.
Loads can be horizontal, vertical or inclined.
© Oasys Ltd. 2014
35
SlopeFE Oasys GEO Suite for Windows
Vertical loads are expressed as the vertical force per unit horizontal width of the loaded area. For
level ground this is equal to the normal stress on the ground surface. Vertical loads are positive
when they act downwards.
Horizontal loads are expressed as the horizontal force also per unit horizontal width of the loaded
area. For level ground this is equal to the shear stress on the ground surface, but for steeply
inclined surfaces the 'pressure' specified is much greater than the actual pressure acting on the
ground.
Horizontal loads are positive when they act in the direction of increasing x.
Inclined loads are defined by using a combination of the horizontal and vertical components.
Concentrated loads, in the form of anchors or struts, can be modelled by specifying surface loads
of high intensity over short lengths of the ground surface.
5.3.10 Reinforcement
The Reinforcement command opens this dialog from either the ribbon or the gateway. Four types of
reinforcement are available:
·
·
·
·
Ground anchors
Rock bolts
Soil nails
Geotextile
The data items which are not applicable to each particular type of reinforcement are greyed out when
that type is selected from the drop-down list.
© Oasys Ltd. 2014
Entering Data
36
Each set of reinforcing elements is given a name which is used to distinguish forces in the
reinforcement in the tabular output table. Each set is drawn in a different colour on graphical input
and output. NB If the reinforcement is marked inactive in the Analysis Method dialog, it is drawn in
grey on the graphical input, and omitted from the output, because it has no effect on the results.
Geometry
The uppermost level, number of layers and horizontal spacing are entered. The length of the top and
bottom layers of reinforcement are entered. The lengths of intermediate layers are interpolated
between these two values. The angle from horizontal is entered, except for geotextiles which are
always assumed to be horizontal.
Capacity
Out-of-plane spacing, tensile capacity and plate capacity (if applicable) are entered. Plate capacity
must be at least 50% of tensile capacity. The tensile capacity should represent the allowable
capacity if BS8081 is used or ultimate capacity if EC3 is used.
Bond details and prestress
Bond length can be entered for ground anchors and rock bolts Type B. Soil nails are assumed to be
100% bonded along their length.
© Oasys Ltd. 2014
37
SlopeFE Oasys GEO Suite for Windows
Bond strength can be specified or calculated from effective stress.
Prestress can be entered for ground anchors and can not exceed the tensile capacity.
Material partial factors
Click the Select button to set material partial factors for each set of reinforcing elements. This is
optional - all partial factors will be set to 1.0 if no selection is made. User-defined sets of partial
factors can be added or edited by selecting "Partial Factors" from the View menu.
See Reinforcement Calculations for details of the calculations used, and the application of method
and material partial factors.
5.3.11 Graphical Input
Selecting Graphical Input from either the ribbon or the gateway opens the graphical input view.
The graphical view has geometry data generated from the entered strata coordinates, and the
problem base level defined in the new model wizard or on importing a previous Slope data file. To
perform the seepage analysis, groundwater boundary conditions should be defined in the graphical
view and a finite element mesh generated from the geometry data.
Data editing is limited in the graphics so as not to invalidate the generated meshing information.
Stratum points may be moved and lines edited for element size, but new lines cannot be added.
New points may be added, so that additional seepage restraints can be specified at the required
coordinates.
5.3.11.1 Importing DXF data
A DXF file can be imported into the graphical input view and used as the basis for stratum
coordinates if required. Note that DXF data is not saved with the data file unitl selected and added to
the model data.
Right-clicking within the graphical view will show a pop-up menu from which "Import DXF..." can be
selected.
A File Open dialog is then shown. Navigate to the location of the required DXF file, select the file
and click Open. If the coordinates in the DXF file need to be translated, enter the required
translation coordinates on the dialog which appears.
© Oasys Ltd. 2014
Entering Data
38
The graphical input updates to show any lines or polylines imported from the DXF file. These are
shown in grey and are not yet part of the model data. To copy DXF data into the model, click the
DXF data button
on the Select group of the ribbon. Click near the centre of any line
segment on a line or polyline. This will create a stratum for each line or polyline clicked. The lines
will be re-drawn in blue and the Gateway updated to show the new strata added.
To complete the geometry for mesh generation, click the Auto-complete button
on
the Generate panel on the ribbon. This will create the lines and areas to use as the basis for mesh
generation. If the DXF polylines do not have the same start and end x coordinates, additional lines
will be added to the strata so that the left and right boundaries are vertical. The program will assume
© Oasys Ltd. 2014
39
SlopeFE Oasys GEO Suite for Windows
a base level for the problem.
To set the correct material for each stratum, add materials to the Materials table (if they have not
already been specified) and edit the Strata table as required. Alternatively, click the Areas button
on the Select panel of the ribbon, and click within each area in turn. Right-click and
choose "Set material" from the pop-up menu. The material number can then be entered in the Area
Properties dialog.
© Oasys Ltd. 2014
Entering Data
40
5.3.11.2 Groundwater boundary conditions
Groundwater boundary conditions are required for the steady state seepage analysis, which
calculates pore pressures within the soil mass. Boundary conditions can be one of four types: no
flow, fixed head, fixed flow or phreatic.
Seepage boundary conditions can be applied to mesh generation lines or to individual nodes. For a
fixed head node, the piezometric water level at the node must be entered. For a fixed flow node, the
flow rate must be entered (units: m3/s/m). Phreatic nodes are defined as those at which water may
leave the mesh and the water pressure at these nodes will be maintained at atmospheric pressure.
No flow nodes allow no net flow of water into or out of the finite element mesh.
Internal nodes are taken to be no flow nodes by default and these do not need to be specified.
Nodes at an interface with drained elements are normally treated as fixed head nodes in the
computations, if this is not required, they may be declared here to be "no flow"..
To apply to mesh generation lines, before generating the mesh, select the lines by clicking the
button on the Graphics ribbon tab, then drawing a selection box around the required line(s)
centres. Right-click and select "Modify" from the pop-up menu. This will open the "Line Properties"
dialog which differs slightly according to whether a single line or multiple lines are selected.
When the mesh is generated, the required boundary condition will be applied to nodes generated
along the line(s) with groundwater boundaries specified. Note that this dialog also offers the option
of setting a required element size on the lines for use in mesh generation.
To apply to individual nodes, either before or after mesh generation, select the nodes by clicking the
© Oasys Ltd. 2014
41
SlopeFE Oasys GEO Suite for Windows
button on the Graphics ribbon tab, then drawing a selection box or clicking on the nodes.
Right-click and select "Seepage restraint" from the pop-up menu.
Enter the required information and click OK to apply the boundary conditions.
5.3.11.3 Mesh generation
To generate nodes and elements for steady state seepage analysis, click the
button on
the Graphics ribbon tab. This opens the Mesh Generation dialog in which a default element size can
be set. This size will be overridden if other sizes have been set for individual lines or nodes.
It is recommended to use the default option to renumber during mesh generation. Click OK to
generate the mesh. Some numbering statistics will be reported on completion of mesh generation.
© Oasys Ltd. 2014
Entering Data
The
42
button can be used to view the mesh.
6
Analysis and Results
6.1
Analysis and Data Checking
To run the seepage and slope stability analysis, click the [Analyse] button on the ribbon Home tab.
Prior to analysis the program carries out some data checks and will report, for example, if
groundwater boundary conditions are not specified.
© Oasys Ltd. 2014
43
SlopeFE Oasys GEO Suite for Windows
The groundwater flow analysis is done first, and the resulting pore pressures are used as input to the
slope stability analysis. The Analysis Progress dialog reports how many slip circles have been
analysed and also if any have been rejected. The reasons for rejecting individual slip circles will be
shown on the summary output.
Once the analysis is complete, clicking OK closes the progress dialog. Tabular and Graphical
output options will then be available in the gateway and on the ribbon Home tab.
6.2
Tabular Output
Selecting Tabular Output from the gateway or the ribbon Home tab opens a text view showing the
data and results. The tabulated output can be highlighted and then copied to the clipboard and
pasted into many Windows applications. The output can also be directly exported to various text or
HTML formats by selecting Export from the Application button menu.
Slice Strength Parameters Average Slice
Forces on base [kN/m]
No.
Pore
Weight
Pressure
c'
Tan phi
[kN/m²] [kN/m] Normal
Shear
Shear
[kN/m²]
(capacity) (mobilised)
1
0.0
0.5543
0.0 2.275 2.451
1.359
1.450
2
0.0
0.5543
0.0 6.380 6.307
3.496
3.730
© Oasys Ltd. 2014
Analysis and Results
3
4
5
6
7
8
9
10
11
12
13
0.0
0.0
0.0
0.0
0.0
0.0
0.0
0.0
0.0
0.0
2.000
0.5543
0.5543
0.5543
0.5543
0.5543
0.5543
0.5543
0.5543
0.5543
0.5543
0.3640
0.0 9.652
0.0 12.10
0.0 13.75
0.0 14.63
0.0 14.76
0.0 14.19
0.0 12.98
0.0 11.18
0.0 8.850
0.0 4.329
0.0 0.4393
9.277
11.39
12.69
13.24
13.10
12.35
11.08
9.380
7.352
9.340
2.950
5.142
6.314
7.035
7.337
7.259
6.844
6.140
5.200
4.075
5.177
1.846
44
5.487
6.737
7.506
7.829
7.745
7.303
6.552
5.548
4.348
5.524
1.969
The data is printed, followed by a summary of the results for all slip circles analysed and a full report
of the results for the worst case slip circle with the lowest factor of safety.
6.2.1
Summary of Results
This output summarises the results for all the slips analysed. The following items are tabulated for
each slip circle.
·
·
·
·
·
The x and y co-ordinates of the Centre of Rotation about which Moment is taken.
The Radius of the circle for circular slips.
The Slip Weight.
The Factor of Safety or Over-Design Factor.
The Disturbing Moment and Restoring Moment of the slip.
A column for comments provides the following information for circles which were rejected for
analysis:
Comment
Suggested action
Radius too large
Increase lateral extent of ground profile in ±X direction (if required); but
note that this message will always be shown where the initial radius and
increment method is used to define the circles to be analysed.
Horizontal ground
Where the location of the slip surface is entirely within an area of
horizontal ground.
Radius too small.
Occurs if the circle radius is too small to reach the specified ground
surface.
Center embedded
Where the center of the circle is below the level of the top of the slip.
© Oasys Ltd. 2014
45
6.2.2
SlopeFE Oasys GEO Suite for Windows
Weight too small.
Decrease the minimum slip weight.
Failed to converge.
Increase the maximum number of iterations.
Analysis Error.
Other calculation errors. Check input data.
Full Results
Detailed results are provided for the slip circle with the lowest factor of safety.
The output provides details of the interslice and base forces in addition to the overall reporting of
force and moment equilibrium.
Full output comprises the following:
Method of Analysis :
Number of iterations.
Horizontal Acceleration (%g).
© Oasys Ltd. 2014
Analysis and Results
Location of slip surface :
x and y co-ordinates of the centre of
rotation about which moment is taken.
Radius(for circular slips).
Overall Results :
Net vertical force
Includes net vertical and horizontal
forces to help provide some idea of
the possible error in the calculated
factor of safety.
Net horizontal force
Slip weight
Disturbing moment
Restoring moment
Factor of Safety or Over-Design Factor
Slip Surface Location :
Pore water pressure u
x and y co-ordinates (m, m OD) of
the base of the LEFT side of each
slice are used to define the location
of the slip surface.
Interslice Forces
Vertical Shear T
Horizontal Normal E
Horizontal Water Pressure E(u)
Slices :
Strength Parameters
Slices are numbered from left to right. Cohesion c' tan f' (degrees)
Pore Pressure
Slice weight
Forces on the base
Normal N
Shear S
General Slice Information :
Surface Loads - vertical and
horizontal
Water pressure on ground surface Vertical and horizontal
© Oasys Ltd. 2014
46
47
6.3
SlopeFE Oasys GEO Suite for Windows
Graphical Output
The ribbon command or the Gateway item "Graphical output" open the graphical output view. A new
ribbon tab specifically for Slope Graphics is also added to the ribbon when this view is open. The
program defaults to show all slip circles (or by default a maximum of 5000 slip circles), coloured in
accordance with their factor of safety.
To change the currently plotted circle when a grid of centres has been analysed, move the cursor
into the grid and right-click on the required centre. The circle with the lowest factor of safety for that
centre will be plotted.
A number of other output options and commands are available on the Graphics and Slope Graphics
ribbon tabs:
Graphics tab
Zoom : Select an area to 'zoom in' to by using the mouse to click on a point
on the drawing and then dragging the box outwards to select the area to be
viewed. The program will automatically scale the new view. The original area
can be restored by clicking on the Unzoom' button.
Pan : move across a zoomed view.
Extents : re-size the view to fit in whole problem area.
Show mesh : Adds the elements to the graphical view.
Show ruler : toggles between showing a ruler at the edges of the view, or the
view contained within a rectangular border.
© Oasys Ltd. 2014
Analysis and Results
48
Output options : The Parameter dropdown list allows selection from pore
pressure, piezometric head, nodal flow, seepage velocity or hydraulic gradient.
These parameters can be plotted as line contours, filled contours or numbers.
Slope Graphics
Contour grid : Provides a contour plot of the factor of safety for the grid of slip
circle centres.
Show multiple slips : toggles between all the circles and only the worst case
circle.
Edit slips shown : opens a dialog to allow input of a minimum and maximum
factor of safety to be plotted. Other circles will be filtered out and the graphics
legend updated.
Show slip tooltip : shows a floating text box with summary details of the
currently plotted slip (centre, radius, factor of safety).
Show water table: if the pore pressure contours are shown on the view,
clicking this button will switch to show only the hydrostatic pore pressure line
(zero pore pressure).
6.4
Edit Graphics Settings
If more than one slip surface is being plotted on the graphical output, a legend showing colour
intervals corresponding to the plotted range of factors of safety will be shown. If there are many
analysed circles, by default only the 5000 with the lowest factors of safety will be shown. To amend
this, or for more detail within a specific range of factors of safety, left-click on the plot legend or
select Graphics | Graphical Output | Display settings. A dialog box will be shown which allows the
minimum and maximum factor of safety to be edited.
© Oasys Ltd. 2014
49
SlopeFE Oasys GEO Suite for Windows
The contour interval used in plotting contours of factors of safety is also editable from this dialog. If a
limited range is plotted, a note will be added to the graphical output to indicate that not all the
available results are being shown (see example below). The full range can be re-displayed by
clicking the Reset button on the Edit Graphics Settings dialog.
7
List of References
7.1
References
BSI (2010 / 2011). Code of practice for strengthened/reinforced soils and other fills. BS 8006-1:2010
and BS 8006-2:2011.
Bishop A W (1955). The use of the Slip Circle in the Stability Analysis of Earth Slopes.
Géotechnique Vol.5 No.1 pp 7-17.
Janbu N (1957). Earth Pressures and Bearing Capacity Calculations by Generalized Procedure of
Slices. Proc. 4th International Conference Soil Mech. Fdn. Engng. Vol.2 pp 207-212
Nash D (1987). A comparative review of limit equilibrium methods of stability analysis in slope
stability. Anderson and Richards (eds), John Wiley & Sons.
© Oasys Ltd. 2014
List of References
50
Spencer E (1967). A Method of Analysis of Embankments ensuring Parallel Interslice Forces.
Géotechnique Vol.77 pp 11.26.
Whitman R V, and Bailey W A (1967). Use of Computers for Slope Stability Analysis.
International Soil Mech. Fdns. Div. Am. Soc, Civ. Engrs Vol.93 SM4 pp 475 - 498.
© Oasys Ltd. 2014
51
SlopeFE Oasys GEO Suite for Windows
Index
G
Graphical Output
47
Groundwater
31
Piezometric pressures
A
31
Groundwater:Hydrostatic pressure
Analysis menu
42
Analysis Methods
Input Data
28
I
B
Bishop's Methods
5, 7, 28
Horizontal Interslice Forces
7
Parallel Inclined Interslice Forces:
Variably Inclined Interslice Forces
Bitmaps
Adding to titles window
26
C
Interlock
5
Iteration
Maximum number of
Procedure
5
8
8
28, 44
J
Janbu's Methods
Job Number
25
28, 42
L
Circular Slips
4
Results
44
Loads
34
Factor of Safety
D
44
M
Data
Checking
42
Input
25
Date
25
Drained materials
31
Material Properties
29
N
29
E
Errors
Bishop's Simplified
7
Data checks
42, 44
Interlock
5
F
Factor of Safety
3, 5, 28, 43, 45
Applied Loads
44
Notes
25
P
Phreatic Surface
31, 42
Graphical Input
31, 37
Hydrostatic pressure
31
Piezometric levels
31
Piezometric pressures
Adding data
31
R
References
49
Results
Full
45
© Oasys Ltd. 2014
Index
Results
Output
42, 43, 47
Summary
44
S
Scale
40
Engineering
40
Set Exact
40
Slices
Number of:
28
Positioning of 7
Theory of 3
Slip Surface
Definition
32
Spencer's Method
8
Strata
Graphical Input
37
Tabular Input
32
Surface Loads
34
T
Titles
Calculation title
Window
26
25
U
Undrained materials
Units
26
29
V
View menu
47
W
Windows Metafile
Z
Zoom Facility
© Oasys Ltd. 2014
40
40
52
53
SlopeFE Oasys GEO Suite for Windows
Endnotes 2... (after index)
© Oasys Ltd. 2014