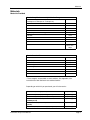
1
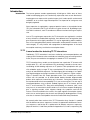
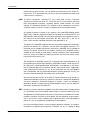
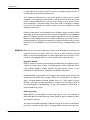
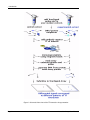
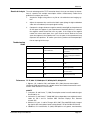
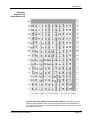
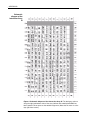
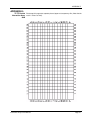
TF Interaction Arrays
User Manual
Cat #: MA5000-MA5063
P/N 16175 Rev. A 050108
DRAFT December 11, 2008 1:40 pm
TFInteractionArrayKitTitle.fm
Panomics, Inc.
p300-TF Interaction Array User Manual
Copyright
© Copyright 2008, Panomics, Inc. All rights reserved.
Trademarks
Hyperfilm and ECL are trademarks of GE Healthcare, Inc., FluorChem is a registered trademark of AlphaInnotech, Inc. All other trademarks are of their
respective owners.
Citing Protein/DNA Arrays in Publications
When describing a procedure for publication using this product, we would appreciate it if you would refer to it as the p300-TF Interaction Array Kit
from Panomics
If a paper cites our product and is published in a research journal, the lead author(s) may receive a travel stipend for use at a technology conference
or tradeshow by sending a copy of the paper to our technical support group at [email protected] or via fax at (510) 818-2610.
Disclaimer
Panomics, Inc. reserves the right to change its products and services at any time to incorporate technological developments. This manual is subject
to change without notice.
Although this manual has been prepared with every precaution to ensure accuracy, Panomics, Inc. assumes no liability for any errors or omissions, nor
for any damages resulting from the application or use of this information.
DRAFT December 11, 2008 1:40 pm
TFInteractionArrayKitTitle.fm
Introduction
Introduction
Introduction The human genome encodes approximately 35,000 genes. While some of these,
called housekeeping genes, are constitutively expressed, most are not. Non-housekeeping genes are expressed in a particular type of cell, under specific environmental
conditions, or at a certain stage of development. The expression of such genes must
be tightly regulated.
Gene expression is regulated by a group of proteins known as transcription factors
(TFs). An estimated 2,000 TFs are at work in any given human cell. By binding to specific DNA cis-elements, each TF contributes a different functional role in gene expression.
Just as TFs regulate gene expression, the TFs themselves are regulated in a number
of ways. Known as combinatorial regulation, these different levels of regulation allow
gene expression to be tightly controlled. TFs may be regulated by protein modification, such as phosphorylation; protein translocation; and/or protein interaction. In the
latter category, TFs may interact with upregulators or downregulators in the basal
transcription machinery, or with other transcription factors.
TF-TF A novel method for detecting TF-TF interactions
Traditionally, TF-TF interactions have been studied by co-immunoprecipitation and
super-gel shift. But because these methods are notoriously time consuming and inefficient, they are not conducive to mapping the network of TF-TF interactions.
TF-TF Interaction Arrays enable you to determine how a particular TF interacts with
multiple other TFs—all in one experiment.This technology is based on the non-covalent binding of DNA binding sequences to TF proteins. After precipitation with specific antibodies against a target TF, the co-precipitated TFs are determined by array
analysis of attached DNA sequences. The advantage of this technology is its capability of high-throughput analyzing interactions of native TF proteins in a given sample.
Figure 1 illustrates how this simple procedure works. First, incubate your nuclear
extract with the provided set of biotin-labeled double-stranded oligonucleotide
probes, which represent a known library of cis-elements. During the incubation step,
these probes bind to their corresponding TFs in your nuclear extract. The next step is
immunoprecipitation: using a specific antibody against your TF of interest, pull out
that TF and associated TFs, along with corresponding cis-elements. Next, wash
away free cis-an extracellular stimulus binds to a cell surface receptor. Binding triggers a signaling cascade, which migrates through the cytoplasm and into the
nucleus. Once transmitted to the nucleus, the signal regulates transcription factors,
which turn on and off genes that elements and nonspecific binding proteins. Finally,
elute the cis-elements and hybridize them to the Protein/DNA Array membrane.
We currently offer three versions of the TF-TF Interaction Array. Version I is spotted
with 54 different consensus sequences; Version II is spotted with 96 different consensus sequences; and Version III is spotted with 94 different consensus sequences.
(Maps of Versions I, II and III are provided in Appendices B, C and D, respectively.) By
Interaction Arrays User Manual
Page 3
Introduction
combining al of these versions, you can profile the interactions of 244 unique TFs.
However, the TF-TF Interaction Array system can be easily expanded to include up to
2,000 consensus sequences.
p300 To initiate transcription, activated TFs must either bind to their cis-element
sequences or interact with other TFs. To connect the TFs to one another and to the
basal transcriptional machinery, secondary proteins called cofactors are usually
required. The interactions between TFs, cofactors, and the components of the transcriptional machinery create a complex, multidimensional transcription network.
One group of proteins involved in this network is the p300/CREB-binding protein
(CBP) family. Originally discovered through their binding to the adenoviral E1A and
CREB proteins, p300 and CBP are now known to be potent transcriptional co-activators. More than 30 transcription factors-p53, ER, HIF1, Stat1, E2F-1, and Jun to
name a few-have been identified that interact with p300/CBP (1-3).
To regulate TFs, p300/CBP integrates into the transcriptional apparatus, becoming a
physical link between TFs, cofactors, and the basal transcription machinery. This
interaction occurs through three distinct mechanisms: p300/CBP acts as a bridge to
connect TFs directly to the basal transcription machinery (3-5); p300/CBP forms a
scaffold for the assembly of multi-protein cofactor complexes (5-6); and p300/CBP
increases access to the DNA by modifying chromatin structure with histone acetyltransferase (HAT) activity (5,7-8).
The distribution of p300/CBP among TFs is believed to be signal-dependent (5, 9).
By responding to activated signal pathways, p300/CBP mediates a wide array of cellular processes, including proliferation, differentiation, and apoptosis (1,3-5). Mutations in p300/CBP genes have even been found in some human tumors, suggesting a
tumor suppressor functionality (10--10). To fully understand the many physiological
roles of p300/CBP and the relationships between signaling pathways and TFs, the
intricate network of p300/CBP interactions must be dissected.
We currently offer two versions of the p300-TF Protein Interaction Array. Version I is
spotted with 54 different consensus sequences; Version II is spotted with 96 different
consensus sequences. (Schematic Diagrams of Versions I and II are provided in
Appendices B and C, respectively.) By combining both versions, you can profile the
interactions of p300 with 150 unique TFs.
SRC Hormones, vitamins, and other metabolites exert their cellular effects through binding
to a specialized class of transcription factors known as nuclear receptors. By interacting directly with DNA response elements as either homo- or heterodimers, nuclear
receptors transduce the effects of their ligands into the regulation of gene expression. In this manner, nuclear receptors play a significant role in critical physiological
processes, such as development, reproduction, and metabolism.
Like most transcription factors, nuclear receptors depend on cofactors, or coregulator proteins, to regulate gene expression. Cofactors can act as a bridge to bring
Page 4
Interaction Arrays User Manual
Introduction
nuclear receptors into close contact with chromatin or the basal transcription
machinery to facilitate transcription. Alternatively, cofactors can form multi-protein
complexes with nuclear receptors to alter their ability to bind DNA. Cofactors with
negative affects on transcription are called corepressors, whereas cofactors with
positive effects on transcription are called coactivators.
Steroid and nuclear hormone receptors are coactivated by interaction with a cofactor dubbed the steroid receptor coactivator (SRC). There are three splicing variants of
this particular coactivator. While the functionality of each isoform differs, the SRC
family shares histone acetyltransferase activity and characteristic structural elements, which include a basic helix-loop-helix motif, a PAS domain, and a nuclear
localization signal.
The first SRC to be cloned and identified was steroid receptor coactivator 1 (SRC1).
This 160 kDa cofactor enhances the transcriptional activity of the nuclear receptors
for estrogen, progesterone, glucocoricoid, thyroid hormone, and retinoid X hormone.
Research has shown that SRC1 can also bind to transcription factors that are not
nuclear receptors, such as TBP and TFIIB. These findings suggest that SRC1 is a
bridging coactivator that connects nuclear receptors to other transcription factors
and an integral part of the regulation of hormone-induced cellular response. Traditionally, protein interactions have been studied by co-immunoprecipitation and
super-gel shift. But because these methods are notoriously time consuming and inefficient, they are not conducive to mapping the network of interactions between the
TFs and the SRC1 cofactor. The SRC1-TF Interaction Arrays enable you to determine
how SRC1 interacts with multiple TFs—all in one experiment. This array-based system for detecting protein interactions is based on Panomics proprietary TF-TF Interaction Array technology.
We currently offer two versions of the SRC1-TF Protein Interaction Array. Version I is
spotted with 54 different consensus sequences; Version II is spotted with 96 different
consensus sequences; and Version III is spotted with 94 different consensus
sequences. (Schematic Diagrams of Versions I, II, and III are provided in Appendices
B, C, and D, respectively.) By using all three versions, you can profile the interactions of SRC1 with 244 unique TFs.
PPARalpha Peroxisome Proliferator-Activated Receptors, or PPARs, are nuclear proteins that
compose a subset of the steroid receptor super-family. These proteins were first
identified by their ability to bind peroxisome proliferators, fatty acid-like molecules
that modulate hepatic lipid metabolism. It is now well established that PPARs are
ligand-dependent TFs and are activated by PPs, endogenous fatty acids, and other
metabolites.
When bound to their cognate ligands, PPARs form a heterodimer with another steroid
receptor, retinoid receptor X (RXR). This protein complex then induces the expression
of metabolism-related genes through binding to specific DNA response elements.
PPARs are also known to interact with other TFs, including Sp1 and Smad4, to regulate transcription. Through these mechanisms, the PPAR family of nuclear receptors
Interaction Arrays User Manual
Page 5
Introduction
is responsible for the cellular response to excess or shortage of dietary factors, an
essential process for maintaining homeostasis.
Three isoforms of PPAR exist–a, b, and g–each playing a separate role in systemic
metabolism. The localization of each protein is illustrative of this diversity of function:
PPARa is found predominantly in the liver, heart, kidney, as well as other tissues
where metabolism is elevated. PPARg, on the other hand, is found only in adipose
tissue and tissues related to the immune system. Of the three, PPARb is the most
ubiquitously expressed.
Despite its abundance, the physiological role of PPARb is largely unknown. PPARa
and PPARg, on the other hand, have been identified as regulators of critical biological
processes. PPARa is involved in the transcriptional regulation of enzymes that breakdown fatty acids; PPARg promotes the creation of adipocytes, the fat cells that control lipid homeostasis and glucose metabolism. Disruption of PPAR function has been
implicated in the development of several chronic diseases, including diabetes and
cancer
NFkB p50 More than 15 years after its discovery, nuclear factor-kB (NFkB) still commands the
interest of researchers in diverse fields. This is due to a variety of factors, including
NFkB’s unusual and rapid regulation, the wide range of genes that it controls, its central role in immunological processes, and its involvement in various diseases.
Regulation of NFkB
NFkB is a family of structurally and functionally related proteins that regulate the transcription of a wide variety of genes. The NFkB proteins, which include p65 (Rel A),
c-Rel, p105/50 (NFkB1), p100/52 (NFkB2), and p68 (Rel B), interact to form
homodimers or heterodimers that bind DNA with different specificities.
Uninduced NFkB is sequestered in the cytoplasm and is bound by IkBs, proteins that
specifically inhibit NFkB family members. NFkBs can be activated by a number of
agents, including lipopolysaccharide, phorbol esters, IL-1, TNFa, protein synthesis
inhibitors, and reactive oxygen intermediates. Treatment with these agents leads to
the phosphorylation and degradation of IkB, and subsequent translocation of
induced NFkB to the nucleus.
NFkB target genes
NFkB regulates the transcription of various target genes. Just a few examples of
NFkB target genes include interferon b, various cytokines, genes encoding cell adhesion molecules and p53.
The expression of NFkB target genes depends not only on the activity of NFkB itself,
but also on a number of other factors, including NFkB’s interaction with other tran-
Page 6
Interaction Arrays User Manual
Introduction
scription factors. Thus, NFkB target genes might not be induced even when NFkB is
active. Furthermore, the pattern of NFkB target genes will be different under different
physiological conditions. By profiling the expression pattern of NFkB target genes,
we can begin to elucidate the NFkB-linked functions of those genes.
Both NFkB p50-TF and NFkB p65-TF Interaction Arrays come in three versions. Version I is spotted with 54 different consensus sequences; Version II is spotted with 96
different consensus sequences; and Version III is spotted with 94 different consensus
sequences. (Schematic Diagrams of Versions I, II, and III are provided in Appendices
B, C, and D, respectively.) By using all three versions, you can profile the interactions of NFkB with 244 unique TFs.
GRalpha Glucocorticoid receptor (GR) is a 94-kDa intracellular protein, which belongs to the
family of steroid hormone receptors. GR mediates the effects of glucocorticoids and
functions as a ligand-activated transcription factor playing an important role in the
development, metabolism, and neurobiology of programmed cell death and
anti-inflammation. In the absence of glucocorticoid, GR is bound by HSP 90 and
localizes in the cytoplasm. Upon glucocorticoid binding, GR becomes hyperphosphorylated, dissociates from Hsp90, and translocates into the nucleus.
In the
nucleus, GR binds to a specific response element in the promoter region of a target
gene and regulates gene expression. These responsive genes make up around 20 %
of the human genome. As corresponding ligands, glucocorticoids are among the
most widely prescribed class of drugs in the world.
GR-TF Protein Interaction Arrays come in three versions. Version I is spotted with 54
different consensus sequences; Version II is spotted with 96 different consensus
sequences; and Version III is spotted with 94 different consensus sequences. (Schematic Diagrams of Versions I, II, and III are provided in Appendices B, C, and D,
respectively.) By using all three versions, you can profile the interactions of GR with
244 unique TFs.
Interaction Arrays User Manual
Page 7
Introduction
Figure 1: Schematic flow chart of the TF Interaction Array procedure
Page 8
Interaction Arrays User Manual
Materials
Materials
Materials Provided
Box 1: Array Membranes & Hybridization Reagents
Interaction Array (either TF-TF, p300-TF, SRC1-TF,
PPARalpha-TF, NFkB p50-TF or GRalpha-TF)
3 each
Hybridization Buffer
15 ml
Substrate Solution I
3 ml
Substrate Solution II
3 ml
Substrate Solution III
5 ml
1000x Streptavidin HRP Conjugate
60 µl
20X SSC
32 ml
20% SDS
15 ml
4X Wash Buffer
45 ml
10X Detection Buffer
25 ml
Distilled H 2O
RNase &
DNase free;
300 µl
Box 2: Reaction Kit
TF-TF Probe Mix
60 µl
Poly d(I-C)
50 µl
Control Nuclear Extract
10 µl
2X Blocking Buffer
30 ml
5X Binding Buffer
100 µl
5X IP Wash Buffer
2 x 1.5 ml
1X IP Dilution Buffer
1.5 ml
1X IP Elution Buffer
0.5 ml
* These reagents are provided as stock solutions. See Appendix A for
instructions on how to dilute these solutions/buffers.
Depending on which kit you purchased, you will also receive:
p53 Goat Polyclonal, IgG (TF-TF)
10 µl; 200 µg/ml
p300 Antibody, rabbit polyclonal (p300-TF)
45 µl; 200 µg/ml
SRC1 Antibody, rabbit polyclonal (SRC1-TF)
45 µl; 200 µg/ml
PPARa Antibody: either Polyclonal OR Monoclonal
(PPARalpha-TF)
45 µl; 200 µg/ml
NFkB p50 Antibody: either Polyclonal OR Monoclonal (NFkB
p50-TF)
45 µl; 200 µg/ml
GR Antibody Polyclonal, Rabbit IgG (GRalpha-TF)
45 µl; 200 µg/ml
Interaction Arrays User Manual
Page 9
Materials
Additional
Materials Required
Reagents & Solutions
Nuclear Extraction kit (e.g., Panomics Nuclear Extraction Kit, Cat. # AY2002)
Hybridization Wash I (2X SSC/0.5% SDS)*
Hybridization Wash II (0.1X SSC/0.5% SDS)*
Deionized H2O
Antibody directed against your TF of interest.
[Optional] Normal IgG Antibody for your negative control
during immunoprecipitation. (Choose a normal IgG antibody
that is specific to your antibody of choice.)
See Appendix A for recipes.
Materials and Equipment
Dynabeads with either protein A (Dynal Biotech, Cat# 100.01) or protein G (Dynal
Biotech, Cat# 100.03) depending on antibody used for immunoprecipitation.
Please do not use agarose or sepharose beads as these bind non-specifically to
the DNA probes, providing false positive results.
Magnetic separation stand (Promega, Cat. # Z5332)
0.5-ml and 1.5-ml tubes
Pipetman and tips
Microcentrifuge
Hybridization oven and bottles † (Stratagene, Cat.# 401030)
† Note: skirted centrifuge tubes with screw caps may be used in place of the hybridization
bottles (VWR, Cat. # 21008-480). Hybridization bottle dimensions: 150 mm x 35-mm
diameter tubes.
Plastic containers (~4.5" x 3.5"; equivalent to the size of a container for 200-ml pipet tips)
Heating block or water bath
Shaker
Plastic sheet protectors or overhead transparencies
Hyperfilm ECL (Amersham, Cat.# RPN3114K)
OR
Chemiluminescence imaging system (e.g., FluorChem from Alpha Innotech Corp.)
Preparing Nuclear Nuclear extracts can be prepared using the method described by Dignam et al. (1).
Extract from Cells Alternatively, you can use a commercially available kit, such as Panomics’ Nuclear
or Tissues Extraction Kit (Cat. # AY2002).
Page 10
Interaction Arrays User Manual
Materials
Preparing 1.
TF-Bound DNA
For each nuclear extract sample, combine the following components into a sterile 1.5-ml microcentrifuge tube. Prepare an additional sample for your negative
control.
Nuclear Extract*
10 µl
Poly d(I-C)
10 µl
TF-TF Probe Mix
10 µl
5X Binding Buffer
15 µl
dH2O (RNase, DNase free)**
30 µl
Total Volume
75 µl
*Use Control Nuclear Extract for positive control. We recommend using 30-100 µg of nuclear
extract per reaction.
**Adjust the volume of dH O based on the concentration of your nuclear extract.
2
2.
Mix well by pipeting.
3.
Incubate samples at 15°C for 30 min. Afterwards, incubate on ice for an additional 30 min.
Immunoprecipitation & BEFORE YOU START: Chill all solutions to 4°C prior to use. Dilute solutions accordElution ingly (see Appendix A). If you plan to proceed directly to overnight hybridization, we
recommend that you first prehybridize your membranes (see Section 7.1, 7.2) before
beginning with Section 6. Estimated time: 2–3 hours.
Using a specific antibody against your TF of interest, you will pull out that TF and any
associated TFs, along with corresponding cis-elements. Wash away free cis-elements and nonspecific binding proteins; then, elute the cis-elements for use as
probe.
NOTE: Antibodies bind with different affinities to protein A or protein G. We recommend that you use the chart below to choose the best affinity Dynabeads for your
specific antibody. Note: Do not use agarose or sepharose beads as these bind
non-specifically to DNA, providing false positive results.
Ig origin
Dynabeads
mouse IgG1
protein G
mouse Ig2a, Ig2b
protein A*
mouse IgG3
protein G
rabbit IgG1
protein A* or protein G
goat IgG
protein G
*Add 0.1% BSA to 1X IP Dilution Buffer and 1X IP Wash
Buffer for protein stability.
Interaction Arrays User Manual
Page 11
Materials
1.
To the tube prepared in step 5, add:
IP Dilution Buffer
Antibody for your TF*
200 µl
(~200 ug/ml), 10 µl
Note: The amount of antibody for immunoprecipitation is variable;
adjust the amount accordingly.
*For your negative control, replace antibody with normal IgG. For your positive control,
replace antibody with p53 Goat Polyclonal, IgG.
2
Mix well by gently tapping the tube. Place sample on rocking platform and rock
gently for 90 min at 4°C.
3.
Wash Dynabeads
3.1 Resuspend the Dynabeads thoroughly in vial.
3.2 Transfer 75 µl of the Dynabead solution to 1.5 ml microcentrifuge tube.
3.3 Place tubes in magnetic stand for one minute (beads will precipitate out).
Pipet off fluid and discard.
3.4 Equilibrate the beads by resuspending them in 200 µl of 1X IP Dilution
Buffer.
3.5 Place tube in magnetic stand for one minute. Carefully, remove
and
discard the supernatant without disturbing the beads attached to the wall
of the tube.
4.
Transfer the DNA/protein/antibody complex (prepared in Step 6.2) to the tube
containing the washed beads. Rock gently on the rocking platform at 4°C for 1
hr.
5.
Collect beads:
5.1 Briefly spin tube in a microcentrifuge at 2,000 rpm for 2 sec.
5.2 Place tube in magnetic stand for 2 min to collect beads. Keeping tubes on
magnetic stand, pipet off fluid and discard (do not disturb pellet).
6.
Wash beads with 1X IP Wash Buffer:
6.1 Add 400 µl of pre-chilled 1X IP Wash Buffer to tube containing beads. Completely resuspend the beads by gently tapping the tube. IMPORTANT:
Gently invert the tube four times to clean the sides of the tube.
6.2 Spin the tube in a microcentrifuge at 2,000 rpm for 2 sec.
6.3 Place the tube in magnetic stand for 2 min to collect beads. Pipet off fluid
Page 12
Interaction Arrays User Manual
Materials
and discard. Important: Be sure to pipet off as much fluid as possible
in this step.
6.4 Repeat Step 6.6.1–3 three times.
7.
Elute probe from beads:
7.1 Preheat heat block to 100°C. Heat the Elution Buffer to dissolve precipitates
before use.
7.2 Add 60 µl of 1X IP Elution Buffer to tube containing beads. Gently mix.
7.3 Incubate at 100°C for 5 min.
7.4 Transfer to ice immediately. Keep on ice for 2 min.
7.5 Spin tube in a microcentrifuge at 2,000 rpm for 5 sec.
7.6 Place tube in magnetic stand for 2 min to collect beads on ice (i.e., place
magnetic stand on ice with tubes).
7.7 Important: Transfer the fluid to a clean tube and place tube on ice. This is
your eluted probe. The beads can be discarded.
If you do not plan to
use the probe immediately, store the probe at –20°C. Prior to use, thaw
probe, and repeat steps 6.7.3 and 6.7.4, to ensure complete denaturation
of double-stranded DNA.
Hybridization In this Section, you will hybridize the eluted probe (prepared in Section 6) to the array
membrane.
1.
Place each array membrane into a hybridization bottle. To wet the membrane,
fill bottle with deionized H O. Then, carefully decant water.
2
2.
To each hybridization bottle that contains an array membrane, add 3–5 ml of
prewarmed Hybridization Buffer (provided). Place each bottle in the hybridization oven at 42°C for 2 hr.
3.
Add the eluted probe from step 6.7.7 to each hybridization bottle and hybridize
at 42°C overnight.
4.
Decant the hybridization mixture from each hybridization bottle, and wash each
membrane:
4.1 Add 50 ml of prewarmed Hybridization Wash I*, incubate at 48°C for 20 min
in a rotating hybridization oven. Decant liquid and repeat wash.
4.2 Add 50 ml of prewarmed Hybridization Wash II*, incubate at 48°C for 20 min
in a rotating hybridization oven. Decant liquid and repeat wash.
* See Appendix A for recipes.
Interaction Arrays User Manual
Page 13
Materials
Detection IMPORTANT: Do not allow the membrane to dry during the detection. Dilute all solutions before use (see Appendix A). Pre-warm the 1X Blocking Solution and 1X Wash
Buffer at 37°–50°C until all particulates are dissolved.
Page 14
1.
Using forceps, carefully remove each membrane from its hybridization bottle
and transfer to a new container containing 20 ml of 1X Blocking Buffer; each
membrane needs its own container. (We use a container that is equivalent to the
size of a 200-ml pipet-tip container, ~4.5" x 3.5".)
2.
Incubate at room temperature for 30 min with gentle shaking.
3.
Transfer 1 ml of Blocking Buffer from each membrane container to a fresh
1.5-ml tube. To each, add 20 µl of 1000x Streptavidin-HRP Conjugate and mix
well. Return each mixture to the appropriate container and incubate at room
temperature for 20 min.
4.
Decant the Blocking Solution containing the antibody. Wash each membrane
three times at room temperature with 20 ml of 1X Wash Buffer, each 5 min.
5.
Add 20 ml of 1X Detection Buffer to each membrane and incubate for 5 min at
room temperature.
6.
To prepare the substrate solution, mix 1 ml Substrate Solution I and 1 ml Substrate Solution II. Add 1 ml Substrate Solution III. Mix well.
7.
Using a plastic sheet protector, overhead transparency film, or plastic wrap
(whichever is readily available), place each membrane on a plastic sheet. Then,
pipet 3 ml of substrate solution onto each membrane and overlay each with a
second plastic sheet. Ensure that substrate is evenly distributed over the membrane with no air bubbles. Incubate at room temperature for 5 min.
8.
Remove excess substrate by gently applying pressure over the top sheet. Using
a paper towel, remove excess substrate that might be remaining on the surface
of the sheets. Expose the membranes using either Hyperfilm ECL or a chemiluminescence imaging system, such as the FluorChem imager from Alpha Innotech Corp. In either case, we recommend that you try several different
exposures of varying lengths of time (e.g., 2–5 min). Overexposure of your blot
may result in excessive background
Interaction Arrays User Manual
Materials
.Results & Analysis The main advantage of the TF-TF Interaction Array is that you can detect the interaction of a protein with multiple transcription factors simultaneously. Follow these
guidelines to analyze your results:
1.
Acquire the images using either x-ray film or a chemiluminescent imaging system.
2.
Adjust the exposure time such that the biotin spots (along the right and bottom
sides of the membrane) have equal signal intensity.
3.
Compare the images between negative control (normal IgG) and experimental.
All the spots that appear in your experimental should be positive; in contrast,
the negative control should not have any spots. If the image of the negative
control has some weak spots, then you’ll need to check whether the same
spots also appear in the experimental. If so, the spots in the experimental may
represent false positives. To confirm your results, perform co-immunoprecipitation or super-gel shift assays.
Toubleshooting
Guide
Problem
Cause
Uneven background
Substrate is not evenly distributed
on the membrane.
Recommendation
Do not use thin cling wrap
materials during the overlay
procedure
Re-detect with substrate that is
evenly covering the membrane
surface.
High Background
Incubation with substrate is too
long.
Expose longer—10 to 15 min
Incubation should not exceed 5
min.
Signal is too weak.
The yield of recovered DNA probe is
low.
Confim using control nuclear
extract (provided).
Check the concentration of
nuclear extract.
No Signal
The antibody may be not suitable
for IP
Test the antibody before
applying to the array.
References TF-TF, SRC-TF, PPARalpha-TF, NFkB p50-TF, GRalpha-TF
1. Dignam, J.D., Lebovitz, R.M., and Roeder, R.G. (1983) Accurate transcription
initiation by RNA polymerase II in a soluble extract from isolated mammalian nuclei.
Nucleic Acids Research 11:1475–1489.
p300-TF
1. Janknecht, R. and Hunter, T. (1996) Transcription control: versatile molecular glue.
Curr Biol 6:22-23.
2. Janknecht, R. and Hunter, T. (1996) MAP kinase-dependent transcriptional coactivation by Elk-1 and its cofactor CBP. Biochem Biophys Res Commun
228:831-837.
3. Shikama, N., Lyon, J., and La Thangue, N.B. (1997) The p300/CBP family: integrating signals with transcription factors and chromatin. Trends Cell Biol 7:230-236.
4. Goodman, R.H. and Smolik, S. (2000) CBP/p300 in cell growth, transformation,
Interaction Arrays User Manual
Page 15
Materials
and development. Genes Dev 14:1553-1577.
5. Chan, H.M. and La Thangue, N.B. (2001) p300/CBP proteins: HAT s for transcriptional bridges and scaffolds. J Cell Science 114:2363-2373.
6. Xu, L., Glass, C.K., and Rosenfeld, M.G. (1999) Co-activator and corepressor
complexes in nuclear receptor function. Curr Opin Genet Dev 9:140-147.
7. Chan, H.M. and La Thangue, N.B. (2001) p300/CBP proteins: HAT s for transcriptional bridges and scaffolds. J Cell Science 114:2363-2373.
8. Ogryzko, V.V., Schiltz, R.L., Russanova, V. et al. (1996) The transcriptional co-activators p300 and CBP are histone acetyltransferases. Cell 87:1107-1112.
9. Korzus, E., Torchia, J., Rose, D.W., et al. (1998) Transcription factor-specific
recruitment of co-activators and their acetyltransferase functions. Science 279:
703-707.
10. Moran, E. (1993) DNA tumour virus transforming proteins and the cell cycle. Curr
Opin Genet Dev 3:63-70.
11.Giles, R.H., Peters, D.J.M. and Breuning, M.H. (1998) Conjunction dysfunction:
CBP/p300 in human disease. Trends Genet 14: 178-183.
Page 16
Interaction Arrays User Manual
APPENDIX A:
APPENDIX A:
Recipes & SECTION 6
instructions for
•
15 ml of 1X IP Wash Buffer
diluting stock
To 12 ml of deionized H O, add 3 ml of 5X IP Wash Buffer (provided).
solutions
2
SECTION 7
•
300 ml of 2X SSC/0.5% SDS (Hybridization Wash I)
To 262.5 ml of deionized H O, add 30 ml of 20X SSC (provided) and 7.5 ml of
20% SDS (provided). Mix well.
2
•
300 ml of 0.1X SSC/0.5% SDS (Hybridization Wash II)
To 291ml of deionized H O, add 1.5 ml of 20X SSC (provided) and 7.5 ml of 20%
SDS (provided). Mix well.
2
SECTION 8
•
60 ml of 1X Blocking Buffer
To 30 ml of deionized H O, add 30 ml of 2X Blocking Buffer (provided). Mix well
and store at 4°C.
2
•
200 ml of 1X Wash Buffer
To 150 ml of deionized H O, add 50 ml of 4X Wash Buffer (provided). Mix well.
2
•
100 ml of 1X Detection Buffer
To 90 ml of deionized H O, add 10 ml of 10X Detection Buffer (provided). Mix well.
2
Interaction Arrays User Manual
Page 17
APPENDIX B:
APPENDIX B:
Schematic
diagram of the
Interaction Array I
Figure 2. Schematic diagram of the Interation Array I. The genes on the array are
spotted in duplicate: the first row is DNA spotted normally, the second row is DNA
diluted 1:10. The dark grey columns along the right and bottom sides of the array
indicate where biotinylated DNA has been spotted. These spots are intended for
alignment. (Note that the notch is at the top, right-hand corner.)
Page 18
Interaction Arrays User Manual
APPENDIX B:
Schematic
diagram of the
Interaction Array II
Figure 3. Schematic diagram of the Interaction Array II. The dark grey columns
along the right and bottom sides of the array indicate where biotinylated DNA has
been spotted. These spots are intended for alignment. (Note that the notch is at the
top, right-hand corner.)
Interaction Arrays User Manual
Page 19
APPENDIX B:
Schematic
diagram of the
Interaction Array
III
Figure 4. Schematic diagram of the Interaction Array III. The dark grey columns
along the right and bottom sides of the array indicate where biotinylated DNA has
been spotted. These spots are intended for alignment. (Note that the notch is at the
top, right-hand corner.)
Page 20
Interaction Arrays User Manual
APPENDIX E:
APPENDIX E:
TF-TF Protein Photocopy this page onto separate piece of paper or transparency film. (Note that the
Interaction Array notch is closest to A24.)
Grid
Interaction Arrays User Manual
Page 21
APPENDIX F:
APPENDIX F:
Stripping Note: We do not encourage stripping the array membranes more than two times.
Procedure for
Arrays Procedure
Page 22
1.
Wash membranes in 0.4M NaOH at 45°C for 30 min .
2.
Wash membranes in 0.2M Tris-HCL, pH 7.6; 0.1X SSC, and 0.1% SDS at 45°C
for 15 min .
3.
To ensure that stripping was successful, run it through the standard chemiluminescence detection procedure as described in this user manual.
4.
After detection, wash the membrane in 1X Washing Buffer at 42°C for 30 min.
5.
Membranes are ready for hybridization or dry the membrane in an 80°C incubator for later use.
Interaction Arrays User Manual
Contacting Panomics
Contacting Panomics
For ordering information or technical support, contact the appropriate resource
provided below according to your geographical location.
Location
U.S. Corporate Headquarters
Address
Panomics, Inc.
6519 Dumbarton Circle
Fremont CA 94555 USA
Telephone
1.510.818.2600
FAX
1.510.818.2610
Email
[email protected]
Technical Support
[email protected] or
1.877.726.6642 option 3
Ordering Information
[email protected]
Location
European Headquarters
Address
Panomics Srl
Via Sardegna 1
20060 Vignate
Milano Italy
Telephone
+39.02.95.360.250
FAX
+39.02.95.360.992
Email
[email protected]
Technical Support
[email protected]
Ordering Information
[email protected]
Location
Asia Pacific Headquarters
Address
Panomics, Inc.
16F Gemdale Plaza
Tower A, No. 91
Jianguo Road
Beijing 100022 P.R. China
Telephone
+86.10.59208157
FAX
+86.10.59208111
Email
[email protected]
Technical Support
[email protected]
Ordering Information
[email protected]
For an updated list of FAQs and product support literature, visit our
website at www.panomics.com.
Interaction Arrays User Manual
Page 23