1
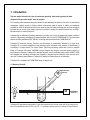
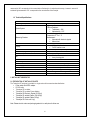
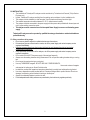
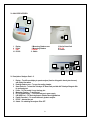
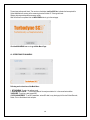
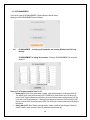
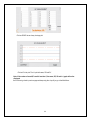
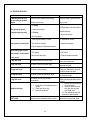
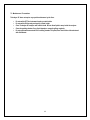
USER’S MANUAL
TULIP DIAGNOSTICS (P) LTD.
Gitanjali, Tulip Block, Dr. Antonion De Rego Bagh, Alto Santacruz Bambolim P.O GOA. Pin: 403202
Phone: +91 832-2458546/51; Fax: +91 832-2458544; Email: [email protected] ; web: www.tulipgroup.com
All rights reserved by Tulip Diagnostics (P) Ltd. No part of this manual may be reproduced in any form or by any
means whatsoever without prior permission from Tulip Diagnostics (P) Ltd.
Version:10/2015-1.0
1
Preface
Thank you very much for patronizing Turbodyne SC.
Kindly read the user manual carefully before operating the analyser to avoid risk to users, damage to instrument and
other equipment. Keep the user manual at a proper place for referring in future.
Tulip Diagnostics (P) Ltd. Does not accept responsibility for damage arising from non-adherence to instructions
provided in the user manual.
Warranty
Each unit of Turbodyne SC has been thoroughly tested before shipment, has been packed carefully to prevent
damage from shipping and handling.
The instrument is warranted against defects for a period of twelve months from delivery. The warranty applies to all
the mechanical and electrical parts. It is valid only for proper installation, use and maintenance in compliance with
instructions given in this manual. Tulip will at its discretion repair or replace parts, which may be found defective in
the warranty period.
The warranty does not include
a) Any responsibility for direct or indirect personal and/or material damages caused by improper use or maintenance
of the analyser.
b) Damage caused by natural calamities such as fire, earthquake etc.
c) Parts that are inherently subject to deterioration.
d) Damage caused by corrosion of electrical parts.
In case of defects due to misuse of the analyser, any incidental expenses like travel and man-hour service charges
will be charged extra.
Technical Service
Tulip is always accessible to the customers for any kind of information about installation, use and maintenance etc.
While asking for service, please refer to this manual, and refer the printed “Serial No.” present at the back panel of
the analyser. Only qualified technicians are entitled to service the analyser; Tulip technical service is available for
maintenance under a yearly maintenance contract or on specific demand.
Ordering spare parts
Parts subject to deterioration, or defectives which need to be replaced, have to be ordered by giving the following
details:• Name and version of the analyser:
• Analyser serial No.:
• Name and address of customer for delivering the ordered goods.
While replacing the parts, the use of ORIGINAL SPARE PARTS guarantees the efficiency and a lasting analyser life.
Ordering Address:
Tulip Diagnostics (P) Ltd.
Gitanjali Tulip Block, Dr. A. A. Rego Bagh, Alto Santa Cruz,
Bambolim Complex P.O. Goa - 403 202.
Tel: + 91 832 2458546-50, Fax: + 91 832 2458544
E mail: [email protected], Website: www.tulipgroup.com
2
SAFETY INSTRUCTIONS:
This manual provides various symbols to ensure that the product may be used in a proper and safe way to prevent
the user and others from risk of injuries and damage to property.
The meanings of the symbols are mentioned below:
Warning: If this sign is ignored and the instrument is not used in correct way, there is potentially hazard risk
that could lead to serious injury or death of the operator, or grave property damage.
Caution: If this sign is ignored and instrument is not used in a correct way, there is potentially hazard risk
that could lead to serious injury or death of the operator, or grave property damage.
Caution with regard to diagnosis
Caution: This product is used for screening of clinical specimens to aid laboratory diagnosis. The Physician is
requested to take clinical examination results and other test results into consideration before making clinical
judgement based on analysis of the clinical specimens.
3
INDEX
Title
Page No.
1. Introduction
1.1. Measuring Principle
1.2. Technical Specifications
2. Installing Turbodyne SC
2.1. Preparation Installation Site
2.2. Installation
2.3. Other precautions during usage
3. Analyser Overview
3.1. Description of analyser parts
3.2. Analyser Operations
3.2.1. The Analyser Operations
3.2.2. Switching on the Analyser
4. Operation of the Main Menu
4.1. Setup Menu
4.1.1. System Setting
4.1.2. Personal Setting
4.1.3. Printer Setting
4.1.4. Other Setting
4.2. System Self-Check
4.3. Measure
4.3.1. Saving Patient Results
4.3.2. Saving QC Results
4.4. Data Management
4.4.1. QC Management
4.4.2. Review QC Data
4.4.3. Review Patient Data
5. Installing Printer Paper
6. Trouble Shooting
7. Maintenance
5
5
6
6
6
7
7
8
8
9
9
9
10
11
11
12
13
13
14
14
18
19
20
20
21
23
23
24
25
4
1. Introduction
Tulip has always believed in its vision of continuously providing “better testing systems for better
diagnostics and preventive health” since its inception.
The increasing patient awareness along with demand for rapid laboratory test results by Clinicians, for better patient
management, requires increase in efficiency without compromising quality of reports. In addition, the inadequate
availability of skilled & dedicated technicians has raised the desire for better technology with improved throughput
that takes care of manual errors thereby improving the quality of reporting for important analytes such as HbA1c,
Microalbuminuria, C-reactive Protein etc.
Understanding the difficulties of handling complexities (incubation time, mixing of reagents and samples, reading of
reactions, programming) associated with immunochemistries led to the birth of TURBODYNE SC. Tulip takes great
pleasure in making laboratories SELF RELIANT in handling immunochemistries with TURBODYNE SC.
Turbodyne SC takes the Accuracy, Precision and Convenience of immunoassay estimation to a higher level.
Turbodyne SC is a creative integration of dual technology optics conformed to the principles of Nephelometry &
Turbidimetry in a single channel. The unique “Optimix” auto mixing technology (without use of stirrer or magnetic
beads) of Turbodyne SC ensures UNIFORM mixing of reagents and samples to achieve optimum reactivity in
immunochemical reactions. Turbodyne SC estimates analytes using Pre-calibrated assay specific SMART CARD
with integrated chip technology, eliminating the probability of programming and calibration errors occurring at the
user end. The battery backup feature of Turbodyne SC makes it an ideal analyser for on-field testing.
Turbodyne SC is compatible with TURBODYNE range of reagents only.
1.1 Measuring Principle
Sc
att
er
ed
Lig
ht
at
1
35 0
Is
D
Nephelometry
Detector
Io
It
Transmitted Light at 180
0
D
Turbidimetry
Detector
L
Turbodyne SC uses dual technology optics. A light beam passes through the test cuvette with Ag-Ab reactions and
falls onto photodetectors placed at 180° and 135°. In turbidimetric assays reduction in intensity of transmitted light
5
measured at 180° corresponds to the concentration of test analyte. In nephelometric assays, increase in amount of
scattered light measured at 135° corresponds to the concentration of test analyte.
1.2 Technical Specifications:
TURBODYNE SC Technical Specifications
Measuring Principle
Nephelometry/Turbidimetry
Light source : 650 nm Laser LED
2 Silicon Detectors:
• Turbidimetry - 180°,
• Nephelometry - 135°
Automatic mixing
Temperature 37°C ± 1°C
Measurement:
• Auto-start with electronic pipette
• Manual start
Inbuilt mixer
• 4.3” graphical touch screen
• On line reaction curve
Inbuilt thermal (56mm Paper size)
Lot specific assay calibration
Auto start of testing time
• 3 levels
• Levey-Jennings plot
RS 232
500 results
PS2 port for barcode reader (optional)
100-240 V, AC 50/60Hz, Poser adaptor 12V
2200 mAH Li-ion battery
290mm (L) X 170 mm (W) X 110 mm (H)
Gross Wt: 2 Kg, Nett Wt.: 1.5 Kg.
Optical System
Measuring Chamber
Mixer
Display
Printer
Smart card (Integrated chip card)
Electronic Pipette
QC
Data Transfer
Data storage
External barcode
Power supply
Battery
Dimension
Weight:
2. INSTALLING TUBODYNE SC
2.1 PREPARATION OF INSTALLATION SITE
The Turbodyne SC analyser is provided in a single carton with accessories described below:
• Power cable with AC/DC adaptor
• RS 232 cable
• Turbodyne SC Incubator
• Turbodyne SC Incubator Power Adaptor
• Turbodyne SC Electronic Pipette (20-200 µl)
• Turbodyne SC variable Pipette (100-1000µl)
• Turbodyne SC variable Pipette (5-50µl)
• Turbodyne SC Printer rolls 1 qty.
Note: Please store the carton and packaging material in a safe place for future use.
6
2.2 INSTALLATION
• The installation of Turbodyne SC analyser must be carried out by Trained service Personal (Tulip’s Service
Engineer only).
• Unpack Turbodyne SC analyser carefully from the packing carton and place it on the installation site.
• The analyser must be installed in a dust free place, free of vibrations and away from direct light.
• The ambient temperature should be between 15 -35° C without excess humidity.
• The analyser should be connected to the power supply with the power cable provided with the analyser and
only if proper earthing connection exists.
• The analyser must be connected to an Uninterrupted Power Supply to ensure non-fluctuating power
supply.
Turbodyne SC analyser must be operated by qualified laboratory professionals or authorised healthcare
professionals only.
2.3 Other precautions during usage:
• Do not use any electro-magnetic or radiation devices near the analyzer.
• If the analyser gives an unusual smell or smoke, cut off the power supply and contact company service
engineers immediately.
• Keep the instrument away from direct contact with liquid to avoid damage the electrical and optical
components of the analyser.
• If any liquid enters in the interior of the analyser, cut off the power supply and contact company service
engineer immediately.
• Do not switch ON and OFF the power supply of the analyser frequently.
• Always cover the reading chamber during measurement. Do not open the reading chamber during a running
test.
• Do not move the analyser during a running test.
• Use only TURBODYNE reagents. DO NOT USE ANY OTHER REAGENTS.
•
Use correct volume of reagents
and samples for testing as per Smart Card instruction
• Incubate the cuvettes with reagent and samples as described in product insert while performing the test.
• Use clean, disposable cuvettes provided with the Turbodyne Reagent Kits to perform the test. Do not use
damaged, scratched or soiled cuvettes for testing on the analyser.
• Always Use calibrated Pipettes to perform the test.
• Follow adequate health safety measures as prescribed by the local/country regulatory authority.
7
3.0 ANALYSER OVERVIEW
4
2
3
1
5
1.
4.
7.
10.
Display
Printer
USB
RS 232
2. Measuring Chamber cover
5. Measuring Chamber
8. Pipette
11. Switch
3. Slot for Smart Card
6. DC 12V
9. Scanner
11
10
8
6
9
7
3.1 Description of Analyser Parts 1-11
1. Display – Touch Screen display to operate analyser (function of keypad is done by touch screen),
and display information.
2. Reading chamber cover – To cover the reading chamber
3. Smart Card slot – To Insert the Turbodyne SC Smart Card provided with Turbodyne Reagents Kits
for performing test.
4. Printer – To Print results / Levey Jennings plot
5. Measuring Chamber – To perform test
6. DC 12V (Power supply) – To connect analyser to power supply
7. USB (USB Port ) – For Servicing Aspects / Mother Board upgradations
8. Pipette (Connector) – To connect electronic pipette to analyser
9. RS 232 – data transfer port
10. Switch – For switching the analyser ON or OFF.
8
Connect the analyser through the provided power cable by connecting to the power supply connecting port (DC 12V)
at the backside of the analyser below the ON/OFF switch.
Connect the Electronic pipette to the sensor port of the analyser.
3.2 ANALYSER OPERATIONS
3.2.1 The analyser operations are carried out with the help of Touch screen display.
The General Display Key Functions before we switch ON the analyser:
>
<
MAIN MENU
EXIT
SAVE
SEND
PRINT
DELETE
: Go to the next page
: Go to the previous page
: Go to the Main Menu
: Exit from the current page / Go to main menu
: To store results or to input patient data
: Send data to host computer
: Prints test results/Levey-Jennings graph
: Delete stored data
3.2.2 Switching ON the analyser – Display shows
The Display automatically moves to the next page in few seconds.
9
The analyser performs self-check. The counter on the display “wait for XXX Sec, indicates the time required for
Optical stabilization & warming of the measuring chamber to attain 37°C during self-check.
Skipping this step would produce erroneous results.
After the self-test is completed click the WELCOME button to go to the next page.
Click the MAIN MENU icon or > to go to Main Menu Page:
4.0 OPERATIONS OF MAIN MENU
Following are the functions of the Main Menu:
1. SET-UP MENU: To enter into settings mode
2. SYSTEM SELF-CHECK: - To check the status of the analyser whether it is in the normal test condition.
3 MEASURE: To perform a test (sample/QC)
4 DATA MANAGEMENT: To set QC parameters, review QC data, Levey Jennings plot & to view Patient Records;
Delete, Print or Send data to host computer.
10
4.1 SET –UP MENU
Clicking the SET-UP MENU button will display:
4.1.1
•
•
•
Clicking the SYSTEM SETTINGS will display:
If the LIS is ON the data can be automatically sent to the host computer.
If the LIS is OFF, then data cannot be sent to the host computer automatically
Patient ID – Default it is ON
11
4.1.2
•
•
Selecting the PERSONAL SETTINGS key will display:
Screen Contrast can be adjusted by using the
&
keys. The setting range is between 1 – 9.
Initial SET-UP is used for setting up Language, Date and time format.
Click the INITIAL SET-UP key and the following display will appear:
Click CONFIRM / > key will display :
12
To enter the current date/time click on the respective windows. A key pad will be emerge to feed the date/time.
Feed the date/time and select the enter key on the key pad to save the date/time.
Clicking the CONFIRM key will lead to SET-UP menu page.
4.1.3
PRINTER SETTINGS
Selecting the Printer settings key will open up the following display.
1)
•
•
2)
Print results:
Selecting “ON” provides the option to print results after each test
Selecting “OFF” turns the printer OFF.
Report Header:
Used to print the Report Heading during printing of test results. For Eg. If TULIP LAB is used in the report
header then “TULIP LAB” will appear in the heading of each test result (refer fig.). To feed the Report
Heading select on the report heading window and a key pad will emerge on the display. Feed the desired
report heading (MAX- 24 characters) and click the enter key to save and return to the PRINTER SETTINGS
menu.
Select the SET-UP or < to return to the SET-UP menu page.
4.1.4
OTHER SETTINGS – Currently not in use.
13
4.2 SYSTEM SELF CHECK
Clicking the SYSTEM SELF CHECK following display appears-
This is strictly for use by the Service Engineer only. The user must only check the display value which must be as
described below:
• The channel 1 linear value range must be 22000-28000
• The Channel 2 linear Value range must be 200 – 400.
• The input power supply range must be between the given range (10.4-12.6 V) Set = 12.0
• The temperature range must be between the displayed range (36.5°C-38.5°C) Set = 37.0.
If any of the values are out of range call our Service Engineer.
Note:
System Check must be checked keeping the reading chamber empty.
Press the EXIT key or MAIN MENU key to go to Main Menu.
4.3 MEASURE
The MEASURE button is used to perform the test.
Selecting MEASURE key from Main Menu will open up the following display:
14
Insert the Smart Card (into the smart card slot) of the parameter to be tested. The arrow side of the Smart Card must
face the display as shown in above picture. Click the CONFIRM - the following display will appear:
The smart card test name with lot No, Expiry date and the Total Number of tests for that Reagent Kit will be
displayed.
Note:
• The parameters on this page cannot be modified.
• Only the K and the D parameter on the display can be edited by clicking the respective positions.
K=1 and D=0 is used to correlate results between different systems.
Click the Confirm button and go to next page.
More parameters of the test in the Smart Card will be displayed:
• Channel 1/Channel 2 – channels for turbidimetry/nephelometry.
• Delay time – Incubation time before adding R2
• Measure time 1 - first reading time of the test reaction
• Measure time 2 – Second reading time of the test reaction
• Measuring unit -is the unit of measurement of the analyte
• Sample (µl): sample volume to be used for the test
• R-1/R-2 (µl): Volume of Reagent 1 and Reagent 2 to be used for each test.
• Normal range: It is the normal reference range. If the test result is lower than normal range a flag “L” will
appear with the result. If the test result is higher than normal range a flag “H” will appear with result.
15
•
Note:
•
Measuring range: The measuring range of the reagent. If the test result is lower than measuring range a flag
“LL” will appear with the result. If the test result is higher than measuring range a flag “HH” will appear with
result. Samples with HH flag must be diluted and retested.
The parameters on the above page cannot be modified.
These parameters are set by the reagent manufacturer and cannot be edited by the user. Turbodyne SC smart card
also contains the Calibration data of the reagent. The user does not need to perform calibration curve for the reagent.
It will be automatically read when the smart card is inserted.
Select CONFIRM key and the following display will appear.
The display indicates the volume of R1 and sample to be used for testing and the incubation time. Perform the test
as described below:
• Take the prescribed amount of R1 and sample in fresh disposable Turbodyne cuvette (provided with
turbodyne reagent kit) and incubate for stated time at 37°C Externally.
• Insert the incubated test cuvette in the reading chamber of the analyser.
• Do not push the cuvette down in reading chamber.
• Click the TESTING button.
• The cuvette will automatically get into proper position after mixing on pressing the “TESTING” button.
• The reagent and samples will be automatically mixed well by the Optimix Technology and the display on
the counter will become active.
• After the incubation time is over the following display will appear.
16
•
•
•
For Auto start of reading, dispense the required volume of R2 with the Electronic pipette ensuring the
Pipette plunger is pressed completely when the reagent is dispensed into the cuvette in the reading
chamber.
The reading will start automatically. After initial auto mixing the reaction will be monitored and the result will
be displayed at the end of the Measuring time. Online reaction curve of the test will be visible on display.
Alternatively the TESTING key can be clicked on addition of R2 reagent to initiate the reading without using
the Electronic Pipette.
On addition of R2 the display will change to:
The analyser will monitor the reaction. On completion of the test following display will appear:
17
The result window displays:
• OD of test sample
• Result of test sample
• Unit of the test sample result
• QC, SAVE, SEND, PRINT and EXIT keys
4.3.1
Add Patient information to test results
Clicking the SAVE key will change to following display:
•
Patient ID can be entered in by keypad / (Optional) Barcode reader. If a barcode reader is connected, scan
the barcode of sample tube, the patient ID will read in. Press the logo of barcode after reading, the sample
No. Will be displayed.
•
Press the display area of patient ID, a small keypad will be emerge. Enter the Patient ID.
•
•
Similarly the data for AGE, NAME and SEX can be entered.
Clicking the CONFIRM key will save the data and will lead to measurement of next sample.
18
4.3.2
Save result as QC data
To save result in QC, Click the QC button and the display will change to:
Selecting the appropriate QC level from the “choice” row will change display to:
Selecting Yes will overwrite the QC value tested earlier on the same day. Selecting No will not store the new QC
data.
Note:
Details of QC must be entered in QC management (refer QC Management) before testing QC.
Selecting the MEASURE key will change the display to be ready for the next test.
19
4.4 DATA MANAGEMENT
This function is used a) QC MANAGEMENT b) Record Review of Results history.
Selecting the DATA MANAGEMENT button will display:
4.4.1
QC MANAGEMENT - for setting up QC parameters and reviewing QC data and to Plot Levey
Jennings.
QC MANAGEMENT for setting QC parameters - Clicking on QC MANAGEMENT will change the
display to:
There are 32 QC locations numbered from 1 to 32.
• Naming the QC: Click on the space beside a number, a key pad will emerge to put the name of the QC.
The name of the QC must be the same as the TEST NAME in the Smart card for which QC test is to be
done. If the QC name is different from test name in the smart card then results cannot be saved in QC. Eg.
If you want to set QC parameters for C - Reactive Protein test and its test name in the Smart card is CRP,
then the name for the QC must also be put as CRP. Then QC for the C-reactive protein test will be saved in
that location.
• Setting data for QC: Select “Please input test number” window, a small key pad will appear. Select the
location number in which you want to enter QC parameters and click enter key.
20
•
Then click “CONFIRM” key. The display will change to:
Three levels of QC can be programmed for each test. One QC level in each column. Input the QC data as described
below:
• QC Name: Enter Name of the control vial used for QC (for Eg. Level I , Level II, Level III)
• QC Lot: Enter Lot No of control vial
• QC expiry: Enter Expiry date of control vial
• QC Target: Enter Mean value of control vial
• QC Range: Enter lower and higher range of the control vial
• QC Unit: Enter the Unit of measurement of the control vial.
• Choice – What is input in QC name the same will automatically appear in the “Choice” row of respective
column.
4.4.2 For Reviewing QC data:
Put the location number in “Please input Test No” of the QC data you want to review and click the Confirm button, the
display will change to.
•
Clicking on the Choice of a particular QC column will display the data (QC test data) for that particular QC.
21
Click on GRAPH to see Levey Jennings plot.
Click on Print to print The L-J plot with mean, SD and CV.
Note: If the number of saved QC result is less than 5, the mean, SD, CV and L-J graph will not be
displayed.
Use Confirm to go back to previous page and keep using the < key till you go to the Main Menu.
22
4.4.3
For reviewing patient data Click on record review (fig) and the following display will appear.
The display shows stored patient data. 500 test results can be stored. The results are displayed
with date and time of testing. Use > key to go to the next page and < key to go to previous page.
• To search result by test click on the Test button and feed the test name in the window
beside Date & Time button. All the results for that particular test will be displayed.
• To search the result of a particular patient, click on the PATIENT ID button at and enter
the patient ID and click CONFIRM. Results for the Patient ID will be displayed.
• To search results by date click on the Date & time button and feed the date. All the results
will be displayed
• To PRINT, DELETE or SEND the patient data to host computer, select the patient ID’s
(the colour of text will change to blue) and then the respective buttons to be used.
• Use the EXIT, CONFIRM or < keys to go to the MAIN MENU.
5.0 INSTALLING THE PRINTER PAPER
Printer cover: a 58 mm thermal printer is inside the printer cover.
Remove the Printer Cover and install the Thermal Paper.
23
6.0 TROUBLE SHOOTING
ERROR
CAUSE
ACTION
Instrument does not react
on connecting to the main
adaptor
Check the mains connection and all plug
Check the mains connection and all
contacts may be faulty
plug contacts
1. In Testing
1-3.Please wait for the instrument to
After pressing a button,
2. In storing parameters
instrument does not react
3. In Printing
complete the work
4. Replace print paper
4. No Printer paper
Test results are not accurate
1. There may be bubbles in cuvette.
1-2. Replace the cuvette
2. The cuvette is not clean
3. Replace new reagent
3. Expired reagents or deteriorated reagent
When testing high concentr
1. LED ageing
1. Call Service
2. Beyond the linear range
2. Dilute the sample and retest
ation sample, the test result
is not correct
L flag with result
The result is below the normal range.
H flag with result
The result is above the normal range.
HH flag with result
The result is above linearity.
LL flag with result
The result is below the measuring range.
P flag with result
The sample has very high analyte
concentration
Reagent Lot Expiry
NO TEST AVAILABLE /
TEST OVER
1. Smart card is not inserted properly in
the slot.
2. Smart card chip is dirty
3. Defective Smart card
Appears when the card is used after
completion of the prescribed number of tests.
24
No action to be taken. Report result
< the normal range value
No action to be taken. Report the
displayed test result.
Dilute the sample 1:5 and retest.
Multiply the obtained test result with
the dilution factor and report.
Report the result with < lower limit of
the measuring range.
Dilute the sample 1:5 and retest.
Multiply the result with dilution factor
to report.
1. Remove the card & reinsert
the card properly.
2. Clean the Smart card chip
area with clean dry cloth
and reinsert card.
1-3. If the problem persists call
the company representative.
Discard the IC card as it has been
completed its programmed usage.
7.0 Maintenance / Precautions
Turbodyne SC does not require any special maintenance by the User.
•
•
•
•
•
Do not switch OFF the instrument keeping cuvette inside.
Do not switch ON the analyser keeping cuvette inside.
Clean Turbodyne SC analyser with a moist cloth. DO not allow liquid to seep inside the analyser.
Clean the reading chamber if any liquid (sample or reagent) spillage regularly.
Do not spill hazardous material in the reading chamber. If spilled, then clean with a cloth moistened
with disinfectant.
25