1
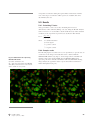
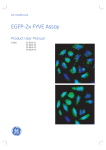
7-26UM external cover user manual 20/3/03 02:38 pm Page 1 user manual GFP Assays 25-8007-26 25-8007-49 25-8010-36 25-8010-37 GFP Assays 25-8007-26 25-8007-49 25-8010-36 25-8010-37 GFP-PLCδδ-PH domain Assay GFP-PLCδδ-PH domain Assay um 25-8007-26UM Rev A, 2003 um 25-8007-26UM Rev A, 2003 user manual GFP-PLCδ-PH domain Assay 25-8007-26 25-8007-49 25-8010-36 25-8010-37 GFP-PLCδδ-PH domain Assay um 25-8007-26UM, Rev A, 2003 Page finder Chapter 1. Introduction 1.1. Introduction . . . . . . . . . . . . . . . . . . . . . . . . . . . . . . . . . . . . . . . . 1 Chapter 2. Licensing Considerations 2.1. Product right to use . . . . . . . . . . . . . . . . . . . . . . . . . . . . . . . . . . 1 2.2. Legal . . . . . . . . . . . . . . . . . . . . . . . . . . . . . . . . . . . . . . . . . . . . 1 Chapter 3. Product Contents 3.1. Components summary . . . . . . . . . . . . . . . . . . . . . . . . . . . . . . . . . 1 3.2. CHO derived cell line expressing GFP-PLCδδ-PH domain fusion protein – NIF1954. . . . . . . . . . . . . . . . . . . . . . . . . . . . . . . . . . . . 1 3.2.1. CHO derived parental cell line . . . . . . . . . . . . . . . . . . . . . . . . . . 1 3.2.2. CHO derived GFP-PLCδ-PH domain expressing cell line . . . . . . . . 1 3.3. GFP-PLCδδ-PH domain expression vector – NIF1991 . . . . . . . . . . . . 1 3.4. Materials and equipment required . . . . . . . . . . . . . . . . . . . . . . . . 2 3.5. Instrument requirements . . . . . . . . . . . . . . . . . . . . . . . . . . . . . . . 2 3.5.1. IN Cell Analyzer . . . . . . . . . . . . . . . . . . . . . . . . . . . . . . . . . . . . 3 3.5.1. Analysis of GFP-PLCδ-PH domain Assay on epifluorescence microscopes . . . . . . . . . . . . . . . . . . . . . . . . . . . . . . . . . . . . . . . 3 3.6. Software requirements. . . . . . . . . . . . . . . . . . . . . . . . . . . . . . . . . 3 Front cover: Top image: Basal distribution of GFPPLCδ-PH domain. CHO-derived cell line stably expressing GFP-PLCδ-PH domain, imaged before the addition of agonist. The GFP fusion protein is most concentrated at the plasma membrane. DRAQ5 nuclear stain also shown. Bottom image: Agonist-induced distribution of GFP-PLCδ-PH domain. CHO-derived cell line stably expressing GFP-PLCδ-PH domain, imaged ∼ 20 s after the addition of 300 µM ATP. The amount of GFP fusion protein at the plasma membrane is decreased after treatment. DRAQ5 nuclear stain also shown. BioImage is a Danish Biotech company specializing in developing drug candidates that exert their activity through modulation of protein translocation. For more information, visit their Web site at www.bioimage.dk um 25-8007-26UM, Page finder, Rev A, 2003 Chapter 4. Safety Warnings, Handling and Precautions 4.1. Safety warnings . . . . . . . . . . . . . . . . . . . . . . . . . . . . . . . . . . . . . 1 4.2. Storage . . . . . . . . . . . . . . . . . . . . . . . . . . . . . . . . . . . . . . . . . . . 2 4.3. Handling . . . . . . . . . . . . . . . . . . . . . . . . . . . . . . . . . . . . . . . . . . 2 4.3.1. Vector . . . . . . . . . . . . . . . . . . . . . . . . . . . . . . . . . . . . . . . . . . . . 2 4.3.2. Cells . . . . . . . . . . . . . . . . . . . . . . . . . . . . . . . . . . . . . . . . . . . . . 2 Chapter 5. Cell Assay Design 5.1. Culture and maintenance of CHO derived GFP-PLCδδ-PH domain expressing cell line . . . . . . . . . . . . . . . . . . . . . . . . . . . . . . . . . . 1 5.1.1. Tissue culture media and reagents required . . . . . . . . . . . . . . . . . 1 5.1.2. Reagent preparation. . . . . . . . . . . . . . . . . . . . . . . . . . . . . . . . . . 1 5.1.3. Cell thawing procedure . . . . . . . . . . . . . . . . . . . . . . . . . . . . . . . . 2 5.1.4. Cell sub-culturing procedure . . . . . . . . . . . . . . . . . . . . . . . . . . . . 2 5.1.5. Cell seeding procedure . . . . . . . . . . . . . . . . . . . . . . . . . . . . . . . . 3 5.1.6. Cell freezing procedure. . . . . . . . . . . . . . . . . . . . . . . . . . . . . . . . 4 5.1.7. Growth characteristics . . . . . . . . . . . . . . . . . . . . . . . . . . . . . . . . 4 ● 1 5.2. Assay set up. . . . . . . . . . . . . . . . . . . . . . . . . . . . . . . . . . . . . . . . 4 5.2.1. Live cell GFP-PLCδ-PH domain assay using the IN Cell Analyzer 3000 . . . . . . . . . . . . . . . . . . . . . . . . . . . . . . . . . . . . . . 4 5.2.2. Microplate set up for 96 well format assays . . . . . . . . . . . . . . . . . 4 5.2.3. Schematic antagonist assay protocol for use with the IN Cell Analysis System. . . . . . . . . . . . . . . . . . . . . . . . . . . . . . . . . . 5 5.2.4. Detailed antagonist assay protocol (96 well format) . . . . . . . . . . . . 6 5.2.5. Timing schedule. . . . . . . . . . . . . . . . . . . . . . . . . . . . . . . . . . . . . 6 5.2.6. Important considerations . . . . . . . . . . . . . . . . . . . . . . . . . . . . . . 6 5.3. Results . . . . . . . . . . . . . . . . . . . . . . . . . . . . . . . . . . . . . . . . . . . 7 5.3.1. Calculating Z’-factor . . . . . . . . . . . . . . . . . . . . . . . . . . . . . . . . . . 7 5.3.2. Example results . . . . . . . . . . . . . . . . . . . . . . . . . . . . . . . . . . . . . 7 5.4. Assay characterization . . . . . . . . . . . . . . . . . . . . . . . . . . . . . . . . 8 5.4.1. Translocation index . . . . . . . . . . . . . . . . . . . . . . . . . . . . . . . . . . 8 5.4.2. Summary of quantitative assay parameters. . . . . . . . . . . . . . . . . . 8 5.4.3. Seeding density . . . . . . . . . . . . . . . . . . . . . . . . . . . . . . . . . . . . . 9 5.4.4. ATP dose response. . . . . . . . . . . . . . . . . . . . . . . . . . . . . . . . . . . 9 5.4.5. Time course . . . . . . . . . . . . . . . . . . . . . . . . . . . . . . . . . . . . . . . 10 5.4.6. Sensitivity of assay to DMSO, Ethanol and Methanol . . . . . . . . . . 10 5.4.7. Effects of different culture conditions . . . . . . . . . . . . . . . . . . . . . 11 5.4.8. 96 well microplate stability . . . . . . . . . . . . . . . . . . . . . . . . . . . . 11 Chapter 6. Vector use details 6.1. General guidelines for vector use . . . . . . . . . . . . . . . . . . . . . . . . . 1 6.2. Transient transfection with pCORON1000-GFP-PLCδδ-PH domain . . . 1 6.3. Stable cell line generation with pCORON1000-GFP-PLCδδ-PH domain . . . . . . . . . . . . . . . . . . . . . . . . . . . . . . . . . . . . . . . . . . . 1 Chapter 7. Quality Control 7.1. GFP-PLCδδ-PH domain cell line . . . . . . . . . . . . . . . . . . . . . . . . . . . 1 7.2. GFP-PLCδδ-PH domain expression vector . . . . . . . . . . . . . . . . . . . . 1 Chapter 8. Troubleshooting Guide 8.1. Troubleshooting guide . . . . . . . . . . . . . . . . . . . . . . . . . . . . . . . . . 1 Chapter 9. References 9.1. References. . . . . . . . . . . . . . . . . . . . . . . . . . . . . . . . . . . . . . . . . 1 Chapter 10. Related Products 10.1. um 25-8007-26UM, Page finder, Rev A, 2003 Related products . . . . . . . . . . . . . . . . . . . . . . . . . . . . . . . . . . . . 1 ● 2 Chapter 11. Appendix 11.1. um 25-8007-26UM, Page finder, Rev A, 2003 Appendix A: Restriction map of pCORON1000-GFP-PLCδδ-PH domain . . . . . . . . . . . . . . . . . . . . . . . . . . . . . . . . . . . . . . . . . . . 1 ● 3 Chapter 1. Introduction 1.1 Introduction In mammals, the delta isoform of phospholipase C (PLCδ) is expressed in a variety of tissues (1). It has been shown that genes homologous to that encoding mammalian PLCδ in yeast and plants play important roles in cell growth and/or responses to environmental stress (2, 3). One of the PLCδ isoforms, PLCδ1, is ubiquitously expressed in a variety of tissues (1) and has three lipid-interacting domains: a pleckstrin homology (PH) domain, a C2 domain and a catalytic core domain (4). PLCδ1 normally resides at the plasma membrane by virtue of its PH domain (5, 6, 7, 8). The PH domain binds to phosphoinositides which are components of the cell membrane and inositol phosphates which are the head group of phosphoinositides (9). The PH domain of PLCδ1 (PLCδ-PH) plays a critical role in its membrane targeting. The subcellular distribution of PLCδ1 is under osmotic regulation in MDCK cells (8), and hypotonic shock will induce its dissociation from the plasma membrane (7). The hydrolysis of a minor membrane phospholipid, phosphatidylinositol 4,5-biphosphate (PIP2), by PLCδ1 is one of the earliest key events in the regulation of various cell functions by more than 100 extracellular molecules (10, 11, 12, 13). A major function of the PH domain in PLCδ1 is to modulate enzyme activity, and PIP2 has been identified as a ligand for the domain (14). PLCδ1 also recognizes phosphatidylinositol (PI), phosphatidylinositol 4-phosphate (PIP), as well as PIP2, and carries out the Ca2+-dependent hydrolysis of these inositol phospholipids (15). PLCδ1 binds selectively to PIP2 over other phosphatidylinositol lipids, and thus provides a specific probe for activation of PIP2 metabolism (16, 17). PLCδ1 hydrolyses PIP2, generating two second messengers, inositol 1,4,5-triphosphate (IP3) and diaglycerol (DAG). The PLCδ1 PH domain facilitates processive hydrolysis of PIP2 by tethering the catalytic core of this enzyme to the membrane surface (16). The IP3 released into the cytoplasm mobilizes Calcium from internal stores and promotes an influx of external Calcium, whereas DAG activates protein kinase C (1, 12, 18, 19). In resting cells, PLCδ1 is localized at the plasma membrane, similar to other PLC isoforms. PLCδ1 activity is feedback-inhibited by IP3, which has an eight fold higher affinity for PLCδ1 than does PIP2 (20). This manual describes a live-cell screening assay for agonist-induced activation of PLCδ-PH, using a probe that incorporates the proprietary GFP™ green fluorescent protein variant. The assay employs Redistribution™ technology to monitor the intracellular translocation of a GFP-PLCδ-PH domain fusion protein in a stably transfected mammalian cell line. GFP-PLCδ-PH is associated with the inner surface of the plasma membrane in resting cells, and translocates transiently into the cytoplasmic space upon pathway stimulation by an agonist. Further general pathway information follows in the biology schematics below (Fig 1.1. and Fig 1.2.). This assay has been optimized to be read on the IN Cell Analyzer™ 3000 system, using the Plasma Membrane Trafficking acquisition protocol and data analysis module. When the pathway is stimulated, the GFP-PLCδ-PH domain um 25-8007-26UM, Chapter 1, Rev A, 2003 ● 1 fusion protein translocates from the plasma membrane into the cytoplasm, causing an intracellular redistribution of fluorescence intensity. The Plasma Membrane Trafficking analysis module allows this response to be quantified relative to an ATP agonist control. ATP has a typical EC50 of 5 µM in this assay, and the dose-response concentration range is 0.3–300 µM. The response of the PLCδ-PH domain assay is transient, reaching a maximum level 20–25 s after stimulation with 300 µM ATP, and decreasing to near resting levels within 2 min. The assay protocol provided is formatted for antagonist screening, and requires pre-incubation of cells with test compounds. While the cells are in the IN Cell Analyzer 3000, for each well a baseline image is captured followed by a timeseries of 7 images (data points), at 5 s intervals after the addition of the reference agonist (ATP). On-line image analysis allows quantification of the time-dependent redistribution response. N Extracellular ADRA1B GPCR Gαh Gαh PLCδ1 Inactive GTP P PIP2 H2O GDP DAG DAG p122 RhoGAP Ca++ PLCδ1 Ca++ PKC IP3 PLCδ1 Ca++ Inactive PKC IP3 Ca++ Ca++ Ca++ Ca++ Ca++ Ca++ Cytoplasm Fig 1.1.: PLCδδ-PH domain signaling pathway (provided with permission from BioCarta, www.biocarta.com). um 25-8007-26UM, Chapter 1, Rev A, 2003 ● 2 Fig 1.2.: Agonist induced redistribution of GFP-PLCδ-PH domain from the plasma membrane to the cytoplasm Agonist, 20–25 s Un-stimulated cell: GFP-PLCδ-PH domain is most concentrated at the plasma membrane um 25-8007-26UM, Chapter 1, Rev A, 2003 25–120 s Stimulated cell: GFP-PLCδ-PH domain translocates transiently to cytoplasmic space. Post-stimulated cell: GFP-PLCδ-PH domain re-accumilates at plasma membrane ● 3 Chapter 2. Licensing considerations 2.1. Product right to use Use of the GFP-PLCδ-PH domain Assay is limited as stated in the terms and conditions of sale. These vary in accordance with the product code purchased. Description Product code Non-commercial educational scientific 25-8010-36 Research for the discovery and development of human therapeutics 25-8007-49 Screening for the discovery and development of human therapeutics 25-8007-26 Assay Evaluation for 6 month period for 12 month period 25-8010-36 25-8010-37 2.2. Legal Cy is a trademark of Amersham Biosciences Limited Amersham and Amersham Biosciences are trademarks of Amersham plc BioImage and Redistribution are trademarks of BioImage A/S Biocarta is a trademark of Biocarta Inc FuGENE is a trademark of Fugent, LLC Microsoft is a trademark of Microsoft Corporation FACS is a trademark of Becton Dickinson and Co Oracle is a trademark of Oracle Corporation Cellomics and ArrayScan are trademarks of Cellomics Inc Hoechst is a trademark of Aventis Geneticin is a registered trademark of Life Technologies Inc DRAQ5 is a trademark of Biostatus Limited This product was developed with and sold under license from BioImage A/S under patents US 6 172 188, EP 851874 and EP 0896753 and other pending and foreign patent applications, and under license from Vertex Pharmaceuticals (formerly Aurora Biosciences Corporation) under patents: US 5 625 048, US 5 777 079, US 5 804 387, US 5 968 738, US 5 994 077, US 6 054 321, US 6 066 476, US 6 077 707, US 6 090 919, US 6 124 128, US 6 172 188, European patent 1104769 and Japanese patent JP3283523, and other pending and foreign patent applications. The CMV promoter is covered under US patents 5 168 062 and 5 385 839 and its use is permitted for research purposes only. Any other use of the CMV promoter requires a license from the University of Iowa Research Foundation, 214 Technology Innovation Center Iowa City IA52242 USA. This product is sold under license from Columbia University under US patent Nos. 5 491 084 and um 25-8007-26UM, Chapter 2, Rev A, 2003 ● .1 6 146 826. Rights to use this product, as configured, are limited to internal use for screening, development and discovery of therapeutic products; NOT FOR DIAGNOSTIC OR THERAPEUTIC USE IN HUMANS OR ANIMALS. No other rights are conveyed. For customers wishing to use the assay for screening for potential therapeutic agents attention is drawn to the existence of US Patent Number 6 054 280 'Methods for Diagnosis and Treatment of PH Domain Signal Transduction Disorders' issued 25 April 2000 and assigned to Sugen Inc, CA, USA All goods and services are sold subject to terms and conditions of sale of the company within the Amersham Biosciences group, which supplies them. A copy of these terms and conditions is available on request. © Amersham Biosciences UK Limited 2003 - All rights reserved http://www.amershambiosciences.com Amersham Biosciences UK Limited Amersham Place Little Chalfont Buckinghamshire HP7 9NA UK Amersham Biosciences AB SE-751 84 Uppsala Sweden Amersham Biosciences Corp 800 Centennial Avenue PO Box 1327 Piscataway NJ08855 USA Amersham Biosciences Europe GmbH Munzinger Strasse 9 D-79111 Freiburg Germany um 25-8007-26UM Chapter 2, Rev A, 2003 ● 2 Chapter 3. Product contents 3.1. Components summary ● CHO derived cells expressing the GFP-PLCδ-PH domain fusion protein (2 vials each containing 1 ml and 1 × 10⁶ cells) – NIF1954 ● pCORON1000 GFP-PLCδ-PH domain expression vector (1 vial containing 10 µg DNA, at 250 µg/ml, supplied in TE buffer: 10 mM Tris, 1 mM EDTA pH 8.0) – NIF1991 ● User manual 3.2. CHO derived cell line expressing GFP-PLCδ-PH domain fusion protein - NIF1954 3.2.1. CHO derived parental cell line The CHO-hIR cell line is of Chinese hamster ovary origin, derived from CHO-K1 (ATCC CCL-61) cells (21, 22, 23) that have been stably transfected with a non-mutated full-length human Insulin receptor (hIR) (24). The cells were transfected by a non-viral method and the hIR expression is under control of the metallothionein promoter. The vector contains the dihydrofolate reductase (DHFR) gene that allows selection of expressing cells with methotrexate (MTX). 3.2.2. CHO derived GFP-PLCδ-PH domain expressing cell line CHO derived cells were transfected with the pCORON1000 GFP-PLCδ-PH domain vector (supplied) using a lipofectamine-based method. A stable clone expressing the recombinant fusion protein was selected using 500 µg/ml Geneticin. The isolated clone was grown for 30 passages before being sorted using a FACS machine. The cells were grown for a further 3 passages before freezing. The cells tested negative for mycoplasma, bacteria and yeast contamination (testing details are available upon request). The hIR expression appears to be extremely stable in CHO cells without MTX selection pressure, the cell line having retained Insulin-sensitivity for several passages in the absence of MTX. MTX selection pressure is not recommended with this particular cell line because CHO cells may develop MTX resistance by several reported mechanisms, including alterations to DHFR and decreased membrane transport (25). If the ability to exert continued selection pressure is desired, then a DHFR-deficient CHO cell is recommended, along with a selection medium lacking Glycine, Hypoxanthine, and Thymidine (26). The present hIR expression levels in these cells are unknown. However, the cell line is responsive to both Insulin and Insulin-like growth factor 1 (IGF-1) in the low nanomolar range, consistent with literature reports (27). 3.3. GFP-PLCδ-PH domain expression vector – NIF1991 The 6.7 kb plasmid pCORON1000 GFP-PLCδ-PH domain, contains a bacterial ampicillin resistance gene and a mammalian neomycin resistance gene (Fig 3.1.). The sequence of the construct is available on a CD upon request. A detailed restriction map is shown in chapter 11, appendix A. um 25-8007-26UM, Chapter 3, Rev A, 2003 ● 1 Fig 3.1.: Vector map of the supplied GFPPLCδδ-PH domain expression vector ApaLI (6376) CMV enhancer NcoI (514) CMV promoter HindIII (757) Ampicillin resistance gene PstI (839) ApaLI (5130) Chimeric intron ApaLI (4633) pCORON1000-GFP-PLCδ-PH domain 6706 bp BamHI (4620) ClaI (4607) NcoI (1265) GFP-PLCδ-PH domain AvaI (1834) AvaI (2102) Synthetic poly A NcoI (4258) NcoI (2229) PstI (2325) Neomycin resistance gene PstI (3879) EcoRI (2354) XmaI (2383) HindIII (3648) AvaI (2383) NcoI (3539) SmaI (2385) f1 ori SV40 enhancer/early promoter SV40 late polyA NcoI (3243) ClaI (2638) 3.4. Materials and equipment required The following materials and equipment are required, but not provided. ● Microplates. For analysis using the IN Cell Analysis System, Packard Black 96 Well ViewPlates (Packard Cat # 6005182) are recommended. For assays in 384 well format, please email [email protected] for recommendations. ● A CASY 1 Cell Counter and Analyzer System (Model TT) (Schärfe System GmbH) is recommended to ensure accurate cell counting prior to seeding. Alternatively a hemocytometer may be used. ● Environmentally controlled incubator (5% CO2, 95% relative humidity, 37 °C) ● Imager/microscope (e.g. IN Cell Analyzer 3000) ● Laminar flow cell culture bench ● Tissue culture flasks (T-flasks) and pipettes ● Controlled freezing rate device providing a controlled freezing rate of 1 °C per min ● Standard tissue culture reagents and facilities (see also section 5.1.1.) 3.5. Instrument requirements The GFP-PLCδ-PH domain assay has been developed and optimized for analysis using the IN Cell Analyzer 3000, in conjunction with the Plasma Membrane Trafficking analysis module. Please refer to the instrument user manual for details on instrument set up and the module manual for details on the algorithm settings. For further information on either of these products, please contact Amersham Biosciences. um 25-8007-26UM, Chapter 3, Rev A, 2003 ● 2 3.5.1. IN Cell Analyzer 3000 The IN Cell Analyzer 3000 is a line-scanning, laser-based, confocal imaging system, with three high-speed CCD cameras. It has been developed specifically for performing information-rich cellular assays rapidly and at high resolution, enabling high-throughput and high-content testing of drug compounds. 3.5.2. Analysis of GFP-PLCδ-PH domain assay on epifluorescence microscopes For speed of screening and quality of the images obtained, we recommend performing the GFP-PLCδ-PH domain assay on the IN Cell Analyzer 3000. However, it is possible to adapt the assay to be read on alternative imaging platforms. Laboratory grade inverted epifluorescence microscopes such as the Nikon Diaphot or Eclipse models or the Zeiss Axiovert model are suitable for image acquisition. A high-quality objective (Plan/Fluor 40 × 1.3 NA or similar) and epifluoresence filter sets compatible with GFP and the desired nuclear dye will be required. A motorized stage with multi-well plate holder and a heated stage enclosure are also recommended for assays performed on epifluorescence microscopes, and a suitable software package will be required for image analysis. 3.6. Software requirements IN Cell Analysis System: The Plasma Membrane Trafficking analysis module is used to measure the translocation of a fluorescent probe between the cellular plasma membrane and the cytoplasm. The GFP-PLCδ-PH domain assay utilizes this algorithm to monitor the translocation of GFP labelled PLCδ-PH domain from the plasma membrane to the cytoplasm in kinetic mode. Analyzed data are exported as numerical files in ASCII format. ASCII format data can be utilized by Microsoft™ Excel, Microsoft Access, or any similar package, for further data analysis as desired. Confocal or epifluorescence microscope: Suitable software will be required for analysis of images acquired on microscopes other than the IN Cell Analyzer 3000. um 25-8007-26UM, Chapter 3, Rev A, 2003 ● 3 Chapter 4. Safety warnings, handling and precautions 4.1. Safety warnings Warning: For research use only. Not recommended or intended for diagnosis of disease in humans or animals. Do not use internally or externally in humans or animals. CAUTION! Contains genetically modified material Genetically modified cells supplied in this package are for use in a suitably equipped laboratory environment. Users within the jurisdiction of the European Union are bound by the provisions of European Directive 98/81/EC which amends Directive 90/219/EEC on Contained Use of Genetically Modified Micro-Organisms. These requirements are translated into local law, which MUST be followed. In the case of the UK this is the GMO (Contained Use) Regulations 2000. Information to assist users in producing their own risk assessments is provided in sections 3.3.1 and 3.3.2 of 'The Genetically Modified Organisms (contained use) Regulations 2000'. http://www.legislation.hmso.gov.uk/si/si2000/20002831.htm . Risk assessments made under 'The Genetically Modified Organisms (Contained Use) Regulations 2000' for our preparation and transport of these cells indicate that containment 1 is necessary to control risk. This risk is classified as GM Class 1 (lowest category) in the United Kingdom. For handling precautions within the United States, consult the National Institute of Health's Guidelines for Research Involving Recombinant DNA Molecules. Instructions relating to the handling, use, storage and disposal of genetically modified materials: 1. These components are shipped in liquid Nitrogen vapor. To avoid the risk of burns, extreme care should be taken when removing the samples from the vapor and transferring to a liquid Nitrogen storage unit. When removing the cells from liquid Nitrogen storage and thawing there is the possibility of an increase in pressure within the vial due to residual liquid nitrogen being present. Appropriate care should be taken when opening the vial. 2. Genetically modified cells supplied in this package are for use in suitably equipped laboratory environment and should only be used by responsible persons in authorized areas. Care should be taken to prevent ingestion or contact with skin or clothing. Protective clothing, such as laboratory overalls, safety glasses and gloves should be worn whenever genetically modified materials are handled. 3. Avoid actions that could lead to the ingestion of these materials and NO smoking, drinking or eating should be allowed in areas where genetically modified materials are used. 4. Any spills of genetically modified material should be cleaned immediately with a suitable disinfectant. 5. Hands should be washed after using genetically modified materials. 6. Care should be taken to ensure that the cells are NOT warmed if they are um 25-8007-26UM, Chapter 4, Rev A, 2003 ● 1 NOT being used immediately. To maintain viability DO NOT centrifuge the cells upon thawing. 7. Most countries have legislation governing the handling, use, storage, disposal and transportation of genetically modified materials. The instructions set out above complement Local Regulations or Codes of Practice and users of these products MUST make themselves aware of and observe the Local Regulations or Codes of Practice, which relate to such matters. For further information, refer to the material safety data sheet(s) and / or safety statement(s). 4.2. Storage The pCORON-GFP-PLCδ-PH domain expression vector (NIF1991) should be stored at -15 °C to -30 °C. The CHO derived cells expressing the GFP-PLCδ-PH domain fusion protein (NIF1954) should be stored at -196 °C in liquid Nitrogen. 4.3. Handling 4.3.1. Vector After thawing the DNA sample, centrifuge briefly to recover the contents. 4.3.2. Cells Care should be taken to ensure that the cells are not warmed if they are not being used immediately. Do not centrifuge the cell samples upon thawing. um 25-8007-26UM, Chapter 4, Rev A, 2003 ● 2 Chapter 5. Cell assay design 5.1. Culture and maintenance of CHO derived GFPPLCδδ-PH domain expressing cell line 5.1.1. Tissue culture media and reagents required The following media and buffers are required to culture, maintain and prepare the cells, and to perform the assay. ● GIBCO™ Nutrient Mixture F-12 Ham medium with Glutamax, Invitrogen™ life technologies 31765-027 or equivalent. ● GIBCO Fetal Bovine Serum (FBS), Invitrogen life technologies 10099-141 or equivalent. Heat inactivate serum by incubation in a water bath at 56 °C for 30 min. ● GIBCO Penicillin-Streptomycin (P/S), (5000 units/ml penicillin G Sodium and 5000 µg/ml Streptomycin Sulfate), Invitrogen life technologies 15070-063 or equivalent. ● Geneticin (G418), Sigma G-7034 or equivalent. ● GIBCO Trypsin-EDTA in HBSS w/o Calcium or Magnesium, Invitrogen life technologies 25300-054 or equivalent. ● GIBCO Phosphate-Buffered Saline (PBS) Dulbecco's, w/o Calcium, Magnesium or Sodium Bicarbonate, Invitrogen life technologies 14190-094 or equivalent. ● Dimethylsulfoxide (DMSO), Sigma D-2650 or equivalent. ● Bovine Serum Albumin (BSA), Sigma A-4503 or similar. ● 4-(2-Hydroxyethyl)piperazine-1-ethanesulfonic acid (HEPES), Sigma H-3375 or equivalent. ● Adenosine 5'-triphosphate Magnesium salt, ATP Disodium salt, Sigma A-9187 or similar ● Hoechst™ 33342, Trihydrochloride. Fluoropure grade. Molecular Probes, H-21492. ● DRAQ5™, Biostatus. ● Cy5™ monocarboxyl dye, Amersham Biosciences PA05111. ● Fluorescein Isothiocyanate (FITC), Molecular Probes F-1300. ● Coumarin, Molecular Probes D-126. ● Standard tissue culture plastic-ware including tissue culture treated flasks (T–flasks), centrifuge tubes and cryo-vials. 5.1.2. Reagent preparation NOTE : the following reagents are required, but not supplied ● um 25-8007-26UM, Chapter 5, Rev A, 2003 Growth-medium: Nutrient Mixture F-12 Ham medium with Glutamax supplemented with 10% (v/v) FBS, 1% (v/v) Penicillin-Streptomycin and 1% (v/v) Geneticin (working concentration 0.5 mg/ml) ● 1 ● Freeze-medium: Nutrient Mixture F-12 Ham medium with Glutamax supplemented with 10% (v/v) FBS, 1% (v/v) Penicillin-Streptomycin and 10% (v/v) DMSO. ● Wash-medium: Nutrient Mixture F-12 Ham medium with Glutamax supplemented with 10 mM HEPES, 0.2% (w/v) BSA. ● Assay-medium: Nutrient Mixture F-12 Ham medium with Glutamax supplemented with 10 mM HEPES, 0.2% (w/v) BSA and Nuclear stain (either 0.2 µM Hoechst or 1 µM DRAQ5). ● ATP stock solution: 100 mM ATP in deionized water, dispensed into aliquots and stored at -15 °C to -30 °C. ● For assays performed on the IN Cell Analysis System: ● Flat field (FF) solution components: ● Cy5™ monocarboxyl dye (PA05100) – 1 mM stock solution prepared in 10% (v/v) DMSO, 90% (v/v) PBS. ● FITC – 1 mM stock solution prepared in 10% (v/v) DMSO, 90% (v/v) PBS. ● Coumarin - 1 mM stock solution prepared in 10% (v/v) DMSO, 90% (v/v) PBS. As explained in the IN Cell Analyzer 3000 user manual, prepare the flat field solution to give a fluorescent signal in each channel between 700–3300 counts. For a Hoechst stained assay, prepare an initial FF solution containing 3 µl 10 µM FITC and 20 µl 1 mM Coumarin in 200 µl PBS. For a DRAQ5 stained assay, use 3 µl 10 µM FITC and 20 µl 10 µM Cy5 in 200 µl PBS. Adjust these solutions if required. Use 100 µl of FF solution for a 96 well plate and 40 µl FF solution for a 384 well plate. 5.1.3. Cell thawing procedure Two cryo-vials, each containing 1 × 10⁶ cells in 1 ml of Freeze-medium are included with this assay kit. The vials are stored frozen in the vapor phase of liquid Nitrogen. 1. Remove a cryo-vial from storage. 2. Holding the cryo-vial, dip the bottom three-quarters of the cryo-vial into a 37 °C water bath, and swirl gently for 1–2 min until the contents are thawed. Do not thaw the cells for longer than 3 min as this decreases viability. 3. Remove the cryo-vial from the water bath and wipe it with 70% (v/v) Ethanol. Transfer the cells immediately to a T–25 flask and add 5 ml pre-warmed Growth-medium drop-wise to prevent cell damage. Add a further 2 ml Growth-medium and incubate at 37 °C. NOTE: To ensure maximum cell viability, do not allow the cells to thaw at room temperature and do not thaw the cells by hand. 5.1.4. Cell sub-culturing procedure Incubation: 5% CO2, 95% humidity, 37 °C. The cells should be passaged at a ratio of 1:10 when they are 70% confluent. um 25-8007-26UM, Chapter 5, Rev A, 2003 ● 2 1. Warm all reagents to 37 °C. 2. Aspirate the medium from the cells and discard. 3. Wash the cells with PBS. Take care not to damage the cell layer while washing, but ensure that the entire cell surface is washed. 4. Aspirate the PBS from the cells and discard. 5. Add Trypsin-EDTA (2 ml for T–75 flasks and 4 ml for T–162 flasks), ensuring that all cells are in contact with the solution. Wait for 3–10 min for the cells to round up / loosen. Check on an inverted microscope. 6. When the cells are loose, tap the flask gently to dislodge the cells. Add Growth-medium (8 ml for T–75 and 6 ml for T–162) and gently resuspend the cells with a 10 ml pipette until all clumps have dispersed. 7. Aspirate the cell suspension and dispense 1 ml cells into a new culture vessel. 5.1.5. Cell seeding procedure The following procedure is optimized for cells grown in standard T–75 and T–162 flasks to be seeded into 96 well microplates. 1. Warm all reagents to 37 °C. 2. Aspirate the medium from the cells and discard. 3. Wash the cells with PBS. Take care not to damage the cell layer while washing, but ensure that the entire cell surface is washed. 4. Aspirate the PBS from the cells and discard. 5. Add Trypsin-EDTA (2 ml for T–75 flasks and 4 ml for T–162 flasks), ensuring that all cells are in contact with the solution. Wait for 3–10 min for the cells to round up/loosen. Check on an inverted microscope. 6. When the cells are loose, tap the flask gently to dislodge the cells. Add Growth-medium (3 ml for T–75 and 6 ml for T–162) and gently resuspend the cells using a 10 ml pipette until all clumps have dispersed. 7. Count the cells using either a CASY1 Cell Counter and Analyzer System (Model TT) or a hemocytometer. 8. Using fresh Growth-medium, adjust the cell density to deliver the desired number of cells to each well. For example, to add 2.0 × 10⁴ cells per well in a volume of 200 µl, adjust the suspension to 10 × 104 cells per ml. We recommend a seeding density of 1.5–2.0 × 10⁴ cells per well for these assays. 9. Dispense 200 µl of cells into each well of a 96 well microplate, or 40 µl into each well of a 384 well plate, except the well reserved for the flat field solution (see IN Cell Analyzer 3000 users manual for further information). 10. Optionally incubate the microplates undisturbed on a level surface for 1 h at room temperature (approximately 20 °C). This treatment may reduce edge effects. 11. Incubate the plated cells for 24 h at 37 °C before starting the assay. NOTE: If the cells are near confluence prior to trypsinization, they should be um 25-8007-26UM, Chapter 5, Rev A, 2003 ● 3 split into two T flasks. Actively growing cells will then be ready for seeding the following day. 5.1.6. Cell freezing procedure 1. Harvest the cells as described in section 5.1.4 and resuspend the cells in a small volume of Growth-medium. 2. Count the cells as described in section 5.1.5. 3. Pellet the cells at approximately 300 g for 5 min. Aspirate the medium from the cells. 4. Gently resuspend the cells in Freeze-medium until no clumps remain and transfer into cryo-vials. Each vial should contain 1 × 10⁶ cells in 1 ml of Freeze-medium. 5. Transfer the vials to a cryo-freezing device and freeze at -80 °C for 16–24 h. 6. Transfer the vials to the vapor phase in a liquid Nitrogen storage device. 5.1.7. Growth characteristics Under standard growth conditions, the cells should maintain an average size of 13.2 µm as measured using a CASY1 Cell Counter and Analyzer System (Model TT). The doubling time of the cell line in exponential growth phase has been determined to be approximately 16.6 hours under standard conditions (Fig 5.1.). 15 ln (cell number) Fig 5.1.: Growth curve of CHO derived GFP-PLCδδ-PH domain expressing cell line (only points on the linear portion of the curve are shown). Doubling time = 16.6 h. 14 13 12 11 10 0 25 50 75 100 125 Time (hours) 5.2. Assay set up 5.2.1. Live cell GFP-PLCδ-PH domain assay using the IN Cell Analyzer 3000 This manual provides a suggested protocol to use the GFP-PLCδ-PH domain assay for antagonist screening on the IN Cell Analyzer 3000. 5.2.2. Microplate set up for 96 well format assays The GFP-PLCδ-PH domain assay is optimized for use in an antagonist format. It is recommended that actively growing cells are used, which are maintained at 37 °C for the duration of the assay. Reagents used during the assay should be pre-warmed to 37 °C. It is essential that the number of cells um 25-8007-26UM, Chapter 5, Rev A, 2003 ● 4 per well in the assay plates is consistent in order to minimize assay variability. ATP is used as a reference agonist with an EC50 value of approximately 5 µM. The GFP-PLCδ-PH domain assay can be used with either Hoechst or DRAQ5 as the nuclear stain. All data in this manual has been generated using DRAQ5 as the nuclear marker. Hoechst is a suitable alternative to DRAQ5, however sequential imaging is required on the IN Cell Analyzer 3000 due to the spectra overlap of GFP and Hoechst. As explained in the IN Cell Analyzer 3000 user manual, each run must contain a flat field well to compensate for variations in fluorescence intensity across each image. It is possible to prepare a microplate solely for this purpose. Alternatively, a designated well on each microplate can contain flat field solution. When seeding the plate, this well must not contain any cells if the auxiliary file flat field correction tool is to be applied in the analysis module. 5.2.3. Schematic antagonist assay protocol for use with the IN Cell Analysis System Fig 5.2. shows a typical schematic of the antagonist assay. The cells should be seeded in the appropriate microplate the day before the experiment. Decant the medium and wash the cells, decant wash medium and add assay medium to each well. Test compound, control buffer or solvent/vehicle controls are added to required wells. After 60 min incubation, the microplates are placed into the IN Cell Analyzer 3000. The Plasma Membrane Trafficking analysis module is used to image each well. A baseline image is taken, followed by a series of sequential images taken every 5 s for 30 s after the addition of the reference agonist to each well. This provides a timecourse of response for each well. Alternatively a baseline image can be taken, followed by addition of the reference agonist, followed by a final image approximately 20–25 s after addition of agonist (time for maximum response). Fig 5.2.: Flow diagram showing a basic protocol suitable for a GFP-PLCδδ-PH domain antagonist screen. All incubations are performed at 37 °C unless otherwise stated. START Seed cells. Leave at room temp for 1 h (optional). Incubate overnight, 37 °C, 5% CO2. Decant, Wash, Decant. Add Assay-medium with nuclear stain. Add test compounds and controls. Incubate 60 min, 37 °C, 5% CO2. Image plates on addition of ATP on the IN Cell Analyzer 3000 using Plasma Membrane Trafficking analysis module maximum response time = 25 s. Remove from IN Cell Analyzer 3000. STOP um 25-8007-26UM, Chapter 5, Rev A, 2003 ● 5 5.2.4. Detailed antagonist assay protocol (96 well format) NOTE: whenever possible, keep the microplate at 37 °C, 5% CO2, and 95% humidity. 1. The day before starting the assay, seed 2.0 × 10⁴ cells per well in 200 µl per well of Growth-medium. Incubate at room temperature for 1 h (optional) before incubating for 24 h at 37 °C, 5% CO2. If one of the wells on the cell plate is used for flat field correction, it should not contain cells. 2. On the day of the assay, prepare the Wash-medium and Assay-medium. Prepare a 4 fold concentrated stock solution of the reference agonist compound, ATP, at 1200 µM in Assay-medium. 3. Prepare 3 fold concentrated stock solutions of test compounds in Assay-medium. Solvent/vehicle controls are also prepared in Assay-medium (if required). 4. Decant the overnight Growth-medium from the cells and add 200 µl of Wash-medium to each well. Decant the Wash-medium and add 100 µl of Assay-medium into each well. 5. Add 50 µl of the prepared 3 fold concentrated stocks of the test and control compounds to the appropriate wells. The total well volume is 150 µl. 6. Incubate the microplates at 37 °C, 5% CO2 for 60 min. 7. Read the assay microplate using the IN Cell Analyzer 3000 and the Plasma Membrane Trafficking analysis module. Perform a series of 7 sequential reads (T0 to T6) for each well, imaging every 5 s. Dispense 50 µl of 4 fold concentrated reference agonist (1200 µM ATP) to each well immediately after the T0 read. Alternatively a baseline image can be taken, followed by addition of the reference agonist, followed by a final image approximately 20–25 s after addition of agonist (time for maximum response). The total well volume is 200 µl. 8. Perform the data analysis using the IN Cell Analyzer 3000 Plasma Membrane Trafficking analysis module. 5.2.5. Timing schedule When performing a screen, rather than imaging a time series for each well, the IN Cell Analyzer 3000 and the Plasma Membrane Trafficking analysis module can be used to group wells together and generate kinetic data from baseline and maximum response images only. For each well a baseline image is taken, followed by addition of the reference agonist, followed by a final image approximately 20–25 s after addition of agonist (time for maximum response). By grouping a number of wells together kinetic data can be generated from each well of a 96 well microplate in ∼13 min (data based on the use of DRAQ5 as nuclear stain and one tile per well). For more information please refer to the IN Cell Analyzer 3000 user manual. 5.2.6. Important considerations When performing an antagonist screen, it is important to remember that the test compound added to the plates will be diluted by the agonist addition. It is recommended that the cells incubate in the target test compound concentration prior to the addition of the agonist. This means that the test um 25-8007-26UM, Chapter 5, Rev A, 2003 ● 6 compound concentration during the agonist-induced translocation will be 75% of the target concentration. Other options are available and can be determined by the user. 5.3. Results 5.3.1. Calculating Z'-factor Assay performance can be assessed by calculating the Z' factor, a dimensionless value defined by Zhang et al. (28). Using the IN Cell Analyzer 3000, a Z'-factor of > 0.3 should be obtained with the assay under standard conditions, if the experiment is performed as described in this manual. Z' = 1 where (3σc+ +3σc–) µc+ – µc– σ = standard deviation µ = mean signal c+ = positive control c− = negative control 5.3.2. Example results Fig 5.3.: CHO derived cells expressing GFP-PLCδ-PH domain. (a) before stimulation and (b) ∼ 20 s after stimulation with 300 µM ATP. (Only a fraction of the entire field of view is shown in each panel). A um 25-8007-26UM, Chapter 5, Rev A, 2003 The following figures are taken from a set of experiments, to give the user an overall view of the images and results that can be obtained with the GFP-PLCδ-PH domain assay. Fig 5.3. shows images taken on the IN Cell Analyzer 3000 of the supplied CHO derived GFP-PLCδ-PH domain expressing cells before and after stimulation with 300 µM ATP. Following image analysis, the population data is exported into Microsoft Excel for further manipulation (Fig 5.4.). B ● 7 Fig 5.4.: Exported data and manipulation in Microsoft Excel. 5.4. Assay characterization 5.4.1. Translocation index Translocation data presented throughout this manual are expressed in terms of the Translocation Index, which reports the agonist-induced translocation of GFP-PLCδ-PH domain fusion protein from the cell membrane to the cytoplasm. The translocation index is obtained by taking the negative of the % Dpeak reported in the population data file of the Plasma Membrane Trafficking analysis module. % Dpeak). Translocation index = - (% 5.4.2. Summary of quantitative assay parameters Table 5.1.: Results from a typical single assay, performed using the suggested protocol. Signal to noise is (mean signal - mean background)/background standard deviation (ref 28). Magnitude of response is (mean signal – mean background). % CV is (standard deviation × 100)/mean. Z' factor is a dimensionless characteristic useful for evaluation of assay quality (ref 28). um 25-8007-26UM, Chapter 5, Rev A, 2003 Summaries of typical assay data, using 300 µM ATP as the agonist, are shown in Table 5.1. and Table 5.2. In particular, Table 5.1. shows the results obtained from a single assay plate, indicating the level of well to well variation. Table 5.2. shows a summary of the results obtained from 14 assays, performed by different operators on different occasions, giving an indication of inter assay variation. Parameter Assay Data # Assays # Replicates Signal to Noise Z'-factor 19.24 0.46 1 1 24 24 Magnitude of Response 29.14 1 24 %CV Stimulated Unstimulated 8.97 12.06 1 1 24 24 ● 8 Fig 5.5.: ATP-induced GFP-PLCδδ-PH domain translocation as a function of seeding density. Stimulated cells were treated with 300 µM ATP. Unstimulated cells were treated with buffer only. Cells were imaged 25 s after ATP addition (kinetic data from Frame 0 and Frame 6 using the Plasma Membrane Trafficking analysis module). Error = ± SD, n = 4 replicates per data point. ± SD*) Assay Data (± Parameter # Assays # Replicates Signal to Noise Z'-factor 16.62 ± 5.13 0.40 ± 0.17 14 14 24 24 Magnitude of Response 26.59 ± 6.68 14 24 %CV Stimulated Unstimulated 8.69 ± 1.91 14.47 ± 3.14 14 14 24 24 5.4.3. Seeding density Fig 5.5. shows the effect of varying seeding density in a 96 well microplate. The data were collected 25 s after the addition of 300 µM ATP. Significant differences between stimulated and non stimulated cells were seen at cell densities ranging from 1.5 × 10⁴ to 2.5 × 10⁴ cells per well. For the greatest assay signal, we recommend seeding in the range of 1.5 × 10⁴ to 2.0 × 10⁴ cells per well. Unstimulated Stimulated 60 Translocation index - (% D peak) Table 5.2.: Summary results from assays performed by different operators on different occasions, using the suggested protocol. * SD shown is the standard deviation of the assays. Signal to noise is (mean signal – mean background)/background standard deviation (ref 28). Magnitude of response is (mean signal – mean background). % CV is (standard deviation × 100)/mean. Z’ factor is a dimensionless characteristic useful for evaluation of assay quality (ref 28). 50 40 30 20 10 0 15,000 20,000 25,000 5.4.4. ATP dose response Fig 5.6. shows an agonist dose response curve for the supplied cells to ATP. The data were collected from Frame 0 and Frame 6 (25 s after addition of agonist), and demonstrate an EC50 of 5.2 µM. 40 Translocation index - (% D peak) Fig 5.6.: ATP dose response curve using the supplied GFP-PLCδδ-PH domain cell line. The calculated EC50 was 5.2 µM. Hill Slope = 0.95. Error = ± SD, n = 4 replicates per data point. 30 20 10 0 -7 -6 -5 -4 -3 ATP conc. (M) um 25-8007-26UM, Chapter 5, Rev A, 2003 ● 9 5.4.5. Time course Time-course analysis was performed to determine the optimal stimulation time for the antagonist screening protocol. Fig 5.7. shows an example of time course data for cells stimulated with 300 µM ATP. The results indicate that the dynamic range of the assay is maximal at the incubation time chosen for the screening assay (25 s). Unstimulated Stimulated 40 Translocation index - (% D peak) Fig 5.7.: Time course of GFP-PLCδδ-PH domain translocation using ATP as an agonist. Maximal response is seen ∼25 s after stimulation with 300 µM ATP. Error = ± SD, n = 4 replicates per data point. 30 20 10 0 0 30 60 90 120 150 Time (s) 5.4.6. Sensitivity of assay to DMSO, Ethanol and Methanol The GFP-PLCδ-PH domain assay was performed in the presence of DMSO (≤ 1%), Ethanol (≤ 3%) or Methanol (≤ 3%). As can be seen in Fig 5.8., solvents at these concentrations cause no significant decrease in the ATP induced translocation (compared to control). Fig 5.8.: The effects of DMSO, Ethanol or Methanol on the GFP-PLCδδ-PH domain assay. Error = ± SD, n = 8 replicates per data point. Stimulated Unstimulated Translocation index - (% D peak) 40 30 20 10 C DM on t SO rol DM 0. 1 SO % 0 DM .5% SO 1% Et OH 1 Et % OH Et 2% OH 3 M eO % H 1 M eO % H 2 M eO % H 3% 0 Solvent um 25-8007-26UM, Chapter 5, Rev A, 2003 ● 10 5.4.7. Effects of different culture conditions To determine the effects of varying culture conditions on the ATP induced GFP-PLCδ-PH domain fusion protein translocation, the stable CHO hIR cells were cultured for 7 d in either the recommended Growth-medium or Dulbecco's modified eagle medium (DMEM) (Invitrogen life technologies, 32430–027), in either 10%, 5% or 1% (v/v) FCS. The cells were then assayed in the same media using the recommended procedure. Note, the final concentration of ATP was 30 µM. The results shown in Fig 5.9. demonstrate that the assay is optimal in the recommended Growth-medium. Unstimulated Stimulated 40 Translocation index - (% D peak) Fig 5.9.: The effect of culture conditions on the membrane to cytoplasm translocation of GFP-PLCδδ-PH domain. Error = ± SD, n = 24 replicates per data point. 30 20 10 H AM F1 2, 10 % H AM FC S F1 2, 5% H AM FC S F1 2, 1% DM FC EM S ,1 0% FC DM S EM ,5 % FC DM S EM ,1 % FC S 0 Growth media 5.4.8. 96 well microplate stability The following experiment was performed to assess assay stability in 96 well format on the IN Cell Analyzer 3000. Cells were seeded into all wells of a 96 well microplate. Each well of cells was assayed using the recommended procedure. The final concentration of ATP was 300 µM. The results shown in Fig 5.10. demonstrate that the assay response is stable throughout the imaging of an entire 96 well microplate (one time series per well). 40 Translocation index - (% D peak) Fig 5.10.: Reproducibility of GFP-PLCδδ-PH domain translocation response across an entire 96 well microplate when imaging/analyzing in kinetic mode. Error = ± SD, n = 12 replicates per data point. 30 20 10 0 A B C D E F G H Row um 25-8007-26UM, Chapter 5, Rev A, 2003 ● 11 Chapter 6. Vector use details The plasmid vector pCORON1000-GFP-PLCδ-PH domain (Fig 3.1.) can be used to transiently or stably express the GFP-PLCδ-PH domain fusion protein in the cell line of choice. 6.1. General guidelines for vector use pCORON1000-GFP-PLCδ-PH domain has been used successfully to express GFP- PLCδ-PH domain fusion protein both transiently and stably in the CHO derived cell line. Expression levels, translocation responses and other assay parameters may vary depending on the cell type and the transfection procedure. 6.2. Transient transfection with pCORON1000-GFP-PLCδδ-PH domain Transient transfection protocols must be optimized for the cell type of choice. Choice of transfection reagent and cell type will affect efficiency of transfection. FuGENE 6 Transfection Reagent (Roche) produced successful results when transfecting pCORON1000- GFP-PLCδ-PH domain into CHO-hIR. For more information, refer to manufacturer's guidelines for the desired transfection reagent. 6.3. Stable cell line generation with pCORON1000-GFP-PLCδδ-PH domain The process of establishing stable cell lines involves a large number of variables, many of which are cell-line dependent. Standard methods and guidelines for the generation of stable cell lines are widely available in the public domain (29). pCORON1000-GFP-PLCδ-PH domain has been used to generate stably transfected cell populations. The magnitude of the response and the kinetics of the translocation event achievable with different cell lines are unknown, and may deviate considerably from the values specified in this manual. um 25-8007-26UM, Chapter 6, Rev A, 2003 ● 1 Chapter 7. Quality control 7.1. GFP-PLCδδ-PH domain cell line The GFP-PLCδ-PH domain cell line is supplied at a concentration of 1 × 10⁶ cells per ml in fetal calf serum containing 10% (v/v) DMSO. The cell line should have the characteristics detailed in Table 7.1. Table 7.1.: Quality control information for GFP-PLCδδ-PH domain cell line Property Value Measurement method Assay stability Magnitude of response ≥ 20 for 20 passages after dispatch, Z' factor ≥ 0.3 Quality Control Assay Viability from frozen > 80 % CASY1 Cell Counter and Analyzer System (Model TT) Cell diameter (mm) 12–15 CASY1 Cell Counter and Analyzer System (Model TT) Fluorescence at 9 × 10⁴ cells per ml (RFU) > 30 000 for 20 passages after dispatch FARCyte (Gain 62) 7.2. GFP-PLCδ-PH domain expression vector The GFP-PLCδ-PH domain expression vector is supplied in TE buffer (10 mM Tris, 1 mM EDTA, pH 8.0) at 250 µg/ml. The vector should have the characteristics outlined in Table 7.2. Table 7.2.: Quality control information for the GFP-PLCδδ-PH domain expression vector Property Value Concentration 250 µg/ml Limits UV Absorbance @ 260 nm in water Purity - Minimal A260/A280 ratio contamination of the DNA construct by RNA or protein Expected restriction pattern Table 7.3.: Expected restriction pattern for the GFP-PLCδδ-PH domain expression vector um 25-8007-26UM, Chapter 7, Rev A, 2003 Enzyme(s) Pvu1 Nhe1 Nco1 Not1 Hpa1 The restriction digests should give fragments of the sizes shown in Table 7.3. # of cuts 3 1 6 1 2 Measurement method Between 1.8–2.2 UV/Vis Absorbance @ 260 nm and 280 nm Agarose gel electrophoresis Fragment(s) size (bp) 1938, 2013, 2755 6706 296, 719, 751, 964, 1014, 2962 6706 944, 5762 ● 1 Chapter 8. Troubleshooting guide 8.1 Troubleshooting guide Problem ❶ Low assay response. (positive vs. negative controls) ❷ Low nuclear intensity. ❸ Image is out of focus. ❹ Cells do not adhere to well bottom in plate. ❺ Shading across image field. um 25-8007-26UM, Chapter 8, Rev A, 2003 Possible causes and remedies Possible cause 1.1. Passage number too high. 1.2. Cell density too low or too high. 1.3. Incorrect selection of analysis parameters. 1.4. Incorrect assay/incubation conditions. 1.5. Reagents were not stored properly or they are out of date. 1.6. Cells have been stressed during assay. Remedy 1.1. Start a fresh batch of cells from an earlier passage number. Cells should be expanded, and additional vials should be frozen down from the vials delivered with the assay. 1.2. Verify density of cell plating; adjust plating density to values that yield optimal assay response. 1.3. Check that the primary parameters are correct and suitable for the cells currently in use. 1.4. Ensure that proper incubation is maintained as consistently as possible during the assay. When plates are out of the CO2 incubator for extended periods, it is essential that HEPES buffer is added to the medium to maintain proper pH. 1.5. Repeat assay with fresh reagents. 1.6. Use actively growing cells maintained at 37 °C. Pre-warm reagents to 37 °C. Possible cause 2.1. Nuclear stain concentration too low. 2.2. Nuclear stain incubation time too short. Remedy 2.1. Adjust Nuclear stain concentration to recommended level. 2.2. Adjust Nuclear stain incubation time to recommended length. Possible cause 3.1. Autofocus Offset is chosen incorrectly or the system may need to be realigned. Remedy 3.1. Alignment and calibration of instrument. Perform Z-stack on cells. Change Autofocus Offset. Possible cause 4.1. Seeding density too high. Remedy 4.1. Reduce seeding density. Possible cause 5.1. flat field correction not applied or flat field solution too weak. Remedy 5.1. Apply flat field correction or adjust flat field solution. ● 1 Chapter 9. References 9.1. References 1. Homma, Y. et al. Tissue- and cell type-specific expression of mRNAs for four types of inositol phospholipid-specific phospholipase C. Biochem Biophys Res Commun. 164, 406–412 (1989). 2. Yoko-o, T. et al. The putative phosphoinositide-specific phospholipase C gene, PLC1, of the yeast Saccharomyces cerevisiae is important for cell growth. Proc Natl Acad Sci USA. 90, 1804–1808 (1993). 3. Hirayama, T. et al. A gene encoding a phosphatidylinositol-specific phospholipase C is induced by dehydration and salt stress in Arabidopsis thaliana. Proc Natl Acad Sci USA. 92, 3903–3907 (1995). 4. Essen, L. O. et al. Crystal structure of a mammalian phosphoinositidespecific phospholipase C delta. Nature 380, 595–602 (1996). 5. Paterson, H. F. et al. Phospholipase C delta 1 requires a pleckstrin homology domain for interaction with the plasma membrane. Biochem. J. 312, 661–666 (1995). 6. Yagisawa, H. et al. Replacements of single basic amino acids in the pleckstrin homology domain of phospholipase C-delta1 alter the ligand binding, phospholipase activity, and interaction with the plasma membrane. J Biol Chem. 273, 417–424 (1998). 7. Yagisawa, H. et al. Phospholipase C-delta and related molecules. Biochem. Soc. Trans. 27, 652–657 (1999). 8. Fujii, M. et al. Real-time visualization of PH domain-dependent translocation of phospholipase C-delta1 in renal epithelial cells (MDCK): response to hypo-osmotic stress. Biochem. Biophys. Res. Commun. 254, 284–289 (1999). 9. Yagisawa, H. et al. Expression and characterization of an inositol 1,4,5-trisphosphate binding domain of phosphatidylinositol-specific phospholipase C-delta 1. J Biol Chem. 269, 20179–20188 (1994). 10. Rhee, S. G. and Choi, K. D. Regulation of inositol phospholipid-specific phospholipase C isozymes. J Biol Chem. 267, 12393–12396 (1992). 11. Cockcroft, S. and Thomas, G. M. Inositol-lipid-specific phospholipase C isoenzymes and their differential regulation by receptors. Biochem J. 288, 1–14 (1992). 12. Berridge, M. J. Inositol trisphosphate and calcium signalling. Nature 361, 315–325 (1993). 13. Noh, D. Y. et al. Phosphoinositide-specific phospholipase C and mitogenic signaling. Biochim Biophys Acta. 1242, 99–113 (1995). 14. Lomasney, J. W. et al. Phosphatidylinositol 4,5-bisphosphate binding to the pleckstrin homology domain of phospholipase C-delta1 enhances enzyme activity. J. Biol. Chem. 271, 25316–25326 (1996). 15. Rhee, S. G. et al. Studies of inositol phospholipid-specific phospholipase C. Science 244, 546–550 (1989). um 25-8007-26UM, Chapter 9, Rev A, 2003 ● 1 16. Garcia, P. et al. The pleckstrin homology domain of phospholipase C-delta 1 binds with high affinity to phosphatidylinositol 4,5-bisphosphate in bilayer membranes. Biochemistry 34, 16228–16234 (1995). 17. Ferguson, K. M. et al. Structure of the high affinity complex of inositol trisphosphate with a phospholipase C pleckstrin homology domain. Cell 83, 1037–1046 (1995). 18. Berridge, M. J. Cell signalling. A tale of two messengers. Nature 365, 388–389 (1993). 19. Hirose, K. et al. Spatiotemporal dynamics of inositol 1,4,5-trisphosphate that underlies complex Ca2+ mobilization patterns. Science 284, 1527–30 (1999). 20. Lemmon, M. A. and Ferguson, K. M. Signal-Dependent Membrane Targeting by Pleckstrin Homology (PH) Domains. Biochem J. 350, 1–18 (2000). 21. Puck, T. T. et al. Genetics of somatic mammalian cells III. Long term cultivation of euploid cells from human and animal subjects. J. Exp. Med. 108, 945–956 (1958). 22. Kao, F. T. and Puck, T. T. Genetics of somatic mammalian cells. IV. Properties of Chinese hamster cell mutants with respect to the requirements for proline. Genetics 55, 513–524 (1967). 23. Kao, F. T. and Puck, T. T. Genetics of somatic mammalian cells, VII. Induction and isolation of nutritional mutants in Chinese hamster cells. Proc. Natl. Acad. Sci. USA 60, 1275–1281 (1968). 24. Hansen, B. F. et al. Sustained signalling from the insulin receptor after stimulation with insulin analogues exhibiting increased mitogenic potency. Biochem. J. 315, 271–279 (1996). 25. Flintoff, W. F. et al. Isolation and partial characterization of three methotrexate-resistant phenotypes from Chinese hamster ovary cells. Somatic Cell Genet. 2, 245–261 (1976). 26. Ryser, H. J. and Shen, W. C. Conjugation of methotrexate to poly (Llysine) as a potential way to overcome drug resistance. Cancer 45, 1207–1211 (1980). 27. Kjeldsen, T. et al. The ligand specificities of the insulin receptor and the insulin-like growth factor I receptor reside in different regions of a common binding site. Proc. Natl. Acad. Sci. USA 15, 4404–4408 (1991). 28. Zhang, J. H. et al. A Simple Statistical Parameter for Use in Evaluation and Validation of High Throughput Screening Assays. J. Biomol. Screen. 4, 67–73 (1999). 29. Freshney, R. I. Cloning and Selection of Specific Cell Types in Culture of Animal Cells, 3rd Edition, Wiley-Liss Inc, Chapter 11, 161–178 (1994). um 25-8007-26UM, Chapter 9, Rev A, 2003 ● 2 Chapter 10. Related products 10.1. Related products Product Name: um 25-8007-26UM, Chapter 10, Rev A, 2003 Code: GFP Assays GFP-MAPKAP-k2 Assay EGFP - 2x FYVE Assay AKT-1 EGFP Assay EGFP SMAD2 Assay 25-8008-82 25-8010-21 25-8010-17 25-8010-46 CypHer pCORON 1000 VSV-G Expression Vector pCORON 1000 SP VSV-G Expression Vector CypHer5 Labelled Anti VSV-G Antibody CypHer5 NHS Ester (1 mg pack) CypHer5 NHS Ester (5 mg pack) 25-8008-51 25-8009-92 PA45407 PA15401 PA15405 IN Cell Analysis System IN Cell Analyzer 3000 Plasma Membrane Trafficking Analysis Module 25-8010-11 63-0048-95 ● 1 Chapter 11. Appendix 11.1. Appendix A: Restriction map of pCORON1000-GFP-PLCδδ-PH domain The following enzymes do not cut the vector: AccIII, AgeI, ApaI, AscI, BclI, Bpu1102I, BseAI, BsiWI, Bsp120I, BspEI, BstEII, Bsu36I, CelII, Eco47III, EcoNI, EcoRV, EspI, KspI, MroI, NruI, PacI, PaeR7I, PinAI, PmeI, PpuMI, SacII, SbfI, SgrAI, SwaI, XcmI, XhoI Enzyme # of cuts Positions (c) indicates the complementary strand AatI 1 3631 AatII 5 279 332 415 601 4883 Acc65I 2 2366 3282 AccI 2 1548 2379 AciI 74 AcsI 6 1175 1232 2354 2477 3131 3142 AcyI 8 276 329 412 598 3826 4528 4880 5262 AflII 5 829 848 1051 1822 3680 AflIII 2 1421 2360 AluI 33 Alw44I AlwI 3 18 129 212 240 252 266 399 433 524(c) 557(c) 669 690(c) 767(c) 1945(c) 1993 2005(c) 2065 2110 2388(c) 2392 2669 2730(c) 2744(c) 2747(c) 2775 2802 3180(c) 3206(c) 3219 3227(c) 3295(c) 3480 3492 3501 3513 3523 3534 3580 3735 3798 3892(c) 3956(c) 4057(c) 4060(c) 4300 4340(c) 4345 4395(c) 4411 4437 4493(c) 4552 4624 4662 4688 4698 4737 4911(c) 4958 5057(c) 5166(c) 5243(c) 5287 5408(c) 5454 5645(c) 5736(c) 6098 6107(c) 6242 6352(c) 6473(c) 6492(c) 6619(c) 6647(c) 728 759 834 1048 1775 1814 1818 1909 1929 2023 2174 2248 2282 2310 2320 2341 2516 2861 3118 3308 3596 3650 3932 4390 4751 4770 5449 5512 5612 6133 6390 6436 6526 4633 5130 6376 1721(c) 1887 2634(c) 2643 3237 4005 4070(c) 4251 4615(c) 4628 5163 5167(c) 5484 5947(c) 5948 6044(c) 6046 6132 AlwNI 4 1778 1891 1912 6281 AosI 4 2697 3236 3928 5579 ApaLI 3 4633 5130 6376 ApoI 6 1175 1232 2354 2477 3131 3142 AseI 2 161 5627 AsnI 2 161 5627 Asp700 1 5202 Asp718 2 2366 3282 AspEI 1 5802 AspHI 8 730 2343 3939 4129 4637 5134 5219 6380 AspI 1 3944 AsuII 2 1721 4508 um 25-8007-26UM, Chapter 11, Rev A, 2003 ● 1 Enzyme # of cuts Positions (c) indicates the complementary strand AvaI 3 1834 2102 2383 AvaII 7 1753 2007 2107 2233 4342 5438 5660 AviII 4 2697 3236 3928 5579 AvrII 1 3632 BamHI 1 4620 BanI 9 619 977 2061 2366 2907 3282 3825 3860 5849 BanII 4 730 2343 2877 4191 BbrPI 1 1424 BbsI 1 962 BbvI 24 BcgI 1 BfaI 16 BfrI 5 829 848 1051 1822 3680 BglI 7 137 244 366 437 2707 3585 5684 BglII 1 6702 BlnI 1 3632 BmyI 15 BpmI 3 1146 2099 5733 BpuAI 1 962 BsaAI 4 494 1424 2948 4130 BsaBI 3 1878 2634 4619 BsaHI 8 276 329 412 598 3826 4528 4880 5262 BsaI 3 916(c) 1737(c) 5736 BsaJI 16 821(c) 1762(c) 1878(c) 1914 2099(c) 2187(c) 2307(c) 2503(c) 2710 2778 3249 3773(c) 3899 3941 3957(c) 4050(c) 4462 4757(c) 5368(c) 5759 6062(c) 6268(c) 6271(c) 6361 5264(c) 154 753 1058 1087 1631 1815 2150 2350 2373 2444 2795 3633 3687 5609 5944 6197 730 1173 2064 2103 2343 2877 3772 3865 3939 4129 4191 4637 5134 5219 6380 514 1265 2010 2103 2229 2383 3243 3344 3416 3539 3574 3583 3632 3989 4258 6530 BsaWI 4 3857 5506 6337 6484 BsgI 2 1841(c) 2186(c) BsiEI 7 665 2392 2678 3735 5284 5433 6356 BsiHKAI 8 730 2343 3939 4129 4637 5134 5219 6380 BsiYI 15 203 1932 2071 2187 2188 2729 3055 3540 3807 4351 4764 6212 6491 6657 6675 BslI 15 203 1932 2071 2187 2188 2729 3055 3540 3807 4351 4764 6212 6491 6657 6675 BsmAI 10 588 826 916(c) 941(c) 1737(c) 3677 4765 4807(c) 4960(c) 5736 BsmFI 12 329 480 648 1118(c) 1856 1975(c) 2002(c) 3326(c) 3398(c) 3462(c) 3977 4509 BsmI 2 Bsp1286I 15 2453 2546(c) 730 1173 2064 2103 2343 2877 3772 3865 3939 4129 4191 4637 5134 5219 6380 um 25-8007-26UM, Chapter 11, Rev A, 2003 ● 2 Enzyme # of cuts Positions (c) indicates the complementary strand BspDI 2 2638 4607 BspHI 3 4857 4962 5970 BspMI 4 878(c) 3713(c) 4094 4544 BspWI 39 BsrBI 5 1945 2804(c) 4439(c) 4493 4960(c) BsrDI 4 66(c) 4059 5568 5742(c) BsrFI 4 2843 4145 4326 5717 BsrGI 2 97 1375 BsrI 20 137 244 366 398 437 530 554 803 1054 2059 2191 2200 2245 2677 2707 2739 2741 2783 2810 2840 3377 3449 3500 3579 3585 3817 3901 3924 4063 4069 4186 4222 4269 4536 4632 5684 6072 6644 6692 449(c) 887 940 1034(c) 1129 1252 2192 2261 3037 3517(c) 3770 3971 5157 5327(c) 5596 5639 5757 6163 6275(c) 6288(c) BssHII 1 4223 Bst1107I 1 1549 BstBI 2 1721 4508 BstNI 9 244 437 3346 3401 3418 4213 6531 6544 6665 BstUI 19 BstXI 1 BstYI 13 1726 1879 3229 3997 4243 4620 5155 5172 5940 5952 6038 6049 6702 CfoI 29 1891 2142 2698 2722 2735 2744 2766 2792 2800 3237 3820 3828 3892 3929 4195 4225 4227 4455 4708 4811 4911 5243 5580 5673 6066 6175 6349 6449 6516 214 2362 2720 2744 2764 3140 3227 3892 4193 4225 4626 4706 4809 4811 4911 5243 5736 6066 6647 4547 Cfr10I 4 2843 4145 4326 5717 ClaI 2 2638 4607 Csp45I 2 1721 4508 Csp6I 13 98 372 452 485 536 701 1063 1376 2367 3283 4131 4644 5320 DdeI 10 2221 3290 3592 4489 4640 4875 5301 5841 6007 6416 DpnI 31 664 749 1091 1326 1728 1881 2210 2637 2641 2677 3231 3999 4077 4158 4167 4245 4622 5121 5157 5174 5432 5478 5496 5837 5942 5954 6032 6040 6051 6126 6704 DpnII 31 662 747 1089 1324 1726 1879 2208 2635 2639 2675 3229 3997 4075 4156 4165 4243 4620 5119 5155 5172 5430 5476 5494 5835 5940 5952 6030 6038 6049 6124 6702 DraI 6 1489 2131 2593 5224 5916 5935 DraII 1 4822 DraIII 2 2191 2951 DrdI 8 818 1751 2014 2995 3669 3853 4719 6588 DsaI 6 514 1265 2229 3243 3539 4258 DsaV 21 242 435 1839 2010 2382 2383 2642 3344 3399 3416 3828 3988 4211 4728 4763 5264 5615 6311 um 25-8007-26UM, Chapter 11, Rev A, 2003 ● 3 Enzyme # of cuts Positions (c) indicates the complementary strand DsaV 21 6529 6542 6663 EaeI 10 9 63 1268 2389 3732 3906 4297 4324 4549 5409 EagI 2 2389 3732 Eam1105I 1 5802 EarI 4 2656(c) 4170(c) 4380(c) 5003(c) Ecl136II 2 728 2341 EclXI 2 2389 3732 Eco57I 8 1449 1916 1934 2354 3972 4404 5136 6148(c) EcoO109I 1 4822 EcoRI 1 2354 EcoRII 9 242 435 3344 3399 3416 4211 6529 6542 6663 Esp3I 2 4765 4807(c) Fnu4HI 44 835 1776 1892 1903 2113 2201 2321 2389 2392 2517 2699 2731 2745 2767 3238 3580 3735 3787 3798 3888 3893 3930 3971 4058 4061 4064 4300 4396 4437 4451 4552 4662 4771 5058 5287 5382 5409 5748 6076 6282 6285 6350 6493 6648 FnuDII 19 214 2362 2720 2744 2764 3140 3227 3892 4193 4225 4626 4706 4809 4811 4911 5243 5736 6066 6647 FokI 12 984(c) 1811 1840 1883 2198(c) 3483(c) 4150 4175 4720(c) 5363 5650 5831 FspI 4 2697 3236 3928 5579 HaeII 5 1892 2793 2801 3829 6450 HaeIII 30 11 65 238 431 1270 1671 1839 1863 2391 2667 2956 3098 3248 3573 3579 3588 3631 3734 3908 4299 4326 4551 4824 5411 5678 5758 6216 6650 6668 6679 HgaI 8 688 2228(c) 2726 4536 4712 5270 6000(c) 6578(c) HgiAI 8 730 2343 3939 4129 4637 5134 5219 6380 HhaI 29 1891 2142 2698 2722 2735 2744 2766 2792 2800 3237 3820 3828 3892 3929 4195 4225 4227 4455 4708 4811 4911 5243 5580 5673 6066 6175 6349 6449 6516 HinP1I 29 1889 2140 2696 2720 2733 2742 2764 2790 2798 3235 3818 3826 3890 3927 4193 4223 4225 4453 4706 4809 4909 5241 5578 5671 6064 6173 6347 6447 6514 HincII 4 678 1588 2380 2532 HindII 4 678 1588 2380 2532 HindIII 2 757 3648 HinfI 20 564 842 958 1074 1464 1578 1832 1988 2015 2260 2376 2996 3018 3654 4311 4445 4497 4604 5803 6320 HpaI 2 HpaII 24 1840 2012 2384 2643 2844 3731 3808 3830 3858 3989 4079 4146 4327 4730 4764 5265 5507 5617 5684 5718 6122 6312 6338 6485 HphI 15 530 1169 1208 1214 1457 1930 2948 4004(c) 4782(c) 4791(c) 5075(c) 5110 5316(c) 5732 5959 1588 2532 um 25-8007-26UM, Chapter 11, Rev A, 2003 ● 4 Enzyme # of cuts Positions (c) indicates the complementary strand ItaI 44 835 1776 1892 1903 2113 2201 2321 2389 2392 2517 2699 2731 2745 2767 3238 3580 3735 3787 3798 3888 3893 3930 3971 4058 4061 4064 4300 4396 4437 4451 4552 4662 4771 5058 5287 5382 5409 5748 6076 6282 6285 6350 6493 6648 KasI 1 3825 KpnI 2 2370 3286 Ksp632I 4 2656(c) 4170(c) 4380(c) 5003(c) MaeI 16 154 753 1058 1087 1631 1815 2150 2350 2373 2444 2795 3633 3687 5609 5944 6197 MaeII 18 75 276 288 329 412 493 598 1423 2837 2947 2990 3002 3942 4129 4880 5200 5573 5989 MaeIII 21 215 302 651 839 902 1279 1768 2502 2758 2770 3946 4252 4753 5141 5329 5482 5540 5871 6154 6270 6333 MamI 3 MboI 31 662 747 1089 1324 1726 1879 2208 2635 2639 2675 3229 3997 4075 4156 4165 4243 4620 5119 5155 5172 5430 5476 5494 5835 5940 5952 6030 6038 6049 6124 6702 MboII 17 967 1124 1505 1625 2673 2809(c) 3649(c) 4187 4397 4477(c) 5020 5129 5207 5962 6033(c) 6185(c) 6697(c) 1878 2634 4619 McrI 7 665 2392 2678 3735 5284 5433 6356 MfeI 2 1659 2541 MluI 1 2360 MluNI 4 11 65 1270 3908 MnlI 40 MscI 4 MseI 35 MslI 7 703(c) 870(c) 1186(c) 1613(c) 1870(c) 1929(c) 1957(c) 2029(c) 2041(c) 2065(c) 2098(c) 2165 2380 2577(c) 2617 2657(c) 2921 3261(c) 3269 3285(c) 3563(c) 3569(c) 3593 3599 3606(c) 3609(c) 3621(c) 3741(c) 3877(c) 4234(c) 4427 4776(c) 4835 5429(c) 5635(c) 5782 5863 6263 6513(c) 6587 11 65 1270 3908 161 784 830 849 917 1052 1067 1164 1230 1458 1472 1488 1587 1823 2130 2531 2592 2738 3009 3107 3124 3135 3147 3158 3681 4670 4851 5223 5588 5627 5862 5915 5929 5934 5986 519 4263 4545 4584 5031 5390 5549 MspA1I 10 1775 2023 2112 2174 3308 3932 4700 5166 6107 6352 MspI 24 1840 2012 2384 2643 2844 3731 3808 3830 3858 3989 4079 4146 4327 4730 4764 5265 5507 5617 5684 5718 6122 6312 6338 6485 MunI 2 1659 2541 MvaI 9 244 437 3346 3401 3418 4213 6531 6544 6665 MvnI 19 214 2362 2720 2744 2764 3140 3227 3892 4193 4225 4626 4706 4809 4811 4911 5243 5736 6066 6647 MwoI 39 137 244 366 398 437 530 554 803 1054 2059 2191 2200 2245 2677 2707 2739 2741 2783 2810 2840 3377 3449 3500 3579 3585 3817 3901 3924 4063 4069 4186 4222 4269 4536 4632 5684 6072 6644 6692 NaeI 2 2845 4328 NarI 1 3826 NciI 12 1841 2012 2384 2385 2644 3830 3990 4730 4765 5266 5617 6313 um 25-8007-26UM, Chapter 11, Rev A, 2003 ● 5 Enzyme # of cuts Positions (c) indicates the complementary strand NcoI 6 514 1265 2229 3243 3539 4258 NdeI 2 388 1329 NdeII 31 662 747 1089 1324 1726 1879 2208 2635 2639 2675 3229 3997 4075 4156 4165 4243 4620 5119 5155 5172 5430 5476 5494 5835 5940 5952 6030 6038 6049 6124 6702 NgoMI 2 2843 4326 NheI 1 1814 NlaIII 34 118 136 458 518 1102 1269 1343 1363 1558 1753 1793 1798 1935 2005 2233 2409 3247 3380 3452 3543 3700 4045 4231 4262 4288 4777 4861 4966 5359 5395 5473 5483 5974 6694 NlaIV 22 621 979 2009 2063 2227 2368 2876 2888 2909 3284 3350 3422 3827 3862 4622 4915 5505 5716 5757 5851 6623 6662 NotI 1 2389 NsiI 2 3382 3454 NspI 4 3380 3452 4231 4777 NspV 2 1721 4508 PflMI 1 1932 PleI 13 558(c) 836(c) 952(c) 1068(c) 1826(c) 1996 2023 2384 3004 3012(c) 4491(c) 5811 6314(c) PmaCI 1 1424 PmlI 1 1424 Ppu10I 2 3378 3450 Psp1406I 2 5200 5573 PstI 3 839 2325 3879 PvuI 3 665 2678 5433 PvuII 5 1775 2023 2174 3308 3932 RcaI 3 4857 4962 5970 RsaI 13 RsrII 1 4342 SacI 2 730 2343 SalI 1 2378 SapI 2 4170(c) 4380(c) 99 373 453 486 537 702 1064 1377 2368 3284 4132 4645 5321 Sau3AI 31 662 747 1089 1324 1726 1879 2208 2635 2639 2675 3229 3997 4075 4156 4165 4243 4620 5119 5155 5172 5430 5476 5494 5835 5940 5952 6030 6038 6049 6124 6702 Sau96I 16 237 430 1670 1753 1837 2007 2107 2233 2666 2954 4342 4822 5438 5660 5677 5756 ScaI 2 ScrFI 21 SexAI 1 SfaNI 20 1064 5321 244 437 1841 2012 2384 2385 2644 3346 3401 3418 3830 3990 4213 4730 4765 5266 5617 6313 6531 6544 6665 3399 511(c) 1195(c) 2167(c) 2475(c) 3167(c) 3207 3389 3461 3784(c) 4039(c) 4125 4189 4255(c) 4464 um 25-8007-26UM, Chapter 11, Rev A, 2003 ● 6 Enzyme # of cuts Positions (c) indicates the complementary strand SfaNI 20 4648(c) 4742 5101(c) 5350 5541(c) 6593(c) SfcI 11 835 1080 1865 1883 2249 2321 2725 3875 5556 6234 6425 SfiI 1 3585 SfuI 2 1721 4508 SmaI 1 2385 SnaBI 1 494 SnoI 3 4633 5130 6376 SpeI 1 153 SphI 3 3380 3452 4231 SspBI 2 97 1375 SspI 4 6 53 3156 4997 StuI 1 3631 StyI 7 514 1265 2229 3243 3539 3632 4258 TaqI 20 TfiI 7 ThaI 19 214 2362 2720 2744 2764 3140 3227 3892 4193 4225 4626 4706 4809 4811 4911 5243 5736 6066 6647 Tru9I 35 161 784 830 849 917 1052 1067 1164 1230 1458 1472 1488 1587 1823 2130 2531 2592 2738 3009 3107 3124 3135 3147 3158 3681 4670 4851 5223 5588 5627 5862 5915 5929 5934 5986 Tsp509I 22 172 786 1040 1137 1148 1175 1232 1517 1596 1659 2354 2477 2541 3131 3142 3168 3386 3458 3550 5369 5624 5930 Tth111I 1 3944 Van91I 1 1932 XbaI 1 2372 XhoII 13 XmaI 1 2383 XmaIII 2 2389 3732 XmnI 1 5202 824 945 1467 1721 2034 2379 2397 2638 2913 3675 3939 4095 4119 4155 4317 4508 4607 5148 6592 6697 1464 1578 2260 3654 4311 4445 4604 1726 1879 3229 3997 4243 4620 5155 5172 5940 5952 6038 6049 6702 um 25-8007-26UM, Chapter 11, Rev A, 2003 ● 7