1
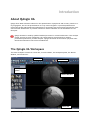
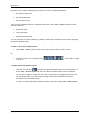
® QAngio XA 7.3 Quick Start Manual March 14, 2014 9.04.250.73.5 v4.1 Medis medical imaging systems bv Schuttersveld 9, 2316 XG Leiden, the Netherlands http://www.medis.nl Medis medical imaging systems bv Schuttersveld 9 2316 XG Leiden P.O. Box 384 2300 AJ Leiden the Netherlands Medis medical imaging systems, Inc. 9360 Falls of Neuse Road, Suite 103 Raleigh, NC 27615-2484 USA Telephone: +31 71 522 32 44 Fax: +31 71 521 56 17 E-mail: [email protected] Web: www.medis.nl Telephone: +1 919 278 7888 Fax: +1 919 847 8817 E-mail: [email protected] Web: www.medis.nl QAngio XA 7.3 II Legal Notices Copyright Notice © 2003-2014 Medis medical imaging systems bv. All rights reserved. This manual is copyrighted and is protected by worldwide copyright laws and treaty provisions. No part of this manual may be copied, reproduced, modified, published or distributed in any form or by any means, for any purpose, without prior written permission of Medis medical imaging systems bv. Trademark Acknowledgments QAngio is a registered trademark of Medis Associated BV in the United States and in other countries. DICOM is the registered trademark of the National Electrical Manufacturers Association for its standards publications relating to digital communications of medical information. Microsoft, Windows, Windows XP, Windows Vista, and Windows 7 are either registered trademarks or trademarks of Microsoft Corporation in the United States and/or other countries. All other brand, product, and company names mentioned in this document are trademarks or registered trademarks of their respective owners. Regulatory Information Intended Use QAngio XA is software intended to be used for performing calculations in X-ray angiographic images of the chambers of the heart and of blood vessels. These calculations are based on contours that are either manually drawn by the clinician or trained medical technician who is operating the software, or automatically detected by the software and subsequently presented for review and manual editing. QAngio XA is also intended to be used for performing caliper measurements. The results obtained are displayed on top of the images and provided in reports. The analysis results obtained with QAngio XA are intended for use by cardiologists and radiologists: - to support clinical decisions concerning the heart and vessels - to support the evaluation of interventions or drug therapy applied for conditions of the heart and vessels Indications for Use QAngio XA is indicated for use in clinical settings where validated and reproducible quantified results are needed to support the calculations in X-ray angiographic images of the chambers of the heart and of blood vessels, for use on individual patients with cardiovascular disease. When the quantified results provided by QAngio XA are used in a clinical setting on X-ray images of an individual patient, they can be used to support the clinical decisions making for the diagnosis of the patient or the evaluation of the treatment applied. In this case, the results are explicitly not to be regarded as the sole, irrefutable basis for clinical diagnosis, and they are only intended for use by the responsible clinicians. QAngio XA 7.3 III Warnings When the quantified results provided by QAngio XA are used in a clinical setting, they are explicitly not to be regarded as the sole, irrefutable basis for clinical diagnosis, and they are only intended for use by the clinicians responsible. QAngio XA must be used by a person who is qualified to perform analyses, for example, a cardiologist, radiologist, or trained technician. If the analysis results are used to reach a diagnosis, the results must be interpreted by a qualified medical professional. QAngio XA should not be used for purposes other than those indicated in the section Intended Use. Users must make sure to read this manual to become familiar with the software and be able to obtain reliable analysis results. Note on Monitor Aspect Ratio and Resolution The shapes of objects and calipers displayed may get slightly distorted when the monitor's aspect ratio is another ratio than the standard 4:3. This distortion does NOT affect the accuracy of measurements or analyses. To avoid distortion, set the resolution of the monitor to a 4:3 ratio, such as 1280*960. European Regulations QAngio XA is qualified as a class IIa medical device. It complies with the requirements of the Dutch Medical Devices Decree (Besluit Medische Hulpmiddelen, Stb. 243/1995) and the European Medical Device Directive 93/42/EEC. 0120 North American Regulations QAngio XA has been cleared for market in the United States by the FDA (Food and Drug Administration) under the provisions of Section 510(k) of the Food, Drug, and Cosmetic Act. Caution Federal law restricts this device to sale by or on the order of a physician. QAngio XA complies with the requirements of the Canadian Medical Devices Regulations and has been licensed as a Class II medical device. QAngio XA 7.3 IV Conventions Used The following conventions are used throughout this manual. Mouse Click Press and release the primary mouse button. If you are lefthanded, you may have set the right mouse button as your primary mouse button. Right-click Press and release the secondary mouse button. If you are lefthanded, you may have set the left mouse button as your secondary mouse button. Middle-click Press and release the wheel button or the middle mouse button. If you have a two-button mouse, press and release the left and the right mouse button simultaneously. Double-click Press and release the primary mouse button twice. Keyboard SHIFT+click Press and hold down the SHIFT key on your keyboard while you click a button or object. CTRL+<key> Press and hold down the CTRL key on your keyboard while you press <key>, then release both keys. Typographical Conventions On the XA tab, select the Black on white option. Names of buttons, fields, menus, menu options, and tab names are capitalized and in bold. View > Report A sequence of menu options that you select to perform a specific task, is indicated by angular brackets. Documents directory Text that you type or that appears on the screen, such as file names and file locations, is displayed in Courier New. Symbols Used Reference. Points to relevant documentation or sections in the manual. Tip. Provides helpful information or an alternative working method. Note. Brings additional information to your attention. Caution. Tells you to be careful when performing a task. Warning. Warns you for a potentially dangerous situation in the image representation or analysis, which may lead to incorrect results. You are advised to follow the instructions to avoid this. QAngio XA 7.3 V Table of Contents Conventions Used ..................................................................................................... V Typographical Conventions ......................................................................................... V Table of Contents ................................................................................................... VI Introduction ........................................................................................................... 1 About QAngio XA ...................................................................................................... 1 The QAngio XA Workspace .......................................................................................... 1 Quick Tour ............................................................................................................. 3 Starting QAngio XA and Reviewing Studies ....................................................................... 3 Calibrating Image Runs .............................................................................................. 4 Performing Analyses ................................................................................................. 6 Creating Reports ..................................................................................................... 11 Saving and Exporting Results ...................................................................................... 12 More Information .................................................................................................... 13 QAngio XA 7.3 VI Introduction About QAngio XA QAngio XA is Medis' software solution for the quantification of peripheral and coronary vessels in Xray angiograms, and for the quantification of X-ray ventriculograms. It provides quantification results that enable radiologists and cardiologists to accurately plan interventions and perform postinterventional assessments. It provides researchers with a solid basis for the assessment of new therapies. QAngio XA must be used by qualified medical personnel or trained technicians. If the analysis results are used to reach a diagnosis, the results must be interpreted by a medical professional qualified to perform analyses. QAngio XA should not be used for purposes other than those indicated in the section Intended Use. The QAngio XA Workspace The main workspace consists of a menu bar, several toolbars, the workspace panes, the Review Window, and a status bar. Menu bar Toolbars Workspace panes Review Window Status bar QAngio XA 7.3 Quick Start Manual 1 Quick Tour By default, the workspace displays three panes to the left of the Review Window. the Patient-Study pane the Thumbnails pane the Procedures pane There are three additional panes. To display these panes, select View > Panes, and select them from the submenu: DICOM Info pane Curve Data pane Display Properties pane You can customize the main workspace by hiding or showing the workspace panes and by adjusting the Review Window layout. To hide or show the workspace panes Select View > Panes and select the name of the pane you want to hide or show. Click the button of the workspace pane or show it. Or, in the toolbar to hide To adjust the Review Window layout Click the arrow next to and select the Review Window layout from the submenu, or select View > Review Layout and select the Review Window layout from the submenu. You can open images or image runs in the new review panes by dragging them there from the Thumbnails pane or by selecting the target review pane and double-clicking the thumbnail in the Thumbnails pane. To return to the standard Review Window layout, press F6 or select View > Reset Layout. QAngio XA 7.3 2 Quick Tour Quick Tour In this quick tour, you will get to know QAngio XA's key features and basic workflow. You will review a study, calibrate it, perform an analysis, create a report, and export the report. Starting QAngio XA and Reviewing Studies QAngio XA is usually installed by qualified support personnel or by your system administrator. If you need installation instructions, refer to the QAngio XA Installation Manual on the installation CDROM. When you have started QAngio XA, you can open a study and start browsing the image run to select a specific frame to calibrate, measure, or analyze. To start QAngio XA Click the QAngio XA icon on the desktop. Select Start > Programs > Medis QAngio XA > QAngio XA 7.3. Or, To start QAngio XA Basic Edition Click the QAngio XA Basic Edition icon on the desktop. Select Start > Programs > Medis QAngio XA Basic Edition > QAngio XA Basic Edition 7.3. Or, To open a study 1. In the toolbar, click or select File > Open... 2. Browse your directory structure for the images that you want to open. Select the image or image run. You can open multiple images at once. Press CTRL and click to select images one by one. Press SHIFT and click to select the first and last image of a range. 3. Click Open. QAngio XA 7.3 3 Quick Tour To browse an image run You use the image controls for playing, stopping, and browsing image runs. Click to stop the image run. Click or to browse the image run frame by frame. Click or to jump to the first or last frame in the image run. Click or to start playing the image run in reverse or in normal mode. You can also use the middle mouse button or the mouse wheel to scroll through the frames. To zoom in or out Drag the zoom slider to the right to zoom in, drag it to the left to zoom out. To pan Press the left mouse button, hold it down and drag. To adjust cine playback speed Drag the movie speed slider to the right to increase the speed, drag it to the left to decrease it. Calibrating Image Runs Before you start measuring or analyzing an image run, you must calibrate your images. QAngio XA offers catheter calibration, marker catheter calibration, grid calibration, line calibration, circle calibration, and sphere calibration. You can also manually enter a calibration factor if you cannot use any of the other calibration types. This is referred to as manual calibration. If isocenter calibration data is available in the DICOM file, the isocenter calibration factor is used by default. QAngio XA 7.3 4 Quick Tour The isocenter calibration factor is only valid for measurements at the level of the isocenter. Make sure to select a frame according to the selection criteria for the chosen calibration type. The following box shows the selection criteria for the most frequently used calibration type, catheter calibration. Image Selection Criteria for Catheter Calibration The catheter must be in the same plane as the vessel to be analyzed. The frame that shows the catheter must be acquired with the same X-ray gantry and patient table settings as the frame that shows the vessel to be analyzed. Ideally, they are frames of the same image run. The catheter must be shown with a minimum of motion. The catheter must be contrast-filled, clearly visible, and with a minimum overlap of contrast agent in the aorta. The part of the catheter shown must be long enough to ensure accuracy. You can find selection criteria for the other calibration types in the online help in the chapter on calibration. To calibrate an image run 1. Use the image controls to select the frame that best meets the selection criteria for the calibration type. You can zoom in on the calibration device using the zoom slider panning the image. , and 2. Click if you want to perform a circle, sphere, line, or manual calibration. If you want to perform a catheter, marker catheter, or grid calibration, click the arrow at the end of the calibration toolbar, and select the calibration type from the submenu. This opens the calibration wizard to the right of the Review Window. 3. Follow the instructions in the wizard. When you are performing a catheter calibration, be sure to place your points in lengthwise direction. The smallest size catheter for which catheter calibration has been validated, is 6 French. If you want to use smaller catheter sizes, make sure that there are validation studies to back up the calibration. 4. The last wizard step shows the calibration factor that will be applied. 5. Click Done. You can now start performing measurements and analyses. QAngio XA 7.3 5 Quick Tour Performing Analyses QAngio XA enables you to analyze lesions in various types of vessel segments and to quantify ventricular function in X-ray angiograms and ventriculograms respectively. For an overview of all QAngio XA modules and for detailed instructions on performing all types of QAngio XA analyses, refer to the QAngio XA online help. In this manual, we will look at performing straight vessel segment analyses, ostial vessel segment analyses, bifurcated vessel segment analyses, and analyses of left ventriculograms (QLV analyses). All analyses are performed in analysis wizards, which provide detailed instructions. Straight and ostial analysis wizards consist of four steps: creating a vessel pathline (Pathline step) verifying and editing vessel contours (Contours step) (If you are using the QAngio XA Basic Edition: you can access this step by clicking the Contours tab in the wizard.) verifying reference diameter function and verifying and editing the position of the lesion markers (Markers step) (If you are using the QAngio XA Basic Edition: you can access this step by clicking the Markers tab in the wizard.) labeling results (Results step) The bifurcation analysis wizard consists of six steps: creating vessel pathlines (Pathlines step) verifying and editing vessel contours (Contours step) checking that the appropriate analysis model is selected (Model step) verifying the reference diameter function in the various sections (Reference step) verifying and editing the position of the lesion markers (Markers step) labeling results (Results step) (If you are using the QAngio XA Basic Edition: you can access the Contours, Model, Reference and Markers step by clicking the corresponding tab in the wizard.) The QLV analysis wizard consists of three or four steps, depending on the type of license you have: placing landmarks (Landmarks step, only available with license for automatic QLV contour detection) creating contours, or verifying and editing contours (Contours step) verifying and editing the mitral valve markers (Mitral Valve step) (If you are using QAngio XA Basic Edition: this step is not available in the Basic Edition.) viewing results and selecting wall motion calculation method (Results step) QAngio XA 7.3 6 Quick Tour To obtain accurate results, you must calibrate image runs before you analyze them, and you must make sure to select a frame that meets the selection criteria. The following box shows the selection criteria for vessel analyses. Do not perform analyses on lossy compressed or derived (filtered) images. You will be warned when you attempt to analyze these types of images. Image Selection Criteria for Vessel Analyses In case two or more different views of a lesion are available, select the image showing the most severe obstruction. The frame must show the vessel with a minimum of motion. The frame must show a contrast-filled vessel. The frame must be the one with the smallest diameter at the stenosis in the image run. The frame must show the vessel in the same plane as the calibration device to avoid outof-plane effects. To perform a straight segment or ostial analysis 1. Use the image controls to review the frames and select one for analysis. 2. Select (Straight Segment Analysis) or (Ostial Segment Analysis) or Select Procedures > Analyses and then select Straight Segment Analysis or Ostial Segment Analysis. 3. In the Pathline step of the wizard, create a pathline through the vessel that guides the automatic contour detection. Follow the instructions in the wizard. 4. In the Contours step of the wizard, you must verify and edit the vessel contours if necessary. (If you are using the QAngio XA Basic Edition: click the Contours tab in the wizard to access this step.) If you have selected Automatic, click the contour you want to edit to select it, then click again to place the first support point along which the contour is redrawn. Repeat this to place multiple support points. You can also pick up a support point and drag it to modify the shape of the vessel contour. When you switch from Manual to Automatic, all manual editing is lost. If you want to combine both types of editing, make sure to first apply automatic editing, and then make manual changes. If you have selected Manual, click to select the contour, then redraw using the left mouse button. To erase part of the contour, click the contour, then hold down the right mouse button to start erasing from the point where you clicked. Click the middle mouse button or the mouse wheel to accept the edited contours. Major changes you make are automatically corrected. QAngio XA 7.3 7 Quick Tour 5. In the Markers step of the wizard, you must select the lesion type, verify the lesion information and correct the reference vessel diameter if necessary. (If you are using the QAngio XA Basic Edition: click the Markers tab in the wizard to access this step.) The following abbreviations are used in the diagrams: p - proximal point in obstruction o - obstruction d - distal point in obstruction r - reference marker (vessel diameter of normal size) pa - proximal point in aneurysm a - aneurysm da - distal point in aneurysm ra - reference marker for aneurysm The measured diameter stenosis percentage is based on the minimum lumen diameter in the obstruction compared to the normal reference diameter of the vessel. You can reposition the following lesion markers by dragging them: p - proximal point in obstruction, or pa - proximal point in aneurysm o – obstruction, or a - aneurysm d - distal point in obstruction, or da - distal point in aneurysm You can correct the reference vessel diameter by a) selecting a longer segment in the previous Pathline wizard step. b) marking ("flagging") diseased parts of vessel segments. Refer to the user manual for detailed instructions. (If you are using the QAngio XA Basic Edition: this option is not available in the Basic Edition.) c) repositioning the r reference marker (the ra reference marker for aneurysms) by dragging it in the Markers wizard step. 6. In the Results step of the wizard, you can add labeling information. 7. Click Done. This adds the analysis to the Procedures pane. You can save your results as DICOM data on your system or network, save them to your imaging or archiving system, or save them as a DICOMDIR. You can also export the analysis results as XML, as a Structured Report, or as a Secondary Capture. You can also create a report, which you can print, save as a DICOM Secondary Capture, or save in JPEG or PDF format. In the last two sections of this manual, you will create a report and export it. To perform a bifurcation analysis 1. Use the image controls to review the frames and select one for analysis. 2. Select Analysis. QAngio XA 7.3 (Bifurcation Analysis) or Select Procedures > Analyses > Bifurcation 8 Quick Tour 3. Follow steps 3 and 4 of the instruction for straight segment and ostial analyses. In step 4, also check the position of the carina point. You can change it in the Automatic editing mode by dragging the carina marker. 4. In the Model step of the wizard, check if the appropriate analysis model is selected. (If you are using the QAngio XA Basic Edition: you can access the Contours, Model, Reference and Markers step by clicking the corresponding tab in the wizard.) The T-shape model is suitable for the analysis of bifurcations with a typical side-branch structure, bifurcations with a side branch diameter less than that of the parent vessel, and bifurcations with a wide angle between the distal branches. The Y-shape model is suitable for the analysis of skirt or carinal stents, left main bifurcations, bifurcations with equal-size distal branches, and bifurcations with a narrow angle between the distal branches. If you select the T-shape model, use the Change Main / Side button to switch the main vessel and the side vessel. Click Next. 5. In the Reference step of the wizard, you must verify the reference contours and edit them if necessary. Under Section, select the section you are looking at: Proximal, Distal 1, or Distal 2 for the Y-shape model, Main and then Proximal and Distal, or Side for the T-shape model. Check that the area marked as the bifurcation core, is correct. You can modify the start of the bifurcation core. Refer to the online help for detailed instructions. (If you are using the QAngio XA Basic Edition: this option is not available in the Basic Edition.) You can mark (“flag”) additional diseased parts of vessel segments. Refer to the online help for detailed instructions. (If you are using the QAngio XA Basic Edition: this option is not available in the Basic Edition.) You can correct the reference vessel by dragging the reference marker to the position where the vessel has the width to be considered normal. Make sure that you correct the reference vessel in the way described in your standard operating procedure. Verify and edit all three sections, then click Next. 6. In the Markers step of the wizard, you must check that the area marked as an obstruction in the image, is correct. You can reposition the lesion markers by dragging them. p - proximal point in obstruction o - obstruction d - distal point in obstruction You can add stent length measurements across two or three sections. Under Measure length, select the branch in which you are measuring. Lp stands for proximal, L1 for distal 1, L2 for distal 2, Lm for main, and Ls for side. Drag the corresponding marker in the diagram over the section you want to measure. The length is shown next to the marker. (If you are using the QAngio XA Basic Edition: the stent length markers are not available in the Basic Edition.) Click Next. QAngio XA 7.3 9 Quick Tour 7. In the Results step of the wizard, you can add labeling information. 8. Click Done. This adds the analysis to the Procedures pane. With bifurcation analyses you have the same saving, exporting, and reporting options as with straight segment and ostial segment analyses. To perform a QLV analysis 1. Calibrate the image run. 2. Use the image controls to select the end-diastolic frame. 3. Select Analysis. (QLV Analysis) or Select Procedures > Analyses and then select QLV 4. If you have a license for automatic QLV analysis, the wizard starts with the Landmarks step. Click in the Review Window to select the ED landmarks: the apex and the two aortic valve base points. You can place the ED points in a random order. Reposition them if needed. Click the ES icon. This makes the ES icon active. Use the image controls to select the end-systolic frame. Click in the Review Window to select the ES landmarks as shown in the ES icon. You can place the ES points in a random order. This displays the ED and ES contours. Reposition the points to modify the contours if needed. To reposition the ED points, click the ED icon. Click Next. 5. In the Contours step of the wizard, you either edit the automatically created ED and ES contours or you create the ED and ES contours manually if you do not have a license for automatic QLV analysis. When you are editing contours, click the contour where you want to edit it. Use the left mouse button to redraw part of the contour. To erase part of the contour, hold down the right mouse button to start erasing from the point where you clicked. Click the middle mouse button or the mouse wheel to accept the edited part of the contour. Move on to the next contour part you want to edit and repeat the steps described. When you are drawing contours, use the left mouse button to draw and use the right mouse button to erase. Click the middle mouse button or the mouse wheel to accept the contours. Use the ED and ES contours to switch between editing the ED and the ES contours. Click Next. 6. In the Mitral valve step of the wizard, verify the position of the mitral valve marker. If its position is incorrect, drag the marker along the contour to reposition it. (If you are using the QAngio XA Basic Edition: this step is not available in the Basic Edition.) QAngio XA 7.3 10 Quick Tour When the mitral valve marker position is correct, click Next. 7. In the Results step of the wizard, you can view the global analysis results. If you want to calculate wall motion, select the tab with your preferred wall motion calculation method to the right of the Results pane: Slager, Centerline, or Stanford. Clicking the tab calculates wall motion according to the selected calculation method and displays the results in the image and in the Results pane. (If you are using the QAngio XA Basic Edition: this option is not available in the Basic Edition.) 8. Click Done. This adds the analysis to the Procedures pane. With QLV analyses you have the same saving, exporting, and reporting options as with vessel segment analyses. Creating Reports Reports contain patient and study details, calibration, annotation, measurement, and analysis details. To create a report 1. In the Procedures pane, select the study for which you want to create a report. 2. Click in the toolbar or select View > Report... This opens the Report window, which shows report details on a number of tabs. 3. From the drop-down list in the Report window, select the type of report that you want to create. Patient-Study reports contain the patient and study details provided in the original DICOM files. Other types of reports provide basic patient details together with measurement, calibration, or analysis details. 4. If you have selected a Patient-Study report, you can select the amount of detail that you want the report to show. Click Short, Detailed, or Detailed single page. The Detailed single page report is especially useful if you want to print the report. (If you are using the QAngio XA Basic Edition: this option is not available in the Basic Edition.) 5. Click to display the Print Preview. 6. Click to print the report. QAngio XA 7.3 11 Quick Tour In the report window, you can click study information. to view DICOM data and edit the patient and In multi-tab reports, you can click to set the current tab as the tab that is shown by default when you create this type of report. 7. Click Close to close the Report window. Saving and Exporting Results You can save image runs and reports to a location on your system or network in PDF or JPEG format, or export them as a Secondary Capture. You can save a study with your annotations, measurements and analyses to a location on your system or network. The file formats that you can choose from are DICOM, BMP, JPEG, AVI and the raw file format. To save results 1. In the toolbar, click or select File > Save As... This opens the Save Dataset dialog window. 2. Select the location where you want to save the study and the results. 3. Type a name for the study in the File name field. 4. Select the file type from the Save as type drop-down list. 5. Select one of the options Save whole image run or Save single frame. When you select the option Save single frame only, this saves the active frame and all frames with calibration or measurement results by default. 6. Click Save. To export the current image run or report 1. Select File > Export and Exit… 2. In the Export dialog window, type or select a new description, and select a DICOM node. 3. Click Export & Quit to export the report and close QAngio XA, or click Export & Return to export the report and return to the QAngio XA main window. QAngio XA 7.3 12 More Information To access the online help This manual outlines the basics of working with QAngio XA. You can find more details and more instructions in the QAngio XA online help. In QAngio XA, press F1 or select Help > Help Topics. To access the documentation On the QAngio XA installation CD-ROM you can also find the QAngio XA Installation Manual, Release Notes, DICOM Conformance Statement and Declaration of Conformity. In QAngio XA, select Help > More Documentation… Or, 1. Look up the QAngio XA installation directory in your file system. 2. You can find the QAngio XA documentation set in the Documents directory. Or, 1. Insert the QAngio XA CD-ROM. 2. In Windows Explorer, browse the directory structure of the CD-ROM. The documentation is located in the Documents directory. QAngio XA 7.3 Quick Start Manual 13