1
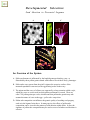
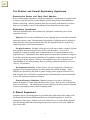
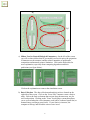
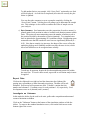
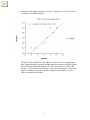
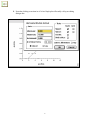
Developmental Selection:
Seed Abortion and Pollen Tube
Competition
User's Manual
Donald Buckley
Martin Cohen
Quinnipiac University
University of Hartford
A BioQUEST Library VII Online module published by the BioQUEST Curriculum Consortium
The BioQUEST Curriculum Consortium (1986) actively supports educators interested in the
reform of undergraduate biology and engages in the collaborative development of curricula.
We encourage the use of simulations, databases, and tools to construct learning environments
where students are able to engage in activities like those of practicing scientists.
Email: [email protected]
Website: http://bioquest.org
Editorial Staff
Editor:
Managing Editor:
Associate Editors:
John R. Jungck
Ethel D. Stanley
Sam Donovan
Stephen Everse
Marion Fass
Margaret Waterman
Ethel D. Stanley
Online Editor:
Amanda Everse
Editorial Assistant: Sue Risseeuw
Beloit College
Beloit College, BioQUEST Curriculum Consortium
University of Pittsburgh
University of Vermont
Beloit College
Southeast Missouri State University
Beloit College, BioQUEST Curriculum Consortium
Beloit College, BioQUEST Curriculum Consortium
Beloit College, BioQUEST Curriculum Consortium
Editorial Board
Ken Brown University of Technology, Sydney, AU
Joyce Cadwallader St Mary of the Woods College
Eloise Carter Oxford College
Angelo Collins Knowles Science Teaching Foundation
Terry L. Derting Murray State University
Roscoe Giles Boston University
Louis Gross University of Tennessee-Knoxville
Yaffa Grossman Beloit College
Raquel Holmes Boston University
Stacey Kiser Lane Community College
Peter Lockhart Massey University, NZ
Ed Louis The University of Nottingham, UK
Claudia Neuhauser University of Minnesota
Patti Soderberg Conserve School
Daniel Udovic University of Oregon
Rama Viswanathan Beloit College
Linda Weinland Edison College
Anton Weisstein Truman University
Richard Wilson (Emeritus) Rockhurst College
William Wimsatt University of Chicago
Copyright © 1993 -2006 by Donald Buckley and Martin Cohen
All rights reserved.
Copyright, Trademark, and License Acknowledgments
Portions of the BioQUEST Library are copyrighted by Annenberg/CPB, Apple Computer Inc., Beloit College, Claris
Corporation, Microsoft Corporation, and the authors of individually titled modules. All rights reserved. System 6,
System 7, System 8, Mac OS 8, Finder, and SimpleText are trademarks of Apple Computer, Incorporated. HyperCard
and HyperTalk, MultiFinder, QuickTime, Apple, Mac, Macintosh, Power Macintosh, LaserWriter, ImageWriter, and the
Apple logo are registered trademarks of Apple Computer, Incorporated. Claris and HyperCard Player 2.1 are
registered trademarks of Claris Corporation. Extend is a trademark of Imagine That, Incorporated. Adobe, Acrobat, and
PageMaker are trademarks of Adobe Systems Incorporated. Microsoft, Windows, MS-DOS, and Windows NT are
either registered trademarks or trademarks of Microsoft Corporation. Helvetica, Times, and Palatino are registered
trademarks of Linotype-Hell. The BioQUEST Library and BioQUEST Curriculum Consortium are trademarks of Beloit
College. Each BioQUEST module is a trademark of its respective institutions/authors. All other company and product
names are trademarks or registered trademarks of their respective owners. Portions of some modules' software were
created using Extender GrafPak™ by Invention Software Corporation. Some modules' software use the BioQUEST
Toolkit licensed from Project BioQUEST.
Table of Contents
AN OVERVIEW OF THE SYSTEM . . . . . . . . . . . . . . . . . . . . . . . . . . . . . . . . . . . . . . . . . . . . . . . . . . . . . . . . . . . . . . 1
THE PROBLEM AND SEVERAL EXPLANATORY HYPOTHESES . . . . . . . . . . . . . . . . . . . . . . . 2
REPRODUCTIVE EXCESS AND EARLY SEED ABORTION ............................................................... 2
EXPLANATORY HYPOTHESES.................................................................................................. 2
Dispersal ........................................................................................................................ 2
Escaping Predators ........................................................................................................... 2
Developmental Selection................................................................................................... 2
Maternal Resource Limitation............................................................................................ 2
A NATURAL EXPERIMENT . . . . . . . . . . . . . . . . . . . . . . . . . . . . . . . . . . . . . . . . . . . . . . . . . . . . . . . . . . . . . . . . . . . . . . 2
THE DEVELOPMENTAL SELECTION SIMULATION, . . . . . . . . . . . . . . . . . . . . . . . . . . . . . . . . . . . . . . 3
SIMULATION SCREEN............................................................................................................ 3
EXPORT DATA...................................................................................................................... 5
INVESTIGATE AN UNKNOWN ................................................................................................... 5
SAMPLE LABORATORY USING DEVELOPMENTAL SELECTION . . . . . . . . . . . . . . . . . . . . . . 6
STATISTICAL ANALYSIS ........................................................................................................ 7
USING EXCEL AND CRICKET GRAPH TO CALCULATE AND PLOT MEANS AND STANDARD ERRORS, AND TO
CONDUCT CORRELATION ANALYSIS........................................................................................ 9
Developmental
Selection:
Seed Abortion in Perennial Legumes
A
B
C
D
An Overview of the System
A. Pollen performance is influenced by the haploid genotype that they carry, as
illustrated by these pollen grains stained with iodine to reveal their Waxy phenotype.
B. Pollen tubes carry sperm from the pistil’s stigma (the receptive surface of the
maternal reproductive structure) to the egg-bearing ovules in the ovary.
C. The stigma and the ovary of a flower are separated by a long extension called a style,
which may serve as a race track in which pollen performance is tested. There are
often 7-20 pollen grains per ovule, which means that pollen tube growth may take
assume the nature of a race to the eggs ...pollen tube competition.
D. Pollen tube competition can influence the genetic quality of resulting seed progeny,
such as in the legume fruits above. In many species, the affects of pollen tube
competition can be viewed in the pattern of seed abortion within fruits. In fact, the
signature of pollen tube competition may be used as a test of whether seed abortion is
selective.
The Problem and Several Explanatory Hypotheses
Reproductive Excess and Early Seed Abortion
Even in climax plant communities, where the reproductive requirement of a parent is only
to replace itself with one successful offspring, parents may produce from hundreds to
billions of offspring. In these perennial plants (species whose individuals live for more
than one year), many or most seeds (and spores) are aborted before they mature.
Explanatory Hypotheses
Numerous hypotheses have been advanced to explain the evolutionary cause of this
reproductive excess.
Dispersal: Sites for the establishment of new offspring may be rare and/or randomly
dispersed in space or time. Broadcasting a large number of offspring may be required to
ensure dispersal into these recruitment sites, but this hypothesis doesn’t explain why
numerous progeny abort before maturation.
Escaping Predators: “Masting” plant species are the most extreme example of plants
that reproduce much more intensively in some years than others. Years of low
reproductive output are usually more common and serve to maintain predators at low
population sizes. Infrequently, these plants greatly increase their reproductive output, to
levels that exceed the harvesting capabilities of its predators, which ensures the escape of
some progeny from predators. However, this hypothesis does not contribute to our
understanding of why many progeny abort very young, without being able to serve as a
“decoys” for predators.
Developmental Selection: In many species, the over-production of inexpensive
propagules is mechanism employed to screen genetically variable offspring. Many
offspring are discarded by this kind of genetic testing, but the progeny that result are a
kind of genetic elite. Pollen tube competition and seed abortion have been demonstrated
to serve this function in numerous examples.
Maternal Resource Limitation: Maternal resources may not be sufficient to
mature the number of ovules fertilized earlier in the season. In such cases, seed abortion
may be non-selective. The advantaged seeds may simply be the ones closest to maternal
resources, preempting resources from competing seeds.
A Natural Experiment
In legume species, the arrangement of seed within fruits lends itself to the testing of the
Developmental Selection and Maternal Resource Limitation hypotheses. Seeds are
arranged in a linear array, with the style at one end of the row of seeds and the peduncle
(the stalk through which the maternal parent provides resources to the seed within the
fruit) at the other.
2
A dissected legume fruit, with mature (M)
and aborted (A) seeds inside. Note that the
seeds are arrayed in a row with the two
pattern-producing structures located at
opposite ends of the fruit.
If pollen tube competition has sorted the genetic quality of the seed within the fruit, then
the first fertilizations, involving the fastest-growing pollen tubes, should be in proximity
to the site from which pollen tubes emerge from their race through the style and into the
ovary. In most species that have been studied, the pollen tubes enter the ovary near the
stylar or distal end of the fruit, which would result in a gradient of genetic quality within
the fruit. If seed abortions are influenced by the genetic quality of the seeds, then seed
maturation rates should be highest closest to the point of pollen tube entry into the
ovary. Conversely, seed abortion may be non-selective. Perhaps proximity to the spigot,
the fruit’s peduncle, matters most. Seeds at the base of the fruit may benefit from better
nutrient access by being closer to the nutrient source, in which case, maturation rates
should be highest at the base of the fruit, not the stylar end.
The Developmental Selection Simulation,
Developmental Selection is a research simulation. It is intended to provide practice in data
collection, data analysis, and hypothesis testing.
Double click the Developmental Selection application to launch it. Click on the title
screen to advance into the simulation.
Simulation Screen
The simulation screen is divided into three areas (a–c):
3
a)
b)
c)
a) Sliders Used to Control Biological Parameters. On the left of the screen
you will see three sliders that let you modify seed/ovule ratios (the proportion
of immature seeds to mature) and the relative intensities of pollen tube
competition and maternal resource limitation. Click on the slider titles for
more explanation, especially about competing hypotheses and their
predictions (see figure below).
Click on the explanation to return to the simulation screen.
b) Data Collection. The data collection and analysis tools are located on the
right side of the screen. Click on the “Score Fruit” button to create a fruit to
study. Below the fruit are buttons that activate drop-down menus, one for
each seed position. Clicking on the "Score" box displays a menu that allows
you to score whether the ovule (immature seed) above it aborted (small dot) or
matured into a seed (large green circle). If your choice is incorrect, the
computer will beep, and record the correct score in red.
4
To add another fruit to your sample, click “Score Fruit” again and a new fruit
will be displayed. As each fruit is completed (all ovules are scored), the plot
below is updated.
You can direct the computer to create a complete sample by clicking the
“Score Fruits” button. A dialog box will prompt you to determine the sample
size. This technique is also useful to examine the effect of sample size on
your analysis.
c) Data Summary. Seed maturation rate (the proportion of seeds to mature) is
plotted against seed position in order to examine seed abortion patterns within
fruits. The points are mean maturation rates (the number of mature seeds at
the position divided by the number of fruits examined). Two standard error
bars are plotted also, approximating 95% confidence limits. Neighboring mean
maturation rates that fall outside the error bars are significantly different (P <
0.05). Note that as sample size increases, the shape of the curves reflect the
underlying biology more faithfully and the error bars decrease in size, which
allows real differences to be recognized more reliably.
Trends may be apparent, despite the fact that neighboring means fall within
the error bars. To resolve these trends, regression or correlation analysis must
be applied.
Export Data.
Click on the clipboard icon (right) to load the dataset into the clipboard for
pasting into a spreadsheet or other data analysis package. The data will be tabdelimited. Each record will represent one fruit. Column 1 contains the fruit
number and columns 2-11 contain scores for seed positions 1-10, respectively. Seed
development scores are 0 (aborted) and 1 (mature).
Investigate an Unknown
In this mode the sliders for the seed/ovule ratio, pollen tube competition and maternal
resource limitation are hidden.
Click on the "Unknown" button at the bottom of the simulation window to hide the
sliders. To return to the standard simulation screen, click on the black arrow on the
bottom right of the screen.
4
Sample Laboratory Using Developmental Selection
A. Examine 10 fruits by clicking the “Score Fruit” button and then scoring each seed
within a fruit. This will clarify how data are collected from each fruit.
B. Using the “Score Fruits” button, test the following hypotheses with the specified
samples. Indicate whether the results seem unambiguous. Be prepared to explain
what these data might reflect about the causes of seed abortion in that hypothetical
legume species.
1. Set Low MRL and Low PTC. What do you predict you will find?
base
tip
base
tip
base
tip
tip
base
tip
a) Sample size = 3
b) Sample size = 10
c) Sample size = 50
2. Set High MRL and Low PTC
base
tip
base
a) Sample size = 3
b) Sample size = 10
c) Sample size = 50
3. Set Low MRL and High PTC
base
tip
tip
base
a) Sample size = 3
4
base
tip
b) Sample size = 10
c) Sample size = 50
C. Click on the unknown button. Paste your data set into Excel to calculate means and
standard errors. Then paste your means and standard error data into Cricket graph
and produce two plots:
1. Means and two standard error bars. Interpret this analysis.
2. A correlation analysis. Interpret this analysis.
D. You will have an unknown next week. You and your team will produce a poster or
PowerPoint presentation in class, to be presented at the end of the lab period.
Statistical Analysis
Analysis may be facilitated by importing the data into a spreadsheet to calculate means
and values two standard errors above and below the means. Your final data set will
contain one column for seed position and columns for maturation rate, and a two standard
error value for plotting error bars. There will therefore be eleven rows, with variable
names in the first row and ten rows to describe the ten seed positions. The data will be
saved as a text file so that it can be imported into Cricket Graph to be plotted and/or to
conduct a correlation analysis of means against seed position.
A. A statistic of location: Mean maturation rate = the number of mature seeds over the
total number of aborted and mature seeds. This value describes the most common
outcome, although sample means are influenced by chance. Increasing the sample size
increases the precision of the estimate.
B. The variation in sampling means is often quantified using Standard Errors. Sample
means will be found within one standard error of the true mean about 67% of the time,
and within two standard errors of the true mean about 95% of the time. Therefore,
two standard error bars are often plotted above and below the sampled mean as a
method of conducting a graphical estimate of whether two means are statistically
different. In the two examples below, the means are different but with small sample
sizes the neighboring means fall within the 2 standard error range and can’t conclude
that the samples are really different. Increasing the sample size decreases the range of
the error bars and we can recognize the difference between the two samples
statistically (a mean exceeding two standard errors approximates a P = 0.05 criterion
for rejection).
4
means dissimilar
variability great
much overlap
common results with
small sample size
differences
questionable
Control
Treatment
Control
Treatment
means dissimilar
little variability
less overlap
these results only
with large sample size
differences
clear
Control
Treatment
Control
Treatment
For frequencies such as the seed maturation rate per seed position, the value of one
standard error is
SE = SQRT(pq/N) where p is the maturation rate, q = 1-p and N is the sample size.
C. Sometimes paired comparisons are not very useful, such as when seeking evidence of
a trend. Correlation or regression analyses are often used in these circumstances.
Regression is used when comparing two variables, one of which is known to cause the
other unilaterally. We will use correlation analysis, which makes no claims about
causation. Demonstrating a correlation merely means that a pattern of concerted
change has been demonstrated. A positive correlation indicates that both variables
increase or decrease together. A negative correlation means that one variable decreases
as the other increases.
Correlations are quantified by correlation coefficients (r), which range from -1.0 to
+1.0 in value. Whether a particular r value should be considered a significant
correlation (P > 0.05 again) depends on the number of degrees of freedom (df), which
in correlation analysis is the sample size minus 2. One compares the observed
correlation value with a critical value for P = 0.05 and the given number of degrees of
freedom. If the observed value is at least as large as the critical value, then a
significant correlation has been demonstrated.
4
Using Excel and Cricket Graph to Calculate and Plot Means and
Standard Errors, and to Conduct Correlation Analysis
A. Terminology
1. A spreadsheet is a special file intended to facilitate the handling of tabular
information.
2. Columns are labeled with letters at their top, whereas rows are numbered at
the left.
3. the intersection of a row and a column is called a cell and is used to hold one
piece of information.
4. A rectangular area is called a range and is specified listing the cell address on
the top, left, followed by a colon and the cell address on the bottom, right,
such as A1:A4 (cells A1, A2, A3, and A4).
5. Cells can contain either text (as does cell A1 below), numeric values (as does
cell B1), or formulae (see f, below).
Note that the active cell (highlighted) is identified just above the title bar of the
spreadsheet and its contents are displayed to the right of an equal sign, in the
editing field.
6. Cells can contain a third element: a formula. All formulae start with an equal
sign and are used to make calculations and to perform other tasks. Usually,
the cell shows the value returned by the formula and the field reveals the actual
formula. The formula on the left was keyed in by entering an equal sign, then
by clicking on cells B1, then B2, and finally B3. The formula on the right is
called a function and utilizes a built in program to produce the same result.
The range of numbers to be added-up was specified in the range B1:B3.
Functions are available from the Insert menu.
4
B. Launch Microsoft Excel
C. Paste in the Developmental Selection data set. It should look like this, although the
number of rows will depend on your sample size. The base of the fruit is at the left
(seed position 1) and the stylar end of the fruit is on the right (seed position 10).
Seeds are aborted (0) or mature (1).
D. Calculate means and two standard error values below:
4
Developmental rate
2 to 6
...for data in column B, rows
...for data in column
Two standard errors
B, rows 2 to 6 (you may need 3 decimal places for this variable)
Insert one last row: seed position number
E. In order to plot this data or to conduct a correlation analysis of developmental rate
and seed position, the means, standard errors, and seed position data will need to be
transposed into columns. Select and copy the hilighted range.
F. Create a new file and select “Paste Special” from the “edit” menu. Click on “values”,
“Transpose”, and the “OK”.
G. The data will be re-arranged in the column format needed for analysis or plotting.
Select and copy the data so that it can be pasted into Cricket Graph. Save your Excel
file and Quit Excel.
4
H. Launch Cricket Graph and paste in your data.
I. You will need to complete three steps:
1. Cut the variable names out of the cells in row 1 and paste them into the
column header cells (e.g., like Column 1).
4
2. The empty first row must be deleted. Click on “1” on the left of the row and
select delete from the “Edit” menu.
3. Finally, each column must be formatted. Select a column and then choose
“Format Data” from the “Data” menu. Select “Decimal” and the number of
decimal places that you will need.
4
J. Now you are ready to conduct your analysis. Select Graph/Scatter. Choose
“position” for your horizontal axis and “devRate” for your vertical axis. Click “OK”.
You should see a graph like the one below. There seems to be an increase in seed
maturation rate toward the stylar end of the fruit, but is it real?
4
1. Plot “Y Error Bars” from the “Goodies” menu. There is considerable overlap
among these means and error bars, so this kind of analysis will not be helpful
in this case.
4
2. Repeat the same graph without the error bars. Then select “Curve fit”/Linear”
to conduct a correlation analysis:
The plot will be modified by a the addition of the best fit curve through these
data, a linear prediction equation, and the squared correlation coefficient (called
the Coefficient of Determination or CD). Take the square root of the CD to
produce “r”, the correlation coefficient. There are ten data points. How many
degrees of freedom do you have? Is this a significant correlation? Check a
table of correlation coefficients.
4
K. Note that clicking on an item in a Cricket Graph plot will usually call up an editing
dialogue box.
4