1
VT Trader 2.0 Help Manual
© 2011 Visual Trading Systems, LLC
VT Trader 2.0 Help Manual
© 2011 Visual Trading Systems, LLC
All rights reserved. No parts of this work may be reproduced in any form or by any means - graphic, electronic, or
mechanical, including photocopying, recording, taping, or information storage and retrieval systems - without the
written permission of the publisher.
Products that are referred to in this document may be either trademarks and/or registered trademarks of the
respective owners. The publisher and the author make no claim to these trademarks.
While every precaution has been taken in the preparation of this document, the publisher and the author assume no
responsibility for errors or omissions, or for damages resulting from the use of information contained in this
document or from the use of programs and source code that may accompany it. In no event shall the publisher and
the author be liable for any loss of profit or any other commercial damage caused or alleged to have been caused
directly or indirectly by this document.
Printed: May 2011
Contents
3
Table of Contents
Part I Getting Started with VT Trader 2.0
17
1 PC System
...................................................................................................................................
Requirements
17
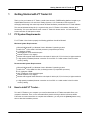
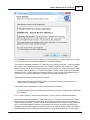
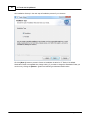
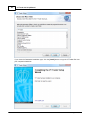
2 How to
...................................................................................................................................
intall VT Trader...
17
3 How to
...................................................................................................................................
login to VT Trader...
23
Part II VT Trader 2.0's Interface
26
1 Docking
...................................................................................................................................
- How it works...
27
2 Fluent...................................................................................................................................
UI Ribbon
30
Environm ent Tab
.......................................................................................................................................................... 33
Desktop Workspaces
.........................................................................................................................................................
Group
33
Window s Group
......................................................................................................................................................... 33
Client Files .........................................................................................................................................................
Group
34
Options Group
......................................................................................................................................................... 34
My Account Tab
.......................................................................................................................................................... 35
Account Actions
.........................................................................................................................................................
Group
35
Account Summary
.........................................................................................................................................................
Group
36
Reports Group
......................................................................................................................................................... 36
Trading Tab .......................................................................................................................................................... 37
Place New .........................................................................................................................................................
Orders(s) Group
37
Close Group
......................................................................................................................................................... 38
Dealing Rates
.........................................................................................................................................................
Group
38
Trading Window
.........................................................................................................................................................
s Group
39
Messages .........................................................................................................................................................
Group
39
Trading Tools
.........................................................................................................................................................
Group
40
Alerts Tab
.......................................................................................................................................................... 40
Price Alerts.........................................................................................................................................................
Group
40
Chart Tab
.......................................................................................................................................................... 41
Open Chart.........................................................................................................................................................
Group
41
Chart Templates
.........................................................................................................................................................
Group
41
Active Chart
.........................................................................................................................................................
Group
42
Show /Hide.........................................................................................................................................................
Group
43
Zoom Group
......................................................................................................................................................... 44
Axes Group
......................................................................................................................................................... 45
Print Group......................................................................................................................................................... 46
Technical Analysis
..........................................................................................................................................................
Tab
46
Analysis Tools
.........................................................................................................................................................
Group
46
Draw ing Tools
.........................................................................................................................................................
Group
47
Indicators Group
......................................................................................................................................................... 49
Trading Systems
.........................................................................................................................................................
Group
50
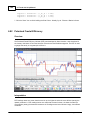
Fundam ental Analysis
..........................................................................................................................................................
Tab
51
New s Group
......................................................................................................................................................... 51
Forex Resources
.........................................................................................................................................................
Group
51
Help Tab
.......................................................................................................................................................... 52
Support Resources
.........................................................................................................................................................
Group
52
Troubleshooting
.........................................................................................................................................................
Group
52
© 2011 Visual Trading Systems, LLC
3
4
VT Trader 2.0 Help Manual
Contact Us.........................................................................................................................................................
Group
53
Version Group
......................................................................................................................................................... 53
3 VT Trader
...................................................................................................................................
Button
54
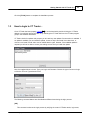
4 Quick...................................................................................................................................
Access Toolbar
55
5 VT Trader
...................................................................................................................................
Status Bar
58
6 VT Trader
...................................................................................................................................
Notification Icon
58
7 Options
...................................................................................................................................
(User Preferences)
59
General
.......................................................................................................................................................... 60
Instruments......................................................................................................................................................... 60
Trading ......................................................................................................................................................... 62
Desktop Workspaces
......................................................................................................................................................... 64
Print Page Setup
......................................................................................................................................................... 66
Miscellaneous
......................................................................................................................................................... 68
Com m unication
.......................................................................................................................................................... 70
Common ......................................................................................................................................................... 70
Part III Task Windows
73
1 Accounts
...................................................................................................................................
Summary
74
Account Inform
..........................................................................................................................................................
ation
74
Contextual.........................................................................................................................................................
Menu
76
Properties ......................................................................................................................................................... 77
Account Inform
..........................................................................................................................................................
ation Status Bar
79
Currency Portfolio
..........................................................................................................................................................
Window
80
Contextual.........................................................................................................................................................
Menu
82
Properties ......................................................................................................................................................... 83
Reports
.......................................................................................................................................................... 89
2 Dealing
...................................................................................................................................
Rates
89
Quotes Board..........................................................................................................................................................
Window
89
Instrument .........................................................................................................................................................
Panel
90
Contextual Menu ......................................................................................................................................... 92
Advanced Rates
..........................................................................................................................................................
Window
94
Contextual.........................................................................................................................................................
Menu
97
Properties ......................................................................................................................................................... 98
3 Trading
................................................................................................................................... 101
Open Positions
..........................................................................................................................................................
Window
101
Contextual
.........................................................................................................................................................
Menu
104
Properties......................................................................................................................................................... 106
Pending Orders
..........................................................................................................................................................
Window
108
Contextual
.........................................................................................................................................................
Menu
111
Properties......................................................................................................................................................... 111
Trading Activity
..........................................................................................................................................................
Window
114
Contextual
.........................................................................................................................................................
Menu
117
Properties......................................................................................................................................................... 117
4 Trading
...................................................................................................................................
Tools
120
Currency Calculator
.......................................................................................................................................................... 120
Pip Calculator
.......................................................................................................................................................... 120
5 Chart
...................................................................................................................................
Window
121
Chart Window
..........................................................................................................................................................
Toolbar
124
Customize...
......................................................................................................................................................... 127
Contextual Menu
.......................................................................................................................................................... 128
© 2011 Visual Trading Systems, LLC
Contents
5
Chart Properties
.......................................................................................................................................................... 131
Chart
......................................................................................................................................................... 133
Show /Hide
......................................................................................................................................................... 135
Miscellaneous
......................................................................................................................................................... 137
High/Low .........................................................................................................................................................
Zone
138
Cross Hair
......................................................................................................................................................... 140
Chart Types .......................................................................................................................................................... 142
6 Desktop
...................................................................................................................................
Workspaces Management
150
7 Chart
...................................................................................................................................
Templates Management
152
8 Technical
...................................................................................................................................
(Chart) Analysis
154
Data Inspection
..........................................................................................................................................................
Window
154
Contextual
.........................................................................................................................................................
Menu
157
Properties......................................................................................................................................................... 158
9 Fundamental
...................................................................................................................................
Analysis
161
Market Com m
..........................................................................................................................................................
entaries Window
161
Conextual.........................................................................................................................................................
Menu
163
Properties......................................................................................................................................................... 164
Dow Jones New
..........................................................................................................................................................
s Window
166
Contextual
.........................................................................................................................................................
Menu
168
Properties......................................................................................................................................................... 169
Econom ic Calendar
..........................................................................................................................................................
Window
172
10 Alerts
................................................................................................................................... 174
Alerts Activity
..........................................................................................................................................................
Window
174
Contextual
.........................................................................................................................................................
Menu
176
Properties......................................................................................................................................................... 177
Price Alert Window
.......................................................................................................................................................... 179
Active Price Alerts
..........................................................................................................................................................
Sum m ary Window
180
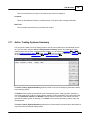
11 Active
...................................................................................................................................
Trading Systems Summary
181
12 Indicators
...................................................................................................................................
Builder
182
Indicator Editor
..........................................................................................................................................................
Window
184
Indicator Editor
.........................................................................................................................................................
Toolbar
184
Editor Options ......................................................................................................................................... 186
Code Parameters
................................................................................................................................... 187
Code Completion
................................................................................................................................... 191
General Tab
......................................................................................................................................................... 192
Input Variable(s)
.........................................................................................................................................................
Tab
195
Type
......................................................................................................................................... 198
Output Variable(s)
.........................................................................................................................................................
Tab
200
Horizontal.........................................................................................................................................................
Line(s) Tab
202
Formula Tab
......................................................................................................................................................... 204
13 Trading
...................................................................................................................................
Systems Builder
205
Trading System
..........................................................................................................................................................
Editor Window
207
Trading System
.........................................................................................................................................................
Editor Toolbar
207
Editor Options ......................................................................................................................................... 209
Code Parameters
................................................................................................................................... 210
Code Completion
................................................................................................................................... 213
General Tab
......................................................................................................................................................... 214
Input Variable(s)
.........................................................................................................................................................
Tab
216
Type
......................................................................................................................................... 218
Output Variable(s)
.........................................................................................................................................................
Tab
221
Output Variable.........................................................................................................................................
Editor Window
223
© 2011 Visual Trading Systems, LLC
5
6
VT Trader 2.0 Help Manual
Name Tab
................................................................................................................................... 223
Graphic Tab ................................................................................................................................... 225
Highlights Tab ................................................................................................................................... 227
Trends Tab
................................................................................................................................... 227
Indicator Output...................................................................................................................................
Tab
229
Alerts Tab
................................................................................................................................... 230
Trading Tab ................................................................................................................................... 232
Formula Tab
......................................................................................................................................................... 233
14 Quick
...................................................................................................................................
Lists
235
Configure Indicators
..........................................................................................................................................................
Quick List
235
Configure Trading
..........................................................................................................................................................
System s Quick List
236
Part IV Drawing Tools
239
1 Data...................................................................................................................................
Analysis
240
Cross Hair Tool
.......................................................................................................................................................... 240
Copy Prices ..........................................................................................................................................................
Tool
241
Com m ents Tool
.......................................................................................................................................................... 243
Contextual
.........................................................................................................................................................
Menu
245
Properties......................................................................................................................................................... 246
Sym bols Tool
.......................................................................................................................................................... 246
Contextual
.........................................................................................................................................................
Menu
249
Properties......................................................................................................................................................... 250
2 Lines
................................................................................................................................... 250
Vertical Lines
.......................................................................................................................................................... 250
Contextual
.........................................................................................................................................................
Menu
252
Properties......................................................................................................................................................... 253
Horizontal Lines
.......................................................................................................................................................... 253
Contextual
.........................................................................................................................................................
Menu
255
Properties......................................................................................................................................................... 256
Trend Lines .......................................................................................................................................................... 256
Contextual
.........................................................................................................................................................
Menu
258
Properties......................................................................................................................................................... 259
Trend Lines ..........................................................................................................................................................
by Angle
259
Contextual
.........................................................................................................................................................
Menu
261
Properties......................................................................................................................................................... 262
Linear Regression
..........................................................................................................................................................
Lines
263
Contextual
.........................................................................................................................................................
Menu
264
Properties......................................................................................................................................................... 265
3 Channels
................................................................................................................................... 265
Standard Deviation
..........................................................................................................................................................
Channels
265
Contextual
.........................................................................................................................................................
Menu
267
Properties......................................................................................................................................................... 268
Standard Error
..........................................................................................................................................................
Channels
269
Contextual
.........................................................................................................................................................
Menu
270
Properties......................................................................................................................................................... 271
Raff Regression
..........................................................................................................................................................
Channels
272
Contextual
.........................................................................................................................................................
Menu
274
Properties......................................................................................................................................................... 275
Equidistant Channels
.......................................................................................................................................................... 276
Contextual
.........................................................................................................................................................
Menu
277
Properties......................................................................................................................................................... 278
Andrew s' Pitchforks
.......................................................................................................................................................... 279
© 2011 Visual Trading Systems, LLC
Contents
7
Contextual
.........................................................................................................................................................
Menu
280
Properties......................................................................................................................................................... 281
4 Shapes
................................................................................................................................... 282
Ellipses
.......................................................................................................................................................... 282
Contextual
.........................................................................................................................................................
Menu
283
Properties......................................................................................................................................................... 285
Rectangles .......................................................................................................................................................... 286
Contextual
.........................................................................................................................................................
Menu
287
Properties......................................................................................................................................................... 288
Triangles
.......................................................................................................................................................... 290
Contextual
.........................................................................................................................................................
Menu
291
Properties......................................................................................................................................................... 292
5 Fibonacci
................................................................................................................................... 293
Fibonacci Retracem
..........................................................................................................................................................
ents
293
Contextual
.........................................................................................................................................................
Menu
294
Properties......................................................................................................................................................... 295
Fibonacci Expansions
.......................................................................................................................................................... 297
Contextual
.........................................................................................................................................................
Menu
299
Properties......................................................................................................................................................... 300
Fibonacci Tim
..........................................................................................................................................................
e Extensions
301
Contextual
.........................................................................................................................................................
Menu
303
Properties......................................................................................................................................................... 304
Fibonacci Channels
.......................................................................................................................................................... 305
Contextual
.........................................................................................................................................................
Menu
307
Properties......................................................................................................................................................... 308
Fibonacci Fans
.......................................................................................................................................................... 309
Contextual
.........................................................................................................................................................
Menu
311
Properties......................................................................................................................................................... 312
Fibonacci Arcs
.......................................................................................................................................................... 313
Contextual
.........................................................................................................................................................
Menu
315
Properties......................................................................................................................................................... 316
6 Gann
................................................................................................................................... 317
Gann Lines .......................................................................................................................................................... 317
Contextual
.........................................................................................................................................................
Menu
319
Properties......................................................................................................................................................... 320
Gann Fans .......................................................................................................................................................... 321
Contextual
.........................................................................................................................................................
Menu
322
Properties......................................................................................................................................................... 323
Gann Grids .......................................................................................................................................................... 324
Contextual
.........................................................................................................................................................
Menu
326
Properties......................................................................................................................................................... 327
Part V VT Trader Scripting Language
329
1 Comments
................................................................................................................................... 330
2 Punctuators
................................................................................................................................... 331
3 Operators
................................................................................................................................... 331
Mathem atical..........................................................................................................................................................
Operators
331
Relational Operators
.......................................................................................................................................................... 332
Logical Operators
.......................................................................................................................................................... 332
4 Constants
................................................................................................................................... 333
5 Predefined
...................................................................................................................................
Data Arrays
334
© 2011 Visual Trading Systems, LLC
7
8
VT Trader 2.0 Help Manual
6 Functions
................................................................................................................................... 334
Absolute Value
.......................................................................................................................................................... 338
Account Status
.......................................................................................................................................................... 338
Arc Tangent .......................................................................................................................................................... 339
Aroon Dow n.......................................................................................................................................................... 339
Aroon Up
.......................................................................................................................................................... 340
Average True
..........................................................................................................................................................
Range
340
Bar Count .......................................................................................................................................................... 341
Bar Index
.......................................................................................................................................................... 341
Bars Since .......................................................................................................................................................... 342
Bollinger Bands
..........................................................................................................................................................
(Bottom Band)
342
Bollinger Bands
..........................................................................................................................................................
(Top Band)
342
Bollinger Bands
.......................................................................................................................................................... 343
Buy Position..........................................................................................................................................................
Count
344
Ceiling
.......................................................................................................................................................... 344
Com m odity Channel
..........................................................................................................................................................
Index
345
Cosine
.......................................................................................................................................................... 346
Cross
.......................................................................................................................................................... 346
Cum ulate .......................................................................................................................................................... 348
Day Of Month.......................................................................................................................................................... 348
Day Of Week .......................................................................................................................................................... 349
Detrended Price
..........................................................................................................................................................
Oscillator
349
Error
.......................................................................................................................................................... 350
Event Count .......................................................................................................................................................... 351
Exponent
.......................................................................................................................................................... 354
FAMA
.......................................................................................................................................................... 354
Floor
.......................................................................................................................................................... 355
Fraction
.......................................................................................................................................................... 355
Gap Dow n .......................................................................................................................................................... 356
Gap Up
.......................................................................................................................................................... 356
Highest
.......................................................................................................................................................... 357
Highest Bars..........................................................................................................................................................
Ago
357
Highest High..........................................................................................................................................................
Value
358
Highest High..........................................................................................................................................................
Value Bars Ago
359
Highest Since
.......................................................................................................................................................... 359
Highest Since
..........................................................................................................................................................
Bars Ago
360
Hour
.......................................................................................................................................................... 360
IF()
.......................................................................................................................................................... 360
Inside
.......................................................................................................................................................... 362
Integer
.......................................................................................................................................................... 362
IsDefined .......................................................................................................................................................... 362
IsUndefined .......................................................................................................................................................... 363
Linear Regression
..........................................................................................................................................................
Indicator
363
Linear Regression
..........................................................................................................................................................
Slope
364
Logarithm .......................................................................................................................................................... 364
Low est
.......................................................................................................................................................... 364
Low est Bars..........................................................................................................................................................
Ago
364
Low est Low ..........................................................................................................................................................
Value
365
Low est Low ..........................................................................................................................................................
Value Bars Ago
366
Low est Since
.......................................................................................................................................................... 366
Low est Since
..........................................................................................................................................................
Bars Ago
367
MACD
.......................................................................................................................................................... 367
MAMA
.......................................................................................................................................................... 367
Maxim um .......................................................................................................................................................... 368
© 2011 Visual Trading Systems, LLC
Contents
9
Median Price.......................................................................................................................................................... 368
Midpoint
.......................................................................................................................................................... 369
Minim um
.......................................................................................................................................................... 369
Minute
.......................................................................................................................................................... 369
Modulus
.......................................................................................................................................................... 370
Month
.......................................................................................................................................................... 370
Moving Average
.......................................................................................................................................................... 371
Negative
.......................................................................................................................................................... 371
Outside
.......................................................................................................................................................... 371
Parabolic SAR
.......................................................................................................................................................... 372
Peak Bars .......................................................................................................................................................... 372
Peak Value .......................................................................................................................................................... 373
Position Count
.......................................................................................................................................................... 373
Pow er
.......................................................................................................................................................... 373
Precision .......................................................................................................................................................... 374
Prev
.......................................................................................................................................................... 374
Rally
.......................................................................................................................................................... 376
Random
.......................................................................................................................................................... 376
Rate of Change
.......................................................................................................................................................... 376
Reaction
.......................................................................................................................................................... 377
Reference .......................................................................................................................................................... 377
Relative Strength
..........................................................................................................................................................
Index
379
Round
.......................................................................................................................................................... 379
Sell Position..........................................................................................................................................................
Count
379
Signal Flag .......................................................................................................................................................... 380
Signal Hold .......................................................................................................................................................... 382
Signal Rem ove
.......................................................................................................................................................... 384
Signal Rem ove
..........................................................................................................................................................
Span
387
Sine
.......................................................................................................................................................... 389
Square Root .......................................................................................................................................................... 389
Standard Deviation
.......................................................................................................................................................... 389
Standard Error
.......................................................................................................................................................... 390
Stochastic Mom
..........................................................................................................................................................
entum Index
390
Stochastic Oscillator
.......................................................................................................................................................... 391
Sum m ation .......................................................................................................................................................... 392
Sym bol Digits
.......................................................................................................................................................... 392
Sym bol Point.......................................................................................................................................................... 394
Trough Value.......................................................................................................................................................... 396
Trough Bars .......................................................................................................................................................... 397
Typical Price.......................................................................................................................................................... 397
Ultim ate Oscillator
.......................................................................................................................................................... 397
Value When .......................................................................................................................................................... 398
Vertical Horizontal
..........................................................................................................................................................
Filter
398
Weighted Close
.......................................................................................................................................................... 399
Wilder's Sm oothing
.......................................................................................................................................................... 399
William s' %R.......................................................................................................................................................... 399
Year
.......................................................................................................................................................... 400
Zli
.......................................................................................................................................................... 400
7 Functions
...................................................................................................................................
(Reserved for Future Use)
400
Part VI Technical Indicators
404
1 Aroon
...................................................................................................................................
Indicator
408
2 Aroon
...................................................................................................................................
Oscillator
410
© 2011 Visual Trading Systems, LLC
9
10
VT Trader 2.0 Help Manual
3 Average
...................................................................................................................................
Directional Movement Index (ADX)
412
4 Average
...................................................................................................................................
Directional Movement Index Rating (ADXR)
415
5 Average
...................................................................................................................................
True Range (ATR)
417
6 Balance
...................................................................................................................................
of Power
419
7 Bollinger
...................................................................................................................................
Bands
422
8 Bollinger
...................................................................................................................................
Bands - Fibonacci Ratios
424
9 Bollinger
...................................................................................................................................
Bandwidth
428
10 Bollinger
...................................................................................................................................
Percent B (%b)
432
11 Chaikin's
...................................................................................................................................
Volatility
434
12 Chande's
...................................................................................................................................
Dynamic Momentum Index
436
13 Chande's
...................................................................................................................................
Momentum Oscillator (CMO)
440
14 Chande's
...................................................................................................................................
QStick
442
15 Chande's
...................................................................................................................................
Range Action Verification Index (RAVI)
445
16 Chande's
...................................................................................................................................
TrendScore
446
17 Chande's
...................................................................................................................................
Variable Index Dynamic Average (VIDYA)
448
18 Chaos
...................................................................................................................................
Accelerator Oscillator
450
19 Chaos
...................................................................................................................................
Alligator Indicator
453
20 Chaos
...................................................................................................................................
Awesome Oscillator
456
21 Chaos
...................................................................................................................................
Fractals
459
22 Chaos
...................................................................................................................................
Gator Oscillator
462
23 Choppiness
...................................................................................................................................
Index
465
24 Commodity
...................................................................................................................................
Channel Index (CCI)
467
25 Coppock
...................................................................................................................................
Curve
471
26 Darvas
...................................................................................................................................
Box
473
27 DeMark's
...................................................................................................................................
DeMarker I
475
28 DeMark's
...................................................................................................................................
Projected Range
478
29 DeMark's
...................................................................................................................................
Range Expansion Index (REI)
480
30 Detrended
...................................................................................................................................
Price Oscillator (DPO)
482
31 Directional
...................................................................................................................................
Movement Index
484
32 Directional
...................................................................................................................................
Movement System
486
33 Disparity
...................................................................................................................................
Index
490
34 Donchian
...................................................................................................................................
Channel
492
35 Double
...................................................................................................................................
Exponential Moving Average (DEMA)
494
36 Double
...................................................................................................................................
Stochastic Oscillator
496
37 Ehlers
...................................................................................................................................
Fisher Transform
499
38 Ehlers
...................................................................................................................................
Laguerre Relative Strength Index
502
39 Ehlers
...................................................................................................................................
MESA Adaptive Moving Average (MAMA and FAMA)
504
40 Ehlers
...................................................................................................................................
Relative Vigor Index (RVI)
506
41 Elder-Ray
...................................................................................................................................
Bear Power
509
© 2011 Visual Trading Systems, LLC
Contents
11
42 Elder-Ray
...................................................................................................................................
Bull Power
512
43 Elliot...................................................................................................................................
Oscillator
516
44 Gann
...................................................................................................................................
HiLo Activator
519
45 Gann
...................................................................................................................................
Swing Oscillator
520
46 Gann
...................................................................................................................................
Trend Oscillator
522
47 Hull ...................................................................................................................................
Moving Average (HMA)
525
48 Ichimoku
...................................................................................................................................
Kinko Huo
527
49 Inertia
................................................................................................................................... 531
50 Kase...................................................................................................................................
CD
533
51 Kase...................................................................................................................................
DevStop II
536
52 Kase...................................................................................................................................
Peak Oscillator
538
53 Kaufman's
...................................................................................................................................
Adaptive Moving Average (KAMA)
540
54 Kaufman's
...................................................................................................................................
Efficiency Ratio
543
55 Keltner
...................................................................................................................................
Bands (Based on ATR)
545
56 Keltner
...................................................................................................................................
Channels
548
57 Kurtosis
...................................................................................................................................
Indicator
550
58 Linear
...................................................................................................................................
Regression Acceleration
553
59 Linear
...................................................................................................................................
Regression Indicator
556
60 Linear
...................................................................................................................................
Regression Slope
558
61 MACD
................................................................................................................................... 561
62 MACD-Histogram
................................................................................................................................... 565
63 MACD-Line
................................................................................................................................... 568
64 Mass...................................................................................................................................
Index
571
65 McClellan
...................................................................................................................................
Histogram
574
66 McClellan
...................................................................................................................................
Oscillator
576
67 McClellan
...................................................................................................................................
Summation Index
579
68 McGinley
...................................................................................................................................
Dynamic
581
69 Momentum
................................................................................................................................... 583
70 Moving
...................................................................................................................................
Average
585
71 Moving
...................................................................................................................................
Average Envelope
588
72 Moving
...................................................................................................................................
Averages of RSI
592
73 Moving
...................................................................................................................................
Slope Rate of Change
595
74 Parabolic
...................................................................................................................................
SAR
597
75 Percentage
...................................................................................................................................
Price Oscillator
599
76 Pivot...................................................................................................................................
Points - 24-Hour Cycle
603
77 Pivot...................................................................................................................................
Points - 24-Hour Cycle - Fibonacci Ratios
609
78 Pivot...................................................................................................................................
Points - Monthly Cycle
613
79 Pivot...................................................................................................................................
Points - Monthly Cycle - Fibonacci Ratios
619
80 Pivot...................................................................................................................................
Points - Weekly Cycle
623
© 2011 Visual Trading Systems, LLC
11
12
VT Trader 2.0 Help Manual
81 Pivot...................................................................................................................................
Points - Weekly Cycle - Fibonacci Ratios
629
82 Polarized
...................................................................................................................................
Fractal Efficiency
634
83 Quantitative
...................................................................................................................................
Qualitative Estimation
636
84 Rainbow
...................................................................................................................................
Charts
640
85 Rainbow
...................................................................................................................................
Oscillator
644
86 Rate...................................................................................................................................
of Change (ROC)
648
87 Recursive
...................................................................................................................................
Moving Trend Average
651
88 Relative
...................................................................................................................................
Momentum Index
653
89 Relative
...................................................................................................................................
Strength Index (RSI)
656
90 Relative
...................................................................................................................................
Volatility Index (RVI)
658
91 R-Squared
................................................................................................................................... 661
92 Schaff
...................................................................................................................................
Trend Cycle
664
93 Stochastic
...................................................................................................................................
Momentum Index
666
94 Stochastic
...................................................................................................................................
Oscillator (Fast)
669
95 Stochastic
...................................................................................................................................
Oscillator (Full)
672
96 Stochastic
...................................................................................................................................
Oscillator (Slow)
675
97 Stochastic
...................................................................................................................................
RSI Oscillator
678
98 Stoller
...................................................................................................................................
Average Range Channels (STARC Bands)
682
99 Support
...................................................................................................................................
and Resistance
685
100 T3 Moving
...................................................................................................................................
Average
688
101 Trailing
...................................................................................................................................
Stoploss Levels (Volatility-Based)
690
102 Trailing
...................................................................................................................................
Stoploss Reversal Level
692
103 Trend
...................................................................................................................................
Continuation Factor
695
104 Trend
...................................................................................................................................
Intensity Index (TII)
698
105 Trend
...................................................................................................................................
Oscillator (tosc)
700
106 Trend
...................................................................................................................................
Trigger Factor (TTF)
702
107 Triple
...................................................................................................................................
Exponential Average (TRIX)
704
108 Triple
...................................................................................................................................
Exponential Moving Average (TEMA)
706
109 True...................................................................................................................................
Strength Index
708
110 Ulcer...................................................................................................................................
Index
712
111 Ultimate
...................................................................................................................................
Oscillator
714
112 Volatility
...................................................................................................................................
Quality Index
717
113 Williams
...................................................................................................................................
Percent Range (%R)
719
Part VII Trading Systems
723
1 Aroon
...................................................................................................................................
Oscillator Cross System
727
2 Balance
...................................................................................................................................
of Power Cross System
730
3 Bollinger
...................................................................................................................................
Bands Breakout System
734
4 Bollinger
...................................................................................................................................
Bands Reversal System
738
5 Bull ...................................................................................................................................
/ Bear Heikin-Ashi Candlesticks Reversal System
742
© 2011 Visual Trading Systems, LLC
Contents
13
6 Bull ...................................................................................................................................
/ Bear Japanese Candlesticks Reversal System
745
7 Chande's
...................................................................................................................................
Dynamic Momentum Index Cross System
749
8 Chande's
...................................................................................................................................
Dynamic Momentum Index Reversal System
753
9 Chande's
...................................................................................................................................
QStick Cross System
757
10 Chande's
...................................................................................................................................
Trend Momentum System
761
11 Chande's
...................................................................................................................................
TrendScore Trend Surfing System
765
12 Chande's
...................................................................................................................................
VIDYA Cross System
769
13 Chaos
...................................................................................................................................
Accelerator Oscillator Cross System
773
14 Chaos
...................................................................................................................................
Accelerator Oscillator Reversal System
777
15 Chaos
...................................................................................................................................
Awesome Oscillator / Signal Line Cross System
781
16 Chaos
...................................................................................................................................
Awesome Oscillator / Zero Cross System
785
17 Chaos
...................................................................................................................................
Awesome Oscillator Reversal System
789
18 Chaos
...................................................................................................................................
Fractals Breakout System
793
19 Chaos
...................................................................................................................................
Fractals Reversal System
797
20 Commodity
...................................................................................................................................
Channel Index (CCI) Complex Cross System
801
21 Commodity
...................................................................................................................................
Channel Index (CCI) Cross System
805
22 Commodity
...................................................................................................................................
Channel Index (CCI) Reversal System
809
23 Complex
...................................................................................................................................
Trend System #1 (Fast MA / Slow MA / RSI / MACD)
813
24 Darvas
...................................................................................................................................
Box Breakout System
817
25 Detrended
...................................................................................................................................
Price Oscillator (DPO) Cross System
821
26 Directional
...................................................................................................................................
Movement Index "Extreme Point Rule" System
825
27 Directional
...................................................................................................................................
Movement Index Cross System
829
28 Disparity
...................................................................................................................................
Index Cross System
833
29 Disparity
...................................................................................................................................
Index Reversal System
837
30 Donchian
...................................................................................................................................
Channel Breakout System
841
31 Double
...................................................................................................................................
Exponential Moving Average (DEMA) Cross System
845
32 Double
...................................................................................................................................
Stochastic Oscillator Cross System
849
33 Double
...................................................................................................................................
Stochastic Oscillator Reversal Cross System
852
34 Ehlers
...................................................................................................................................
Fisher Transform Cross System
856
35 Ehlers
...................................................................................................................................
Laguerre Relative Strength Index Cross System
860
36 Ehlers
...................................................................................................................................
Laguerre Relative Strength Index Reversal System
864
37 Ehlers
...................................................................................................................................
MAMA / FAMA Cross System
868
38 Ehlers
...................................................................................................................................
Relative Vigor Index Cross System
871
39 Gann
...................................................................................................................................
Basic "Swing Chartist" System
875
40 Hull ...................................................................................................................................
Moving Average Cross System
879
41 Ichimoku
...................................................................................................................................
Kinko Huo "Strong Signals" System
883
42 Inertia
...................................................................................................................................
Cross System
888
43 Kase...................................................................................................................................
CD Cross System
891
44 Kase...................................................................................................................................
Peak Oscillator Cross System
895
© 2011 Visual Trading Systems, LLC
13
14
VT Trader 2.0 Help Manual
45 Kaufman's
...................................................................................................................................
Adaptive Moving Average (KAMA) Cross System
899
46 Kaufman's
...................................................................................................................................
Efficiency Ratio UpTrend / DownTrend System
903
47 Keltner
...................................................................................................................................
Bands Breakout System
907
48 Keltner
...................................................................................................................................
Bands Reversal System
911
49 Keltner
...................................................................................................................................
Channels Breakout System
915
50 Keltner
...................................................................................................................................
Channels Reversal System
919
51 Kurtosis
...................................................................................................................................
Cross System
923
52 Linear
...................................................................................................................................
Regression Cross System
927
53 Linear
...................................................................................................................................
Regression Reversal System
931
54 Linear
...................................................................................................................................
Regression Slope Cross System
934
55 Linear
...................................................................................................................................
Regression Slope High / Low Breakout System
938
56 Linear
...................................................................................................................................
Regression Slope Tops / Bottoms Reversal System
942
57 MACD
...................................................................................................................................
Fast Line / Signal Line Cross System
946
58 MACD
...................................................................................................................................
Fast Line / Zero Cross System
950
59 MACD
...................................................................................................................................
Histogram High / Low Breakout System
954
60 MACD
...................................................................................................................................
Histogram Tops / Bottoms Reversal System
958
61 McClellan
...................................................................................................................................
Oscillator Cross System
962
62 McClellan
...................................................................................................................................
Summation Index Cross System
966
63 McGinley
...................................................................................................................................
Dynamic Cross System
970
64 Momentum
...................................................................................................................................
Cross System
974
65 Moving
...................................................................................................................................
Average Envelope Breakout System
978
66 Moving
...................................................................................................................................
Average Envelope Reversal System
982
67 Moving
...................................................................................................................................
Averages Cross System
986
68 Moving
...................................................................................................................................
Averages Double Cross System
991
69 Moving
...................................................................................................................................
Slope Rate of Change Cross System
995
70 Parabolic
...................................................................................................................................
SAR Reversal System
999
71 Percentage
...................................................................................................................................
Price Oscillator / Signal Line Cross System
1003
72 Percentage
...................................................................................................................................
Price Oscillator / Zero Cross System
1007
73 Percentage Price Oscillator Histogram High / Low Breakout
System
................................................................................................................................... 1011
74 Percentage Price Oscillator Histogram Tops / Bottoms Reversal
System
................................................................................................................................... 1015
75 Polarized
...................................................................................................................................
Fractal Efficiency Cross System
1019
76 Quantitative
...................................................................................................................................
Qualitative Estimation (QQE) Cross System
1023
77 Rate
...................................................................................................................................
of Change (ROC) Cross System
1029
78 Relative
...................................................................................................................................
Momentum Index Cross System
1032
79 Relative
...................................................................................................................................
Momentum Index Reversal System
1036
80 Relative
...................................................................................................................................
Strength Index (RSI) Cross System
1040
81 Relative
...................................................................................................................................
Strength Index (RSI) Reversal System
1044
82 Relative
...................................................................................................................................
Volatility Index (RVI) Cross System
1048
© 2011 Visual Trading Systems, LLC
Contents
15
83 Relative
...................................................................................................................................
Volatility Index (RVI) Reversal System
1052
84 RSI...................................................................................................................................
Bollinger Bands Breakout System
1056
85 RSI...................................................................................................................................
Bollinger Bands Reversal System
1060
86 RSI...................................................................................................................................
Moving Averages Cross System
1064
87 Schaff
...................................................................................................................................
Trend Cycle Double Reversal System
1070
88 Schaff
...................................................................................................................................
Trend Cycle Reversal System
1073
89 Slow
...................................................................................................................................
Stochastic Oscillator Cross System
1077
90 Slow
...................................................................................................................................
Stochastic Oscillator Reversal Cross System
1080
91 STARC
...................................................................................................................................
Bands Reversal System
1084
92 Stochastic
...................................................................................................................................
Momentum Index Cross System
1088
93 Support
...................................................................................................................................
and Resistance Breakout System
1092
94 T3 Moving
...................................................................................................................................
Average Cross System
1096
95 Trailing
...................................................................................................................................
Stoploss Reversal Level Cross System
1100
96 Trend
...................................................................................................................................
Continuation Factor Cross System
1104
97 Trend
...................................................................................................................................
Continuation Factor Strong Trend System
1108
98 Trend
...................................................................................................................................
Trigger Factor (TTF) Reversal System
1112
99 Triple
...................................................................................................................................
Exponential Average (TRIX) Cross System
1116
100 Triple
...................................................................................................................................
Exponential Moving Average (TEMA) Cross System
1119
101 True
...................................................................................................................................
Strength Index Cross System
1123
102 Ultimate
...................................................................................................................................
Oscillator / Signal Line Cross System
1126
103 Ultimate
...................................................................................................................................
Oscillator Cross System
1130
104 Ultimate
...................................................................................................................................
Oscillator Reversal System
1134
105 Williams
...................................................................................................................................
Percent Range (%R) Cross System
1138
106 Williams
...................................................................................................................................
Percent Range (%R) Reversal System
1142
Part VIII Automated Trading FAQ for Trading
Systems
1148
Part IX Requesting Orders and Supported Order
Types
1153
Part X "How To" Tutorials
1158
1 How
...................................................................................................................................
To Build An Indicator
1158
2 How
...................................................................................................................................
To Build A Trading System
1167
Index
1184
© 2011 Visual Trading Systems, LLC
15
Getting Started with VT Trader 2.0
Part
I
Getting Started with VT Trader 2.0
1
17
Getting Started with VT Trader 2.0
Thank you for your interest in VT Trader, a world-class electronic FOREX trading platform brought to you
Capital Market Services, LLC and Visual Trading Systems, LLC. Please take a few moments to
thoroughly read through this entire help manual to better familiarize yourself with the VT Trader software.
This manual (released in May 2011) is a guide for the use of VT Trader 2.0's interface, features, and
functionality. It is up-to-date with the most current VT Trader 2.0 release version. It is best viewed with a
screen resolution of 1280 pixels or wider.
1.1
PC System Requirements
For VT Trader 2.0 to function properly the following guidelines should be followed:
Minimum System Requirements:
Microsoft Windows XP (or Windows Vista or Windows 7) operating system
Intel® CoreTM 2 Duo e4300 1.80 GHz processor (or equivalent processor)
1.0 gigabyte of RAM
200 megabytes of free hard disk space
Internet Explorer 5.0 (or higher)
Monitor that supports 1024x768 with a color depth of 32 bits (16,777,216 colors) or higher resolution
A high-speed (broadband) Internet connection such as DSL or a cable modem is vital for online
currency trading
Recommended System Requirements:
Microsoft Windows XP (or Windows Vista or Windows 7) operating system
Intel® CoreTM 2 Duo e6600 2.4 GHz (or faster) processor (or equivalent processor)
2.0+ gigabytes of RAM
200+ megabytes of free hard disk space
Internet Explorer 6.0 (or higher)
Monitor that supports 1024x768 with a color depth of 32 bits (16,777,216 colors) or higher resolution
A high-speed (broadband) Internet connection such as DSL or a cable modem is vital for online
currency trading
1.2
How to intall VT Trader...
To install VT Trader on your computer you must first download the VT Trader executable file to your
computer's hard drive. Then, run the executable file by double-clicking it with the left mouse button.
Follow the on-screen instructions to complete the installation; you may click the [Cancel] button at any
time to abort the installation process
© 2011 Visual Trading Systems, LLC
18
VT Trader 2.0 Help Manual
Before choosing your installation options, you must agree to the End User License Agreement. Please
read through the agreement and then select the radio button next to, "I accept the terms of the License
Agreement" to proceed.
© 2011 Visual Trading Systems, LLC
Getting Started with VT Trader 2.0
19
Click the [Next >] button to proceed. Choose the type of installation you want to perform for VT Trader
2.0. You can choose to a Standalone installation or a Portable installation.
The Standalone installation distributes VT Trader's files into 2 directory structures - a read-only program
files directory and an additional Data directory. The standalone installation also creates a VT Trader
desktop shortcut and VT Trader Start Menu program group. The read-only program files typically install
to C:\Program Files\VT Trader\ (or C:\Program Files (x86)\VT Trader\ if you're using a 64-bit Windows
operating system). You can change this installation directory in the next step of installation process if
you choose to. The additional Data directory installs under the Users directory tree.
In Windows® XP variants, the Data directory installs to:
C:\Documents and Settings\<Windows User Account Name>\My Documents\VTSystems\VT
Trader\<Unique # Generated By VT Trader>
In Windows® Vista and Windows® 7 variants, the Data directory installs to:
C:\Users\<Windows User Account Name>\Documents\VTSystems\VT Trader\<Unique # Generated
By VT Trader>
Note: In order to utilize VT Trader 2 as a COM server, you must choose a Standalone installation.
The Portable installation distributes VT Trader's files into only 1 directory. It will not install a VT Trader
desktop shortcut or Start Menu program group, will not affect the registry, and can be uninstalled by
simply deleting its directory. You can create a Portable installation at any location on your hard drive or
even on a removable USB drive. However, your Windows user account must have read and write file
privileges to the installation location you choose in order for VT Trader to function properly. By default, a
Portable installation of VT Trader will create its directory on your Windows Desktop. You can change
© 2011 Visual Trading Systems, LLC
20
VT Trader 2.0 Help Manual
this installation directory in the next step of installation process if you choose to.
Click the [Next >] button to proceed. Choose an installation location for VT Trader. If the default
Destination Folder is acceptable then change nothing. If you want to change the Destination Folder you
can do so by clicking the [Browse...] button and selecting an alternate install location.
© 2011 Visual Trading Systems, LLC
Getting Started with VT Trader 2.0
21
Click the [Next >] button to proceed. If you chose the Portable installation type, [Next >] copies the VT
Trader files onto your computer's hard drive. If you chose the Standalone installation type, choose the
Start Menu Folder.
© 2011 Visual Trading Systems, LLC
22
VT Trader 2.0 Help Manual
If you chose the Standalone installation type, click the [Install] button to copy the VT Trader files onto
your computer's hard drive.
© 2011 Visual Trading Systems, LLC
Getting Started with VT Trader 2.0
23
Click the [Finish] button to complete the installation process.
1.3
How to login to VT Trader...
Once VT Trader has been properly installed 17 , it can be launched by double-clicking the VT Trader
desktop icon with the left mouse button or by selecting the VT Trader link from the VT Trader program
group in the Windows Start Menu.
VT Trader checks for updates and prompts you to install any new updates if a new version is available. If
an update is available you can install the update, choose to skip it and install it at a later time, or
choose not to install it at all and to not be notified about it again. However, if the available update is
required you will not be able to access your trading account until you install the update.
Next, the Login window is shown. Type your Login and Password. Choose the type of account to login
to from the Account Type selection menu.
The following command buttons are all available at different times during the login process:
[OK]
This command continues the login process by verifying the current VT Trader version, login name,
© 2011 Visual Trading Systems, LLC
24
VT Trader 2.0 Help Manual
and password to connect you to your broker's trading and charting services. VT Trader's interface
will load in a few moments if the login is successful.
[Work Offline]
The command loads VT Trader's interface without connecting to your broker's services. In this
Offline mode of operation your account and trading-related data will not be accessible, no
connections to the broker's services are active, and no trading actions can be conducted. Only
instruments and chart intervals previously opened in VT Trader while it was connected to the broker's
charting service will be cached and available for viewing in Offline mode.
[Exit]
This command cancels the login process and shuts down VT Trader.
If the login process fails or is canceled, the following buttons become available:
[Retry]
This command returns you to the Login window.
[Cancel]
This command Immediately stops the login process.
© 2011 Visual Trading Systems, LLC
VT Trader 2.0's Interface
Part
II
26
2
VT Trader 2.0 Help Manual
VT Trader 2.0's Interface
Fluent User Interface
The Fluent user interface (UI) makes finding VT Trader's commands easier than ever before by better
organizing them based on the common tasks you are most likely to perform while using VT Trader. The
Fluent UI includes the Ribbon, the VT Trader Button, and the Quick Access Toolbar.
The Ribbon is the wide band running across the top of the main VT Trader program window which
contains the majority of VT Trader's commands. The common tasks are divided up into tabs according to
the types of commands they represent. The tabs are then further divided into groups of related
commands. The VT Trader Button and the Quick Access Toolbar are located in the upper, left corner
of VT Trader's main program window providing you with convenient access to a few of the most
commonly used commands in VT Trader.
Please click on these links to learn more about the Fluent
and the Quick Access Toolbar 55 .
30
UI Ribbon
30
, VT Trader Button
54
,
"Docked" Windows Concept
VT Trader 2.0's intuitive docking approach allows windows to be docked into simple or complex
configurations or remain as separate windows. This new functionality allows you to create an almost
infinite number of "docked" and "floating" window arrangements which can be conveniently saved as
Desk top Work spaces.
However, unlike most traditional docking interfaces, VT Trader's interface shows dock ing zone selectors
as a window is being moved indicating every possible location that the active window can be docked to
inside VT Trader's main docking site. You can dock any window to any side of any other window - top,
bottom, left, or right. Windows can even be "docked" together in the same location to create tabbed
panels.
Docked windows also have special caption buttons and contextual menus available allowing you to autohide windows(s), "undock" windows, maximize windows within their docking panel, quickly locate and
make tabs active, and reposition the tabs in a tabbed panel. To make working with your Desk top
Work space(s) even easier, "floating" windows have their own Windows Taskbar buttons; this allows you
to quickly and easily minimize any "floating" window(s) you do not wish to remain visible while working in
VT Trader's main program window and restore them only when necessary.
Please click here
27
to learn more about how VT Trader 2.0's docking concepts works.
Task Windows
VT Trader's UI is centered around the use of task windows. The general purpose of these windows is to
provide you with up-to-the-second, real-time account information, trading information, alerts, news
events, and important announcements. The main task windows have been divided into groups based on
the type(s) of general task(s) they help you perform.
© 2011 Visual Trading Systems, LLC
VT Trader 2.0's Interface
Please click here
73
27
to learn more about each of the task windows included in VT Trader.
Main Program Window Status Bar and VT Notification Icon
VT Trader 2.0's UI also includes a new Status Bar shown across the bottom of the main program
window and a dedicated VT Trader Notification Icon shown in the Windows operating system's
Notification Area (the area in the task bar where the computer's local time is shown).
Please click on these links to learn more about the Status Bar
2.1
58
and VT Notification Icon
58
.
Docking - How it works...
As mentioned in the interface introduction, VT Trader 2 uses a sophisticated and intuitive "docking"
concept to create Desk top Work spaces. You simply drag a window to the desired location, which can
be a docking site or another window, and drop it there.
Dock ing zone selectors are shown as a window is being moved indicating every possible location that
the active window can be docked to. You can dock any window inside the platform's main docking site
and/or to any side of any other window - top, bottom, left, or right. Windows can even be docked
together in the same location to create tabbed panels.
While dragging, the highlighted dock ing zone indicates the location that the window will have when
released. A hint window specifying the target location is also shown. Note: Pressing and holding down
the Ctrl key while dragging the window will prevent it from docking when released; this lets you easily
© 2011 Visual Trading Systems, LLC
28
VT Trader 2.0 Help Manual
move windows around without accidentally docking them.
Docked windows, tabbed panels, and window tabs have some special contextual menus and caption
buttons allowing you to further customize the arrangement of your Desk top Work spaces.
Docked windows have a special contextual menu that is activated by clicking the right mouse button
while the cursor is positioned over the window's caption bar. You can Hide (i.e. close) or Undock the
window from this menu. It is also possible to quickly undock a window by simply double-clicking the left
mouse button while the cursor is positioned over the window's caption bar; the newly "floating" window
can then be quickly docked back into its original location by following the same procedure. Additionally,
depending on the window's location within the main docking site, you may also be able to Restore,
Maximize, or Auto-Hide the window.
Auto-Hiding a window means that only its window caption will be visible in a tab along one of the sides of
the main docking site. Only windows that are docked to the main docking site or in a tabbed panel that
is docked to the main docking site can be auto-hidden. Window that can be auto-hidden will have an
additional Auto-Hide button shaped like a pushpin in their caption bar and the Auto-Hide option in their
caption bar's contextual menu.
© 2011 Visual Trading Systems, LLC
VT Trader 2.0's Interface
29
Tabbed panels have a special Switch Tabs caption button at their top-right corner that looks like an
upside-down triangle; it shows a selection menu of the windows currently located in the tabbed panel.
Selecting a window from the Switch Tabs selection menu makes the window in that tab visible.
Window Tabs located in a tabbed panel also have a special contextual menu that is activated by clicking
the right mouse button while the cursor is positioned over the tab's caption. You can Hide (i.e. close) the
active tab, choose a different tab from the Tabs submenu, or reposition the window tabs at the Top or
Bottom of the tabbed panel. You can also rearrange the order of the tabs in a tabbed panel by
positioning the cursor over the tab's caption, clicking (and holding down) the left mouse button, and
dragging the tab to its new location.
© 2011 Visual Trading Systems, LLC
30
VT Trader 2.0 Help Manual
Along with "docked' windows, you can also have "floating" windows in your Desk top Work spaces.
"Floating" windows look and function just like ordinary application windows; they have their own Minimize
, Maximize, and Close caption buttons. However, "floating" windows also have their own Windows
Taskbar buttons. Thanks to this added functionality, you can quickly and easily minimize any "floating"
window(s) you do not wish to remain visible while working in VT Trader's main program window and
restore them only when necessary.
2.2
Fluent UI Ribbon
The Ribbon is the wide band (which can be minimized using the Quick Access Toolbar's contextual
menu 55 ) running across the top of VT Trader's main application window. It contains the majority of VT
Trader's commands. The common tasks are divided up into tabs according to the types of commands
they represent. The tabs are then further divided into groups of related commands.
The Fluent UI Ribbon is divided into the following menu tabs:
Environment Menu
The Environment menu contains all of the commands that affects VT Trader's overall "look and feel"
© 2011 Visual Trading Systems, LLC
VT Trader 2.0's Interface
31
and general functionality. Click on the group's name to learn more about its commands. The groups
included in this menu are:
Desktop Workspaces
Windows 33
Client Files 34
Options 34
33
My Account Menu
The My Account menu contains commands that are related to your trading account. Click on the
group's name to learn more about its commands. The groups included in this menu are:
Account Actions 35
Account Summary 36
Reports 36
Trading Menu
The Trading Terminal menu will likely be one of your most commonly used menus. It contains all of
the commands that will help you while you are performing trading actions. Click on the group's name to
learn more about its commands. The groups included in this menu are:
Place New Order(s) 37
Close 38
Dealing Rates 38
Trading Windows 39
Messages 39
Trading Tools 40
Alerts Menu
You can create and modify price alerts using the commands in the Alerts menu. Click on the group's
name to learn more about its commands. The groups included in this menu are:
Price Alerts
40
Chart Menu
You can quickly and easily open new charts or manipulate the active chart using the commands
provided in the Chart menu. Click on the group's name to learn more about its commands. The groups
included in this menu are:
Open Chart 41
Chart Templates
© 2011 Visual Trading Systems, LLC
41
32
VT Trader 2.0 Help Manual
Active Chart 42
Show/Hide 43
Zoom 44
Axes 45
Print 46
Technical Analysis Menu
While analyzing charts, you may rely on various tools to assist you in the analysis process. The
Technical Analysis menu provides you convenient access to all of VT Trader's technical analysis tools
including (but not limited to): data inspection, chart patterns, symbols, lines, channels, shapes,
Fibonacci, Gann, 100+ commonly used indicators, and 100+ basic trading systems. You can also
create your own custom indicators and trading systems using VT Trader's two specially-designed
"builder" tools. Click on the group's name to learn more about its commands. The groups included in this
menu are:
Analysis Tools 46
Drawing Tools 47
Indicators 49
Trading Systems 50
Fundamental Analysis Menu
You can keep up-to-date with real-time streaming news, Forex market highlights, as well as
accompanying market experts' commentary by using the resources provided in the Fundamental
menu. Click on the group's name to learn more about its commands. The groups included in this menu
are:
News 51
Forex Resources
51
Help Menu
The Help menu provides you with access to VT Trader's help materials, troubleshooting tools, and
version information. It also allows you to communicate directly with your broker's dealing support
department and customer service department via chat. Click on the group's name to learn more about its
commands. The groups included in this menu are:
Support Resources
Troubleshooting 52
Contact Us 53
Version 53
52
© 2011 Visual Trading Systems, LLC
VT Trader 2.0's Interface
2.2.1
Environment Tab
2.2.1.1
Desktop Workspaces Group
33
The Desktop Workspaces group contains the following commands:
Save
Saving the active desktop workspace preserves the location and configuration of windows (including
"floating" windows) and any custom properties, drawing tools, indicators, and trading systems
attached to open chart windows.
Save As...
This command saves the active desktop workspace as a new file. The location and configuration of
windows (including "floating" windows) and any custom properties, drawing tools, indicators, and
trading systems attached to open chart windows are saved. Desktop workspace files are saved into
VT Trader's Data -> Desk tops folder. All available desktop workspaces are shown in the Switch
command's selection menu.
Switch
You can load (view) any of your saved desktop workspaces by using the Switch command's
selection menu.
Manage Desktop Workspaces
This command opens the Desktop Workspaces Management window. Please click here 150 to
learn more about the Desktop Workspaces Management window.
2.2.1.2
Windows Group
The Windows group contains the following commands:
Switch Windows
© 2011 Visual Trading Systems, LLC
34
VT Trader 2.0 Help Manual
All of the application's open windows are shown in this command's selection menu. Choosing a
window makes it the active window. If the chosen window was hidden behind other windows or
minimized it will be brought to the front.
Close All Windows
This command closes all of the application's open windows.
2.2.1.3
Client Files Group
The Client Files group contains the following commands:
Import Environment
You can select any combination of items to import from a previously created VT Trader environment
archive (.vtenv file extension) using the Import Environment command. You can import: Options
(User Preferences), Desk top Work spaces, Chart Templates, Custom Indicators, and Custom
Trading Systems. You can choose to Ignore, Rename, or Replace duplicate files during the import
process.
Export Environment
You can select any combination of items to export to an existing (or new) VT Trader environment
archive (.vtenv file extension) using the Export Environment command. You can export: Options
(User Preferences), Desk top Work spaces, Chart Templates, Custom Indicators, and Custom
Trading Systems.
2.2.1.4
Options Group
The Options group contains the following commands:
Skin
© 2011 Visual Trading Systems, LLC
VT Trader 2.0's Interface
35
This command contains a selection menu that includes all skins available for use by VT Trader. The
active (in use) skin's name is shown. Choosing a different skin changes the appearance of VT
Trader's interface.
Language
This command contains a selection menu that includes all available languages supported by VT
Trader. The active (in use) language is shown. Choosing a different language changes the language
throughout VT Trader's interface.
Options
You can open the Options window using this command. Please click here
the Options window.
2.2.2
My Account Tab
2.2.2.1
Account Actions Group
59
to learn more about
The Account Actions group contains the following commands:
Login
This command is only enabled if there is currently no connection to your broker's services (for
example, if you are work ing in Offline Mode).
Logout
This command disconnects you from your broker's services and shifts VT Trader into Offline mode.
While Offline, your account and trading-related data will not be accessible, no connections to the
broker's services are active, and no trading actions can be conducted. Only instruments and chart
intervals previously opened in VT Trader while it was connected to the broker's charting service will
be cached and available for viewing in Offline mode.
Change Password...
This command allows you to change the password that is assigned to your account.
Fund Your Account
If you are logged into a live trading account, this command opens a new Internet browser window
with instructions for adding and withdrawing funds from your account. However, if you are logged into
© 2011 Visual Trading Systems, LLC
36
VT Trader 2.0 Help Manual
a practice trading account this command opens a new Internet browser window that provides you
with an application to request a live trading account from your broker.
2.2.2.2
Account Summary Group
The Account Summary group contains the following commands:
Account Profile
This command opens a new Internet browser window showing Forex.com's MyAccount website
section. You can review your account summary information, account profile, various detailed
account/trading reports, access Forex.com's market research resources, and much more.
Account Information
This command opens the Account Information window. Please click here
the Account Information window.
74
to learn more about
Currency Portfolio
This command opens the Currency Portfolio window. Please click here
the Currency Portfolio window.
2.2.2.3
80
to learn more about
Reports Group
Each report opens a new Internet browser window Forex.com's MyAccount website Reports section
showing that report's detailed information. Reports can be exported to Microsoft Excel or printed for your
convenience.
The Reports group contains the following commands:
Account Summary
This report provides the current account balance as well as all deposits, withdrawals, interest
earned, and fees charged (if any) for any selected month.
© 2011 Visual Trading Systems, LLC
VT Trader 2.0's Interface
37
Transaction History
This report provides complete trade details for any selected date range, including the deal date/time,
instrument, trade direction (buy or sell), contract size, and executed deal rate.
Open Positions
This report provides a summary of all open positions, including contract size, USD value, average
rate of open positions, current market rate, and unrealized profit/loss.
Order History
This report provides details of all order activity for a selected data range, including the order entry
date/time, its reference number, and any action details for the order.
Rollover History
This report provides rollover details for any transaction held open past 17:00 EST for any selected
date range, including the rollover date, rollover rate, and USD value.
Realized Profit/Loss
This report provides complete trade details with profit/loss for any selected date range, including the
deal date/time, instrument, trade direction (buy or sell), contract size, and executed deal rate.
2.2.3
Trading Tab
2.2.3.1
Place New Orders(s) Group
The Place New Order(s) group contains the following commands:
Buy Market Order
This command requests a Buy market order at the instrument's current Ask price.
Sell Market Order
This command requests a Sell market order at the instrument's current Bid price.
Conditional Buy
© 2011 Visual Trading Systems, LLC
38
VT Trader 2.0 Help Manual
This command is a selection menu that includes a submenu with five commands: Entry Stop, Entry
Limit, One Cancels Other (OCO), If/Then, and If/Then OCO. Entry Stop requests an Entry Stop
Buy order. Entry Limit requests and Entry Limit Buy order. One Cancels Other (OCO) requests a
One Cancels Other (OCO) order with Buy order bias. If/Then requests an If/Then order with Buy
order bias. If/Then OCO requests an If/Then OCO order with Buy order bias.
Conditional Sell
This command is a selection menu that includes a submenu with five commands: Entry Stop, Entry
Limit, One Cancels Other (OCO), If/Then, and If/Then OCO. Entry Stop requests an Entry Stop
Sell order. Entry Limit requests and Entry Limit Sell order. One Cancels Other (OCO) requests a
One Cancels Other (OCO) order with Sell order bias. If/Then requests an If/Then order with Sell
order bias. If/Then OCO requests an If/Then OCO order with Sell order bias.
2.2.3.2
Close Group
The Close group contains the following commands:
Close All Positions
This command closes all of the account's open positions at the instruments' current market prices.
Remove All Orders
This command cancels (removes) all of the account's orders.
2.2.3.3
Dealing Rates Group
The Dealing Rates group contains the following commands:
Quotes Board
This command opens the Quotes Board window. Please click here
Quotes Board window.
89
to learn more about the
Advanced Rates
© 2011 Visual Trading Systems, LLC
VT Trader 2.0's Interface
This command opens the Advanced Rates window. Please click here
Advanced Rates window.
2.2.3.4
94
39
to learn more about the
Trading Windows Group
The Trading Windows group contains the following commands:
Open Positions
This command opens the Open Positions window. Please click here 101 to learn more about the
Open Positions window.
Pending Orders
This command opens the Pending Orders window. Please click here 108 to learn more about the
Pending Orders window.
2.2.3.5
Messages Group
The Messages group contains the following commands:
Trading Activity
This command opens the Trading Activity window. Please click here 174 to learn more about the
Trading Activity window.
Trading Log
This command opens the Trading Log window. Please click here 114 to learn more about the
Trading Log window.
© 2011 Visual Trading Systems, LLC
40
2.2.3.6
VT Trader 2.0 Help Manual
Trading Tools Group
The Trading Tools group contains the following commands:
Currency Calculator
This command opens a Currency Calculator tool. The Currency Calculator allows you to convert
an amount of one currency into the value of another currency. Please click here 120 to learn more
about the Currency Calculator tool.
Pip Calculator
This command opens the Pip Calculator tool. The Pip Calculator allows you to calculate the value
of 1 pip respective to the selected currency pair. Please click here 120 to learn more about the Pip
Calculator tool.
2.2.4
Alerts Tab
2.2.4.1
Price Alerts Group
The Price Alerts group contains the following commands:
New
This command opens the Price Alert window. Please click here 179 to learn more about the Price
Alert window.
Active Price Alerts Summary
This command opens the Active Price Alerts Summary window. Please click here 180 to learn
more about the Active Price Alerts Summary window.
© 2011 Visual Trading Systems, LLC
VT Trader 2.0's Interface
2.2.5
Chart Tab
2.2.5.1
Open Chart Group
41
The Open Chart group contains the following commands:
Open Chart
This command contains a selection menu that includes all of the instruments available in VT Trader.
You can quickly open a new chart window by choosing your desired instrument. The new chart
opens based on your settings for the Chart Interval and Chart Type options in the Options window ->
General section -> Miscellaneous subsection.
Recently Viewed
This command contains a selection menu that includes your ten mostly recently viewed charts. You
can quickly reopen one of these charts by choosing your desired chart.
Clone Chart
You can quickly create a new, duplicate chart window of the active chart window by using the Clone
Chart command.
2.2.5.2
Chart Templates Group
The Chart Templates group contains the following commands:
Manage Chart Templates
This command opens the Chart Templates Management window. Please click here 152 to learn
more about the Chart Templates Management window.
Load...
© 2011 Visual Trading Systems, LLC
42
VT Trader 2.0 Help Manual
You can load (apply) any of your saved chart templates to the active chart window by using the
Load... command's selection menu.
Save As...
This command saves the active chart window's properties configuration as a new chart template 152
file. All properties included in the Chart Properties 131 window are included in the chart template.
Once saved, the new chart template is shown in the Load... command's selection menu. Chart
template files are saved into VT Trader's Data -> ChartTemplates folder.
2.2.5.3
Active Chart Group
The Active Chart group contains the following commands:
Instrument
This command contains a selection menu that includes all of the trading instruments available in VT
Trader. You can change the chart window's current instrument by choosing your desired instrument
from the selection menu.
Interval
This command contains a selection menu that includes all of the chart intervals available for use in
the chart window. You can change chart window's current interval by choosing your desired interval
from the selection menu. The following chart intervals are currently available in VT Trader:
Tick (each incoming price is a "tick "; a "tick " is the smallest possible interval)
1-Minute
5-Minute
10-Minute
15-Minute
30-Minute
1-Hour
2-hour
4-Hour
Daily (each new day starts at 5:00 PM ET)
Weekly (each new week starts at 12:00 AM (00:00) ET on Monday)
Monthly
Bid/Ask
A trading instrument typically have two possible prices at any given time - its bid price and its ask
© 2011 Visual Trading Systems, LLC
VT Trader 2.0's Interface
43
price (a.k .a. the bid/offer spread, bid/ask spread, or buy/sell spread). You sell at the bid price and
you buy at the ask price. An instrument's chart is constructed using either its bid or ask prices; this
command lets you choose that bias.
Type
This command contains a selection menu that includes all of the types of charts available for use in
the chart window. You can change the chart window's current chart type by choosing your desired
type from the selection menu. The following chart types are currently available in VT Trader:
Japanese Candlesticks (Filled)
Japanese Candlesticks (Hollow)
Heikin-Ashi Candlesticks
Bars (O/H/L/C)
Bars
Line
Point and Figure
Renko
2.2.5.4
Show/Hide Group
The Show/Hide group contains the following commands:
Cross Hair
This command is a toggle button. It shows or hides the Cross Hair in the active chart window.
Please click here 240 to learn more about the Cross Hair tool.
Grid Lines
This command is a toggle button. It shows or hides the Grid Lines in the active chart window.
Quotes Panel
This command is a toggle button. It shows or hides the Quotes Panel in the active chart window.
Auto-Scroll
This command is a toggle button. It enables or disables the Auto-Scroll to Current Time property of
the active chart window. While enabled, the active chart window will always automatically move the
chart's price data to the instrument's most recent incoming price tick. Disabling this property allows
you to easily perform technical analysis throughout the instrument's historical price data without the
© 2011 Visual Trading Systems, LLC
44
VT Trader 2.0 Help Manual
chart automatically returning to the most recent price tick.
High/Low Zone
This command contains a selection menu that includes all of the High/Low Zone choices available
for use in the active chart window. The choices in the list will vary depending on the active chart's
interval; only intervals larger than the active chart's interval are available to that chart window. The
High/Low Zone's boundaries are defined by the High/Low Zone selections in the chart's (or chart
template's) properties.You can quickly change (or hide) the current High/Low Zone used in the active
chart by choosing your desired High/Low Zone from the selection menu.
Chart Layers
This command contains a selection menu that includes all of the Chart Layers it is possible to use
in the active chart window. You can change a layer's visibility and/or its brightness by choosing it
from the selection menu. Any object(s) attached to the active chart window that are part of the
chosen layer will be affected by these changes. For example, if you draw 3 trend lines in the chart
window, choose the Trend Lines layer, and remove the visibility option's check mark, all 3 trend
lines will be hidden from view; to restore them, you must re-enable that layer's visibility option.
2.2.5.5
Zoom Group
The Zoom group contains the following commands:
X-Axis Zoom In
You can increase the horizontal (left-to-right) size of the active chart window's data using this
command.
X-Axis Zoom Out
You can decrease the horizontal (left-to-right) size of the active chart window's data using this
command.
Y-Axis Zoom In
You can increase the vertical (top-to-bottom) size of the active chart window's data using this
command.
Y-Axis Zoom Out
You can decrease the vertical (top-to-bottom) size of the active chart window's data using this
© 2011 Visual Trading Systems, LLC
VT Trader 2.0's Interface
45
command.
Area Zoom
This command allows you to define a rectangular portion of the active chart window using the cursor
to automatically zoom in on. The portion of the active chart window within your rectangular selection
area will be magnified to fill the entire viewable area of the chart window.
Undo Zoom
You can undo the most recent action performed with any of the zooming commands by using this
command.
2.2.5.6
Axes Group
The Axes group contains the following commands:
Auto-Size Y-Axis
This command is a toggle button. It enables or disables the Auto-Size Y-Axis property of the active
chart window. While enabled, the active chart window automatically resizes its price data (and
indicator data, if available) so it is shown with the highest high price (or indicator value) and lowest
low price (or indicator value) at the respective top and bottom of the viewable chart area based on
the Auto-Size Y-Axis Min/Max Bounds option's selection in the Chart Properties 131 window (or Chart
Template Properties window, if the chart window has an assigned chart template). Please click here
131 to learn more about the Auto-Size Y-Axis Min/Max Bounds option. Disabling the Auto-Size YAxis property allows you to manually control the scaling (sizing) of the data in the viewable area of
the chart window using the Zoom commands, the Y-Axis's drag-and-drop zooming functionality, or
the Y-Axis's Scale Settings.
Reset X-Axis
You can quickly restore the X-Axis's zoom level back to its default value using this command.
Reset Y-Axis
You can quickly restore the Y-Axis's zoom level back to its default value using this command.
© 2011 Visual Trading Systems, LLC
46
VT Trader 2.0 Help Manual
Reset Axes
You can quickly restore the X-Axis's zoom level and the Y-Axis's zoom level back to their default
values using this command.
2.2.5.7
Print Group
The Print group contains the following commands:
Print
You can print the active chart window by using this command.
Preview
You can view a preview of what the active chart window will like when it is printed by using this
command.
Print Setup...
This command opens the Windows operating system's Print Setup dialog window. You can choose
the printer you want to print with along with the type of paper and paper orientation.
Page Setup...
This command opens VT Trader's Page Setup window. The Page Setup window defines the
document setup and color properties for printing the active chart.
2.2.6
Technical Analysis Tab
2.2.6.1
Analysis Tools Group
© 2011 Visual Trading Systems, LLC
VT Trader 2.0's Interface
47
The Analysis Tools group contains the following commands:
Selection Tool
You can use this command to return the cursor to its default arrow pointer cursor type after using
one or more drawing tools while the Auto-Switch to Select Drawing Tool option is disabled.
Data Inspection
This command opens the Data Inspection window. Please click here 154 to learn more about the
Data Inspection window.
Copy Prices
This command contains a selection menu with two options: Select by Date Range and Select Entire
Date Range. Please click here 241 to learn more about the Copy Prices tool.
2.2.6.2
Drawing Tools Group
The Drawing Tools group contains the following commands:
Comments
This command activates the Comments tool. Please click here 243 to learn more about the
Comments tool.
Symbols
This command activates the Symbols tool. Please click here 246 to learn more about the Symbols
tool.
Lines
This command contains a selection menu that includes all of the line tools currently available for use
in the chart window. The line tools included in this command's selection menu are:
Trend Line 256
Trend Line By Angle 259
Vertical Line 250
Horizontal Line 253
Regression Line 263
© 2011 Visual Trading Systems, LLC
48
VT Trader 2.0 Help Manual
Channels
This command contains a selection menu that includes all of the channel tools currently available for
use in the chart window. The channel tools included in this command's selection menu are:
Standard Deviation Channel 265
Standard Error Channel 269
Raff Regression Channel 272
Equidistant Channel 276
Andrew's Pitchfork 279
Shapes
This command contains a selection menu that includes all of the shape tools currently available for
use in the chart window. The shape tools included in this command's selection menu are:
Ellipse 282
Rectangle 286
Triangle 290
Fibonacci
This command contains a selection menu that includes all of the Fibonacci tools currently available
for use in the chart window. The Fibonacci tools included in this command's selection menu are:
Fibonacci
Fibonacci
Fibonacci
Fibonacci
Fibonacci
Fibonacci
Retracement 293
Expansion 297
Time Extension 301
Channel 305
Fan 309
Arc 313
Gann
This command contains a selection menu that includes all of the Gann tools currently available for
use in the chart window. The Gann tools included in this command's selection menu are:
Gann Line 317
Gann Fan 321
Gann Grid 324
Delete
You can delete one or more selected tools from the active chart window by using the Delete
command.
© 2011 Visual Trading Systems, LLC
VT Trader 2.0's Interface
2.2.6.3
49
Indicators Group
The Indicators group contains the following commands:
Indicators Builder
This command opens the Indicators Builder tool. Please click here 182 to learn more about the
Indicators Builder.
Add Indicator...
This command opens the Add Indicator window. You can review categorized lists of indicators,
choose an indicator from one of the lists, review its description, and add it to the chart using the
Add Indicator window.
Indicators Quick List
This command includes a selection menu. The Indicators Quick List can be likened to your
"Favorites" in Internet Explorer or your "Bookmarks" in Mozilla Firefox. You can configure the
Indicators Quick List to include only the indicators that you use most frequently or desire to have
easily available. You may need to configure your Indicators Quick List before it best fits your
needs. Configure Quick List is the first item included in the selection menu. Please click here 235 to
learn more about configuring your Indicator Quick List.
Attached Indicators
This command opens the Attached Indicators window. You can review a summary listing of
indicators currently attached to the active chart window, add additional indicators to the chart,
change the properties of any attached indicator, and delete attached indicators using the Attached
Indicators window. The Attached Indicators window also allows you to directly edit an indicator by
opening it in an Indicator Editor window. Please click here 184 to learn more about editing
indicators using an Indicator Editor window.
© 2011 Visual Trading Systems, LLC
50
2.2.6.4
VT Trader 2.0 Help Manual
Trading Systems Group
The Trading Systems group contains the following commands:
Trading Systems Builder
This command opens the Trading Systems Builder tool. Please click here 205 to learn more about
the Trading Systems Builder.
Add Trading System...
This command opens the Add Trading System window. You can review categorized lists of trading
systems, choose a trading system from one of the lists, review its description, and add it to the
chart using the Add Trading System window.
Trading Systems Quick List
This command includes a selection menu. The Trading Systems Quick List can be likened to your
"Favorites" in Internet Explorer or your "Bookmarks" in Mozilla Firefox. You can configure the
Trading Systems Quick List to include only the trading systems that you use most frequently or
desire to have easily available. You may need to configure your Trading Systems Quick List before
it best fits your needs. Configure Quick List is the first item included in the selection menu. Please
click here 236 to learn more about configuring your Trading Systems Quick List.
Attached Trading Systems
This command opens the Attached Trading Systems window. You can review a summary listing of
trading systems currently attached to the active chart window, add additional trading systems to the
chart, change the properties of any attached trading system, enable or disable Auto-Trading mode
for any attached trading system, and delete attached trading systems using the Attached Trading
Systems window. The Attached Trading Systems window also allows you to directly edit a trading
system by opening it in a Trading System Editor window. Please click here 207 to learn more
about editing trading systems using a Trading System Editor window.
Active Trading Systems Summary
This command opens an Active Trading Systems Summary window that looks and functions
similarly to the Attached Trading Systems window. However, this command's Active Trading
Systems Summary window provides you with a summary list of trading systems currently attached
to every open chart in VT Trader. You can change the properties of any attached trading system,
enable or disable Auto-Trading mode for any attached trading system, and delete attached trading
systems using the Active Trading Systems Summary window. The Active Trading Systems
Summary window also allows you to directly edit a trading system by opening it in a Trading
System Editor window. Please click here 207 to learn more about editing trading systems using a
Trading System Editor window.
© 2011 Visual Trading Systems, LLC
VT Trader 2.0's Interface
2.2.7
Fundamental Analysis Tab
2.2.7.1
News Group
51
The News group contains the following commands:
Dow Jones News
This command opens the Dow Jones News window. Please click here 166 to learn more about the
Dow Jones News window.
Market Commentaries
This command opens the Market Commentaries window. Please click here 161 to learn more about
the Market Commentaries window.
2.2.7.2
Forex Resources Group
The Forex Resources group contains the following commands:
Economic Calendar
This command opens the Economic Calendar window. Please click here 172 to learn more about
the Economic Calendar window.
© 2011 Visual Trading Systems, LLC
52
VT Trader 2.0 Help Manual
2.2.8
Help Tab
2.2.8.1
Support Resources Group
The Support Resources group contains the following commands:
Reference Guide
The VT Trader reference guide is available in 3 formats: Windows Help (.chm file extension),
Portable Document Format (PDF) (.pdf file extension), and Internet-based (no download required; it
can be read online using your Internet browser). This command opens the online version of VT
Trader's comprehensive reference guide. The reference guides are searchable by their table of
contents, index, and even by keyword(s). If you want to print a copy of the reference guide you
should use the PDF format; however, printing is not advisable since the reference guide is very
lengthy and updated frequently.
Video Tutorials
This command opens a new Internet browser window that provides you with links to some VT Trader
Video Tutorials.
Online Forums
This command opens a new Internet browser window that provides you with access to the Online
Support Forums for VT Trader. Note: These support forums are not for reporting issues related to
your (or others') broker(s), trading experiences, order-related questions/concerns/claims, or in any
way not directly related to the functionality of VT Trader and its features.
2.2.8.2
Troubleshooting Group
The Troubleshooting group contains the following commands:
Delete All Chart History
© 2011 Visual Trading Systems, LLC
VT Trader 2.0's Interface
53
This command deletes all of the historical chart data saved into VT Trader's Cache -> HistoryCache
folder. This command is useful when you need to force VT Trader to download fresh historical data
for your charts. For example, in the event that VT Trader caches historical chart data that contains
one or more bad ticks, you can use this command to forcefully delete that cached data so that you
can later download fresh historical data without the bad tick(s) once your broker has corrected the
data in their charting service.
2.2.8.3
Contact Us Group
The Contact Us group contains the following commands:
Chart with Dealing Support
This command opens a real-time chat window for direct communication with your broker's dealing
support personnel.
Chat with Customer Support
This command opens a real-time chat window for direct communication with your broker's customer
service personnel.
2.2.8.4
Version Group
The Version group contains the following commands:
© 2011 Visual Trading Systems, LLC
54
VT Trader 2.0 Help Manual
About
This command opens a splash screen that includes VT Trader's current version information. You can
click once with the left mouse button while the cursor is positioned anywhere within the About
splash screen to close it.
2.3
VT Trader Button
The VT Trader Button includes a few of the most commonly used commands in VT Trader. It is located
in the upper, left corner of VT Trader's main program window.
The VT Trader Button contains the following commands:
Login
This command is only enabled if there is currently no connection to your broker's services (for
example, if you are work ing in Offline mode).
Logout
© 2011 Visual Trading Systems, LLC
VT Trader 2.0's Interface
55
This command disconnects you from your broker's services and transitions VT Trader into Offline
mode. While Offline, your account and trading-related data will not be accessible, no connections to
the broker's services are active, and no trading actions can be conducted. Only instruments and
chart intervals previously opened in VT Trader while it was connected to the broker's charting service
will be cached and available for viewing in Offline mode.
Change Password...
This command changes your account's password.
Import Environment
You can select any combination of items to import from a previously created VT Trader environment
archive (.vtenv file extension) using the Import Environment command. You can import: Options
(User Preferences), Desk top Work spaces, Chart Templates, Custom Indicators, and Custom
Trading Systems. You can choose to Ignore, Rename, or Replace duplicate files during the import
process.
Export Environment
You can select any combination of items to export to an existing (or new) VT Trader environment
archive (.vtenv file extension) using the Export Environment command. You can export: Options
(User Preferences), Desk top Work spaces, Chart Templates, Custom Indicators, and Custom
Trading Systems.
Options
This command opens the Options window. Please click here
window.
59
to learn more about the Options
Exit
This command exits (shuts down) VT Trader. Upon exit, the connection to the broker's services is
disconnected and (if selected) all of the changes made to the active desktop workspace are
automatically saved. The state of any trading system(s) left running in Auto-Trade Mode is also
saved.
2.4
Quick Access Toolbar
The Quick Access Toolbar includes some of the most commonly used commands in VT Trader. It is
located in the upper, left corner of VT Trader's main program window directly to the right of the VT
Trader Button.
© 2011 Visual Trading Systems, LLC
56
VT Trader 2.0 Help Manual
However, the Quick Access Toolbar can be relocated into its own panel directly below the Fluent UI
Ribbon by using the Show Quick Access Toolbar Below the Ribbon command in its contextual menu.
The Quick Access Toolbar's contextual menu can be activated by clicking the left mouse button once
while the cursor is positioned over the upside down triangle graphic at the far right end of the toolbar.
From the contextual menu, it is not yet possible to fully customize the Quick Access Toolbar, but you
can show or hide the commands included in it.
You can also, and perhaps most importantly, minimize the Fluent UI Ribbon using the Quick Access
Toolbar's contextual menu. While the Ribbon is minimized, only its main menu tabs are visible;
clicking on a menu tab temporarily shows its grouped commands.
From...
To...
© 2011 Visual Trading Systems, LLC
VT Trader 2.0's Interface
57
The Quick Access Toolbar contains the following commands in its default arrangement:
Login
This command is only enabled if there is currently no connection to your broker's services (for
example, if you are work ing in Offline Mode).
Logout
This command disconnects you from your broker's services and transitions VT Trader into Offline
mode. While Offline, your account and trading-related data will not be accessible, no connections to
the broker's services are active, and no trading actions can be conducted. Only instruments and
chart intervals previously opened in VT Trader while it was connected to the broker's charting service
will be cached and available for viewing in Offline mode.
Switch Desktop Workspace
You can load (view) any of your saved desktop workspaces by using the Switch command's
selection menu.
Open New Chart
This command contains a selection menu that includes all of the instruments available in VT Trader.
You can quickly open a new chart window by choosing your desired instrument. The new chart
opens based on your settings for the Chart Interval and Chart Type options in the Options window ->
General section -> Miscellaneous section -> New Chart Defaults section.
Switch Windows
All of the application's open windows are shown in this command's selection menu. Choosing a
window makes it the active window. If the chosen window was hidden behind other windows or
minimized it will be brought to the front.
Options
This command opens the Options window. Please click here
window.
59
to learn more about the Options
Reference Guide
The VT Trader reference guide is available in 3 formats: Windows Help (.chm file extension),
Portable Document Format (PDF) (.pdf file extension), and Internet-based (no download required; it
can be read online using your Internet browser). This command opens the online version of VT
Trader's comprehensive reference guide. The reference guides are searchable by their table of
contents, index, and even by keyword(s). If you want to print a copy of the reference guide you
should use the PDF format; however, printing is not advisable since the reference guide is very
lengthy and updated frequently.
About
© 2011 Visual Trading Systems, LLC
58
VT Trader 2.0 Help Manual
This command opens a splash screen that includes VT Trader's current version information. You can
click once with the left mouse button while the cursor is positioned anywhere within the About
splash screen to close it.
2.5
VT Trader Status Bar
The Status Bar is the small band running across the bottom of the main VT Trader program window. It
contains VT Trader's version information and current date/time. It also contains an icon that allows you
to quickly and easily enable or disable all of VT Trader's sounds.
2.6
VT Trader Notification Icon
The VT Trader Notification Icon is located in the Notification Area at the bottom, right corner of the
Windows taskbar. When you move the mouse cursor over the VT Trader Notification Icon it shows the
name of the broker's service that you are currently connected to. Positioning the mouse cursor over top
of the notification icon and double-clicking the left mouse button will restore VT Trader if it's minimized.
If there is one or more trading systems running in Auto-Trade mode in VT Trader the VT Trader
Notification Icon will show a green, flashing circular LED over top of the icon.
If VT Trader is currently disconnected from your broker's services and running in Offline mode the VT
Trader Notification Icon will show a red, flashing circular LED over top of the icon.
The icon's contextual menu can be opened by clicking the right mouse button while the cursor is
hovering over the VT Notification Icon. This menu allows quick, one-click access to VT Trader's online
support materials, version information, and for exiting the platform.
© 2011 Visual Trading Systems, LLC
VT Trader 2.0's Interface
2.7
59
Options (User Preferences)
The Options window defines all of VT Trader's main application options and connection parameters. It is
divided into the following sections:
General
The General section contains all of the options that affect VT Trader "as a whole". Click on the
subsection's name to learn more about its options. The subsections included in this section are:
Instruments 60
Trading 62
Desktop Workspaces
Print Page Setup 66
Miscellaneous 68
64
Communication
The Communication section contains all of the options that affect VT Trader "as a whole". Click on the
subsection's name to learn more about its options. The subsections included in this section are:
Common
70
Sounds
The Sounds section defines all of the sounds used by VT Trader each time the sound's corresponding
action is performed. Each action can be assigned a standard VT Trader sound or a custom sound of
your choosing (.mp3, .wav, or .wma file formats are acceptable). The actions that can be associated
with sounds are:
General
Startup
Alert
Reconnection
Disconnection
© 2011 Visual Trading Systems, LLC
60
VT Trader 2.0 Help Manual
Incoming News Headline
Error
Margin Call
Insufficient Funds
Requote Request
Position
Open
Close
Entry Stop Buy Order
Place
Remove
Change
Entry Stop Sell Order
Place
Remove
Change
Entry Limit Buy Order
Place
Remove
Change
Entry Limit Sell Order
Place
Remove
Change
Stop Order
Place
Remove
Change
Limit Order
Place
Remove
Change
2.7.1
General
2.7.1.1
Instruments
The Instruments subsection includes only 1 group: Instruments. The Instruments subsection contains
a list of all of the trading instruments made available to you by your broker. The [^] and [v] buttons
define the order the instruments are shown in throughout VT Trader's interface in menus and windows
that do not specifically allow for column sorting by instrument
© 2011 Visual Trading Systems, LLC
VT Trader 2.0's Interface
61
Instruments Group
The Instruments list contains the following options:
Visibility
This option Shows (enables) or Hides (disables) the instrument. You will not receive price updates
for hidden instruments, you cannot perform trading actions against hidden instruments, nor will
hidden instruments be shown anywhere in VT Trader's interface.
Lots (T)
This option defines the default number of lots that is used when requesting buy or sell market orders
for the instrument. This option also applies to the 1-Click Orders (1CO) trading mode.
Lots (O)
This option defines the default number of lots that is used when requesting entry orders for the
© 2011 Visual Trading Systems, LLC
62
VT Trader 2.0 Help Manual
instrument.
Pips
This option defines the default number of pips away from the current market price used when
requesting entry orders for the instrument. This options does not apply to entry orders requested at
a specific price using an instrument's chart window.
Margin
This option defines the maximum leverage ratio for the instrument. It is a read-only value and cannot
be changed.
2.7.1.2
Trading
The Trading subsection is divided into three groups: Trading, Suggested Stop Rate, and Trading
Disclaimers.
© 2011 Visual Trading Systems, LLC
VT Trader 2.0's Interface
63
Trading Group
The Trading group contains the following options:
Trading Mode
This option defines how market orders are requested. It is a selection menu with two choices: Order
Request(s) Window and 1-Click Orders (1CO).
Order Request(s) Window
This is the standard trading mode. An order request(s) window opens and you must review the order
information before submission.
1-Click Orders (1CO)
Use this trading mode with caution! Market orders are submitted IMMEDIATELY. You will not have
the opportunity to review or confirm the order information. For your safety, this trading mode imposes
© 2011 Visual Trading Systems, LLC
64
VT Trader 2.0 Help Manual
a 2-second mouse click delay between duplicate order requests. Any additional (duplicate) order
request(s) attempted during the 2-second delay period will be ignored.
Rate Format
This option defines how an instrument's "fractional pip" digit (a.k .a. "pipette") is shown throughout
VT Trader's interface. You can hide the fractional pip digit or you can show it appended to the rest of
the digits, in parentheses, or in brackets.
Time Zone
This option defines what time zone is used throughout VT Trader's interface when referencing dates
and times.
Order Confirmations
This option Shows or Hides the Request for Confirmation dialog window that is normally shown when
you submit one or more orders. The Request for Confirmation dialog window gives you an additional
chance to recheck your order information before submission.
Trading Disclaimers Group
The Trading Disclaimers group contains the following options:
Indicator Orders
This option Shows or Hides the disclaimer window that is normally shown each time you submit an
indicator order. If the disclaimer window is shown, you must click [I Agree] to proceed.
1-Click Orders
This option Shows or Hides the disclaimer window that is normally shown each time you choose the
1-Click Orders (1CO) Trading Mode. If the disclaimer window is shown, you must click [I Agree] to
use the 1-Click Orders trading mode.
Trading Systems
This option Shows or Hides the disclaimer window that is normally shown each time you attach a
trading system to a chart. If the disclaimer window is shown, you must click [I Agree] to proceed.
2.7.1.3
Desktop Workspaces
The Desktop Workspaces subsection is divided into two groups: Previous Versions and Auto-Save
Options.
© 2011 Visual Trading Systems, LLC
VT Trader 2.0's Interface
65
Previous Versions Group
The Previous Versions group contains the following options:
Max # of Previous Versions
VT Trader automatically creates previous version backup files of the active desktop workspace. This
option defines the maximum number of previous versions that VT Trader maintains. All previous
versions created of any desktop workspaces are saved into VT Trader's Data -> Desk tops ->
Back ups folder.
Auto-Save Periodicity (in minutes)
This option defines how frequently (in minutes) VT Trader automatically saves the current state of
the active desktop workspace.
© 2011 Visual Trading Systems, LLC
66
VT Trader 2.0 Help Manual
Auto-Save Options Group
The Auto-Save Options group contains the following options:
Auto-Save on Platform Exit
While Yes is chosen, the active desktop workspace is automatically saved when you exit VT Trader.
VT Trader will not automatically save the active desktop workspace (layout template) when you exit
VT Trader if the broker's charting service is unavailable; this helps ensure that you will not lose your
previous chart setups and associated technical analysis to an automatic save when the chart(s)
cannot be loaded.
Auto-Save on Switching Workspaces
While Yes is chosen, the active desktop workspace is automatically saved when you switch to
another desktop workspace.
Auto-Save on Account Login
While Yes is chosen, the active desktop workspace is automatically saved when you use the
Account Login option to login to your account from working in Offline mode.
2.7.1.4
Print Page Setup
The Print Page Setup subsection is divided into two groups: Print Page Setup and Margins.
© 2011 Visual Trading Systems, LLC
VT Trader 2.0's Interface
67
Print Page Setup Group
The Print Page Setup group contains the following options:
Title Font
This option defines the font attributes of the page title used when printing charts. You can change its
font attributes by using the [...] button.
Print Colors
This option defines if charts will be printed in Black and White or Full Color.
Margins Group
The Margins group contains the following options:
© 2011 Visual Trading Systems, LLC
68
VT Trader 2.0 Help Manual
Units
This option defines the type of measurement units used for the document's page margins. It is a
selection menu with two choices: Centimeters and Inches.
Top
This option defines the document's top page margin for printed charts.
Bottom
This option defines the document's bottom page margin for printed charts.
Left
This option defines the document's left page margin for printed charts.
Right
This option defines the document's right page margin for printed charts.
2.7.1.5
Miscellaneous
The Miscellaneous subsection is divided into two groups: New Chart Defaults and Miscellaneous.
© 2011 Visual Trading Systems, LLC
VT Trader 2.0's Interface
69
New Chart Defaults Group
The New Chart Defaults group contains the following options:
Chart Interval
This option defines the chart interval used for any new chart window being opened.
Chart Type
This option defines the chart type used for any new chart window being opened.
Max # of Bars
This option defines the number of price bars downloaded from your broker's charting service and
loaded into every open chart window each time VT Trader is started. The minimum amount of price
history that can be loaded is 100 price bars; the maximum number that can be loaded is 5,000 price
bars. Changes made to this option's value are applied only after the next time VT Trader is started.
© 2011 Visual Trading Systems, LLC
70
VT Trader 2.0 Help Manual
Miscellaneous Group
The Miscellaneous group contains the following options:
Auto-Switch to Selection Tool
This option is a selection menu with two choices: Yes and No. While Yes is chosen, the mouse
cursor will automatically switch back to the Selection Tool after you have used one of the other
drawing tools in a chart window. While No is chosen, the mouse cursor will remain as the selected
drawing tool 239 after being chosen (for example, the Fibonacci Fan); you'll be able to use the same
drawing tool 239 on the chart several times in succession without the need to reselect it each time
you want to use it.
Dynamic Data Exchange (DDE)
This option is a selection menu with two choices: Enabled and Disabled. While enabled, you will be
able to use the sample DDE.xls file distributed with VT Trader. Changes made to this option's value
are applied only after the next time VT Trader is started. VT Trader must remain open and connected
to your brokers services while you are using DDE commands.
Show Trading System Alerts
This option defines in which window the any active trading systems show their message alerts. It is
a selection menu with two choices: In Trading Systems Alerts Window and In Trading Activity
Window. While In Trading Activity Window is chosen, message alerts generated by active trading
systems are shown in the Trading Activity 174 window. While In Trading Systems Alerts Window is
chosen, message alerts generated by active trading systems are shown in the Trading Systems
Alerts window.
Max # of Environment Auto-Backups
VT Trader automatically creates environment backup files each time you start the platform. This
option defines the maximum number of environment backup archives that VT Trader maintains. The
environment backup archives created include all client files just as if you were creating an
environment file for export using the Export Environment 34 command with all options selected. All
environment backup archives created are saved into VT Trader's Data -> StartupBack ups folder.
System Tray Pop-Up Messages
This option is a selection menu with two choices: Show and Hide. While Show is chosen, VT Trader
shows messages (price alerts, drawing tools' alerts, and trading systems' alerts) in small pop-up
windows that appear at the bottom, right side of your computer monitor.
2.7.2
Communication
2.7.2.1
Common
The Common subsection includes only 1 group: Common.
© 2011 Visual Trading Systems, LLC
VT Trader 2.0's Interface
71
Common Group
The Common group contains the following options:
Price Updates Frequency
This option defines the speed that VT Trader receives price updates for the available trading
instruments. It is a selection menu with several choices ranging from Real-Time to 5 seconds.
While Real-Time is chosen, VT Trader receives price updates as frequently as the broker's service
broadcasts those prices (which could be up to several times per second). While any other selection
is chosen, VT Trader receives price updates from the broker's service at that respective interval.
© 2011 Visual Trading Systems, LLC
Task Windows
Part
III
Task Windows
3
73
Task Windows
VT Trader's user interface is centered around the use of task windows. The general purpose of these
windows is to provide you with up-to-the-second, real-time account information, trading information,
alerts, news events, and important announcements. The main task windows have been divided into
groups based on the type(s) of general task(s) they help you perform. To learn more about each of the
task windows, please click on their names below:
Account(s) Summary
Account Information Status Bar
Account Information 74
Currency Portfolio 80
Reports 89
79
Dealing Rates
Quotes Board 89
Advanced Rates 94
Trading
Open Positions 101
Pending Orders 108
Trading Activity 114
Trading Tools
Currency Calculator 120
Pip Calculator 120
Desktop Workspaces
Desktop Workspaces Management 150
Chart Window
Chart Window 121
Chart Templates Management 152
Technical (Chart) Analysis
Data (Chart) Inspection 154
Fundamental Analysis
Dow Jones News 166
Market Commentaries 161
Economic Calendar 172
Alerts
© 2011 Visual Trading Systems, LLC
74
VT Trader 2.0 Help Manual
New Alert... 179
Active Price Alerts Summary 180
Alerts Activity 174
Trading Systems Alerts
Technical Indicators and Trading Systems
Indicators Builder 182
Indicators Quick List (Configuration) 235
Attached Indicators
Trading Systems Builder 205
Trading Systems Quick List (Configuration) 236
Attached Trading Systems
Active Trading Systems Summary 181
3.1
Accounts Summary
3.1.1
Account Information
The Account Information window provides you with an overview of your account(s)'s status. The
Account Information window's contextual menu 76 provides you with additional account-specific
functionality as well as access to the window's properties 77 .
Explanations of Account Information Data
Account
Account is the name associated with the trading account. It is typically specified by the account's
owner while completing the broker's customer agreement.
Balance
Balance is the sum of all deposits, interest income and realized gains less all withdrawals, realized
losses and incidental fees.
© 2011 Visual Trading Systems, LLC
Task Windows
75
Realized P/L
Realized Profit/Loss is the sum of all gains and losses on positions that have been closed out at
the end of the trading day (17:00 ET).
Unrealized P/L
Unrealized Profit/Loss is the gains and losses of all open positions, calculated at the current
market rate(s).
Equity (a.k.a. Margin Balance)
Equity (or Margin Balance) is the Account Balance plus all current Realized P/L and
Unrealized P/L.
Total Lots Open
Total Lots Open is the cumulative sum of lots open in the account.
Total Amount Open
Total Amount Open is the cumulative sum of currency units open in the account respective to the
total number of lots open.
Appearance Customizations
Each column of data in the Account Information window can be automatically (or manually) resized,
moved, or hidden at your discretion.
To automatically resize one or more columns, position the cursor over any column caption and click the
right mouse button. You may select Size Column to Fit or Size All Columns to Fit from the contextual
menu depending on the action you want to perform.
To manually resize a column, you must click and hold down the left mouse button while the cursor is
positioned over the column divider directly to the right of the column you want to resize. The cursor will
change and appear similar to this: <-|->. While the left mouse button is held down, move the mouse to
the left or right to resize the column.
It is also possible to change the location of each column respective to the other visible columns. Moving
a column can be accomplished by dragging and dropping the desired column into its new location after
© 2011 Visual Trading Systems, LLC
76
VT Trader 2.0 Help Manual
clicking and holding down the left mouse button while the cursor is positioned over that column's
caption (Information, Value).
To hide one or more columns, position the cursor over any column caption and click the right mouse
button. Select any column from the contextual menu that you want to hide. Visible columns have a
check mark next to their caption name while hidden columns do not. To show a hidden column you
simply need to reselect it from the column caption's contextual menu.
You can further customize the appearance of the window and its data by using the window's properties
77 .
Contextual Menu
The Account Information window's contextual menu 76 provides you with additional functionality and
access to the window's properties 77 . To activate the contextual menu 76 , click the right mouse button
while the cursor is positioned over any account's row.
3.1.1.1
Contextual Menu
The Account Information window's contextual menu provides you with additional functionality and
access to the window's properties 77 . To activate the contextual menu, click the right mouse button
while the cursor is positioned over any account-related row.
© 2011 Visual Trading Systems, LLC
Task Windows
77
The Account Information window's contextual menu contains the following commands:
Reports
This command is a selection menu that includes a submenu with several different report types. Each
report opens in a new Internet browser window. Please click here to learn more about the available
reports.
Close All Positions
This command closes all of the account's open positions at the instruments' current market prices.
Remove All Orders
This command cancels (removes) all of the account's orders.
Convert To
This command dynamically converts the account's Balance, Realized P/L, Unrealized P/L, and
Equity into another currency using current market prices.
Properties
This command opens the Account Information properties
77
window.
Restore Default
This command resets any custom properties currently used in the Account Information window
back to their default values.
3.1.1.2
Properties
The Account Information properties window is divided into two sections: Appearance and Colors.
Appearance Section
© 2011 Visual Trading Systems, LLC
78
VT Trader 2.0 Help Manual
The Appearance section contains the following options:
Caption Font
This option defines the font attributes used for window's column captions. You can change the font
attributes by using the [...] button.
Data Font
This option defines the font attributes used for the the data shown in the window. You can change
the font attributes by using the [...] button.
Colors Section
© 2011 Visual Trading Systems, LLC
Task Windows
79
The Colors section contains the following options:
Selection Highlight
This option defines the color the selected row in the window. You can change the color by using the
[...] button.
Background (Odd Row)
This option defines the background color of all odd-numbered rows in the window. You can change
the color by using the [...] button.
Background (Even Row)
This option defines the background color of all even-numbered rows in the window. You can change
the color by using the [...] button.
3.1.2
Account Information Status Bar
The Account Information status bar provides you with an overview of your account's funds.
© 2011 Visual Trading Systems, LLC
80
VT Trader 2.0 Help Manual
Explanations of Account Information Status Bar Data
Account Balance
Account Balance is the sum of all deposits, interest income and realized gains less all
withdrawals, realized losses and incidental fees.
Realized P/L
Realized Profit/Loss is the sum of all gains and losses on positions that have been closed out at
the end of the trading day (17:00 ET).
Unrealized P/L
Unrealized Profit/Loss is the gains and losses of all open positions, calculated at the current
market rate(s).
Equity (a.k.a. Margin Balance)
Equity (or Margin Balance) is the Account Balance plus all current Realized P/L and
Unrealized P/L.
3.1.3
Currency Portfolio Window
The Currency Portfolio window provides you with per currency lot exposure statistics. The Currency
Portfolio window shows the data in a visually appealing, easy-to-understand bar graph (chart) format.
© 2011 Visual Trading Systems, LLC
Task Windows
81
Explanations of Currency Portfolio Data
Currency
The Currency is one of the two currencies in a currency pair (for example, in EUR/USD currency
pair, EUR is one currency and USD is the other).
Total Buy Lots
Total Buy Lots is the cumulative total number of lots in all open Buy positions in the currency.
Total Sell Lots
Total Sell Lots is the cumulative total number of lots in all open Sell positions in the currency.
Net Exposure
Net Exposure is the cumulative total number of lots in all open Buy positions in the currency minus
the cumulative total number of lots in all open Sell positions in the currency.
Appearance Customizations
You can customize the appearance of the window and its data by using the window's properties
Contextual Menu
© 2011 Visual Trading Systems, LLC
83
.
82
VT Trader 2.0 Help Manual
The Currency Portfolio window's contextual menu 82 provides you with additional functionality and
access to the window's properties 83 . To activate the contextual menu 82 , click the right mouse button
while the cursor is positioned over any part of the bar graph.
3.1.3.1
Contextual Menu
The Currency Portfolio window's contextual menu provides you with additional functionality and access
to the window's properties 83 . To activate the contextual menu, click the right mouse button while the
cursor is positioned over any part of the bar graph.
© 2011 Visual Trading Systems, LLC
Task Windows
83
The Currency Portfolio window's contextual menu contains the following commands:
Selected Accounts, All Accounts, Select Account(s)...
You can change the data that is calculated in this window by using these menu commands. All
Accounts includes data from all of your accounts. Selected Accounts includes data only from those
accounts that have check marks next to them in the Account(s) Information window. Select
Account(s) shows a dialog window that includes a full list of your accounts. Enabling or disabling
accounts from this dialog window enables or disables those accounts in the Account(s)
Information window.
Properties
This command opens the Currency Portfolio properties
83
window.
Restore Default
This command resets any custom properties currently used in the Currency Portfolio window back
to their default values.
3.1.3.2
Properties
The Currency Portfolio properties window is divided into four sections: Show/Hide, Colors, Fonts,
and Indents.
© 2011 Visual Trading Systems, LLC
84
VT Trader 2.0 Help Manual
Show/Hide Section
The Show/Hide section shows or hides the graph's elements.
The Show/Hide section contains the following options:
Captions
This option Shows or Hides the graph's axes captions.
Axes Values
This option Shows or Hides the graph's axes data values (i.e. lot values and instruments).
Total Buy Lots
This option Shows or Hides the graph's Total Buy Lots bars.
Total Sell Lots
This option Shows or Hides the graph's Total Sell Lots bars.
Net Exposure
© 2011 Visual Trading Systems, LLC
Task Windows
85
This option Shows or Hides the graph's Net Exposure bars.
Data Values
This option Shows or Hides the data values that correspond to each of the graph's bars.
Legend
This option Shows or Hides the graph's Legend.
Colors Section
The Colors section defines the colors of the graph's elements.
The Colors section contains the following options:
Total Buy Lots
This option defines the color of the graph's Total Buy Lots bars. You can change the color by using
the [...] button.
© 2011 Visual Trading Systems, LLC
86
VT Trader 2.0 Help Manual
Total Sell Lots
This option defines the color of the graph's Total Sell Lots bars. You can change the color by using
the [...] button.
Net Exposure
This option defines the color of the graph's Net Exposure bars. You can change the color by using
the [...] button.
Window
This option defines the background color of the graph's window. You can change its color by using
the [...] button.
Graph
This option defines the background color of the graph. You can change its color by using the [...]
button.
Grid Lines
This option defines the color of the graph's grid lines. You can change their color by using the [...]
button.
Fonts Section
The Fonts section defines the font attributes used by the graph's text elements.
© 2011 Visual Trading Systems, LLC
Task Windows
87
The Fonts section contains the following options:
Captions
This option defines font attributes for the graph's captions. You can change their font attributes by
using the [...] button.
Data
This option defines font attributes for the data values that correspond to each of the graph's bars.
You can change their font attributes by using the [...] button.
Axes
This option defines font attributes for the graph's axes values. You can change their font attributes
by using the [...] button.
Legend
This option defines font attributes for the graph's legend. You can change its font attributes by using
the [...] button.
© 2011 Visual Trading Systems, LLC
88
VT Trader 2.0 Help Manual
Indents Section
The Indents section defines the spacing between the bar graph and the window's edges.
The Indents section contains the following options:
Left
This option defines the graph's left window margin.
Top
This option defines the graph's top window margin.
Right
This option defines the graph's right window margin.
Bottom
This option defines the graph's bottom window margin.
© 2011 Visual Trading Systems, LLC
Task Windows
3.1.4
89
Reports
Each report opens a new Internet browser window Forex.com's MyAccount website Reports section
showing that report's detailed information. Reports can be exported to Microsoft Excel or printed for your
convenience. A description of each report is provided below:
Account Summary
This report provides the current account balance as well as all deposits, withdrawals, interest
earned, and fees charged (if any) for any selected month.
Transaction History
This report provides complete trade details for any selected date range, including the deal date/time,
instrument, trade direction (buy or sell), contract size, and executed deal rate.
Open Positions
This report provides a summary of all open positions, including contract size, USD value, average
rate of open positions, current market rate, and unrealized profit/loss.
Order History
This report provides details of all order activity for a selected data range, including the order entry
date/time, its reference number, and any action details for the order.
Rollover History
This report provides rollover details for any transaction held open past 17:00 EST for any selected
date range, including the rollover date, rollover rate, and USD value.
Realized Profit/Loss
This report provides complete trade details with profit/loss for any selected date range, including the
deal date/time, instrument, trade direction (buy or sell), contract size, and executed deal rate.
3.2
Dealing Rates
3.2.1
Quotes Board Window
The Quotes Board window contains several individual Instrument Panels. Each panel provides you
with a unique overview of that instrument's associated market data. Please click here 90 to learn more
about the Instrument Panels and their contextual menus.
© 2011 Visual Trading Systems, LLC
90
VT Trader 2.0 Help Manual
Appearance Customizations
The instrument panels in the Quotes Board window can be resized by using the Panel Size command
in an instrument panel's contextual menu 92 . Instrument panels can be rearranged at your discretion by
using the [^] and [v] buttons in the Instruments 60 subsection of the Options window.
3.2.1.1
Instrument Panel
Each Instrument Panel in the Quotes Board window provides you with a unique overview of that
instrument's associated market data.
You can create new price alerts and conduct trading actions on any of the available Instruments. Buy
and Sell market orders can be requested by positioning the cursor over the Instrument panel's Bid (Sell)
or Ask (Buy) buttons and clicking the left mouse button. These orders will be requested using the
Trading Mode defined in VT Trader's Options window. You can also request Buy and Sell market
orders, Entry Stop Buy, Entry Limit Buy, Entry Stop Sell, and Entry Limit Sell entry orders, as well as
© 2011 Visual Trading Systems, LLC
Task Windows
One Cancels Other (OCO), If/Then, and If/Then OCO orders by using the panel's contextual menu
91
97
.
Explanations of Instrument Panel Data
Instrument
The Instrument (i.e. currency pairs, CFDs, stock s, indices, etc.) on which trading actions can be
conducted is shown in the upper, left corner of the Instrument Panel. Each time an instrument's
prices are updated, its caption area is highlighted.
Trading Mode Icon
The small icon located between the Instrument and the Time is the Trading Mode icon. This icon
shows the current Trading Mode defined in VT Trader's Options window.
Time
Time is the most recent time that the instrument's price has changed.
Bid (Sell) and Ask (Buy)
The Bid is the price at which you can sell the instrument. The Ask is the price at which you can buy
the instrument. The instrument's prices change as soon as the smallest movement of prices in the
market for the instrument has occurred. When an instrument's Bid/Ask are updated, that
instrument's Bid and Ask buttons change colors. If the new price is higher than the previous price,
the Bid/Ask buttons turn blue; if the new price is lower than the previous price, the Bid/Ask buttons
turn red.
Spread
The small button located between Low and High shows the Spread. An instrument's spread is the
difference between its Ask price and its Bid price. Spread = Ask - Bid. The spread is determined by
your broker. As a general rule the spread typically remains static, but it can change depending on
the volatility in the market. Your broker determines if the spread they offer remains static or changes
dynamically with market volatility.
Low
The lowest Bid price attained by the instrument within the current day is the Low. Each day is
typically started at 5:00 PM ET, however, you should verify the daily rollover time with your broker.
High
The highest Ask price attained by the instrument within the current day is the High. Each day is
typically started at 5:00 PM ET, however, you should verify the daily rollover time with your broker.
Contextual Menu
Each instrument panel's contextual menu
© 2011 Visual Trading Systems, LLC
97
provides you with additional functionality. To activate an
92
VT Trader 2.0 Help Manual
instrument panel's contextual menu
the panel.
97
, click the right mouse button while the cursor is positioned over
3.2.1.1.1 Contextual Menu
Each Instrument Panel's contextual menu provides you with additional functionality. To activate an
Instrument Panel's contextual menu, click the right mouse button while the cursor is positioned over
the panel.
Each Instrument Panel's contextual menu contains the following commands:
Buy
This command requests a Buy market order at the instrument's current Ask price.
Sell
This command requests a Sell market order at the instrument's current Bid price.
Conditional Buy
© 2011 Visual Trading Systems, LLC
Task Windows
93
This command is a selection menu that includes a submenu with five commands: Entry Stop, Entry
Limit, One Cancels Other (OCO), If/Then, and If/Then OCO. Entry Stop requests an Entry Stop
Buy order. Entry Limit requests and Entry Limit Buy order. One Cancels Other (OCO) requests a
One Cancels Other (OCO) order with Buy order bias. If/Then requests an If/Then order with Buy
order bias. If/Then OCO requests an If/Then OCO order with Buy order bias.
Conditional Sell
This command is a selection menu that includes a submenu with five commands: Entry Stop, Entry
Limit, One Cancels Other (OCO), If/Then, and If/Then OCO. Entry Stop requests an Entry Stop
Sell order. Entry Limit requests and Entry Limit Sell order. One Cancels Other (OCO) requests a
One Cancels Other (OCO) order with Sell order bias. If/Then requests an If/Then order with Sell
order bias. If/Then OCO requests an If/Then OCO order with Sell order bias.
New Price Alert
This command opens the Price Alert 179 window.
Open Chart
This command opens a new chart window for that instrument.
Detach
This command is only available if the contextual menu is activated while the instrument panel is
attached to the Quotes Board window. It actually creates an additional, duplicate instrument panel
that is detached from VT Trader's main program window.
Panel Size
This command defines the visual size of the instrument panels. You may choose a Large, Medium,
or Small panel size. Every visible instrument panel in the Quotes Board window will be resized
according to your choice. * If the instrument panel is detached from the Quotes Board window, this
command only affects the detached panel.
Add/Remove Instruments
This command is only available if the contextual menu is activated while the instrument panel is
attached to the Quotes Board window. It opens the Instruments 60 subsection of the Options
window.
Opacity
This command is only available if the instrument panel is detached from VT Trader's main program
window. You can change the opacity (a.k .a. transparency) level of the detached panel. 100% makes
the panel completely "solid"; 90% - 10% give the detached panel increasingly greater levels of
transparency as the opacity approaches zero.
Close
This command is only available if the instrument panel is detached from VT Trader's main program
window. This command closes the detached instrument panel.
© 2011 Visual Trading Systems, LLC
94
VT Trader 2.0 Help Manual
Always on Top
This command is only available if the instrument panel is detached from VT Trader's main program
window. While enabled, the detached panel remains visible on top of all other open windows.
3.2.2
Advanced Rates Window
The Advanced Rates window provides you with a detailed overview of your chosen instruments and their
associated market data.
You can create new price alerts and conduct trading actions on any of the available Instruments. Buy
and Sell market orders can be requested by positioning the cursor over the Instrument's Bid (Sell) or
Ask (Buy) cells and clicking the left mouse button. These orders will be requested using the Trading
Mode defined in VT Trader's Options window. You can also request Buy and Sell market orders, Entry
Stop Buy, Entry Limit Buy, Entry Stop Sell, and Entry Limit Sell entry orders, as well as One Cancels
Other (OCO), If/Then, and If/Then OCO orders by using the window's contextual menu 97 .
Explanations of Advanced Rates Data
Instrument
The Instrument (i.e. currency pairs, CFDs, stock s, indices, etc.) on which trading actions can be
conducted is shown in this column. Each time an an instrument's prices are updated, its cell is
highlighted. The highlighting behavior is defined by the window's properties 98 .
Bid (Sell) and Ask (Buy)
The Bid is the price at which you can sell the instrument. The Ask is the price at which you can buy
the instrument. The instrument's prices change as soon as the smallest movement of prices in the
market for the instrument has occurred. When an instrument's Bid/Ask prices are updated, it is
possible to draw up/down arrow graphics next to the prices and highlight the cells. The graphic
drawing and highlighting behaviors are defined by the window's properties 98 .
© 2011 Visual Trading Systems, LLC
Task Windows
95
Spread
The difference between the instrument's Ask price and Bid price is its spread. Spread = Ask - Bid.
The spread is determined by your broker. As a general rule the spread typically remains static, but it
can change depending on the volatility in the market. Your broker determines if the spread they offer
remains static or changes dynamically with market volatility.
Time
Time is the most recent time that the instrument's price has changed.
High
The highest Ask price attained by the instrument within the current day is the High. Each day is
typically started at 17:00 ET, however, you should verify the daily rollover time with your broker.
Low
The lowest Bid price attained by the instrument within the current day is the Low. Each day is
typically started at 17:00 ET, however, you should verify the daily rollover time with your broker.
Pip Value
Pip Value is the value of 1 pip. This value is calculated in the account's currency for 1.0 standard
lot of the instrument.
Currency
Currency is the currency in which the instrument's Pip Value is calculated.
Trade Size
The Trade Size is the equivalent number of units of the instrument respective to the Lots (T) value
defined in the Instruments 60 subsection of the Options window.
Order Size
The Order Size is the equivalent number of units of the instrument respective to the Lots (O) value
defined in the Instruments 60 subsection of the Options window.
Margin
Margin is the maximum leverage ratio offered by the broker for the instrument based on your
account type.
Appearance Customizations
Each column of data in the Advanced Rates window can be automatically (or manually) resized,
moved, or hidden at your discretion.
To automatically resize one or more columns, position the cursor over any column caption and click the
© 2011 Visual Trading Systems, LLC
96
VT Trader 2.0 Help Manual
right mouse button. You may select Size Column to Fit or Size All Columns to Fit from the contextual
menu depending on the action you want to perform.
To manually resize a column, you must click and hold down the left mouse button while the cursor is
positioned over the column divider directly to the right of the column you want to resize. The cursor will
change and appear similar to this: <-|->. While the left mouse button is held down, move the mouse to
the left or right to resize the column.
It is also possible to change the location of each column respective to the other visible columns. Moving
a column can be accomplished by dragging and dropping the desired column into its new location after
clicking and holding down the left mouse button while the cursor is positioned over that column's
caption (Spread, Time, Pip Value, etc.).
To hide one or more columns, position the cursor over any column caption and click the right mouse
button. Select any column from the contextual menu that you want to hide. Visible columns have a
check mark next to their caption name while hidden columns do not. To show a hidden column you
simply need to reselect it from the column caption's contextual menu.
You can further customize the appearance of the window and its data by using the window's properties
98 .
Contextual Menu
The Advanced Rates window's contextual menu 97 provides you with additional functionality and
access to the window's properties 98 . To activate the contextual menu 97 , click the right mouse button
while the cursor is positioned over any instrument's row.
© 2011 Visual Trading Systems, LLC
Task Windows
3.2.2.1
97
Contextual Menu
The Advanced Rates window's contextual menu provides you with additional functionality and access to
the window's properties 98 . To activate the contextual menu, click the right mouse button while the
cursor is positioned over any instrument's row.
The Advanced Rates window's contextual menu contains the following commands:
Buy
This command requests a Buy market order at the instrument's current Ask price.
Sell
This command requests a Sell market order at the instrument's current Bid price.
© 2011 Visual Trading Systems, LLC
98
VT Trader 2.0 Help Manual
Conditional Buy
This command is a selection menu that includes a submenu with five commands: Entry Stop, Entry
Limit, One Cancels Other (OCO), If/Then, and If/Then OCO. Entry Stop requests an Entry Stop
Buy order. Entry Limit requests and Entry Limit Buy order. One Cancels Other (OCO) requests a
One Cancels Other (OCO) order with Buy order bias. If/Then requests an If/Then order with Buy
order bias. If/Then OCO requests an If/Then OCO order with Buy order bias.
Conditional Sell
This command is a selection menu that includes a submenu with five commands: Entry Stop, Entry
Limit, One Cancels Other (OCO), If/Then, and If/Then OCO. Entry Stop requests an Entry Stop
Sell order. Entry Limit requests and Entry Limit Sell order. One Cancels Other (OCO) requests a
One Cancels Other (OCO) order with Sell order bias. If/Then requests an If/Then order with Sell
order bias. If/Then OCO requests an If/Then OCO order with Sell order bias.
New Price Alert
This command opens the Price Alert 179 window.
Open Chart
This command opens a new chart window for that instrument.
Convert To
This command dynamically converts the instruments' Pip Value into another currency using current
market prices.
Properties
This command opens the Advanced Rates properties
98
window.
Restore Default
This command resets any custom properties currently used in the Advanced Rates window back to
their default values.
Add/Remove Instruments
This command opens the Instruments
3.2.2.2
60
subsection of the Options window.
Properties
The Advanced Rates properties window is divided into two sections: Appearance and Colors.
Appearance Section
© 2011 Visual Trading Systems, LLC
Task Windows
99
The Appearance section contains the following options:
Caption Font
This option defines the font attributes used for window's column captions. You can change the font
attributes by using the [...] button.
Data Font
This option defines the font attributes used for the the data shown in the window. You can change
the font attributes by using the [...] button.
Bid/Ask Arrows
This option Shows or Hides the up/down arrow graphics that can be shown in the window's Bid (Sell)
and Ask (Buy) columns' cells. An up arrow is drawn if the current price is greater than the previous
price while a down arrow is drawn if the current price is less than the previous price. The color of the
arrow graphics are defined by the Bid/Ask Arrow Up and Bid/Ask Arrow Down options.
Bid/Ask Highlights
This option Shows or Hides the highlight (i.e. back ground color of the cell) that can be shown in the
window's Bid (Sell) and Ask (Buy) columns' cells. The Bid/Ask Highlights Up option is used to
© 2011 Visual Trading Systems, LLC
100
VT Trader 2.0 Help Manual
define the color the cell if the current price is greater than the previous price and the Bid/Ask
Highlights Down option is used to define the color the cell if the current price is less than the
previous price.
Fresh Rates Highlights
This option Shows or Hides the highlight (i.e. back ground color of the cell) that can be shown in the
window's Instrument column's cells. The cell is highlighted each time updated prices are received for
that instrument. The Fresh Rates Highlights option defines the color of cell when it is highlighted.
Colors Section
The Colors section contains the following options:
Selection Highlight
This option defines the color the selected row in the window. You can change the color by using the
[...] button.
Background (Odd Row)
This option defines the background color of all odd-numbered rows in the window. You can change
© 2011 Visual Trading Systems, LLC
Task Windows
101
the color by using the [...] button.
Background (Even Row)
This option defines the background color of all even-numbered rows in the window. You can change
the color by using the [...] button.
Bid/Ask Arrow Up
This option defines the color of the up arrow graphic shown in the Bid (Sell) and Buy (Ask ) columns'
cells if Show is chosen for the Bid/Ask Arrows option. You can change the color by using the [...]
button.
Bid/Ask Arrow Down
This option defines the color of the down arrow graphic shown in the Bid (Sell) and Buy (Ask )
columns' cells if Show is chosen for the Bid/Ask Arrows option. You can change the color by using
the [...] button.
Bid/Ask Highlights Up
This option defines the color of the highlight shown in the Bid (Sell) and Buy (Ask ) columns' cells if
Show is chosen for the Bid/Ask Highlights option. You can change the color by using the [...]
button.
Bid/Ask Highlights Down
This option defines the color of the highlight shown in the Bid (Sell) and Buy (Ask ) columns' cells if
Show is chosen for the Bid/Ask Highlights option. You can change the color by using the [...]
button.
Fresh Rates Highlights
This option defines the color of the highlight shown in the Instrument column's cells if Show is
chosen for the Fresh Rates Highlights option. You can change the color by using the [...] button.
3.3
Trading
3.3.1
Open Positions Window
The Open Positions window shows detailed information about open positions with respect to each
traded instrument. The open position in any given instrument is cumulative; it is a summation of all
individual deals open in that respective instrument. The Open Positions window's contextual menu 104
provides you with additional position-specific and deal-specific functionality as well as access to the
window's properties 106 .
© 2011 Visual Trading Systems, LLC
102
VT Trader 2.0 Help Manual
Explanations of Open Positions Data
Instrument
This is the Instrument associated with the open position (or deal). This column also shows the
reference number for each open deal in the Instrument.
Lots
Lots is the number of lots currently open in the instrument's cumulative position (or in each open
deal).
Amount
Amount is the number of units of the base currency (i.e. the first currency of the instrument; EUR in
EUR/USD, for example) respective to the number of lots being traded in the instrument's cumulative
position (or in each open deal).
B/S
B/S is the direction of the open position (or deal) in the Instrument. B=Buy and S=Sell.
Open
Open is the Instrument's price (Bid or Ask , respective to B/S) that the position (or deal) was opened
at. For the instrument's cumulative open position, it is the average open price of all open deals.
Close
Close is the Instrument's current price (Bid or Ask , respective to B/S) at which it is possible to
immediately close the open position (or deal(s)).
Stop
If a conditional stop order has been attached to the open position, this column shows its price. If no
conditional stop order is attached to the position, this column will be empty (blank ).
Limit
If a conditional limit order has been attached to the open position, this column shows its price. If no
conditional limit order is attached to the position, this column will be empty (blank ).
Pips P/L
© 2011 Visual Trading Systems, LLC
Task Windows
103
Pips P/L is the open position's floating profit/loss in pips.
Unrealized P/L
Unrealized P/L is the open position's floating profit/loss. Unrealized P/L is calculated in the
currency shown in the Currency column.
Currency
Currency is the currency in which the position's (or deal's) profit or loss is calculated.
Date/Time
Date/Time is the date and time that the position (or deal) was confirmed by your broker. Date/
Time is shown in the following format: Month/Day/Year Hour:Minute:Seconds AM/PM.
Total Row
This row (in accordance with each column's data) shows a summary status of all open positions.
The values are calculated in the currency shown in the Currency column.
Appearance Customizations
Each column of data in the Open Positions window can be automatically (or manually) resized, moved,
or hidden at your discretion.
To automatically resize one or more columns, position the cursor over any column caption and click the
right mouse button. You may select Size Column to Fit or Size All Columns to Fit from the contextual
menu depending on the action you want to perform.
To manually resize a column, you must click and hold down the left mouse button while the cursor is
positioned over the column divider directly to the right of the column you want to resize. The cursor will
change and appear similar to this: <-|->. While the left mouse button is held down, move the mouse to
the left or right to resize the column.
© 2011 Visual Trading Systems, LLC
104
VT Trader 2.0 Help Manual
It is also possible to change the location of each column respective to the other visible columns. Moving
a column can be accomplished by dragging and dropping the desired column into its new location after
clicking and holding down the left mouse button while the cursor is positioned over that column's
caption (Instrument, B/S, Unrealized P/L, etc.).
To hide one or more columns, position the cursor over any column caption and click the right mouse
button. Select any column from the contextual menu that you want to hide. Visible columns have a
check mark next to their caption name while hidden columns do not. To show a hidden column you
simply need to reselect it from the column caption's contextual menu.
You can further customize the appearance of the window and its data by using the window's properties
106 .
Contextual Menu
The Open Positions window's contextual menu 104 provides you with additional functionality and access
to the window's properties 106 . To activate the contextual menu 104 , click the right mouse button while
the cursor is positioned over any position's row.
3.3.1.1
Contextual Menu
The Open Positions window's contextual menu provides you with additional position-specific
functionality and access to the window's properties 106 . To activate the contextual menu, click the right
mouse button while the cursor is positioned over any position's row.
© 2011 Visual Trading Systems, LLC
Task Windows
105
The Open Positions window's contextual menu contains the following commands:
Close Position
This command closes the selected open position at the instrument's current market price.
Close Deal
This command closes the selected deal at the instrument's current market price. * Note: This
command is only available if your broker supports this functionality.
Close All Positions
This command closes all of the open positions shown in the window at the instruments' current
market prices. * This command is only available if the contextual menu is activated while the cursor
is hovering over the Total row.
Stop
This command is a selection menu that includes a submenu with three commands: Attach, Edit,
and Remove. Attach adds (attaches) a new stop order to the open position. It is only active if no
existing stop order exists. Edit modifies the existing stop order attached to the open position. It is
only active if an existing stop order is attached. Remove deletes the existing stop order attached to
the open position. It is only active if an existing stop order exists. * This command is only available
for the instrument's cumulative open position row, not for its individual deals.
Limit
This command is a selection menu that includes a submenu with three commands: Attach, Edit,
and Remove. Attach adds (attaches) a new limit order to the open position. It is only active if no
existing limit order exists. Edit modifies the existing limit order attached to the open position. It is
only active if an existing limit order is attached. Remove deletes the existing limit order attached to
the open position. It is only active if an existing limit order exists. * This command is only available
for the instrument's cumulative open position row, not for its individual deals.
Convert To
This command dynamically converts the Open Positions window's Unrealized P/L values into
another currency using current market prices.
Properties
This command opens the Open Positions properties 106 window.
Restore Default
This command resets any custom properties currently used in the Open Positions window back to
their default values.
© 2011 Visual Trading Systems, LLC
106
3.3.1.2
VT Trader 2.0 Help Manual
Properties
The Open Positions properties window is divided into two sections: Appearance and Colors.
Appearance Section
The Appearance section contains the following options:
Caption Font
This option defines the font attributes used for window's column captions. You can change the font
attributes by using the [...] button.
Data Font
This option defines the font attributes used for the the data shown in the window. You can change
the font attributes by using the [...] button.
Highlight Method
This option defines how the background colors of the window's rows are determined. It is a selection
© 2011 Visual Trading Systems, LLC
Task Windows
107
menu with two choices: Back ground and P/L. If Back ground is chosen, the Background (Odd
Row) and Background (Even Row) options are used to color the rows. If P/L is chosen, the
Background (P/L >= 0) and Background (P/L < 0) options are used to dynamically color the rows.
Colors Section
The Colors section contains the following options:
Selection Highlight
This option defines the color the selected row in the window. You can change the color by using the
[...] button.
Background (Odd Row)
This option defines the background color of all odd-numbered rows in the window while Back ground
is chosen as the Highlight Method. You can change the color by using the [...] button.
Background (Even Row)
This option defines the background color of all even-numbered rows in the window while Back ground
is chosen as the Highlight Method. You can change the color by using the [...] button.
© 2011 Visual Trading Systems, LLC
108
VT Trader 2.0 Help Manual
Background (P/L >=0)
This option defines the background color of any row in the window that shows a Net P/L value
greater than or equal to zero while P/L is chosen as the Highlight Method. You can change the
color by using the [...] button.
Background (P/L < 0)
This option defines the background color of any row in the window that shows a Net P/L value less
than zero while P/L is chosen as the Highlight Method. You can change the color by using the [...]
button.
3.3.2
Pending Orders Window
The Pending Orders window shows detailed information about pending orders. The Pending Orders
window's contextual menu 111 provides you with additional order-specific functionality and access to the
window's properties 111 .
Explanations of Pending Orders Data
Reference Number
The Reference Number is a unique identification number assigned to the order.
Instrument
This is the Instrument associated with the order.
Type
Type is the type of order requested (i.e. Single, OCO, If Then, If Then/OCO, or Trailing Stop).
Basis
This is the Basis of the order requested (i.e. Stop or Limit)
Buy/Sell
Buy/Sell identifies whether the order is to Buy or Sell the base currency (i.e. the first currency of
© 2011 Visual Trading Systems, LLC
Task Windows
109
the instrument; EUR in EUR/USD, for example) of the Instrument.
Lots
Lots is the number of lots in the order.
Amount
Amount is the number of units of the base currency (i.e. the first currency of the instrument; EUR in
EUR/USD, for example) respective to the number of lots in the order.
Expiry
Expiry identifies when the order will be automatically canceled if it has not been activated. GTC
=Good Till Canceled and Day=Cancel at End of Day.
Rate
Rate is the instrument's price at which the order will be executed.
Trailing Pips
Trailing Pips is the number of pips away from the current rate that the order will follow behind. This
value is only available for trailing entry stop orders and associated trailing stop orders.
Associated
Associated identifies whether the order is associated (attached) to an open position.
Date/Time
Date/Time is the date and time that the order was initially confirmed (or most recently modified by
you and confirmed) by your broker. Date/Time is shown in the following format: Month/Day/Year
Hour:Minute:Seconds AM/PM.
Appearance Customizations
Each column of data in the Pending Orders window can be automatically (or manually) resized, moved,
or hidden at your discretion.
To automatically resize one or more columns, position the cursor over any column caption and click the
right mouse button. You may select Size Column to Fit or Size All Columns to Fit from the contextual
menu depending on the action you want to perform.
© 2011 Visual Trading Systems, LLC
110
VT Trader 2.0 Help Manual
To manually resize a column, you must click and hold down the left mouse button while the cursor is
positioned over the column divider directly to the right of the column you want to resize. The cursor will
change and appear similar to this: <-|->. While the left mouse button is held down, move the mouse to
the left or right to resize the column.
It is also possible to change the location of each column respective to the other visible columns. Moving
a column can be accomplished by dragging and dropping the desired column into its new location after
clicking and holding down the left mouse button while the cursor is positioned over that column's
caption (Instrument, T, Expiry, etc.).
To hide one or more columns, position the cursor over any column caption and click the right mouse
button. Select any column from the contextual menu that you want to hide. Visible columns have a
check mark next to their caption name while hidden columns do not. To show a hidden column you
simply need to reselect it from the column caption's contextual menu.
You can further customize the appearance of the window and its data by using the window's properties
111 .
Contextual Menu
The Pending Orders window's contextual menu 111 provides you with additional functionality and
access to the window's properties 111 . To activate the contextual menu 111 , click the right mouse button
while the cursor is positioned over any position's row.
© 2011 Visual Trading Systems, LLC
Task Windows
3.3.2.1
111
Contextual Menu
The Pending Orders window's contextual menu provides you with additional functionality and access to
the window's properties 111 . To activate the contextual menu, click the right mouse button while the
cursor is positioned over any order's row.
The Pending Orders window's contextual menu contains the following commands:
Change
This command changes the rate (price) of the selected order.
Remove
This command cancels (removes) the selected order.
Remove All
This command cancels (removes) all of the orders shown in the window.
Properties
This command opens the Pending Orders properties 111 window.
Restore Default
This command resets any custom properties currently used in the Pending Orders window back to
their default values.
3.3.2.2
Properties
The Pending Orders properties window is divided into two sections: Appearance and Colors.
© 2011 Visual Trading Systems, LLC
112
VT Trader 2.0 Help Manual
Appearance Section
The Appearance section contains the following options:
Caption Font
This option defines the font attributes used for window's column captions. You can change the font
attributes by using the [...] button.
Data Font
This option defines the font attributes used for the the data shown in the window. You can change
the font attributes by using the [...] button.
Highlight Method
This option defines how the background colors of the window's rows are determined. It is a selection
menu with two choices: Back ground and Order Type. If Back ground is chosen, the Background
(Odd Row) and Background (Even Row) options are used to color the rows. If Order Type is
chosen, the order type-specific options are used to dynamically color the rows.
© 2011 Visual Trading Systems, LLC
Task Windows
113
Colors Section
The Colors section contains the following options:
Selection Highlight
This option defines the color the selected row in the window. You can change the color by using the
[...] button.
Background (Odd Row)
This option defines the background color of all odd-numbered rows in the window while Back ground
is chosen as the Highlight Method. You can change the color by using the [...] button.
Background (Even Row)
This option defines the background color of all even-numbered rows in the window while Back ground
is chosen as the Highlight Method. You can change the color by using the [...] button.
Entry Stop Order
This option defines the background color of any row in the window that shows an entry stop order
while Order Type is chosen as the Highlight Method. You can change the color by using the [...]
© 2011 Visual Trading Systems, LLC
114
VT Trader 2.0 Help Manual
button.
Trailing Entry Stop Order
This option defines the background color of any row in the window that shows a trailing entry stop
order while Order Type is chosen as the Highlight Method. You can change the color by using the
[...] button.
Entry Limit Order
This option defines the background color of any row in the window that shows an entry limit order
while Order Type is chosen as the Highlight Method. You can change the color by using the [...]
button.
Stop Order
This option defines the background color of any row in the window that shows an associated stop
order while Order Type is chosen as the Highlight Method.
Trailing Stop Order
This option defines the background color of any row in the window that shows an associated trailing
stop order while Order Type is chosen as the Highlight Method.
Limit Order
This option defines the background color of any row in the window that shows an associated limit
order while Order Type is chosen as the Highlight Method.
3.3.3
Trading Activity Window
The Trading Activity window shows trading-related messages sent and received by VT Trader.
Explanations of Trading Activity Data
Date/Time
Date/Time is the date and time of the requested action. Date/Time is shown in the following
format: Month/Day/Year Hour:Minute:Seconds AM/PM.
© 2011 Visual Trading Systems, LLC
Task Windows
115
Type
Type identifies the type of action (Deal or Order) that was requested.
Reference Number
The Reference Number is a unique identification number that identifies the action.
Instrument
This is the Instrument associated with the action.
Basis
Basis identifies the order basis for the action (i.e. Stop or Limit)
Buy/Sell
Buy/Sell identifies the directional bias for the action.
Lots
Lots is the number of lots for the action.
Amount
Amount is the number of units of the base currency (i.e. the first currency of the instrument; EUR in
EUR/USD, for example) respective to the number of lots for the requested action.
Expiry
Expiry identifies the order expiration. GTC=Good Till Canceled and Day=Cancel at End of Day. This
information is only provided for orders.
Rate
Rate is the instrument's price at which the action was requested.
Trailing Pips
Trailing Pips is the number of pips away from the current rate that the order will follow behind. This
value is only available for trailing entry stop orders and associated trailing stop orders.
Action
Action defines the action being requested.
Message
The Message provides details pertaining to the action that generated the message.
Appearance Customizations
© 2011 Visual Trading Systems, LLC
116
VT Trader 2.0 Help Manual
Each column of data in the Trading Activity window can be automatically (or manually) resized, moved,
or hidden at your discretion.
To automatically resize one or more columns, position the cursor over any column caption and click the
right mouse button. You may select Size Column to Fit or Size All Columns to Fit from the contextual
menu depending on the action you want to perform.
To manually resize a column, you must click and hold down the left mouse button while the cursor is
positioned over the column divider directly to the right of the column you want to resize. The cursor will
change and appear similar to this: <-|->. While the left mouse button is held down, move the mouse to
the left or right to resize the column.
It is also possible to change the location of each column respective to the other visible columns. Moving
a column can be accomplished by dragging and dropping the desired column into its new location after
clicking and holding down the left mouse button while the cursor is positioned over that column's
caption (Date/Time, Instrument, Message, etc.).
To hide one or more columns, position the cursor over any column caption and click the right mouse
button. Select any column from the contextual menu that you want to hide. Visible columns have a
check mark next to their caption name while hidden columns do not. To show a hidden column you
simply need to reselect it from the column caption's contextual menu.
You can customize the appearance of the window and its data by using the window's properties 117 .
Contextual Menu
The Trading Activity window's contextual menu 117 provides you with additional functionality and
access to the window's properties 117 . To activate the contextual menu 117 , click the right mouse button
while the cursor is positioned over any message's row.
© 2011 Visual Trading Systems, LLC
Task Windows
3.3.3.1
117
Contextual Menu
The Trading Activity window's contextual menu provides you with additional functionality. To activate
the contextual menu, click the right mouse button while the cursor is positioned over any message's
row.
The Trading Activity window's contextual menu contains the following commands:
Clear Log
This command erases the contents of the window.
Save Log
This command saves the contents of the window to a text file.
Properties
This command opens the Trading Activity properties 117 window.
Restore Default
This command resets any custom properties currently used in the Trading Activity window back to
their default values.
3.3.3.2
Properties
The Trading Activity properties window is divided into two sections: Appearance and Colors.
© 2011 Visual Trading Systems, LLC
118
VT Trader 2.0 Help Manual
Appearance Section
The Appearance section contains the following options:
Caption Font
This option defines the font attributes used for window's column captions. You can change the font
attributes by using the [...] button.
Data Font
This option defines the font attributes used for the the data shown in the window. You can change
the font attributes by using the [...] button.
Auto-Scroll Messages
This option is a selection menu with two choices: Yes and No. While Yes is chosen, the Trading
Log 114 window "jumps" to the newest message received. If you select one or more messages, this
option is temporarily disabled while the message(s) remain selected; this allows you easily view
and/or search through the messages without having to completely disable this option by choosing
No.
© 2011 Visual Trading Systems, LLC
Task Windows
119
Colors Section
The Colors section contains the following options:
Selection Highlight
This option defines the color the selected row in the window. You can change the color by using the
[...] button.
Background (Odd Row)
This option defines the background color of all odd-numbered rows in the window. You can change
the color by using the [...] button.
Background (Even Row)
This option defines the background color of all even-numbered rows in the window. You can change
the color by using the [...] button.
© 2011 Visual Trading Systems, LLC
120
VT Trader 2.0 Help Manual
3.4
Trading Tools
3.4.1
Currency Calculator
The Currency Calculator is a very simple, yet useful, tool included in VT Trader.
You can quickly enter the amount of the first currency (the base currency) and convert that amount into
the second currency. In the example below, $100.00 USD (U.S. dollars) has been converted into the
EUR currency (Euro).
3.4.2
Pip Calculator
The Pip Calculator is another very simple, yet useful, tool included in VT Trader. You ca quickly
determine the value of 1 pip of a currency pair based on the trade amount (in Lots) calculated in your
choice of currency.
In the example below, 1 pip of the USD/CHF currency based on a 1 lot trade amount is equal to $8.76
USD (U.S. Dollars).
© 2011 Visual Trading Systems, LLC
Task Windows
3.5
121
Chart Window
Chart windows associated with various instruments and time intervals will be your primary focus while
performing technical analysis in VT Trader. You can also conduct actual trading actions and monitor
trading activity directly from the chart window(s). Each chart window can be manipulated by using the
commands in the Ribbon's 30 Chart menu, its own contextual menu 128 , its custom Chart Properties (or
its assigned Chart Template Properties), and/or its toolbar 124 .
A Chart window can be broken down into several different areas of interest.
Caption Bar
© 2011 Visual Trading Systems, LLC
122
VT Trader 2.0 Help Manual
The Caption Bar shows the instrument chart interval, and Bid/Ask chart type.
Price Frame and Technical Indicator Frame(s)
The price frame along with any technical indicator frames (which can be positioned above and/or
below the main price frame) shows the instrument's price data and any technical indicators' data.
These areas also show many other elements that help define the chart's characteristics and aid in
your technical analysis.
Some of the chart's basic visual elements include: the instruments panel, the X-axis and Y-axis, grid
lines, high/low zone, the current price line and its spread band, and hidden labels. The spread band
is attached to the current price line; it is an area equal to the difference between the Bid/Ask prices
of the instrument. The grid lines are vertical and horizontal lines that are shown in the price frame
(and any visible indicator frame(s)). The vertical grid lines are automatically drawn predefined
increments (based on the chart's Interval). The horizontal grid lines are drawn at predefined price
levels (usually rounded numbers of price such as 1.2000, 1.2050, and 1.2100).
Indicators, indicator labels, trading systems, trading system labels, and price alert labels are also
shown in this area (overlaid in the price frame and in separate frames above and/or below the price
frame). Position-related labels, pending order-related labels, and indicator order-related labels are
shown according to your All Accounts/Position selections if you are conducting trading activities in
the instrument you are analyzing in the chart window.
Any drawing tools you are using in the chart window to assist with your technical analysis will also
be shown in these areas.
Chart elements are shown using layers. Each type of chart element is assigned to a layer. A
particular chart window's various layers can be shown or hidden at your discretion by using the
Ribbon -> Chart menu -> Show/Hide group -> Chart Layers selection menu or the Chart Properties
window (or the Chart Template Properties window if the chart is using a template).
Y-Axis
The Y-axis is located along the right side of the chart window. It shows the instrument's price
values. You can use the Y-axis to adjust the chart's Y-Axis (vertical) zoom level by positioning the
cursor over top of the Y-axis, clicking and holding down the let mouse button, and moving the cursor
to a new location within the Y-axis. Releasing the left mouse button applies the zoom action.
Moving the cursor to a higher location zooms in the Y-axis scale, while moving it to a lower location
zooms out the Y-axis scale.
X-Axis
The X-axis is located along the bottom side of the chart window directly below the instrument data
area. It shows the chart interval's date/time values. You can use the X-axis to adjust the chart's Xaxis (horizontal) zoom level by positioning the cursor over top of the X-axis, clicking and holding
down the let mouse button, and moving the cursor to a new location within the X-axis. Releasing the
left mouse button applies the zoom action. Moving the cursor to the right zooms in the X-axis scale,
while moving it to left zooms out the X-axis scale.
© 2011 Visual Trading Systems, LLC
Task Windows
123
Quotes Panel
The Quotes Panel is located in the top, left corner of the chart window. Its data is specific the
instrument being viewed in the chart window. The Quotes Panel shown in the chart window looks
and functions exactly like its Instrument Panel 90 counterpart in the Quotes Board 89 window.
Please click here 90 to learn more about the Quotes Panel.
Chart Window Toolbar
The chart window's toolbar provides you quick, easy access to a variety of very useful chartrelated commands and drawing tools. Please click here 124 to learn more about the chart window
toolbar's commands.
Status Bar
The Status Bar (from left-to-right) shows the date/time and prices of the selected bar or candle (if
one is selected - not shown in screenshot below), the date/time stamp and price value according to
the cursor's position within the chart, and the current date and time provided by your broker.
Contextual Menu
The chart window's contextual menu 128 provides you with trading-related functionality, technical
analysis-related functionality, access to the window's properties, and more. To activate the
contextual menu 128 , click the right mouse button while the cursor is positioned anywhere within the
window.
© 2011 Visual Trading Systems, LLC
124
3.5.1
VT Trader 2.0 Help Manual
Chart Window Toolbar
The Chart Window Toolbar provides you quick, easy access to a variety of very useful chart-related
commands and drawing tools.
Explanations of Chart Window Toolbar Commands
Instrument
This command contains a selection menu that includes all of the instruments available in VT Trader.
You can change the chart window's current instrument by choosing your desired instrument from the
selection menu.
Interval
This command contains a selection menu that includes all of the chart intervals available for use in
the chart window. You can change chart window's current interval by choosing your desired interval
from the selection menu. The following chart intervals are currently available in VT Trader:
Tick (each incoming price is a "tick "; a "tick " is the smallest possible interval)
1-Minute
5-Minute
© 2011 Visual Trading Systems, LLC
Task Windows
125
10-Minute
15-Minute
30-Minute
1-Hour
2-hour
4-Hour
Daily (each new day starts at 17:00 ET)
Weekly (each new week starts at 12:00 AM (00:00) ET on Monday)
Monthly
Bid/Ask
An instrument has two possible prices at any given time - its bid price and its ask price. You sell at
the bid price and you buy at the ask price. VT Trader can construct an instrument's chart using
either its bid or ask prices. You can choose an instrument's bid or ask price bias using the Bid/Ask
command.
Type
This command contains a selection menu that includes all of the types of charts available for use in
the chart window. You can change chart window's current chart type by choosing your desired type
from the selection menu. The following chart types are currently available in VT Trader:
Japanese Candlesticks (Filled)
Japanese Candlesticks (Hollow)
Heikin-Ashi Candlesticks
Bars (O/H/L/C)
Bars
Line
Point and Figure
Renko
Auto-Scroll Chart to Current Time
This command is a toggle button. It enables or disables the Auto-Scroll to Current Time property of
the active chart window. While enabled, the active chart window will always automatically move the
chart's price data to the instrument's most recent incoming price tick. Disabling this property allows
you to easily perform technical analysis throughout the instrument's historical price data without the
chart automatically returning to the most recent price tick.
Auto-Size Y-Axis
This command is a toggle button. It enables or disables the Auto-Size Y-Axis property of the active
chart window. While enabled, the active chart window automatically resizes its pricing data to show
the highest high price and lowest low price at the respective top and bottom of the viewable chart
area. If one or more indicators are shown in the main price frame, the highest high and lowest low
values of the indicator(s) are also considered while auto-sizing. For example, if an attached
indicator's value has a higher high value (and/or a lower low value) than the price bars, then the
indicator's value(s) will be used for the auto-sizing of the viewable data. Disabling this property
allows you to manually control the scaling (sizing) of the data in the viewable area of the chart
window using the Zoom commands, the Y-Axis's drag-and-drop zooming functionality, or the YAxis's Scale Settings.
© 2011 Visual Trading Systems, LLC
126
VT Trader 2.0 Help Manual
Show Grid Lines
This command is a toggle button. It shows or hides the Grid Lines in the active chart window.
Show Cross Hair
This command is a toggle button. It shows or hides the Cross Hair in the active chart window.
Please click here 240 to learn more about the Cross Hair tool.
Show Quotes Panel
This command is a toggle button. It shows or hides the Quotes Panel in the active chart window.
Set All Labels to Default Position
This command quickly resets all of the labels shown in the active chart window back to their default
positions.
Drawing Tool Selection
This command allows you to quickly select any of VT Trader's drawing tools for use. Please click
here 239 to learn more about the drawing tools included in VT Trader.
Clone Chart
You can quickly create a new, duplicate (clone) chart window of the active chart window by using
the Clone Chart command.
Area Zoom
This command allows you to define a rectangular portion of the active chart window using the cursor
to automatically zoom in on. The portion of the active chart window within your rectangular selection
area will be magnified to fill the entire viewable area of the chart window.
X-Axis Zoom Out
You can decrease the horizontal (left-to-right) size of the active chart window's data using this
command.
X-Axis Zoom In
You can increase the horizontal (left-to-right) size of the active chart window's data using this
command.
Y-Axis Zoom In
You can increase the vertical (top-to-bottom) size of the active chart window's data using this
command.
Y-Axis Zoom Out
You can decrease the vertical (top-to-bottom) size of the active chart window's data using this
command.
© 2011 Visual Trading Systems, LLC
Task Windows
127
Undo Zoom
You can undo the most recent action performed with any of the zooming commands by using this
command.
Reset X-Axis
You can quickly restore the X-Axis's zoom level back to its default value using this command.
Reset Y-Axis
You can quickly restore the Y-Axis's zoom level back to its default value using this command.
Reset Axes
You can quickly restore the X-Axis's zoom level and the Y-Axis's zoom level back to their default
values using this command.
Contextual Menu
The Chart Window Toolbar contextual menu's Customize... command allows you add or remove icons
from the toolbar. To activate the contextual menu and customize 127 the toolbar, click the right mouse
button while the cursor is positioned anywhere within the toolbar. Please click here 127 to learn more
about customizing the chart window's toolbar.
3.5.1.1
Customize...
You can customize the commands shown in the chart window toolbar 124 by selecting the Customize...
command from its contextual menu.
Once selected, a Customize Toolbar window is opened...
© 2011 Visual Trading Systems, LLC
128
VT Trader 2.0 Help Manual
You can use the [Add ->], [<- Remove], [Move Up], and/or [Move Down] buttons to create a unique
arrangement for the chart window toolbar 124 . The [Reset] button returns chart window toolbar 124 back to
its default arrangement. The Available toolbar items selection menu shows the available commands not
included in the chart window toolbar 124 . The Current toolbar items section shows tools that are currently
included in the chart window toolbar 124 .
3.5.2
Contextual Menu
The chart window's contextual menu provides you with trading-related functionality, technical analysisrelated functionality, access to the window's custom properties, and more. To activate the contextual
menu, click the right mouse button while the cursor is positioned anywhere within the window.
© 2011 Visual Trading Systems, LLC
Task Windows
129
The Chart window's contextual menu contains the following commands:
Buy
This command requests a Buy market order at the instrument's current Ask price.
Sell
This command requests a Sell market order at the instrument's current Bid price.
Conditional Buy
This command is a selection menu that includes a submenu with five commands: Entry Stop, Entry
Limit, One Cancels Other (OCO), If/Then, and If/Then OCO. Entry Stop requests an Entry Stop
Buy order. Entry Limit requests and Entry Limit Buy order. One Cancels Other (OCO) requests a
One Cancels Other (OCO) order with Buy order bias. If/Then requests an If/Then order with Buy
order bias. If/Then OCO requests an If/Then OCO order with Buy order bias.
Conditional Sell
This command is a selection menu that includes a submenu with five commands: Entry Stop, Entry
Limit, One Cancels Other (OCO), If/Then, and If/Then OCO. Entry Stop requests an Entry Stop
Sell order. Entry Limit requests and Entry Limit Sell order. One Cancels Other (OCO) requests a
One Cancels Other (OCO) order with Sell order bias. If/Then requests an If/Then order with Sell
order bias. If/Then OCO requests an If/Then OCO order with Sell order bias.
Price Alert
This command opens the Price Alert 179 window.
© 2011 Visual Trading Systems, LLC
130
VT Trader 2.0 Help Manual
Indicator's Order Buy
This command requests an Indicator Order to Buy based on any indicator currently attached to the
chart window. To request an Indicator Order to Buy for an indicator shown in its own frame, you
must activate the contextual menu while the cursor is positioned within the indicator's frame.
Indicator's Order Sell
This command requests an Indicator Order to Sell based on any indicator currently attached to the
chart window. To request an Indicator Order to Sell for an indicator shown in its own frame, you
must activate the contextual menu while the cursor is positioned within the indicator's frame.
Chart Properties...
This command opens the active chart window's custom Chart Properties 131 window. This Chart
Properties 131 window is identical to the Chart Template Properties window except that only the
active chart will be modified if any properties are changed. If any of the active chart window's custom
chart properties are changed while the chart is assigned to a chart template, the chart is
disassociated from the chart template and begins using its custom chart properties.
Chart Template
This command is a selection menu that includes a submenu with two commands: Load
Template... and Save Template As. The Load Template... command loads (applies) any of your
saved chart templates to the active chart window. If the active chart window is currently assigned to
a chart template, that chart template will have a check mark next to its name in this command's
selection menu. The Save Template As command saves the active chart window's properties
configuration as a new chart template file. All properties included in the Chart Properties window
are included in the chart template. The new chart template file is saved into VT Trader's Data ->
ChartTemplates folder. Once saved, the new chart template is shown in the Load Template...
command's selection menu and in the Ribbon -> Chart menu -> Chart Templates group -> Load...
command's selection menu.
Move Frame Up
This command moves the frame up that the cursor was positioned over when the contextual menu
was activated. This command will be available if the contextual menu was activated from within a
frame that had an additional frame directly above it.
Move Frame Down
This command moves the frame down that the cursor was positioned over when the contextual menu
was activated. This command will be available if the contextual menu was activated from within a
frame that had an additional frame directly below it.
Add Indicator...
This command opens the Add Indicator window. You can review categorized lists of indicators,
choose an indicator from one of the lists, review its description, and add it to the chart using the
Add Indicator window.
Indicators Quick List
© 2011 Visual Trading Systems, LLC
Task Windows
131
This command includes a selection menu. The Indicators Quick List can be likened to your
"Favorites" in Internet Explorer or your "Bookmarks" in Mozilla Firefox. You can configure the
Indicators Quick List to include only the indicators that you use most frequently or desire to have
easily available. You may need to configure your Indicators Quick List before it best fits your
needs. Please click here 235 to learn more about configuring your Indicator Quick List.
Attached Indicators
This command opens the Attached Indicators window. You can review a summary listing of
indicators currently attached to the active chart window, add additional indicators to the chart,
change the properties of any attached indicator, and delete attached indicators using the Attached
Indicators window. The Attached Indicators window also allows you to directly edit an indicator by
opening it in an Indicator Editor window. Please click here 184 to learn more about editing
indicators using an Indicator Editor window.
Add Trading System...
This command opens the Add Trading System window. You can review categorized lists of trading
systems, choose a trading system from one of the lists, review its description, and add it to the
chart using the Add Trading System window.
Trading Systems Quick List
This command includes a selection menu. The Trading Systems Quick List can be likened to your
"Favorites" in Internet Explorer or your "Bookmarks" in Mozilla Firefox. You can configure the
Trading Systems Quick List to include only the trading systems that you use most frequently or
desire to have easily available. You may need to configure your Trading Systems Quick List before
it best fits your needs. Please click here 236 to learn more about configuring your Trading Systems
Quick List.
Attached Trading Systems
This command opens the Attached Trading Systems window. You can review a summary listing of
trading systems currently attached to the active chart window, add additional trading systems to the
chart, change the properties of any attached trading system, enable or disable Auto-Trading mode
for any attached trading system, and delete attached trading systems using the Attached Trading
Systems window. The Attached Trading Systems window also allows you to directly edit a trading
system by opening it in a Trading System Editor window. Please click here 207 to learn more
about editing trading systems using a Trading System Editor window.
3.5.3
Chart Properties
The Chart Properties window defines the main set of properties used by the chart window(s). It is
important to note that each chart window in VT Trader is always operating in one of two different chart
properties modes. Those modes are: Chart Template Mode 152 or the chart window's own Custom Chart
Properties Mode. Chart windows assigned to a chart template will be automatically redrawn each time
that chart template is modified. New chart windows are always opened using the "primary" chart
template. Open chart windows that are using their own custom chart properties will not be affected by
© 2011 Visual Trading Systems, LLC
132
VT Trader 2.0 Help Manual
changes made to any chart template.
Effectively, there is a 3-level hierarchy that determines how chart templates 152 , chart properties, and per
chart elements' properties are applied to each chart.
Level 1 (highest level): Chart Template ->
Level 2: Custom Chart Properties ->
Level 3 (lowest level): Per Chart Elements’ Custom Properties
It is easy to determine if the active chart window is assigned to a chart template or if it is using its own
custom chart properties. If it is assigned to a chart template, the Ribbon -> Chart -menu -> Chart
Templates group -> Load... command's selection menu and the chart window contextual menu -> Chart
Template -> Load Template... command's selection menu will have a check mark next to the assigned
chart template's name. If no chart template has a check mark next to its name, the chart window is
using its own custom chart properties. If the active chart window is assigned to a chart template,
however, any time you modify its properties that chart immediately disassociates itself from the chart
template and switches to using its own custom chart properties.
The Chart Properties window is divided into the following sections (and subsections):
Appearance
The Appearance section defines the active chart window's general appearance properties. Click on the
subsection's name to learn more about its options. The subsections included in this section are:
Chart 133
Show/Hide 135
Miscellaneous 137
High/Low Zone 138
Cross Hair 140
Labels
The Labels section defines the default properties for all of the various types of Chart Labels that can be
shown in the active chart window. You can define each label's Label Color, Border Color (position-related
labels have separate Label/Border Colors based on Net Profit/Loss), Font Attributes, and Line Color/
Width/Style. You can also define the Placement (i.e. Chart or Y-Axis) of the Current Rate, High Line,
and Low Line labels. Note: Any label shown in the active chart window can be customized using its own
individual custom properties without affecting these default properties or any other labels (by positioning
the cursor over the label shown in the chart window, click ing the right mouse button, and choosing
"Properties" from its contextual menu).
Layers
The Layers section defines the properties for all of the various Chart Layers that can be shown or hidden
in the active chart window. You can define each layer's visibility and brightness. Any object(s) attached
© 2011 Visual Trading Systems, LLC
Task Windows
133
to the active chart window that are part of the chosen layer will be affected by these properties. For
example, if you draw 3 trend lines in the chart window, choose the Trend Lines layer, and choose No for
the Visibility property, all 3 trend lines are hidden from view; choose Yes to show them again.
Chart Types
The Chart Types section defines the properties for all of the various Chart Types that can be used in the
active chart window. Please click here 142 to learn more about each of the chart types. For candlestick
chart types, you can choose the up/down candle fill colors and the up/down candle border color/width.
For bar and line chart types, you can choose the up/down bar/line colors and bar/line width. For the
Point and Figure chart type, you can choose the up/down X/O colors/width, price array, box size, and
reversal amount. For the Renko chart type, you can choose the up/down brick colors, up/down brick
border colors/width, and box size.
Drawing Tools
The Drawing Tools section defines the basic properties for all of the various Drawing Tools that can be
used in the active chart window. Please click here 239 to learn more about each of the drawing tools.
Note: Any drawing object shown in the active chart window can be customized using its own individual
custom properties without affecting these default properties or any other drawing tools (by selecting the
object in the chart window, click ing the right mouse button, and choosing "Properties" from its
contextual menu).
Attached Indicators
This section is a simple read-only summary list showing the names of any indicators currently attached
to the active chart window. If/when the chart properties are saved (and/or loaded) as a chart template,
each attached indicator's custom properties are also saved (and/or loaded) as part of the chart template.
Attached Trading Systems
This section is a simple read-only summary list showing the names of any trading systems currently
attached to the active chart window. If/when the chart properties are saved (and/or loaded) as a chart
template, each attached trading system's custom properties are also saved (and/or loaded) as part of
the chart template.
3.5.3.1
Chart
The Chart subsection contains two groups: Chart and Axes.
© 2011 Visual Trading Systems, LLC
134
VT Trader 2.0 Help Manual
Chart Group
The Chart group contains the following options:
Spread Band Transparency (%)
This option defines the transparency of the spread band.
Spread Band Color
This option defines the color of the spread band. You can change its color by using the [...] button.
Chart Background Color
This option defines the main background color of the active chart window. You can change its color
by using the [...] button.
High/Low Zone Background Color
© 2011 Visual Trading Systems, LLC
Task Windows
135
This option defines the color of the high/low zone. You can change its color by using the [...] button.
Grid Lines Color
This option defines the color of the grid lines. You can change its color by using the [...] button.
Grid Lines Style
This option defines the style of the grid lines.
Label Shadow Transparency (%)
This option defines the transparency of the labels' shadows.
Label Alignment
This option is a selection menu with two choices: Left and Right. It defines the default placement of
the labels when they are initially shown in the active chart window.
Axes Group
The Axes group contains the following options:
Background Color
This option defines the background color of the X-Axis and Y-Axis areas. You can change the color
by using the [...] button.
Foreground Color
This option defines the color of the X-Axis date/time marker lines and the Y-Axis price marker lines
on the axes inside edges. You can change the color by using the [...] button.
Font
This option defines the font attributes of the X-Axis and Y-Axis values. You can change their font
attributes by using the [...] button.
Y-Axis Width
This option defines the width (in pixels) of the Y-Axis area.
3.5.3.2
Show/Hide
The Show/Hide subsection only contains one group: Show/Hide.
© 2011 Visual Trading Systems, LLC
136
VT Trader 2.0 Help Manual
Show/Hide Group
The Show/Hide group contains the following options:
Cross Hair
This option shows or hides the cross hair tool 240 in the active chart window.
Quotes Panel
This option shows or hides the instrument panel in the active chart window.
Current Rate Line
This option shows or hides the current rate line in the active chart window.
Grid Lines
This option shows or hides the vertical and horizontal grid lines in the active chart window.
© 2011 Visual Trading Systems, LLC
Task Windows
Status Line
This option shows or hides the status line in the active chart window.
Chart Toolbar
This option shows or hides the toolbar 124 in the active chart window.
3.5.3.3
Miscellaneous
The Miscellaneous subsection only contains one group: Miscellaneous.
Miscellaneous Group
© 2011 Visual Trading Systems, LLC
137
138
VT Trader 2.0 Help Manual
The Miscellaneous group contains the following options:
Auto-Size Y-Axis Min/Max Bounds
This option is a selection menu with two choices: Price and All Data. It defines what data is
considered for auto-sizing while the Auto-Size Y-Axis option is defined as Yes. The Price selection
auto-sizes the Y-Axis based on only the highest high price and lowest low price currently visible in
the active chart window's price frame. The All Data selection auto-sizes the Y-Axis based on the
highest high value and lowest low value of any data array currently visible in the price frame. For
example, if an attached indicator's value has a higher high value (and/or a lower low value) than the
price bars, then the indicator's value is used for the auto-sizing of the viewable data.
Right Margin
This option defines the width of the right margin of the active chart window. The Right Margin is the
offset (distance - in pixels) between instrument's current rate (price) and the right edge of the price
frame.
Auto-Size Y-Axis
This option enables or disables the Auto-Size Y-Axis property of the active chart window. While
Yes is chosen, the active chart window automatically resizes its price data (and indicator data, if
available) so it is shown with the highest high price (or indicator value) and lowest low price (or
indicator value) at the respective top and bottom of the viewable chart area based on the Auto-Size
Y-Axis Min/Max Bounds property. While No is chosen, you can manually control the scaling
(sizing) of the data in the viewable area of the chart window using the Zoom commands, the Y-Axis's
drag-and-drop zooming functionality, or the Y-Axis's Scale Settings.
Scale Price and Time to 1:1 Ratio
The option links the X-Axis and Y-Axis zoom levels in a 1:1 ratio. This means that 1 unit of time is
equal to 1 unit of price; the distance between each bar (or each candle's wick ) in the active chart
window is equal to the distance between each 1 pip of price change. While Yes is chosen, the XAxis and Y-Axis Zoom In/Out commands remain active, however, the chart will be zoomed in/out
according to the linked 1:1 ratio. Changing the X-Axis zoom level automatically changes the Y-Axis
zoom level accordingly (or vice versa) to maintain the 1:1 ratio. Additionally, the Area Zoom
command is disabled.
Auto-Scroll to Current Time
This option enables or disables the Auto-Scroll to Current Time property of the active chart
window. While Yes is chosen, the active chart window will always automatically move the chart's
price data to the instrument's most recent incoming price tick. While No is chosen, you can easily
perform technical analysis throughout the instrument's historical price data without the chart
automatically returning to the most recent price tick.
3.5.3.4
High/Low Zone
The High/Low Zone subsection only contains one group: High/Low Zone.
© 2011 Visual Trading Systems, LLC
Task Windows
139
High/Low Zone Group
The High/Low Zone group contains the following options:
Tick
This option defines the default high/low zone selection that is used in the active chart window while
you are viewing an instrument's Tick interval data.
1-Minute
This option defines the default high/low zone selection that is used in the active chart window while
you are viewing an instrument's 1-Minute interval data.
5-Minute
This option defines the default high/low zone selection that is used in the active chart window while
you are viewing an instrument's 5-Minute interval data.
© 2011 Visual Trading Systems, LLC
140
VT Trader 2.0 Help Manual
10-Minute
This option defines the default high/low zone selection that is used in the active chart window while
you are viewing an instrument's 10-Minute interval data.
15-Minute
This option defines the default high/low zone selection that is used in the active chart window while
you are viewing an instrument's 15-Minute interval data.
30-Minute
This option defines the default high/low zone selection that is used in the active chart window while
you are viewing an instrument's 30-Minute interval data.
1-Hour
This option defines the default high/low zone selection that is used in the active chart window while
you are viewing an instrument's 1-Hour interval data.
2-Hour
This option defines the default high/low zone selection that is used in the active chart window while
you are viewing an instrument's 2-Hour interval data.
4-Hour
This option defines the default high/low zone selection that is used in the active chart window while
you are viewing an instrument's 4-Hour interval data.
Daily
This option defines the default high/low zone selection that is used in the active chart window while
you are viewing an instrument's Daily interval data.
Weekly
This option defines the default high/low zone selection that is used in the active chart window while
you are viewing an instrument's Weekly interval data.
3.5.3.5
Cross Hair
The Cross Hair subsection is divided into two groups: Cross Hair and Cross Hair Labels.
© 2011 Visual Trading Systems, LLC
Task Windows
Cross Hair Group
The Cross Hair group contains the following options:
Horizontal Line Cursor
This option shows or hides the cross hair's horizontal line in the active chart window.
Vertical Line Cursor
This option shows or hides the cross hair's vertical line in the active chart window.
Horizontal Line Label
This option shows or hides the cross hair's horizontal line label in the active chart window.
Vertical Line Label
This option shows or hides the cross hair's vertical line label in the active chart window.
© 2011 Visual Trading Systems, LLC
141
142
VT Trader 2.0 Help Manual
Line Cursor Style
This option defines the style of the cross hair's horizontal and vertical lines in the active chart
window.
Line Cursor Color
This option defines the color of the cross hair's horizontal and vertical lines in the active chart
window. You can change the color by using the [...] button.
Cross Hair Labels Group
The Cross Hair Labels group contains the following options:
Fill Color
This option defines the color of the cross hair's horizontal line vertical line labels. You can change
the color by using the [...] button.
Border Color
This option defines the border color of the cross hair's horizontal line vertical line labels. You can
change the color by using the [...] button.
Border Width
This option defines the border width (in pixels) of the cross hair's horizontal line vertical line labels.
Font
This option defines the font attributes used for the cross hair's vertical and horizontal lines labels.
You can change the font attributes by using the [...] button.
3.5.4
Chart Types
VT Trader supports many of the most commonly used types of charts for performing technical analysis.
Please click on the chart type's name to learn more about it.
Japanese Candlesticks (Filled) 143
Japanese Candlesticks (Hollow) 143
Bars (O/H/L/C) 144
Bars 145
Line 146
Heikin-Ashi Candlesticks 147
Point & Figure 148
Renko 149
© 2011 Visual Trading Systems, LLC
Task Windows
143
Japanese Candlesticks (Filled)
Japanese Candlesticks charts show price data using the chart intervals Open, High, Low, and Close
prices.
Return to Chart Types 142
Japanese Candlesticks (Hollow)
Japanese Candlesticks charts show price data using the chart intervals Open, High, Low, and Close
prices. Candlesticks with a transparent fill are bull candles (Close>Open) and candlesticks with a color
fill are bear candles (Close<Open).
© 2011 Visual Trading Systems, LLC
144
VT Trader 2.0 Help Manual
Return to Chart Types 142
Bars (O/H/L/C)
O/H/L/C Bar charts show price data using the chart interval's Open, High, Low, Close prices. The small
lines protruding from the left and right sides of each bar represent the Open price (left protrusion) and
Close price (right protrusion).
© 2011 Visual Trading Systems, LLC
Task Windows
Return to Chart Types 142
Bars
Bar charts show price data using the chart interval's High and Low prices.
© 2011 Visual Trading Systems, LLC
145
146
VT Trader 2.0 Help Manual
Return to Chart Types 142
Line
Line charts show price data using only the chart interval's Close prices.
© 2011 Visual Trading Systems, LLC
Task Windows
147
Return to Chart Types 142
Heikin-Ashi Candlesticks
Heikin-Ashi Candlesticks charts (Heik in means "average" or "balance" in Japanese and Ashi means
"foot" or "bar") are modified versions of the Japanese candlesticks chart. They attempt to eliminate
irregularities often found in traditional candlesticks charts thereby offering a better visual representation
of trends and consolidations. Heikin-Ashi Candlesticks charts show price data using formulas based on
the chart interval's Open, High, Low, Close prices. The Heikin-Ashi prices are calculated using the
formulas:
haClose = (O+H+L+C)/4
haOpen = (haOpen (previous bar) + haClose (previous bar))/2
haHigh = Maximum(H, haOpen, haClose)
haLow = Minimum(L, haOpen, haClose)
The "open," "high," "low," and "close" referred to are of the current bar. The prefix ha- indicates the
corresponding Heikin-Ashi modified values. The "ha" values in the Data Inspection window correspond
to the Heikin-Ashi prices. The "ha" values are also visible in the chart window's scroll panel (in place of
the traditional O,H,L,C values) when the Chart Type is set to Heik in-Ashi Candlestick s.
© 2011 Visual Trading Systems, LLC
148
VT Trader 2.0 Help Manual
Return to Chart Types 142
Point and Figure
Point and Figure charts calculate and show price data using the defined Price, Box Size, and Reversal
Amount options. Point & Figure charts do not show time in a linear fashion. Each rising column of X's or
declining column of O's can represent varying amounts of time depending on the price movements.
© 2011 Visual Trading Systems, LLC
Task Windows
149
Return to Chart Types 142
Renko
Renko charts were introduced by Steve Nison. This charting method assumed its name from the
Japanese word "renga" meaning bricks.
Each brick is drawn in the direction of the prior price move only if a fixed amount (i.e. the box size) has
been exceeded. The bricks are always equal in size. For example, in a 10 unit Renko chart, a 40 point
rally is shown as four equally sized, 10 unit high Renko bricks.
To formulate Renko bricks, today's close price is compared with the high and low prices of the previous
brick. When the close price rises above the top of the previous brick by the specified box size or more,
one or more equal height, up bricks are drawn in the next column. If the close price falls below the
bottom of the previous brick by the specified box size or more, one or more equal height, down bricks
are drawn in the next column.
If the market moves up more than the amount required to draw one brick, but less than the amount
required to draw two bricks, only one brick is drawn. For example, in a 10 unit Renko chart, if the base
price is 1.2000 and the market moves to 1.2015, then one brick is drawn from the base price of 1.2000 1.2010. The rest of the move -- from 1.2010 to 1.2015 -- is not shown on the Renko chart. The same rule
applies anytime the price does not fall on a box size divisor.
Basic trend reversals are signaled with the emergence of an up or down brick. A new up brick indicates
the beginning of a new uptrend. A new down brick indicates the beginning of a new downtrend. Renko
charts are excellent for helping determine major support and resistance levels since their main purpose
is to define the underlying trend direction by filtering out minor price movements.
© 2011 Visual Trading Systems, LLC
150
VT Trader 2.0 Help Manual
Return to Chart Types 142
3.6
Desktop Workspaces Management
To best utilize the Desktop Managements Management window, it's necessary to first understand
what desk top work spaces are and how they function in VT Trader.
What is a desktop workspace?
Simply defined, a desk top work space is a predefined spatial arrangement of VT Trader windows that is
saved to a file that can then be (re)loaded quickly and easily. Desktop workspaces are saved as .
desktop files and stored in VT Trader's Data -> Desk tops folder.
What is the Desktop Workspaces Management Window?
You can use the Desktop Workspaces Template Management window to load (switch), rename,
clone, delete, restore, import, and export existing desk top work spaces. You can also restore any
existing desktop workspace back to VT Trader's "factory default" desk top work space configuration.
© 2011 Visual Trading Systems, LLC
Task Windows
151
The Desktop Workspaces window contains the following commands:
Switch
You can load (view) any of your saved desktop workspaces by using the Switch command's
selection menu.
Rename
This command allows you to change the name of the selected desk top work space.
Clone
This command creates a copy of the selected desk top work space. You must give the cloned
desk top work space a new name when prompted; it is not possible to save over an existing desk top
work space.
Delete
This command moves the selected desk top work space to the Windows Recycle Bin for deletion.
Restore
VT Trader automatically creates previous version backup files of the active desktop workspace
based on your settings for the Max # of Previous Versions and Auto-Save Periodicity (in minutes)
options in the Options window -> General section -> Desk top Work spaces subsection. You can
restore the active desktop workspace back to one of its previous states or back to VT Trader's
"factory default" state by using this command's selection menu. Only previous versions of the active
desktop workspace are shown in this selection menu. All previous versions created of any desktop
workspaces are saved into VT Trader's Data -> Desk tops -> Back ups folder.
Export
This command exports the selected desk top work space so that it can be saved in a designated
folder on your computer. Desk top Work spaces are saved with a .desktop file extension. An
exported desk top work space can be imported into VT Trader using the Import command.
© 2011 Visual Trading Systems, LLC
152
VT Trader 2.0 Help Manual
Import
This command imports VT Trader desktop workspace files previously saved in the .desktop format.
Note: You cannot import VT Trader 1.x desktop templates into any version of VT Trader 2.
3.7
Chart Templates Management
To best utilize the Chart Templates Management window, it's necessary to first understand what
chart templates are and how they function in VT Trader.
What is a chart template?
Simply defined, a chart template is a predefined set of properties, indicators, and trading systems
associated with a chart that can be saved to a file and then later assigned (loaded or applied) to one or
more chart windows quickly and easily. Please click here 131 to learn more about what chart properties
131 are included in each chart template. Chart templates are saved as .vtcharttpl files (short for "VT
chart template") and stored in VT Trader's Data -> ChartTemplates folder.
How do chart templates function in VT Trader?
There is a 3-level hierarchy that determines how chart templates, chart properties 131 , and per chart
elements' properties are applied to each chart.
Level 1 (highest level): Chart Template ->
Level 2: Custom Chart Properties ->
Level 3 (lowest level): Per Chart Elements’ Custom Properties
Each new chart window is opened with an assigned chart template; the chart template used for this
purpose is the "primary" chart template as defined in the Chart Templates Management window.
However, any time you modify a specific chart window's chart properties 131 that chart immediately
disassociates itself from any chart template and switches to using its own custom chart properties.
Working with drawing objects in a chart window does not affect the chart window's chart template
association should one exist. Additionally, any chart element that has custom properties assigned to it
will not be overwritten should a chart template be assigned to that chart window. For example, if you
change the color of a specific chart label in a chart window, that specific chart label would retain it
custom color if/when that chart window was assigned a chart template.
Please do not worry if this sounds complicated. VT Trader includes several detailed confirmation
messages (and error messages) to help guide your use of chart templates. You will always know
exactly how VT Trader is managing the chart template(s) and any associated chart windows as you
perform chart template-related actions.
© 2011 Visual Trading Systems, LLC
Task Windows
153
What is the Chart Template Management Window?
You can use the Chart Template Management window to rename, edit, clone, delete, import, and
export existing chart templates. You can also restore any existing chart template back to VT Trader's
"factory default" chart template configuration and define any chart template as the "primary" to be
applied to any newly opened any new chart window.
The Chart Template Management window contains the following commands:
Rename
This command allows you to change the name of the selected chart template.
Edit
This command allows you to make changes to the selected chart template's properties. Any
changes made to the selected chart template will be applied to the chart window(s) assigned to that
chart template.
Clone
This command creates a copy of the selected chart template. You must give the cloned chart
template a new name when prompted; it is not possible to save over an existing chart template.
Delete
This command moves the selected chart template to the Windows Recycle Bin for deletion. When
a chart template is deleted, all chart windows assigned to it immediately switch to using their own
custom chart properties 131 .
Export
© 2011 Visual Trading Systems, LLC
154
VT Trader 2.0 Help Manual
This command exports the selected chart template so that it can be saved in a designated folder on
your computer. Chart templates are saved with a .vtcharttpl file extension. An exported chart
template can be imported into VT Trader using the Import command.
Import
This command imports a chart template file that was previously exported from VT Trader. Importing
a chart template adds it to the Chart Template Management window's list. If a chart template with
the same Name already exists in VT Trader a (1) is appended to the imported chart template's name
to help distinguish it from the existing chart template.
Restore Default
This command modifies the selected chart template by restoring it back to VT Trader's "factory
default" chart template configuration.
Set as Primary
This command sets the selected chart template as the "primary". Each new chart window is opened
with this chart template assigned to it.
3.8
Technical (Chart) Analysis
3.8.1
Data Inspection Window
The Data Inspection window shows date/time, price, indicator data, and trading system data
associated with the active chart window.
This window consists of two columns: the Data column and the Value column. It also consists of
several rows that are visible at all times; the data shown in these rows correspond to the active chart
(type) being viewed. The Data Inspection window also shows the names and values of each indicator's
output variables (and/or Indicator Output Enabled trading system's output variables) currently attached
to the active chart (assuming their Hide In Inspect option is disabled).
Note: If the cursor is positioned over the currently forming candle, bar, Point and Figure X or O, or Renko
box the values in the Data Inspection window automatically update with the new, incoming values as
those new values become available (or are calculated). You do not need to move the cursor away from
© 2011 Visual Trading Systems, LLC
Task Windows
155
the currently forming bar or candle and then reposition it over top of that bar or candle again to view the
new, updated values.
Japanese Candlestick Charts and Bar Charts
If the active chart is a Japanese Candlestick chart (filled or hollow) or bar chart, the rows that always
remain visible show the following names in the Data column:
Date/Time/Price - shows the date, close time of bar/candle, and price (horizontal cross hair 240 price
value) under the current position of the cursor; the format is month/day/year time price (I.E.: 06/03/07
11:45 1.1234); this data changes as the cursor is moved around within the chart window
Open - shows the open price of the bar/candle under the current position of the cursor in the Value
column
High - shows the high price of the bar/candle under the current position of the cursor in the Value
column
Low - shows the low price of the bar/candle under the current position of the cursor in the Value column
Close - shows the close price of the bar/candle under the current position of the cursor in the Value
column
Heikin-Ashi Candlestick Charts
If the active chart is a Heikin-Ashi Candlestick chart, the rows that always remain visible show the
following names in the Data column:
Date/Time/Price - shows the date, close time of Heikin-Ashi candle, and price (horizontal cross hair 240
price value) under the current position of the cursor; the format is month/day/year time price (I.E.:
06/03/07 11:45 1.1234); this data changes as the cursor is moved around within the chart window
haOpen - shows the Heikin-Ashi open price of the candle under the current position of the cursor in the
Value column
haHigh - shows the Heikin-Ashi high price of the candle under the current position of the cursor in the
Value column
haLow - shows the Heikin-Ashi low price of the candle under the current position of the cursor in the
Value column
haClose - shows the Heikin-Ashi close price of the candle under the current position of the cursor in the
Value column
Point and Figure Charts
If the active chart is a Point and Figure chart, the rows that always remain visible show the following
© 2011 Visual Trading Systems, LLC
156
VT Trader 2.0 Help Manual
information in the Data column:
The Data column shows X or O depending on if the cursor is positioned over a column of X’s or O’s in
the active chart. A row will be shown in this window for each X or O in the column. In the Value column,
each X or O row will contain the Date/Time/Price of that X or O. The Value column data will have the
format of Date Time Price (I.E. 08/13/07 11:00 1.3700).
Renko Charts
If the active chart is a Renko chart, the rows that always remain visible show the following names in the
Data column:
Date/Time/Price - shows the date, close time of Renko box, and price (horizontal cross hair 240 price
value) under the current position of the cursor; the format is month/day/year time price (I.E.: 06/03/07
11:45 1.1234); this data changes as the cursor is moved around within the chart window
Box Number - shows the number of the Renko box (numbered from #1 - current number beginning with
left-most box shown in chart window) under the current position of the cursor in the Value column
Box High - shows the high price of the Renko box under the current position of the cursor in the Value
column
Box Low - shows the low price of the Renko box under the current position of the cursor in the Value
column
Appearance Customizations
Each column in the Data Inspection window can be automatically (or manually) resized at your
discretion.
To automatically resize one or more columns, position the cursor over any row and click the right mouse
button. You may select Size Columns to Fit or Auto-Size All Columns to Fit from the contextual menu
157 depending on the action you want to perform.
To manually resize a column, you must ensure the Auto-Size All Columns to Fit command is disabled
in the contextual menu, then click and hold down the left mouse button while the cursor is positioned
over the column divider directly to the right of the column you want to resize. The cursor will change and
© 2011 Visual Trading Systems, LLC
Task Windows
157
appear similar to this: <-|->. While the left mouse button is held down, move the mouse to the left or
right to resize the column.
You can customize the appearance of the window and its data by using the window's properties 158 .
Contextual Menu
The Data Inspection window's contextual menu 157 provides you with additional functionality and
access to the window's properties 158 . To activate the contextual menu 157 , click the right mouse button
while the cursor is positioned over any data row.
3.8.1.1
Contextual Menu
The Data Inspection window's contextual menu provides you with additional functionality and access to
the window's properties 158 . To activate the contextual menu, click the right mouse button while the
cursor is positioned over any data row.
The Data Inspection window's contextual menu contains the following commands:
Size Columns to Fit
This command sizes the window's columns to accommodate their data. This command is only
© 2011 Visual Trading Systems, LLC
158
VT Trader 2.0 Help Manual
enabled if the Auto-Size Columns to Fit command is disabled.
Auto-Size Columns to Fit
This command, while enabled, continuously auto-sizes the window's columns to accommodate their
data.
Properties
This command opens the Data Inspection properties 158 window.
Restore Default
This command resets any custom properties currently used in the Data Inspection window back to
their default values.
3.8.1.2
Properties
The Data Inspection properties window is divided into two sections: Appearance and Colors.
Appearance Section
© 2011 Visual Trading Systems, LLC
Task Windows
159
The Appearance section contains the following options:
Caption Font
This option defines the font attributes used for window's column captions. You can change the font
attributes by using the [...] button.
Data Font
This option defines the font attributes used for the the data shown in the window. You can change
the font attributes by using the [...] button.
Use Colors for Output Variables
This option is a selection menu with two choices: Yes and No. While Yes is chosen, output
variables' names and data values are shown in the Data Inspection window using their own colors.
While No is chosen, output variables' names and data values are shown using the color black.
Data Value Decimal Precision
This option defines the number of decimal places of precision shown in the output variables' data
values. This option applies to the Data Inspection window, indicator labels, and trading system
labels.
© 2011 Visual Trading Systems, LLC
160
VT Trader 2.0 Help Manual
Colors Section
The Colors section contains the following options:
Selection Highlight
This option defines the color the selected row in the window. You can change the color by using the
[...] button.
Background (Odd Row)
This option defines the background color of all odd-numbered rows in the window. You can change
the color by using the [...] button.
Background (Even Row)
This option defines the background color of all even-numbered rows in the window. You can change
the color by using the [...] button.
© 2011 Visual Trading Systems, LLC
Task Windows
3.9
Fundamental Analysis
3.9.1
Market Commentaries Window
161
The Market Commentaries window provides you with actionable analysis of news, events and technical
levels that impact currency prices - as it happens. Updates are published up to 20 times an hour by
Forex.com's senior traders and experienced research team.
You can read the news messages by clicking on the news headlines. The news message will be shown
in the bottom frame of the window or in a separate window if you have the Show Message in Separate
Window command enabled in the window's contextual menu 163 .
Explanations of Commentaries Data
Date/Time
The date and time that the commentary message was sent out is its Date/Time.
Title
The Title is a brief description of the new message's content.
Appearance Customizations
Each column of data in the Market Commentaries window can be automatically (or manually) resized,
moved, or hidden at your discretion.
To automatically resize one or more columns, position the cursor over any column caption and click the
right mouse button. You may select Size Column to Fit or Size All Columns to Fit from the contextual
menu depending on the action you want to perform.
© 2011 Visual Trading Systems, LLC
162
VT Trader 2.0 Help Manual
To manually resize a column, you must click and hold down the left mouse button while the cursor is
positioned over the column divider directly to the right of the column you want to resize. The cursor will
change and appear similar to this: <-|->. While the left mouse button is held down, move the mouse to
the left or right to resize the column.
It is also possible to change the location of each column respective to the other visible columns. Moving
a column can be accomplished by dragging and dropping the desired column into its new location after
clicking and holding down the left mouse button while the cursor is positioned over that column's
caption (Date, Title).
To hide one or more columns, position the cursor over any column caption and click the right mouse
button. Select any column from the contextual menu that you want to hide. Visible columns have a
check mark next to their caption name while hidden columns do not. To show a hidden column you
simply need to reselect it from the column caption's contextual menu.
You can further customize the appearance of the window and its data by using the window's properties
164 .
Contextual Menu
The Market Commentaries window's contextual menu 163 provides you with additional functionality and
access to the window's properties 164 . To activate the contextual menu 163 , click the right mouse button
while the cursor is positioned over any news row.
© 2011 Visual Trading Systems, LLC
Task Windows
3.9.1.1
163
Conextual Menu
The Market Commentaries window's contextual menu provides you with additional functionality and
access to the window's properties 164 . To activate the contextual menu, click the right mouse button
while the cursor is positioned over any news row.
The Market Commentaries window's contextual menu contains the following commands:
Properties
This command opens the Market Commentaries properties 164 window.
Restore Default
© 2011 Visual Trading Systems, LLC
164
VT Trader 2.0 Help Manual
This command resets any custom properties currently used in the Market Commentaries window
back to their default values.
Show Message in Separate Window
This command, while enabled, hides the bottom frame of the Market Commentaries window and
opens each new message you select in its own separate window.
3.9.1.2
Properties
The Market Commentaries properties window is divided into two sections: Appearance and Colors.
Appearance Section
The Appearance section contains the following options:
Caption Font
© 2011 Visual Trading Systems, LLC
Task Windows
165
This option defines the font attributes used for window's column captions. You can change the font
attributes by using the [...] button.
Data Font
This option defines the font attributes used for the the data shown in the window. You can change
the font attributes by using the [...] button.
Colors Section
The Colors section contains the following options:
Selection Highlight
This option defines the color the selected row in the window. You can change the color by using the
[...] button.
Background (Odd Row)
This option defines the background color of all odd-numbered rows in the window. You can change
the color by using the [...] button.
© 2011 Visual Trading Systems, LLC
166
VT Trader 2.0 Help Manual
Background (Even Row)
This option defines the background color of all even-numbered rows in the window. You can change
the color by using the [...] button.
New Incoming Headline
This option defines the background color of the most recent news headline's row. You can change
the color by using the [...] button.
3.9.2
Dow Jones News Window
The Dow Jones News window provides you with up-to-the-minute, real-time news from the Dow Jones
news service.
You can read the news messages by clicking on the news headlines. The news message will be shown
in the bottom frame of the window or in a separate window if you have the Show Message in Separate
Window command enabled in the window's contextual menu 168 .
Explanations of Dow Jones News Data
Date/Time
The date and time that the news message was sent out is its Date/Time.
© 2011 Visual Trading Systems, LLC
Task Windows
167
Title
The Title is a brief description of the new message's content.
Appearance Customizations
Each column of data in the Dow Jones News window can be automatically (or manually) resized,
moved, or hidden at your discretion.
To automatically resize one or more columns, position the cursor over any column caption and click the
right mouse button. You may select Size Column to Fit or Size All Columns to Fit from the contextual
menu depending on the action you want to perform.
To manually resize a column, you must click and hold down the left mouse button while the cursor is
positioned over the column divider directly to the right of the column you want to resize. The cursor will
change and appear similar to this: <-|->. While the left mouse button is held down, move the mouse to
the left or right to resize the column.
It is also possible to change the location of each column respective to the other visible columns. Moving
a column can be accomplished by dragging and dropping the desired column into its new location after
clicking and holding down the left mouse button while the cursor is positioned over that column's
caption (Date, Title).
To hide one or more columns, position the cursor over any column caption and click the right mouse
button. Select any column from the contextual menu that you want to hide. Visible columns have a
check mark next to their caption name while hidden columns do not. To show a hidden column you
simply need to reselect it from the column caption's contextual menu.
You can further customize the appearance of the window and its data by using the window's properties
© 2011 Visual Trading Systems, LLC
168
VT Trader 2.0 Help Manual
169 .
Contextual Menu
The Dow Jones News window's contextual menu 168 provides you with additional functionality and
access to the window's properties 169 . To activate the contextual menu 168 , click the right mouse button
while the cursor is positioned over any news row.
3.9.2.1
Contextual Menu
The Dow Jones News window's contextual menu provides you with additional functionality and access
to the window's properties 169 . To activate the contextual menu, click the right mouse button while the
cursor is positioned over any news row.
© 2011 Visual Trading Systems, LLC
Task Windows
169
The Dow Jones News window's contextual menu contains the following commands:
Properties
This command opens the Dow Jones News properties 169 window.
Restore Default
This command resets any custom properties currently used in the Dow Jones News window back
to their default values.
Show Message in Separate Window
This command, while enabled, hides the bottom frame of the Dow Jones News window and opens
each new message you select in its own separate window.
3.9.2.2
Properties
The Dow Jones News properties window is divided into two sections: Appearance and Colors.
Appearance Section
© 2011 Visual Trading Systems, LLC
170
VT Trader 2.0 Help Manual
The Appearance section contains the following options:
Caption Font
This option defines the font attributes used for window's column captions. You can change the font
attributes by using the [...] button.
Data Font
This option defines the font attributes used for the the data shown in the window. You can change
the font attributes by using the [...] button.
Colors Section
© 2011 Visual Trading Systems, LLC
Task Windows
171
The Colors section contains the following options:
Selection Highlight
This option defines the color the selected row in the window. You can change the color by using the
[...] button.
Background (Odd Row)
This option defines the background color of all odd-numbered rows in the window. You can change
the color by using the [...] button.
Background (Even Row)
This option defines the background color of all even-numbered rows in the window. You can change
the color by using the [...] button.
New Incoming Headline
This option defines the background color of the most recent news headline's row. You can change
the color by using the [...] button.
© 2011 Visual Trading Systems, LLC
172
3.9.3
VT Trader 2.0 Help Manual
Economic Calendar Window
The Economic Calendar window provides you with a recap of the FX market's weekly highlights and
economic indicator (news) data along with a chart showing round orbs above the candles corresponding
to the dates/times of the respective economic events.
By Clicking the Theme of the Week link, you can read the week's market highlights.
© 2011 Visual Trading Systems, LLC
Task Windows
173
By clicking the Previous Week 's Recap, Next Week 's Outlook , or Select Archive Week links, you can
read the archived market highlights, economic data, and expert commentary for that chosen week.
Clicking the + symbol in front of each economic indicator displays additional information about it.
© 2011 Visual Trading Systems, LLC
174
3.10
VT Trader 2.0 Help Manual
Alerts
3.10.1 Alerts Activity Window
The Alerts Activity window shows trading system alert messages if the "In Alerts Activity Window"
selection is chosen in the Show Trading Systems Alerts command in the Options 68 window.
Explanations of Alerts Activity Data
Date/Time
Date/Time is the date and time that the trading system alert was generated. Date/Time is shown
in the following format: Month/Day/Year Hour:Minute:Seconds AM/PM.
Type
Type defines the type of message (Alert) that was generated.
Message
© 2011 Visual Trading Systems, LLC
Task Windows
175
The Message is the details pertaining to the trading system condition(s) that generated the alert
message. The most recent incoming message is shown using a bold font attribute making it easy to
identify.
Appearance Customizations
Each column of data in the Alerts Activity window can be automatically (or manually) resized, moved, or
hidden at your discretion.
To automatically resize one or more columns, position the cursor over any column caption and click the
right mouse button. You may select Size Column to Fit or Size All Columns to Fit from the contextual
menu depending on the action you want to perform.
To manually resize a column, you must click and hold down the left mouse button while the cursor is
positioned over the column divider directly to the right of the column you want to resize. The cursor will
change and appear similar to this: <-|->. While the left mouse button is held down, move the mouse to
the left or right to resize the column.
It is also possible to change the location of each column respective to the other visible columns. Moving
a column can be accomplished by dragging and dropping the desired column into its new location after
clicking and holding down the left mouse button while the cursor is positioned over that column's
caption (Date/Time, Type, Message).
To hide one or more columns, position the cursor over any column caption and click the right mouse
button. Select any column from the contextual menu that you want to hide. Visible columns have a
check mark next to their caption name while hidden columns do not. To show a hidden column you
simply need to reselect it from the column caption's contextual menu.
You can customize the appearance of the window and its data by using the window's properties 177 .
Contextual Menu
The Alerts Activity window's contextual menu 176 provides you with additional functionality and access
to the window's properties 177 . To activate the contextual menu 176 , click the right mouse button while
the cursor is positioned over any message's row.
© 2011 Visual Trading Systems, LLC
176
VT Trader 2.0 Help Manual
3.10.1.1 Contextual Menu
The Alerts Activity window's contextual menu provides you with additional functionality. To activate the
contextual menu, click the right mouse button while the cursor is positioned over any message's row.
The Alerts Activity window's contextual menu contains the following commands:
Clear Log
This command erases the contents of the window.
Save Log
This command saves the contents of the window to a text file.
Select All
This command selects all of the messages shown in the window. This command it typically used in
conjunction with the Copy command.
Copy
This command saves the selected message(s) to the computer's clipboard so that you can paste
them into a text file and save them.
Properties
© 2011 Visual Trading Systems, LLC
Task Windows
177
This command opens the Alerts Activity properties 177 window.
Restore Default
This command resets any custom properties currently used in the Alerts Activity window back to
their default values.
3.10.1.2 Properties
The Alerts Activity properties window is divided into two sections: Appearance and Colors.
Appearance Section
The Appearance section contains the following options:
Caption Font
This option defines the font attributes used for window's column captions. You can change the font
© 2011 Visual Trading Systems, LLC
178
VT Trader 2.0 Help Manual
attributes by using the [...] button.
Data Font
This option defines the font attributes used for the the data shown in the window. You can change
the font attributes by using the [...] button.
Auto-Scroll Messages
This option is a selection menu with two choices: Yes and No. While Yes is chosen, the Alerts
Activity 174 window "jumps" to the newest message received. If you select one or more messages,
this option is temporarily disabled while the message(s) remain selected; this allows you easily view
and/or search through the messages without having to completely disable this option by choosing
No.
Colors Section
The Colors section contains the following options:
Selection Highlight
This option defines the color the selected row in the window. You can change the color by using the
© 2011 Visual Trading Systems, LLC
Task Windows
179
[...] button.
Background (Odd Row)
This option defines the background color of all odd-numbered rows in the window. You can change
the color by using the [...] button.
Background (Even Row)
This option defines the background color of all even-numbered rows in the window. You can change
the color by using the [...] button.
3.10.2 Price Alert Window
A price alert warns you that an instrument's current market price is interacting with the alert level you
defined. A price alert is shown in an instrument's chart window(s) as a small label attached to a
horizontal line at the price alert level. When a price alert is activated, you are notified by a small dialog
window attached to VT Trader's Notification Icon 58 , by a message shown in the Trading Activity 174
window, and by a sound file being played (if you define a sound file).
You can create new price alerts or edit existing price alerts using the Price Alert window.
The Price Alerts window contains the following options:
Instrument
This is the instrument associated with the price alert.
Price
This is the Instrument's price (bid or ask ) that the price alert is activated at.
Condition
This defines the condition used to activate the price alert as the instrument interacts with the price
© 2011 Visual Trading Systems, LLC
180
VT Trader 2.0 Help Manual
alert level. The price alert can be activated using seven different conditions: Price Crosses Level,
Price Crosses Above Level, Price Crosses Below Level, Price > Level, Price >= Level, Price < Level
, and Price <= Level. The cross conditions activate the price alert only for the price ticks that
actually cross above and/or below the alert level. The >, >=, < and <= conditions continuously
activates the price alert for every price tick that satisfies the respective condition.
Sound
This is the sound file that is played when the price alert is activated. You can choose any sound
from the selection menu or you can click the [...] button to choose any custom sound file (.mp3, .
wav, or .wma file formats are acceptable).
Comment
This lets you include additional remarks (comments) in the price alert's message notification.
3.10.3 Active Price Alerts Summary Window
A price alert warns you that an instrument's current market price is interacting with the alert level you
defined. A price alert is shown in an instrument's chart window(s) as a small label attached to a
horizontal line at the price alert level. When a price alert is activated, you are notified by a small dialog
window attached to VT Trader's Notification Icon 58 , by a message shown in the Alerts Activity 174
window, and by a sound file being played (if you define a sound file).
You can quickly review a summary of all of the active pending price alerts, create new price alerts, and
edit (or delete) existing price alerts using the Active Price Alerts Summary window.
Explanations of Active Price Alerts Summary Data
Instrument
This is the instrument associated with the price alert.
Price and Bid/Ask
© 2011 Visual Trading Systems, LLC
Task Windows
181
This is the Instrument's price (bid or ask ) that the price alert is activated at.
Comment
These are the additional remarks (comments) shown in the price alert's message notification.
Date/Time
This is the date and time that the price alert was created.
3.11
Active Trading Systems Summary
You can quickly review a list of all trading systems currently active (attached to chart windows) across
all of your accounts using the Active Trading Systems Summary window. By selecting an active
trading system and using the command buttons provided, you can adjust its properties 182 , edit 182 it
using a Trading Systems Editor 207 window, delete 182 it from the chart it is attached to, start/stop 182
its Auto-Trade mode, and view its events 182 and enabled parameters 182 .
The Active Trading Systems Summary window includes 5 columns for displaying information related
to the trading systems.
The Status column shows the operational mode of the trading system. Trading systems operating in
Auto-Trade mode show a [ ] icon while systems operating in Recommendation Only mode show a [II]
icon. The Instrument, Interval, and Bid/Ask columns show the instrument, chart interval, and chart
type that the trading system is attached to. The Name column shows the trading system's name and
input properties.
The Active Trading Systems Summary window also includes several command buttons that operate in
conjunction with the selected trading system.
© 2011 Visual Trading Systems, LLC
182
VT Trader 2.0 Help Manual
The [Properties] button opens an additional Trading Systems Properties window that allows you to
adjust the selected trading system's input variables' parameters and auto-trading parameters. This
command is not available if the trading system is operating in Auto-Trade mode.
The [Edit] button opens a Trading Systems Editor 207 window for the selected trading system. This
command is not available if the trading system is is operating in Auto-Trade mode.
The [Delete] button deletes the selected trading system from the chart it is attached to. If the trading
system is operating in Auto-Trade mode when when it is deleted, you will be responsible for managing
any positions that were opened previously (and not closed) by the now deleted trading system.
The [Start/Stop] button enables (starts) or disables (stops) Auto-Trade mode for the selected trading
system. If the selected trading system is operating in Auto-Trade mode (the button label will be [Stop]),
clicking this button will stop the trading system and switch it into Recommendation Only mode.
However, if the trading system is operating in Recommendation Only mode (the button label will be [
Start]), clicking this button will enable (start) Auto-Trade mode.
The [View Events] button opens an additional Trading System Events window that shows the selected
trading system's events that have taken place along with their corresponding dates/times.
The [Params Enabled] button opens an additional Trading Systems Parameters window containing a
list of the selected trading system's output variables and their respective function(s). Using the The
Trading Systems Parameters window, you can temporarily disable an output variable's function by
removing the check mark from its corresponding function column(s).
The [Close] button closes the Active Trading Systems Summary window.
3.12
Indicators Builder
The Indicators Builder is a unique component in VT Trader. Using the Indicators Builder, you can
create new, custom indicators and: edit, clone, delete, import, and export existing indicators. Icons
directly to the left of each indicator's name help you differentiate standard VT Trader indicators from your
custom indicators. Standard indicators included with VT Trader are identified with a gear (or sprock et)
icon. Custom indicators are identified by a gear+person icon.
© 2011 Visual Trading Systems, LLC
Task Windows
183
The Indicators Builder window contains the following commands:
New
This command begins the creation of a new custom indicator by opening an Indicator Editor 184
window.
Edit
This command allows you to make changes to the selected indicator by opening it in an Indicator
Editor 184 window.
Clone
This command creates a copy of the selected indicator and adds it to the indicator list with (2)
appended to the indicator name (to distinguish the copy from the original indicator).
Delete
This command moves the selected indicator to the Windows® Recycle Bin for deletion. If this
command is disabled, you must first edit the indicator by removing the check mark next to the
Protect from deletion option in the General Tab 192 of its Indicator Editor 184 window.
Export
This command exports the selected indicator so that it can be saved in a designated directory on
your computer. Indicators are saved with a .vtscr file extension. An exported indicator can be
imported into VT Trader using the Import command.
© 2011 Visual Trading Systems, LLC
184
VT Trader 2.0 Help Manual
Import
This command imports an indicator file that was previously exported from VT Trader with a .vtsrc file
extension. Importing an indicator adds it to the indicator list using the text in the Name field in the
General Tab 192 of its Indicator Editor 184 window. If an indicator with the same Name already exists
in VT Trader a (2) will be appended to the imported indicator's name to help distinguish it from the
existing indicator.
3.12.1 Indicator Editor Window
You can create new, custom technical indicators or edit existing technical indicators by using Indicator
Editor window. The window caption shows the name of the indicator being created or edited. For ease of
use, the Indicator Editor window consists of the Indicator Editor Toolbar 184 and several separate tabs
containing the various properties of the indicator.
To learn more about each of the Indicator Editor tabs, please click on its name below:
General Tab 192
Input Variable(s) Tab 195
Output Variable(s) Tab 200
Horizontal Line(s) Tab 202
Formula Tab 204
3.12.1.1 Indicator Editor Toolbar
The Indicator Editor Toolbar provides you quick, easy access to a variety of very useful editing-related
commands.
Explanations of Indicator Editor Toolbar Commands
Copy
This command copies the selected text to the PC's clipboard for later pasting.
Paste
This command inserts the contents of PC's clipboard into the active text box.
© 2011 Visual Trading Systems, LLC
Task Windows
185
Cut
This command cuts (removes) the selected text from the active text box and copies it to the PC's
clipboard for later pasting.
Undo
This command reverses the previous action such as deleting a line of code in the Formula tab.
Redo
This command reverses the previous Undo action.
Search
This command finds the partial word or whole word being searched for. For example, searching for H
would would find all occurrences of H and High in the formula code. You can also specify the search
direction (up or down). The search begins at the current cursor location and searches in the
specified direction. Each time an occurrence of the search word is found the window scrolls to the
text's location in the formula code and highlights it. Clicking the [Find Next] button continues
searching for more occurrences of the search word. When the search reaches the ending or
beginning of the formula code an additional dialog window is shown that asks if you want to continue
searching from that location.
Replace
This command extends the Search command's functionality by adding Replace and Replace All
commands. The Replace command find the partial word or whole word being searched for and
replaces it with the specified text. For example, searching for High in the formula code and replacing
the next occurrence with Low is accomplished by clicking the [Replace] button; replacing all
occurrences of High with Low using only one action is accomplished by clicking the [Replace All]
button. The search and replace begins at the current cursor location and searches in the specified
direction. Each time an occurrence of the search word is found the window scrolls to the text's
location in the formula code, highlights it, and replaces it. Clicking the [Find Next] button continues
searching for more occurrences of the search word. When the search reaches the ending or
beginning of the formula code an additional dialog window is shown that asks if you want to continue
searching from that location.
Editor Options
This command opens the Editor Options 186 window.
Save
This command saves any changes made to the indicator.
Close
This command closes and exits the Indicator Editor 184 window. If the indicator has unsaved
changes, you will be prompted to save the indicator before being able to close the window.
© 2011 Visual Trading Systems, LLC
186
VT Trader 2.0 Help Manual
3.12.1.1.1 Editor Options
The Editor Options window defines the options and properties used by the Indicator Editor 184 . This
window is divided into 3 tabs: General, Display, and Color.
In the General tab, you can enable or disable the Code Parameters and/or Code Completion features
used while typing text in the Indicator Editor's 184 Formula tab. Please click on these links to learn more
about the Code Parameters 187 and Code Completion 191 features.
In the Display tab, you can define the font type used while typing text in the Indicator Editor's 184
Formula tab.
© 2011 Visual Trading Systems, LLC
Task Windows
187
In the Color tab, you can define the font colors and attributes used while typing text in the Indicator
Editor's 184 Formula tab. Each type of text item can its own Back ground Color, Foreground Color, and
Font Attributes assigned to it.
Clicking the [OK] button saves your changes. Clicking the [Cancel] button closes the Editor Options
window without saving your changes.
3.12.1.1.1.1 Code Parameters
The Code Parameters feature shows a "hint" as you are typing the name of a function 329 . The Code
Parameters hint dialog shows which, if any, input types that function 329 requires and the order in which
those parameters should provided to the function 329 .
Using the mov() (moving average) function as an example, once you have typed "mov(" the Code
Parameters hint dialog shows [DATA ARRAY, PERIODS, METHOD].
© 2011 Visual Trading Systems, LLC
188
VT Trader 2.0 Help Manual
As you type each parameter, the next required parameter is indicated in Bold.
© 2011 Visual Trading Systems, LLC
Task Windows
Continuing...
© 2011 Visual Trading Systems, LLC
189
190
VT Trader 2.0 Help Manual
The hint dialog remains visible until the last required parameter has been typed then disappears allowing
you to continue writing your formula.
© 2011 Visual Trading Systems, LLC
Task Windows
191
3.12.1.1.1.2 Code Completion
The Code Completion feature is activated when you press the CTRL + SPACEBAR keys on your
keyboard. It shows a list of available functions 329 (or data arrays) in a selection menu for you to choose
from while you are typing your formula. The Code Completion feature is best used in conjunction with
the Code Parameters feature.
For example, let's assume that you want to use the mov() (moving average) function, but you cannot
remember the function's full name. Once you have typed "m" you press the CTRL + SPACEBAR keys
to activate the Code Complete feature for assistance. The Code Complete feature shows a list of every
function that starts with the letter "m".
© 2011 Visual Trading Systems, LLC
192
VT Trader 2.0 Help Manual
Once you have made your selection, it is inserted into the formula. The Code Completion dialog then
disappears allowing you to continue writing your formula.
3.12.1.2 General Tab
The Indicator Editor's 184 General tab defines the indicator's basic attributes.
© 2011 Visual Trading Systems, LLC
Task Windows
193
Explanations of General Tab's Items
Name
The Name identifies the indicator throughout VT Trader. The indicator's Name is used in the
Indicators Builder 182 , Indicator Editor 184 window, Indicators Quick List 235 , and in the Add Indicator
window shown when attaching an indicator to a chart window.
Function Name Alias
The Function Name Alias makes it possible to refer to the indicator and its formula from within
other indicators and trading systems. For example, in the formula script of your custom indicator
you could reference the standard RSI indicator using its Function Name Alias of vt_RSI. It's
important when referencing an existing indicator that you provide the function any necessary input
arguments it requires; these arguments are the input variables from the referenced indicator's Input
Variable(s) tab 195 . The vt_RSI() function requires two such arguments: pr (DATA ARRAY type) and
tpr (INTEGER type). The resulting function for a 14-period RSI of close prices when referenced in
your custom indicator's formula looks like this:
vt_RSI(close,14)
The output returned by an indicator's Function Name Alias differs depending on how many output
© 2011 Visual Trading Systems, LLC
194
VT Trader 2.0 Help Manual
variables the referenced indicator's Output Variable(s) tab 200 includes. In our example, the standard
RSI indicator only includes one output variable called RSIndex (its Var Name). If the indicator being
referenced by its Function Name Alias has more than one output variable, you need to specify
which output variable you want to reference by including a . (period) after the Function Name Alias
followed by the output variable's Var Name. For example, the standard MACD indicator has three
output variables: FL, SL, and OsMA. To reference the standard MACD's Fast Line (FL) you must
use its Function Name Alias of vt_MACD along with all of its function parameters followed by .FL.
It looks like this:
vt_MACD(C,12,26,E,9,E).FL
Please note: Any function's arguments can be made adjustable by creating the necessary input
variables (of the correct type(s)) in your custom indicator's Input Variable(s) tab 195 and replacing
their non-adjustable argument values in the function with the newly created input variable(s)'s Name
(s).
The Function Name Alias is not case-sensitive; for example, using vt_RSI is the same as using
vt_rsi. It may include only letters and numbers. Use of the underscore ( _ ) character is also
allowed. It may not include any spaces or begin with a number. The Function Name Alias is used
as the actual file name for the indicator when it is saved. If an existing indicator with the same
Function Name Alias is found on the your PC VT Trader shows a warning dialog notifying you of
the conflict when you attempt to save the indicator. You must resolve the naming conflict before you
will be able to save the indicator.
Label Mask
The Label Mask multiple-line text box can be used to help identify the indicator while it is attached
to a chart window. It is possible to include the name of the indicator, the values of input variables,
the current value of output variables, and/or any other desired text in the indicator's label. The Label
Mask can show multiple lines of text; you can use the Enter (or Return) key to separate the
information into multiple lines of text.
To show the value of an input variable in the indicator's label it is necessary to type the input
variable's name (as defined by the Name in the Input Variable(s) tab 195 ) between % characters. To
include the value of an output variable in the indicator's label it is necessary to type the output
variable's name (as defined by the Var Name in the Output Variable(s) tab 200 ) between %
characters.
Placement
The Placement selection menu defines the default placement of the indicator while it is attached to
a chart window. If Price Frame is chosen, the indicator will be shown in the main price area frame. If
New Frame is chosen, the indicator will be shown in a separate, additional frame. If Inquiry for
placement is chosen, you will be prompted to choose the location that the indicator will be shown in
when you attempt to attach it to the chart window. You can choose a separate, additional frame or
an already existing frame. The dialog window's frame list defines all frames that are already shown in
the chart window (the existing frames are numbered Frame 1, Frame 2, Frame 3, etc. from the topdown as shown in the chart window; the main price frame is labeled as Price Frame).
If Inquiry for placement is defined for a number of indicators those indicators can be shown in the
same frame. This might be useful if/when you want to analyze the same indicator but with different
values of input variables. Additionally, it is possible to show several different indicators in the same
frame, however, it's very important that take into account how each indicator scales. It does not
© 2011 Visual Trading Systems, LLC
Task Windows
195
make sense to place two or more indicators into one frame if the units of measurement of at least
one of them is incomparable to those of other indicators. For example, the RSI and Slow Stochastic
both scale from 0 -100 so it would be acceptable to show those indicators within the same frame if
you chose to do so. However, displaying the RSI and the MACD in the same frame would be a bad
idea since their scales are very different.
Data Inspection Alias
The Data Inspection Alias identifies the indicator (and its output variable(s)) in the Data Inspection
154 window while the indicator is attached to the chart window.
Protect from Deletion
The Protect from deletion option prevents accidental deletion of the indicator. This option is
enabled by default when a new indicator is created. It is not possible to delete the indicator from the
Indicators Builder 182 while the Protect from deletion option is enabled (the [Delete] button is
disabled while the indicator is selected). Disabling the Protect from deletion option by removing
the check mark next to it allows the indicator to be deleted.
Notes
The Notes provides additional information relating to the indicator. This may be any kind of
information considered useful. Typically, a description of the indicator as well as suggested methods
of use and references to the appropriate documentation will be provided in the Notes.
Password
You may supply a Password (a phrase or combination of letters and numbers) to keep the
indicator's formula and main properties confidential thus protecting it from accidental or purposeful
editing. The Password must confirmed in the Confirm Password text box before it can be applied.
If a Password has been supplied when someone tries to edit the indicator he/she will be prompted
to provide it. If the Password is not typed correctly, it will not be possible to edit the indicator.
Confirm Password
The Password must be successfully retyped in the Confirm Password text box before it can be
applied.
3.12.1.3 Input Variable(s) Tab
To best utilize the Indicator Editor's 184 Input Variable(s) tab, it's necessary to understand what input
variables are and how they are used in VT Trader's scripting language.
What are input variables and how do I use them?
Simply defined, an input variable is a value that you provide to the formula script. VT Trader's scripting
language uses the input variables' values while evaluating expressions and/or performing calculations.
Input variables (and their Default values) are included in the Indicator Properties window. This properties
window is used to modify an indicator's properties while it is attached to a chart window.
Input variables are often used to allow you to change the values of a function's arguments, or perform
© 2011 Visual Trading Systems, LLC
196
VT Trader 2.0 Help Manual
actions such as selecting, enabling, or disabling (via enumeration lists) specific parameters or
conditions used by an indicator without the need to edit its formula script. For example, the Relative
Strength Index (RSI) 656 indicator included with VT Trader uses two input variables: Price (Name = pr)
and Periods (Name = tpr). These two input variables allow you to specify the predefined price data array
and number of periods used to calculate the RSI. You provide these values to the formula script from the
RSI's properties window when you add the RSI to the chart window (or change the RSI's properties while
it is attached to the chart window).
What is the Input Variable(s) Tab?
The Indicator Editor's 184 Input Variable(s) tab defines any input variables used in the formula script.
You can create as many new input variables as necessary.
Clicking the [New] button creates a new input variable. Clicking the [Delete] button deletes the selected
input variable. Clicking the [Move Up] or [Move Down] button moves the input variable's respective
position up or down in the tab's variable list as as well as up or down in the indicator's or trading
system's properties window.
Explanations of Input Variable(s) Tab's Items
Read Only
© 2011 Visual Trading Systems, LLC
Task Windows
197
While enabled, the input variable's value in the indicator's properties window will be a read-only value
that cannot be changed. Enabling this option is useful if you want to see the input variable's Display
Name and Default value in the properties window, but you do not need to be able to change its
value (or you do not want others to be able to change it).
Name
The Name makes it possible to refer to the input variable and its value from within the formula script.
The Name is not case-sensitive; for example, using Periods is the same as using periods. It may
include only letters and numbers. Use of the underscore ( _ ) character is also allowed. It may not
include any spaces or begin with a number. An input variable's Name must not be the same name
as any other existing input variable, existing function 334 or reserved function 400 , constant 333 , or
predefined data array 334 . Additionally, no input variables 195 should have the same Name as any
output variables' 200 Var Name(s) within the same formula script.
Display Name
The Display Name is the text shown in the indicator's properties window to identify the input
variable. This text should be descriptive enough that it is easy to understand what the input variable
is and what Type of value you need to provide when you are attaching the indicator to the chart
window (or changing its properties while it is attached to the chart window).
Type
An input variable must be defined as a certain Type of variable. The Type value defines what type of
data can be used as the input variable's Default value. The variable's Type selection is also used by
the formula script; Type defines what type of data the formula script should expect to process when
the input variable's value is passed into the scripting engine. An input variable can provide the
formula script with any any of the following types of data: integer, integer (with bounds), float, float
(with bounds), price, MA type, Enumeration, and Bars Forward. Please click here 198 to learn more
about each input variable Type.
Default
The Default value is the initial value of the input variable shown in the indicator's properties window;
however, this value can be changed as needed (assuming the input variable's Read-Only option is
disabled). The Default value is provided to the formula script along with the input variable's Type.
The formula script uses this value while evaluating any expressions and/or performing any
calculations that require the input variable's value.
Min Bounds
The Min Bounds value defines the lowest value that can be used for the Default value. Min Bounds
is only available if the integer (with bounds), float (with bounds), or Bars Forward variable Type is
selected.
Max Bounds
The Max Bounds value defines the highest value that can be used for the Default value. Max
Bounds is only available if the integer (with bounds), float (with bounds), or Bars Forward variable
Type is selected.
© 2011 Visual Trading Systems, LLC
198
VT Trader 2.0 Help Manual
3.12.1.3.1 Type
An input variable must be defined as a certain Type 195 of variable. The Type 195 of the variable defines
what type of data can be used as the input variable's Default 195 value. The variable's Type 195 selection
is also used by the formula script; Type 195 defines what type of data the formula script should expect to
process when the input variable's value is passed into the scripting engine.
An input variable can provide the formula script with any any of the following types of data: integer,
integer (with bounds), float, float (with bounds), price, MA type, Enumeration, and Bars Forward. Please
continue reading to learn more about each input variable Type 195 .
Explanations of the Types of Input Variables
Integer
An input variable of the Integer Type 195 can be any positive or negative whole number (..., -2, -1, 0,
1, 2, ..., and so on...).
Integer (with bounds)
© 2011 Visual Trading Systems, LLC
Task Windows
199
An input variable of the Integer (with bounds) Type 195 can be any positive or negative whole
number between the defined Min. Bounds 195 and Max. Bounds 195 values.
Float
An input variable of the Float Type 195 can be any positive or negative number rounded out to 5
decimal places.
Float (with bounds)
An input variable of the Float (with bounds) Type 195 can be any positive or negative number
rounded out to 5 decimal places between the defined Min. Bounds 195 and Max. Bounds 195 values.
Price
An input variable of the Price Type 195 can be any of the predefined data arrays 334 : close, open,
low, high, Median Price, Typical Price, Indicator (the value of an Indicator already attached to the
chart window 121 ), Volume, haOpen, haClose, haLow, or haHigh; "ha" values are price values
associated with the Heik in-Ashi Candlestick Chart Type).
MA Type
An input variable of the MA Type Type 195 can be any of the available moving average constants 333 :
Simple, Weighted, Exponential, Sine Weighted, Triangular, End Point, or Volume-Adjusted. The MA
Type selection is often used in conjunction with the built-in moving average function mov() 371 or
when it is desirable to apply a type of data smoothing (averaging) to the data array being analyzed.
Enumeration
An input variable of the Enumeration Type 195 can be any of the predefined values added to a
enumeration (selection) list. Before an enumeration list can be used, it must be populated. The
enumeration list can be populated (or edited) by clicking the [ ... ] button shown directly to the right
of the Default 195 value's text box while the Enumeration Type 195 is selected. An enumeration list
item may include only letters and numbers. Use of the underscore ( _ ) character is also allowed. It
may not include any spaces or begin with a number.
Important Note: Each item in the selection menu is assigned an internal list position number that
corresponds to their location in the list; the first item (top) in the enumeration list is assigned the
position number 0, the second item is assigned 1, the third item is assigned 2, etc. You must use
the list item's number (not its actual name shown in the enumeration list) in the formula script to
when constructing your expressions and conditions.
For example, let's assume that you have an indicator that includes a moving average and a moving
average of the moving average. Let's also assume that you would like to create some logic that
allows you to show (or hide) the moving average of the moving average. You can accomplish this by
using an Enumeration Type 195 input variable 195 called MaDisplay (its Name 195 ; "Display MA of
MA?" will be its Display Name 195 ) that includes two items in the list (from top-down): No, Yes. The
VT Trader formula script written in the Formula tab 204 could potentially look like this:
{5-period simple moving average of close prices}
MA := mov(C,5,S);
© 2011 Visual Trading Systems, LLC
200
VT Trader 2.0 Help Manual
{If MaDisplay is "Yes" (which has an assigned list position number of
1),
calculate and show a 5-period MA of the 5-period MA of close prices}
MA_of_MA := if(DisplayMA=1, mov(MA,5,S), NULL);
In this example, MA and MA_of_MA would be the output variables 200 defined in the Output Variable
(s) tab 200 .
Another good example demonstrating the use of an enumeration list is found in VT Trader's Rate of
Change (ROC) 648 indicator. Its Calculation Method input variable 195 uses an enumeration list
allowing you to specify if the ROC 648 is calculated in Points or Percent.
Bars Forward
An input variable of the Bars Forward Type 195 can be can be any positive or negative whole
number between the defined Min. Bounds 195 and Max. Bounds 195 values. The Bars Forward Type
195 is used in conjunction with the scripting language's ref() 377 function to visually shift the resulting
calculation plot forward ahead of the current market or backwards behind the current market price by
the number of bars specified. Important Note: The Bars Forward Type 195 should only be used for
visual reference. It is not possible for a trading system to generate alerts in real-time (or request
orders automatically if it's running in Auto-Trade mode) for any condition that uses a variable or value
that has been shifted behind the current market price (i.e. a negative Bars Forward value).
A good example demonstrating the use of the Bars Forward Type 195 is found in VT Trader's
Moving Average 585 indicator. Its Horizontal Shift input variable 195 uses the Bars Forward Type 195
allowing you to visually shift the moving average's plot forward ahead of the current market price.
Another good example demonstrating the use of the Bars Forward Type 195 is the Chaos Alligator
Indicator 453 .
3.12.1.4 Output Variable(s) Tab
To best utilize the Output Variable(s) tab, it's necessary to first understand what output variables are
and how they are used in VT Trader's scripting language 329 .
What are output variables and how do I use them?
Simply defined, an output variable is the resulting calculated value of a statement in the formula script.
Output variables are often, but not always, the final calculation of an indicator.
What is the Output Variable(s) Tab?
Most indicators and trading systems include multiple output variables, some variables' values you might
need to be able to visually examine and others you might not. You can use the Indicator Editor's 184
Output Variable(s) tab to define only those output variables used in the formula script that you need to
see the resulting values of in a chart window and in the Data Inspection 154 window. You can define as
many output variables in the Output Variable(s) tab as necessary.
For example, the Relative Strength Index (RSI) 656 indicator included with VT Trader defines only one
© 2011 Visual Trading Systems, LLC
Task Windows
201
specific output variable: (RSI) (Var Name = RSIndex). This output variable makes it possible to visually
inspect its resulting calculations in a chart window (according to the indicator's Placement 192 selection)
and in the Data Inspection 154 window (according to its Name and shown next to the indicator's Data
Inspection Alias 192 ).
Clicking the [New] button creates a new output variable. Clicking the [Delete] button deletes the
selected output variable. Clicking the [Move Up] or [Move Down] button moves the output variable's
respective position up or down in the tab's variable list as as well as up or down in the Data Inspection
154 window (relative to the indicator's other output variables shown in that window).
Explanations of Input Variable(s) Tab's Items
Var Name
The Var Name makes it possible to refer to the output variable and its calculated value within the
formula script. The Var Name is not case-sensitive; for example, using Output_Variable is the
same as using output_variable. It may include only letters and numbers. Use of the underscore ( _ )
character is also allowed. It may not include any spaces or begin with a number. An output
variable's Var Name must not be the same name as any other existing output variable, existing
function 334 or reserved function 400 , constant 333 , or predefined data array 334 . Additionally, no
output variables 200 should have the same Var Name(s) as any input variables' 195 Name(s) within
the same formula script.
© 2011 Visual Trading Systems, LLC
202
VT Trader 2.0 Help Manual
Name
The Name is the text shown in the Data Inspection 154 window to identify the output variable; it is
shown next to the indicator's Data Inspection Alias 192 . This text should be descriptive enough that it
is easy to understand what information the output variable is providing.
Line Color
The Line Color defines the output variable's default line color while the indicator is attached to the
chart window. It is also the color used to show the output variable's Name and calculated value in
the Data Inspection 154 window (if the "Use Colors for Output Variables" option is enabled for that
window). The Line Color can be changed using the indicator's properties window when you add the
indicator to the chart window (or change the indicator's properties while it is attached to the chart
window).
Line Width
The Line Width defines the output variable's default line width while the indicator is attached to the
chart window. The Line Width may be changed using the indicator's properties window when you
add the indicator to the chart window (or change the indicator's properties while it is attached to the
chart window).
Line Style
The Line Style defines the output variable's default line style while the indicator is attached to the
chart window. This color may be changed using the indicator's properties window when you add the
indicator to the chart window (or change the indicator's properties while it is attached to the chart
window). The Line Style can be changed using the indicator's properties window when you add the
indicator to the chart window (or change the indicator's properties while it is attached to the chart
window).
Hide in Inspect
While enabled, the output variable's Name and corresponding value is not shown in the Data
Inspection 154 window. Enabling this option is useful if you want to see the output variable's value in
the chart window, but you do not need (or want) to see it in the Data Inspection 154 window.
3.12.1.5 Horizontal Line(s) Tab
The Indicator Editor's 184 Horizontal Line(s) tab defines any horizontal levels and their default properties
used in the indicator. You may create as many horizontal lines as is necessary. As a general rule, the
Horizontal Line(s) tab proves most useful for indicators designed to be shown in separate frames in the
chart window. However, horizontal lines can be included in and/or applied to any indicator. For example,
the Relative Strength Index (RSI) 656 indicator included with VT Trader defines 3 default horizontal lines:
+30.00000, +50.00000, and +70.00000.
© 2011 Visual Trading Systems, LLC
Task Windows
203
Clicking the [New] button creates a new horizontal line. Clicking the [Delete] button deletes the
selected horizontal line. Clicking the [Move Up] or [Move Down] button moves the selected horizontal
line's position up or down respectively in the list.
Explanations of Horizontal Line Tab's Items
Value
The Value defines the horizontal line's default placement while the indicator is attached to the chart
window. The Value may be positive or negative number rounded out to 5 decimal places.
Line Color
The Line Color defines the horizontal line's default color while the indicator is attached to the chart
window. The Line Color can be changed using the indicator's properties window when you add the
indicator to the chart window (or change the indicator's properties while it is attached to the chart
window).
Line Width
The Line Width defines the horizontal line's default width while the indicator is attached to the chart
window. The Line Width may be changed using the indicator's properties window when you add the
© 2011 Visual Trading Systems, LLC
204
VT Trader 2.0 Help Manual
indicator to the chart window (or change the indicator's properties while it is attached to the chart
window).
Line Style
The Line Style defines the horizontal line's default style while the indicator is attached to the chart
window. The Line Style can be changed using the indicator's properties window when you add the
indicator to the chart window (or change the indicator's properties while it is attached to the chart
window).
3.12.1.6 Formula Tab
The Indicator Editor's 184 Formula tab defines the VT Trader scripting language's 329 statements,
expressions, conditions, variables, etc. used in the calculation(s) of the resulting indicator. The Formula
Editor Toolbar 204 and Paste Function window 205 (continue reading below) are available to help aid
in the construction of your formula script. It is also recommended that you enable the Code Parameters
187 and Code Completion 191 features.
The Formula Editor Toolbar allows you to quickly comment 330 (or uncomment) text, insert any of the
scripting language's 329 punctuators 331 and operators 331 into the formula script, and open the Paste
Function window.
© 2011 Visual Trading Systems, LLC
Task Windows
205
The Paste Function window includes a full categorical listing of all of the available functions for use in
your formula script. These lists include all of the scripting language's 329 functions 334 as well as the
Function Name Aliases 192 of the standard VT Trader indicators and any of your custom indicators. The
Paste Function window also specifies the selected function's format and its arguments (if any). Lastly,
a full description of each function is also provided. Selecting a function from this window pastes it into
your formula script in the Formula tab.
3.13
Trading Systems Builder
A trading system, simply defined, consists of a concise set of non-emotional, objective rules based on
measurable factors that are used to describe when to buy and sell a trade instrument. A trading system
can generate various types of alerts based on pre-defined conditions and request automated trading
actions *** to be taken on those conditions.
*** Please note: Certain rules and restrictions apply to any trading system started in Auto-Trade
mode. It is STRONGLY recommended that you take a few minutes to read through the AutoTrading FAQ by clicking here 1148 . Please do not attempt to use any trading system in VT Trader
in Auto-Trade mode until you are absolutely certain that you fully understand the rules and
restrictions that govern trading systems' auto-trading functionality.
The Trading Systems Builder is a unique and significant component in VT Trader. You can create new
trading systems and: edit, clone, delete, import, and export existing trading systems using it. Icons
directly to the left of each trading system's name help you differentiate the VT Trader sample trading
systems from your custom trading systems. VT Trader sample trading systems are identified with a
gear (or sprock et) icon. Custom trading systems are identified by a gear+person icon.
© 2011 Visual Trading Systems, LLC
206
VT Trader 2.0 Help Manual
The Trading Systems Builder window contains the following commands:
New
This command begins the creation of a new custom trading system by opening an Trading System
Editor 207 window.
Edit
This command allows you to make changes to the selected trading system by opening it in an
Trading System Editor 207 window.
Clone
This command creates a copy of the selected trading system and adds it to the trading system list
with (2) appended to the trading system name (to distinguish the copy from the original trading
system).
Delete
This command moves the selected trading system to the Windows® Recycle Bin for deletion. If this
command is disabled, you must first edit the trading system by removing the check mark next to
the Protect from deletion option in the General Tab 214 of its Trading System Editor 207 window.
Export
This command exports the selected trading system so that it can be saved in a designated directory
on your computer. Trading systems are saved with a .vttrs file extension. An exported trading
system can be imported into VT Trader using the Import command.
© 2011 Visual Trading Systems, LLC
Task Windows
207
Import
This command imports a trading system file that was previously exported from VT Trader with a .
vttrs file extension. Importing a trading system adds it to the trading system list using the text in
the Name field in the General Tab 214 of its Trading System Editor 207 window. If a trading system
with the same Name already exists in VT Trader a (2) will be appended to the imported trading
system's name to help distinguish it from the existing trading system.
3.13.1 Trading System Editor Window
You can create new, custom trading systems or edit existing trading systems by using Trading
System Editor window. The window caption shows the name of the trading system being created or
edited. For ease of use, the Trading System Editor window consists of the Trading System Editor
Toolbar 184 and several separate tabs containing the various properties of the trading system.
To learn more about each of the Trading System Editor tabs, please click on its name below:
General Tab 214
Input Variable(s) Tab 216
Output Variable(s) Tab 221
Formula Tab 233
3.13.1.1 Trading System Editor Toolbar
The Trading System Editor Toolbar provides you quick, easy access to a variety of very useful editingrelated commands.
Explanations of Trading System Editor Toolbar Commands
Copy
This command copies the selected text to the PC's clipboard for later pasting.
Paste
This command inserts the contents of PC's clipboard into the active text box.
Cut
This command cuts (removes) the selected text from the active text box and copies it to the PC's
© 2011 Visual Trading Systems, LLC
208
VT Trader 2.0 Help Manual
clipboard for later pasting.
Undo
This command reverses the previous action such as deleting a line of code in the Formula tab.
Redo
This command reverses the previous Undo action.
Search
This command finds the partial word or whole word being searched for. For example, searching for H
would would find all occurrences of H and High in the formula code. You can also specify the search
direction (up or down). The search begins at the current cursor location and searches in the
specified direction. Each time an occurrence of the search word is found the window scrolls to the
text's location in the formula code and highlights it. Clicking the [Find Next] button continues
searching for more occurrences of the search word. When the search reaches the ending or
beginning of the formula code an additional dialog window is shown that asks if you want to continue
searching from that location.
Replace
This command extends the Search command's functionality by adding Replace and Replace All
commands. The Replace command find the partial word or whole word being searched for and
replaces it with the specified text. For example, searching for High in the formula code and replacing
the next occurrence with Low is accomplished by clicking the [Replace] button; replacing all
occurrences of High with Low using only one action is accomplished by clicking the [Replace All]
button. The search and replace begins at the current cursor location and searches in the specified
direction. Each time an occurrence of the search word is found the window scrolls to the text's
location in the formula code, highlights it, and replaces it. Clicking the [Find Next] button continues
searching for more occurrences of the search word. When the search reaches the ending or
beginning of the formula code an additional dialog window is shown that asks if you want to continue
searching from that location.
Editor Options
This command opens the Editor Options 209 window.
Save
This command saves any changes made to the trading system.
Close
This command closes and exits the Trading System Editor 207 window. If the trading system has
unsaved changes, you will be prompted to save the trading system before being able to close the
window.
© 2011 Visual Trading Systems, LLC
Task Windows
209
3.13.1.1.1 Editor Options
The Editor Options window defines the options and properties used by the Trading System Editor 207 .
This window is divided into 3 tabs: General, Display, and Color.
In the General tab, you can enable or disable the Code Parameters and/or Code Completion features
used while typing text in the Trading System Editor's 207 Formula tab. Please click on these links to
learn more about the Code Parameters 210 and Code Completion 213 features.
In the Display tab, you can define the font type used while typing text in the Trading System Editor's 207
Formula tab.
In the Color tab, you can define the font colors and attributes used while typing text in the Trading
System Editor's 207 Formula tab. Each type of text item can its own Back ground Color, Foreground
© 2011 Visual Trading Systems, LLC
210
VT Trader 2.0 Help Manual
Color, and Font Attributes assigned to it.
Clicking the [OK] button saves your changes. Clicking the [Cancel] button closes the Editor Options
window without saving your changes.
3.13.1.1.1.1 Code Parameters
The Code Parameters feature shows a "hint" as you are typing the name of a function 329 . The Code
Parameters hint dialog shows which, if any, input types that function 329 requires and the order in which
those parameters should provided to the function 329 .
Using the mov() (moving average) function as an example, once you have typed "mov(" the Code
Parameters hint dialog shows [DATA ARRAY, PERIODS, METHOD].
© 2011 Visual Trading Systems, LLC
Task Windows
As you type each parameter, the next required parameter is indicated in Bold.
© 2011 Visual Trading Systems, LLC
211
212
VT Trader 2.0 Help Manual
Continuing...
The hint dialog remains visible until the last required parameter has been typed then disappears allowing
you to continue writing your formula.
© 2011 Visual Trading Systems, LLC
Task Windows
213
3.13.1.1.1.2 Code Completion
The Code Completion feature is activated when you press the CTRL + SPACEBAR keys on your
keyboard. It shows a list of available functions 329 (or data arrays) in a selection menu for you to choose
from while you are typing your formula. The Code Completion feature is best used in conjunction with
the Code Parameters feature.
For example, let's assume that you want to use the mov() (moving average) function, but you cannot
remember the function's full name. Once you have typed "m" you press the CTRL + SPACEBAR keys
to activate the Code Complete feature for assistance. The Code Complete feature shows a list of every
function that starts with the letter "m".
© 2011 Visual Trading Systems, LLC
214
VT Trader 2.0 Help Manual
Once you have made your selection, it is inserted into the formula. The Code Completion dialog then
disappears allowing you to continue writing your formula.
3.13.1.2 General Tab
The Trading System Editor's 207 General tab defines the indicator's basic attributes.
© 2011 Visual Trading Systems, LLC
Task Windows
215
Explanations of General Tab's Items
Name
The Name identifies the trading system throughout VT Trader. The trading system's Name is used
in the Trading Systems Builder 205 , Indicator Editor 207 window, Trading Systems Quick List 236 , and
in the Add Trading System window shown when attaching an trading system to a chart window.
Function Name Alias
The Function Name Alias is used as the actual file name for the trading system when it is saved. It
is not case-sensitive; for example, using vt_RSI_Trading_System is the same as using
vt_rsi_trading_system. The Function Name Alias may include only letters and numbers. Use of the
underscore ( _ ) character is also allowed. It may not include any spaces or begin with a number. If
an existing trading system with the same Function Name Alias is found on the your PC VT Trader
shows a warning dialog notifying you of the conflict when you attempt to save the trading system.
You must resolve the naming conflict before you will be able to save the trading system.
Label Mask
The Label Mask multiple-line text box can be used to help identify the trading system while it is
attached to a chart window. It is possible to include the name of the trading system, the values of
input variables, the current value of output variables, and/or any other desired text in the trading
system's label. The Label Mask can show multiple lines of text; you can use the Enter (or Return)
key to separate the information into multiple lines of text.
© 2011 Visual Trading Systems, LLC
216
VT Trader 2.0 Help Manual
To show the value of an input variable in the trading system's label it is necessary to type the input
variable's name (as defined by the Name in the Input Variable(s) tab 216 ) between % characters. To
include the value of an output variable in the indicator's label it is necessary to type the output
variable's name (as defined by the Var Name in the Output Variable(s) tab 221 ) between %
characters.
Protect from Deletion
The Protect from deletion option prevents accidental deletion of the indicator. This option is
enabled by default when a new indicator is created. It is not possible to delete the indicator from the
Indicators Builder 182 while the Protect from deletion option is enabled (the [Delete] button is
disabled while the indicator is selected). Disabling the Protect from deletion option by removing
the check mark next to it allows the indicator to be deleted.
Notes
The Notes provides additional information relating to the trading system. This may be any kind of
information considered useful. Typically, a description of the trading system as well as suggested
methods of use and references to the appropriate documentation will be provided in the Notes.
Password
You may supply a Password (a phrase or combination of letters and numbers) to keep the trading
system's formula and main properties confidential thus protecting it from accidental or purposeful
editing. The Password must confirmed in the Confirm Password text box before it can be applied.
If a Password has been supplied when someone tries to edit the trading system he/she will be
prompted to provide it. If the Password is not typed correctly, it will not be possible to edit the
trading system.
Confirm Password
The Password must be successfully retyped in the Confirm Password text box before it can be
applied.
3.13.1.3 Input Variable(s) Tab
To best utilize the Trading System Editor's 207 Input Variable(s) tab, it's necessary to understand what
input variables are and how they are used in VT Trader's scripting language.
What are input variables and how do I use them?
Simply defined, an input variable is a value that you provide to the formula script. VT Trader's scripting
language uses the input variables' values while evaluating expressions and/or performing calculations.
Input variables (and their Default values) are included in the Trading Systems Properties window. This
properties window is used to modify the trading system's properties while it is attached to a chart
window.
Input variables are often used to allow you to change the values of a function's arguments, or perform
actions such as selecting, enabling, or disabling (via enumeration lists) specific parameters or
conditions used by an indicator or trading system without the need to edit its formula script. You provide
© 2011 Visual Trading Systems, LLC
Task Windows
217
these values to the formula script from the trading system's properties window when you add it to the
chart window (or change its properties while it is attached to the chart window).
What is the Input Variable(s) Tab?
The Trading System Editor's 207 Input Variable(s) tab defines any input variables used in the formula
script. You can create as many new input variables as necessary.
Clicking the [New] button creates a new input variable. Clicking the [Delete] button deletes the selected
input variable. Clicking the [Move Up] or [Move Down] button moves the input variable's respective
position up or down in the tab's variable list as as well as up or down in the trading system's properties
window.
Explanations of Input Variable(s) Tab's Items
Read Only
While enabled, the input variable's value in the or trading system's properties window will be a readonly value that cannot be changed. Enabling this option is useful if you want to see the input
variable's Display Name and Default value in the properties window, but you do not need to be able
to change its value (or you do not want others to be able to change it).
Name
© 2011 Visual Trading Systems, LLC
218
VT Trader 2.0 Help Manual
The Name makes it possible to refer to the input variable and its value from within the formula script.
The Name is not case-sensitive; for example, using Periods is the same as using periods. It may
include only letters and numbers. Use of the underscore ( _ ) character is also allowed. It may not
include any spaces or begin with a number. An input variable's Name must not be the same name
as any other existing input variable, existing function 334 or reserved function 400 , constant 333 , or
predefined data array 334 . Additionally, no input variables 216 should have the same Name as any
output variables' 221 Var Name(s) within the same formula script.
Display Name
The Display Name is the text shown in the trading system's properties window to identify the input
variable. This text should be descriptive enough that it is easy to understand what the input variable
is and what Type of value you need to provide when you are attaching the trading system to the
chart window (or changing its properties while it is attached to the chart window).
Type
An input variable must be defined as a certain Type of variable. The Type value defines what type of
data can be used as the input variable's Default value. The variable's Type selection is also used by
the formula script; Type defines what type of data the formula script should expect to process when
the input variable's value is passed into the scripting engine. An input variable can provide the
formula script with any any of the following types of data: integer, integer (with bounds), float, float
(with bounds), price, MA type, Enumeration, and Bars Forward. Please click here 218 to learn more
about each input variable Type.
Default
The Default value is the initial value of the input variable shown in the trading system's properties
window; however, this value can be changed as needed (assuming the input variable's Read-Only
option is disabled). The Default value is provided to the formula script along with the input variable's
Type. The formula script uses this value while evaluating any expressions and/or performing any
calculations that require the input variable's value.
Min Bounds
The Min Bounds value defines the lowest value that can be used for the Default value. Min Bounds
is only available if the integer (with bounds), float (with bounds), or Bars Forward variable Type is
selected.
Max Bounds
The Max Bounds value defines the highest value that can be used for the Default value. Max
Bounds is only available if the integer (with bounds), float (with bounds), or Bars Forward variable
Type is selected.
3.13.1.3.1 Type
An input variable must be defined as a certain Type 216 of variable. The Type 216 of the variable defines
what type of data can be used as the input variable's Default 216 value. The variable's Type 216 selection
is also used by the formula script; Type 216 defines what type of data the formula script should expect to
process when the input variable's value is passed into the scripting engine.
© 2011 Visual Trading Systems, LLC
Task Windows
219
An input variable can provide the formula script with any any of the following types of data: integer,
integer (with bounds), float, float (with bounds), price, MA type, Enumeration, and Bars Forward. Please
continue reading to learn more about each input variable Type 216 .
Explanations of the Types of Input Variables
Integer
An input variable of the Integer Type 216 can be any positive or negative whole number (..., -2, -1, 0,
1, 2, ..., and so on...).
Integer (with bounds)
An input variable of the Integer (with bounds) Type 216 can be any positive or negative whole
number between the defined Min. Bounds 216 and Max. Bounds 216 values.
Float
An input variable of the Float Type 216 can be any positive or negative number rounded out to 5
decimal places.
Float (with bounds)
An input variable of the Float (with bounds) Type 216 can be any positive or negative number
© 2011 Visual Trading Systems, LLC
220
VT Trader 2.0 Help Manual
rounded out to 5 decimal places between the defined Min. Bounds 216 and Max. Bounds 216 values.
Price
An input variable of the Price Type 216 can be any of the predefined data arrays 334 : close, open,
low, high, Median Price, Typical Price, Indicator (the value of an Indicator already attached to the
chart window 121 ), Volume, haOpen, haClose, haLow, or haHigh; "ha" values are price values
associated with the Heik in-Ashi Candlestick Chart Type).
MA Type
An input variable of the MA Type Type 216 can be any of the available moving average constants 333 :
Simple, Weighted, Exponential, Sine Weighted, Triangular, End Point, or Volume-Adjusted. The MA
Type selection is often used in conjunction with the built-in moving average function mov() 371 or
when it is desirable to apply a type of data smoothing (averaging) to the data array being analyzed.
Enumeration
An input variable of the Enumeration Type 216 can be any of the predefined values added to a
enumeration (selection) list. Before an enumeration list can be used, it must be populated. The
enumeration list can be populated (or edited) by clicking the [ ... ] button shown directly to the right
of the Default 216 value's text box while the Enumeration Type 216 is selected. An enumeration list
item may include only letters and numbers. Use of the underscore ( _ ) character is also allowed. It
may not include any spaces or begin with a number.
Important Note: Each item in the selection menu is assigned an internal list position number that
corresponds to their location in the list; the first item (top) in the enumeration list is assigned the
position number 0, the second item is assigned 1, the third item is assigned 2, etc. You must use
the list item's number (not its actual name shown in the enumeration list) in the formula script to
when constructing your expressions and conditions.
For example, let's assume that you have an indicator that includes a moving average and a moving
average of the moving average. Let's also assume that you would like to create some logic that
allows you to show (or hide) the moving average of the moving average. You can accomplish this by
using an Enumeration Type 216 input variable 216 called MaDisplay (its Name 216 ; "Display MA of
MA?" will be its Display Name 216 ) that includes two items in the list (from top-down): No, Yes. The
VT Trader formula script written in the Formula tab 233 could potentially look like this:
{5-period simple moving average of close prices}
MA := mov(C,5,S);
{If MaDisplay is "Yes" (which has an assigned list position number of
1),
calculate and show a 5-period MA of the 5-period MA of close prices}
MA_of_MA := if(DisplayMA=1, mov(MA,5,S), NULL);
In this example, MA and MA_of_MA would be output variables 200 (Indicator Output option enabled)
defined in the Output Variable(s) tab 221 .
Another good example demonstrating the use of an enumeration list is found in VT Trader's Rate of
Change (ROC) 648 indicator. Its Calculation Method input variable 216 uses an enumeration list
© 2011 Visual Trading Systems, LLC
Task Windows
221
allowing you to specify if the ROC 648 is calculated in Points or Percent.
Bars Forward
An input variable of the Bars Forward Type 216 can be can be any positive or negative whole
number between the defined Min. Bounds 216 and Max. Bounds 216 values. The Bars Forward Type
216 is used in conjunction with the scripting language's ref() 377 function to visually shift the resulting
calculation plot forward ahead of the current market or backwards behind the current market price by
the number of bars specified. Important Note: The Bars Forward Type 216 should only be used for
visual reference. It is not possible for a trading system to generate alerts in real-time (or request
orders automatically if it's running in Auto-Trade mode) for any condition that uses a variable or value
that has been shifted behind the current market price (i.e. a negative Bars Forward value).
A good example demonstrating the use of the Bars Forward Type 216 is found in VT Trader's
Moving Average 585 indicator. Its Horizontal Shift input variable 216 uses the Bars Forward Type 216
allowing you to visually shift the moving average's plot forward ahead of the current market price.
Another good example demonstrating the use of the Bars Forward Type 216 is the Chaos Alligator
Indicator 453 .
3.13.1.4 Output Variable(s) Tab
To best utilize the Output Variable(s) tab, it's necessary to first understand what output variables are
and how they are used in VT Trader's scripting language.
What are output variables and how do I use them?
Simply defined, an output variable is the resulting calculated value of a statement in the formula script. In
an indicator, output variables are often, but not always, the final calculation of an indicator. However, in a
trading system, an output variable can have one or more types of final outputs.
What is the Output Variable(s) Tab?
Most trading systems include multiple output variables, some variables' values you might need to be
able to visually examine and others you might not. You can use the Trading System Editor's 207 Output
Variable(s) tab (and its Variable Editor window) to define only those output variables used in the formula
script that are used to alert you to your specified trading conditions and/or that you need to see the
resulting values of in a chart window and in the Data Inspection 154 window. You can define as many
output variables in the Output Variable(s) tab as necessary.
© 2011 Visual Trading Systems, LLC
222
VT Trader 2.0 Help Manual
Clicking the [New] button creates a new input variable. Clicking the [Delete] button deletes the selected
input variable. Clicking the [Move Up] or [Move Down] button moves the input variable's respective
position up or down in the tab's variable list as as well as up or down in the trading system's properties
window.
The Output Variable(s) tab contains the following command buttons:
New
This command creates a new output variable.
Edit
This command opens the Output Variable Editor 223 window. Please click here to learn more about
the Output Variable Editor 223 window.
Delete
This command deletes the selected output variable.
Move Up / Move Down
This command moves the output variable's respective position up or down in the tab's variable list as
as well as up or down in the Data Inspection 154 window (relative to the trading system's other output
variables shown in that window).
© 2011 Visual Trading Systems, LLC
Task Windows
223
3.13.1.4.1 Output Variable Editor Window
The Output Variable Editor window is opened by clicking the [New] button or [Edit] button in the
Output Variable(s) 221 tab of the Trading System Editor 207 window. You can define or edit the default
properties of the selected output variable from this window. The Output Variable Editor window's
caption shows the Name of the trading system followed by the Name of the output variable being created
or edited. For ease of use, the Output Variable Editor window divided into several separate tabs
containing the output variable's various properties.
To learn more about each of the Output Variable Editor window's tabs, please click on its name below:
Name Tab 223
Graphic Tab 225
Highlights Tab 227
Trends Tab 227
Indicator Output Tab 229
Alerts 230
Trading 232
3.13.1.4.1.1 Name Tab
The Output Variable Editor's 223 Name tab defines the output variable's basic attributes and the type(s)
of output the variable provides.
© 2011 Visual Trading Systems, LLC
224
VT Trader 2.0 Help Manual
Clicking the [OK] button saves your changes. Clicking the [Cancel] button closes the Output Variable
Editor 223 window without saving your changes.
Explanations of Name Tab's Items
Var Name
The Var Name makes it possible to refer to the output variable and its value from within the formula
script. The Var Name is not case-sensitive; for example, using Buy_Signal is the same as using
buy_signal. It may include only letters and numbers. Use of the underscore ( _ ) character is also
allowed. It may not include any spaces or begin with a number. An output variable's Var Name
must not be the same name as any other existing output variable, existing function 334 or reserved
function 400 , constant 333 , or predefined data array 334 . Additionally, no output variables 221 should
have the same Var Name(s) as any input variables' 216 Name(s) within the same formula script.
Name
The Name identifies the output variable in the Data Inspection 154 window while the trading system
is attached to the chart window 121 .
Description
The Description provides additional information relating to the output variable. This may be any kind
of information considered useful. Typically, this is a description of the output variable (i.e. what it is
used for or what data it provides).
Graphic Enabled
This option shows a graphic in the price frame of the chart window 121 in real-time, with each new
incoming price tick, each time the output variable's 221 conditions are fulfilled according to the
formula script. The graphic is also shown throughout the historical charting data for each bar (or
candle) when the output variable's 221 conditions were fulfilled at the closing of that bar (or candle).
The Output Variable Editor's 223 Graphic 225 tab defines the default properties of the graphic.
Highlights Enabled
This option highlights (i.e. changes the color) of the bar (or candle) in the price frame of the chart
window 121 in real-time, with each new incoming price tick, each time the output variable's 221
conditions are fulfilled according to the formula script. The highlights are also shown throughout the
historical charting data for each bar (or candle) when the output variable's 221 conditions were fulfilled
at the closing of that bar (or candle). The Output Variable Editor's 223 Highlights 227 tab defines the
default properties of the highlight.
Trends Enabled
This option shows an additional "trends frame" at the bottom of the chart window 121 that changes
color in real-time, with each new incoming price tick, each time the output variable's 221 conditions
are fulfilled according to the formula script. The "trends frame" is also shown throughout the
historical charting data for each bar (or candle) when the output variable's 221 conditions were fulfilled
at the closing of that bar (or candle). The Output Variable Editor's 223 Trends 227 tab defines the
© 2011 Visual Trading Systems, LLC
Task Windows
225
default properties of the "trend frame". Note: If more than one output variable 221 is Trends Enabled,
all of the output variables 221 share the "trends frame".
Indicator Output
This option shows the output variable's 221 value in the chart window. The output variable's 221 value
recalculates in real-time, with each new incoming price tick, according to the formula script. The
output variable's 221 value is also shown throughout the historical charting data for each bar (or
candle) based on its value at the closing of that bar (or candle) each time the output variable's 221
conditions are fulfilled according to the formula script.
Enabling this option is often used to include the indicator(s) that the trading system's conditions are
based on directly in the trading system's formula script instead of having to attach the indicator(s) to
the chart window 121 separately for review. It can also be useful when trying to troubleshoot a trading
system's formula script and you need to be able to quickly determine what the output variable's
value is for each bar (or candle).
Alerts Enabled
This option shows a text message in the Trading Activity 174 window (or in the Trading Systems
Alerts window if the "Show Trading Systems Alerts 68 " option is defined as "In Trading Systems
Alerts Window") and plays an audio sound file in real-time, with each new incoming price tick, each
time the output variable's 221 conditions are fulfilled according to the formula script. The Output
Variable Editor's 223 Alerts 230 tab defines the default message and/or audio sound file of the alert.
Trading Enabled
This option automatically requests an order each time the output variable's 221 conditions are fulfilled
according to the formula script if the trading system is running in Auto-Trade mode. The Output
Variable Editor's 223 Trading 232 tab defines the default automated trading properties of the output
variable 221 .
Important Note(s): It is extremely important that you properly define the output variable's 221
automated trading properties in Trading 232 tab before attempting to run the trading system in AutoTrade mode. It is also strongly recommended that you read through the Auto-Trading FAQ for
Trading Systems 1148 page in this manual for some additional, important information about using
trading systems for automated trading purposes.
3.13.1.4.1.2 Graphic Tab
The Output Variable Editor's 223 Graphic tab defines the default graphic properties for the output variable
221 if its Graphic Enabled option is enabled in the Name 223 tab. The graphic is shown in the price frame
of the chart window 121 in real-time, with each new incoming price tick, each time the output variable's
221 conditions are fulfilled according to the formula script. It is also shown throughout the historical
charting data for each bar (or candle) when the output variable's 221 conditions were fulfilled at the closing
of that bar (or candle).
© 2011 Visual Trading Systems, LLC
226
VT Trader 2.0 Help Manual
Clicking the [OK] button saves your changes. Clicking the [Cancel] button closes the Output Variable
Editor 223 window without saving your changes.
Explanations of Graphic Tab's Items
Font
Font defines the graphic's default symbol while the trading system is attached to the chart window
121 . The available choices are the same as those items in the Symbols tool 246 .
Size
Size defines the graphic's default color while the trading system is attached to the chart window 121 .
The available choices are: Small, Medium, and Large.
Color
Color defines the graphic's default color while the trading system is attached to the chart window 121
. It is also the color used to show the output variable's 221 Name and calculated value in the Data
Inspection 154 window (if the "Use Colors for Output Variables" option is enabled for that window).
Symbol Position
You can choose to show the graphic above or below the bar (or candle) in the price frame of the
chart window 121 using the Symbol Position options.
© 2011 Visual Trading Systems, LLC
Task Windows
227
3.13.1.4.1.3 Highlights Tab
The Output Variable Editor's 223 Highlights tab defines the default bar (or candle) highlighting properties
for the output variable 221 if its Highlights Enabled option is enabled in the Name 223 tab. Highlights
change the color of the bar (or candle) in the price frame of the chart window 121 in real-time, with each
new incoming price tick, each time the output variable's 221 conditions are fulfilled according to the
formula script. The highlights are also shown throughout the historical charting data for each bar (or
candle) when the output variable's 221 conditions were fulfilled at the closing of that bar (or candle).
Clicking the [OK] button saves your changes. Clicking the [Cancel] button closes the Output Variable
Editor 223 window without saving your changes.
Explanations of Highlights Tab's Items
Color
Color defines the graphic's default default bar (or candle) highlighting color while the trading system
is attached to the chart window 121 .
3.13.1.4.1.4 Trends Tab
The Output Variable Editor's 223 Trends tab defines the default trends properties for the output variable
221 if its Trends Enabled option is enabled in the Name 223 tab. The trends frame is shown at the
bottom of the chart window 121 . It changes color in real-time, with each new incoming price tick, each
© 2011 Visual Trading Systems, LLC
228
VT Trader 2.0 Help Manual
time the output variable's 221 conditions are fulfilled according to the formula script. The trends frame is
also shown throughout the historical charting data for each bar (or candle) when the output variable's 221
conditions were fulfilled at the closing of that bar (or candle).
Clicking the [OK] button saves your changes. Clicking the [Cancel] button closes the Output Variable
Editor 223 window without saving your changes.
Explanations of Trends Tab's Items
Display Vertical Lines
This option shows a vertical line in the chart window 121 at the first bar (or candle) and the last bar
(or candle) that fulfills the output variable's 221 conditions according to the formula script while the
trading system is attached to the chart window 121 .
Background
Background defines the trends frame's default color while the trading system is attached to the
chart window 121 .
Pattern
Pattern defines the default pattern for the Background color in the trends frame while the trading
system is attached to the chart window 121 .
Symbol
© 2011 Visual Trading Systems, LLC
Task Windows
229
Symbol defines the trends frame's default symbol while the trading system is attached to the chart
window 121 . The available choices are the same as those items in the Symbols tool 246 .
Symbol Color
Symbol Color defines the trends frame graphic's default color while the trading system is attached
to the chart window 121 .
3.13.1.4.1.5 Indicator Output Tab
The Output Variable Editor's 223 Indicator Output tab defines the default properties for the output
variable 221 if its Indicator Output Enabled option is enabled in the Name 223 tab. The Indicator Output
is the output variable's 221 value shown in the chart window 121 . The output variable's 221 value
recalculates in real-time, with each new incoming price tick, according to the formula script. The output
variable's 221 value is also shown throughout the historical charting data for each bar (or candle) based
on its value at the closing of that bar (or candle) each time the output variable's 221 conditions are fulfilled
according to the formula script.
Clicking the [OK] button saves your changes. Clicking the [Cancel] button closes the Output Variable
Editor 223 window without saving your changes.
Explanations of Indicator Output Tab's Items
© 2011 Visual Trading Systems, LLC
230
VT Trader 2.0 Help Manual
Line Color
The Line Color defines the output variable's 221 default line color while the trading system is
attached to the chart window 121 . It is also the color used to show the output variable's 221 Name
and calculated value in the Data Inspection 154 window (if the "Use Colors for Output Variables"
option is enabled for that window).
Line Width
The Line Width defines the output variable's 221 default line width while the trading system is
attached to the chart window 121 .
Line Style
The Line Style defines the output variable's 221 default line style while the trading system is
attached to the chart window 121 . This color may be changed using the indicator's properties window
when you add the indicator to the chart window 121 (or change the indicator's properties while it is
attached to the chart window).
Placement
Placement defines the default frame in which the output variable's 221 value is shown. The available
choices are: Price Frame, Additional Frame 1, Additional Frame 2, Additional Frame 3, Additional
Frame 4, and Additional Frame 5. It is acceptable to show more than output variable 221 in the same
frame; typically, an indicator and its related overbought and oversold levels will be shown in the
same frame, for example.
3.13.1.4.1.6 Alerts Tab
The Output Variable Editor's 223 Alerts tab defines the default alert properties for the output variable 221 if
its Alerts Enabled option is enabled in the Name 223 tab. An Alert shows a text message in the Trading
Activity 174 window (or in the Trading Systems Alerts window if the "Show Trading Systems Alerts 68 "
option is defined as "In Trading Systems Alerts Window") and plays an audio sound file in real-time, with
each new incoming price tick, each time the output variable's 221 conditions are fulfilled according to the
formula script.
© 2011 Visual Trading Systems, LLC
Task Windows
231
Clicking the [OK] button saves your changes. Clicking the [Cancel] button closes the Output Variable
Editor 223 window without saving your changes.
Explanations of Alerts Tab's Items
Alert Message
The Alert Message is the text message that shows in the Trading Activity 174 window (or in the
Trading Systems Alerts window if the "Show Trading Systems Alerts 68 " option is defined as "In
Trading Systems Alerts Window"). Leaving this text empty effectively disables the text message
alert.
Standard Sound / User Defined Sound
These options let you choose if you will be using a standard VT Trader sound file or a custom sound
file for the alert.
Standard Alert Sound / Alert Sound File
These options define your choice of a predefined VT Trader sound files or any custom .wav sound file
on your computer to use. You can hear a sample of the sound file you have chosen by clicking the
Play button ( [ > ] ).
© 2011 Visual Trading Systems, LLC
232
VT Trader 2.0 Help Manual
3.13.1.4.1.7 Trading Tab
The Output Variable Editor's 223 Trading tab defines the default automated trading properties for the
output variable 221 if its Trading Enabled option is enabled in the Name 223 tab. The properties in this tab
are only used by the trading system while it is running in Auto-Trade mode.
Important Note(s): It is important to ensure that you define the properties in this tab for every Trading
Enabled 223 output variable 221 included in the trading system otherwise the trading system might not
function as expected while running in Auto-Trade mode. It is also strongly recommended that you read
through the Auto-Trading FAQ for Trading Systems 1148 page in this manual for some additional,
important information about using trading systems for automated trading purposes.
Clicking the [OK] button saves your changes. Clicking the [Cancel] button closes the Output Variable
Editor 223 window without saving your changes.
Explanations of Highlights Tab's Items
Trade Action
The Trade Action defines the type of order that is automatically requested each time the output
variable's 221 conditions are fulfilled according to the formula script while the trading system is
running in Auto-Trade mode. The available choices are: Buy (mark et order) and Sell (mark et order).
Market Range
© 2011 Visual Trading Systems, LLC
Task Windows
233
The Market Range automatically approves requotes within a maximum range of pips (0-99) from the
quoted price. For example, if Market Range is set to 10, requotes within ten pips of the requested
price will be processed without requiring your confirmation. Important Note: Automated trading
systems do not have the ability to respond to requote requests (only you can accept and confirm
them) so it is very important that you define the largest Market Range value you are comfortable
with to avoid potential automated trading problems due to one or more requote request(s).
Hedge
The Hedge option defines the order that is automatically requested each time the output variable's
221 conditions are fulfilled according to the formula script while the trading system is running in
Auto-Trade mode as a hedged order. The hedge option allows the order request to open a new
position without closing an existing, opposite open position. * Note: This command is only available
if your broker supports this functionality.
For example, if the account being used by the trading system running in Auto-Trade mode has an
open Buy position and the trading system requests a Sell market order, the Buy position will not be
closed out. The Buy position remains open and a new Sell position is created. With the Hedge
option enabled, the Sell market order request, in this example, would be used to offset the open Buy
position by its Amount (in Lots).
3.13.1.5 Formula Tab
The Trading System Editor's 207 Formula tab defines the VT Trader scripting language's 329 statements,
expressions, conditions, variables, etc. used in the calculation(s) of the resulting trading system. The
Formula Editor Toolbar 234 and Paste Function window 234 (continue reading below) are available to
help aid in the construction of your formula script. It is also recommended that you enable the Code
Parameters 210 and Code Completion 213 features.
© 2011 Visual Trading Systems, LLC
234
VT Trader 2.0 Help Manual
The Formula Editor Toolbar allows you to quickly comment 330 (or uncomment) text, insert any of the
scripting language's 329 punctuators 331 and operators 331 into the formula script, and open the Paste
Function window.
The Paste Function window includes a full categorical listing of all of the available functions for use in
your formula script. These lists include all of the scripting language's 329 functions 334 as well as the
Function Name Aliases 192 of the standard VT Trader indicators and any of your custom indicators. The
Paste Function window also specifies the selected function's format and its arguments (if any). Lastly,
a full description of each function is also provided. Selecting a function from this window pastes it into
your formula script in the Formula tab.
© 2011 Visual Trading Systems, LLC
Task Windows
3.14
235
Quick Lists
3.14.1 Configure Indicators Quick List
The Indicators Quick List is a list of indicators that you can customize to include only the indicators
your choose. The Indicators Quick List is accessible using Ribbon>Technical
Analysis>Indicators>Indicators Quick List
as well as via any chart window's contextual menu.
By default, all standard VT Trader indicators and all custom indicators are included in the Indicators
Quick List. You will need to use the Indicators Quick List Configuration window to customize this
list. You can open this window using the Configure Quick List command in the Ribbon>Technical
Analysis>Indicators>Indicators Quick List
selection menu.
© 2011 Visual Trading Systems, LLC
236
VT Trader 2.0 Help Manual
The Indicators Quick List window is divided into left and right panes with 4 buttons between them. The
right pane is the list of indicators currently included in the Indicator Quick List. Clicking the [>] button
moves the selected indicator into the Indicators Quick List while clicking the [>>] button moves all of
the available indicators in VT Trader into the Indicators Quick List. Clicking the [<] button removes the
selected indicator from the Indicators Quick List while clicking the [<<] button removes all of the
indicators from the Indicators Quick List.
Clicking the [OK] button saves your changes. Clicking the [Cancel] button closes the Indicators Quick
List Configuration window without saving your changes.
3.14.2 Configure Trading Systems Quick List
The Trading Systems Quick List is a list of trading systems that you can customize to include only the
trading systems your choose. The Trading Systems Quick List is accessible using Ribbon>Technical
Analysis>Trading Systems>Trading Systems Quick List
as well as via any chart window's contextual
menu.
By default, all standard VT Trader trading systems and all custom trading systems are included in the
Trading Systems Quick List. You will need to use the Trading Systems Quick List Configuration
window to customize this list. You can open this window using the Configure Quick List command in
the Ribbon>Technical Analysis>Indicators>Trading Systems Quick List
selection menu.
The Trading Systems Quick List window is divided into left and right panes with 4 buttons between
them. The right pane is the list of trading systems currently included in the Trading Systems Quick
List. Clicking the [>] button moves the selected trading system into the Trading Systems Quick List
while clicking the [>>] button moves all of the available trading systems in VT Trader into the Trading
Systems Quick List. Clicking the [<] button removes the selected trading system from the Trading
Systems Quick List while clicking the [<<] button removes all of the trading systems from the Trading
Systems Quick List.
Clicking the [OK] button saves your changes. Clicking the [Cancel] button closes the Trading Systems
© 2011 Visual Trading Systems, LLC
Task Windows
Quick List Configuration window without saving your changes.
© 2011 Visual Trading Systems, LLC
237
Drawing Tools
Part
IV
Drawing Tools
4
239
Drawing Tools
Using one or more of VT Trader's advanced drawing tools, you can perform detailed technical analysis on
any instrument you desire. Please select a tool from the categorized list below to learn more about it.
Data Analysis Tools
Copy Prices 241
Cross Hair 240
Comments 243
Symbols 246
Line Tools
Vertical Line 250
Horizontal Line 253
Trend Line 256
Trend Line by Angle 259
Linear Regression Line 263
Channel Tools
Standard Deviation Channel 265
Standard Error Channel 269
Raff Regression Channel 272
Equidistant Channel 276
Andrew's Pitchfork 279
Fibonacci Tools
Fibonacci
Fibonacci
Fibonacci
Fibonacci
Fibonacci
Retracements 293
Time Extensions 301
Channel 305
Fan 309
Arc 313
Gann Tools
Gann Line 317
Gann Fan 321
Gann Grid 324
Shape Drawing Tools
Ellipse 282
Rectangle 286
Triangle 290
© 2011 Visual Trading Systems, LLC
240
VT Trader 2.0 Help Manual
4.1
Data Analysis
4.1.1
Cross Hair Tool
You can easily identify a specific date, time, and price point in the chart using the Cross Hair tool. You
can show the Cross Hair tool in any chart by first making that chart the active window and then using
the Ribbon -> Chart menu -> Show/Hide group -> Cross Hair command. You can also use the Chart
Properties window (or Chart Template Properties window). As you move your cursor around in the chart,
the Cross Hair tool becomes visible.
The Cross Hair tool also includes a built-in function called "Measuring". The "Measuring" function
automatically measures (counts) the number of bars and number of pips between two locations in the
active chart window. The measuring label shows data in the format: # of bars / # of pips / price level of
cursor.
To utilize this feature, first position the cross hair cursor at one location in the chart window and then
click and hold down the left mouse button. With the left mouse button held down, move the cursor to a
second location in the chart window. As the cursor is being moved around in the chart window, a new
measuring line and label is shown. This new label updates in real-time displaying the # of bars and the #
of pips between the cursor's originating location and its current location in the chart.
© 2011 Visual Trading Systems, LLC
Drawing Tools
241
Note: While the Cross Hair tool is enabled, the ability to drag and scroll the chart window left and right
using the left mouse button works differently. The measuring function can be temporarily disabled by
double-clicking the left mouse button. The cursor will change from a cross to an arrow and once it's
moving it will change to a hand. In this mode, you may scroll the chart by clicking and holding down the
left mouse button while moving the cursor left or right within the chart window. The measuring function
can be reactivated by double-clicking the left mouse button again; doing so will change the cursor back
to an arrow and ultimately back to the cross once it's been moved.
Appearance Customizations
Cross Hair appearance customizations can be made for a single chart window by using the chart
window's Chart Properties 131 window. Appearance customizations can also be made using a chart
template's Chart Template Properties window.
4.1.2
Copy Prices Tool
To copy price data (i.e. each price bar's closing date/time, open/high/low/close prices, and volume) from
the active chart window you must select the Copy Prices tool. There is two ways to copy the price data:
Select by Date Range and Select Entire Date Range.
© 2011 Visual Trading Systems, LLC
242
VT Trader 2.0 Help Manual
If you choose Select Entire Date Range, all of the price data loaded into the active chart window is
copied to the computer's clipboard and a Save As dialog window opens. To save the price data as a new
text file (.txt), you must choose a name for your file and a location on the computer to save it and then
click the [Save] button.
If you choose Select by Date Range, you must specify the date range of the price data that you want to
save. To do this you must position the cursor at the starting location of the date range in the active chart
window, click and hold down the left mouse button, and move the cursor to the ending location of the
date range. Releasing the left mouse button finalizes your selection.
Upon releasing the left mouse button, the price data from the selected date range is copied to the
computer's clipboard and a Save As dialog opens. To save the price data as a new text file (.txt), you
must choose a name for your file and a location on the computer to save it and then click the [Save]
button.
© 2011 Visual Trading Systems, LLC
Drawing Tools
4.1.3
243
Comments Tool
To type a comment in the active chart window you must select the Comments tool. With the
comments tool selected, you must place the cursor over a location in the active chart window to type
the comment. Once a location is chosen you must click the left mouse button to show the Edit
Comments window.
© 2011 Visual Trading Systems, LLC
244
VT Trader 2.0 Help Manual
Once shown, you can adjust the initial properties of the comment including the font attributes, text
color, background color, and positioning (i.e. Float) for the new comments. You may also type the initial
text at this time. Note: If the Float option is enabled, you will be able to move the chart data round
underneath the comment while the comment "floats" above it. If the Float option is disabled, the
comment will remain "fixed" in the exact location you that you place it in respective to the chart data.
After typing your comment, it is shown in the active chart window using the properties chosen in the
Edit Comments window (shown below with the contextual menu 245 active)...
© 2011 Visual Trading Systems, LLC
Drawing Tools
245
To reposition the comment, you should click the left mouse button while the cursor is hovering over it
and with the left mouse button held down, drag the comment to its new location. Release the left
mouse button to finalize the new location of the comment.
The comment can also be rotated. To rotate the comment you must first select it by clicking once with
the left mouse button while the cursor is hovering over it. Next, the cursor must be positioned over one of
the boxes around the outside edge of the comment box (the mouse cursor will change when positioned
correctly). Click and hold down the left mouse button to rotate the comment. The comment box will
redraw as the cursor is moved around within the chart window. Release the left mouse button to finalize
the rotation.
You may click the right mouse button while the cursor is hovering over the comment to access the
contextual menu 245 for additional functionality.
4.1.3.1
Contextual Menu
A Comment's contextual menu contains the following commands:
Delete
This command deletes the selected comment from the active chart window.
Delete All
This command deletes all comments from the active chart window.
Properties
© 2011 Visual Trading Systems, LLC
246
VT Trader 2.0 Help Manual
This command opens the comment's properties 246 window.
Set to Default
This command resets any custom properties currently used by the comment back to their default
values.
4.1.3.2
Properties
Using the Comments properties window, you can:
Change the font attributes and text justification
Change the background color of the comments box
Change the method that is used to apply the comment to the chart window (i.e. float)
Change the comment's text
4.1.4
Symbols Tool
You can use the Symbol tool to draw symbols (a.k .a. pictures or graphics) in the active chart window.
© 2011 Visual Trading Systems, LLC
Drawing Tools
247
Once you've used the Symbol tool to select your symbol, you must position your cursor over your
desired location in the active chart window and click the left mouse button to draw the symbol.
Appearance Customizations
Each symbol can be moved and/or customized at your discretion.
To move a symbol, click the left mouse button while the cursor is positioned over it and with the left
mouse button held down, drag the symbol to its new location. Releasing the left mouse button finalizes
the symbol's new location.
All symbols are initially drawn using the Symbol tool's default properties. However, various appearance
customizations can be made using a symbol's properties 250 .
Contextual Menu
A symbol's contextual menu 249 provides you with additional symbol-specific functionality and access to
its properties 250 . To activate the contextual menu 249 , click the right mouse button while the cursor is
positioned over the symbol.
© 2011 Visual Trading Systems, LLC
248
VT Trader 2.0 Help Manual
© 2011 Visual Trading Systems, LLC
Drawing Tools
4.1.4.1
249
Contextual Menu
A Symbol's contextual menu contains the following commands:
Delete
This command deletes the selected symbol from the active chart window.
Delete All
This command deletes all symbols from the active chart window.
Properties
This command opens the symbol's properties 250 window.
Set to Default
This command resets any custom properties currently used by the symbol back to their default
values.
Add Comment
This command adds a comment 243 and associates it specifically with the selected symbol.
© 2011 Visual Trading Systems, LLC
250
4.1.4.2
VT Trader 2.0 Help Manual
Properties
Using the Symbol Properties window you can:
Change the color of the symbol
Change the size of the symbol
4.2
Lines
4.2.1
Vertical Lines
To draw a vertical line in the active chart window you must select the Vertical Line tool. With the
Vertical Line tool selected, you must position the cursor over a location in the active chart window to
draw the vertical line. Once a location is chosen you must click the left mouse to draw the line in the
chart window.
© 2011 Visual Trading Systems, LLC
Drawing Tools
251
Once the vertical line is drawn in the chart window you can change its properties 253 (by using the
contextual menu 252 ) or reposition it.
To reposition the vertical line, you should click the left mouse button while the cursor is hovering over it
and with the left mouse button held down, drag the line to its new location. Release the left mouse
button to finalize the new location of the vertical line.
You may click the right mouse button while the cursor is hovering over the vertical line to access its
contextual menu 252 for additional functionality.
© 2011 Visual Trading Systems, LLC
252
4.2.1.1
VT Trader 2.0 Help Manual
Contextual Menu
A Vertical Line's contextual menu contains the following commands:
Delete
This command deletes the selected vertical line from the active chart window.
Delete All
This command deletes all vertical lines from the active chart window.
Properties
This command opens the vertical line's properties 253 window.
Set to Default
This command resets any custom properties currently used by the vertical line back to their default
values.
© 2011 Visual Trading Systems, LLC
Drawing Tools
4.2.1.2
253
Properties
Using the Vertical Line's properties, you can:
Change the color, width, and style of the vertical line
Change the value (date/time) of the vertical line
4.2.2
Horizontal Lines
To draw a horizontal line in the active chart window you must select the Horizontal Line tool. With
the Horizontal Line tool selected, you must position the cursor over a location in the active chart
window to draw the horizontal line. Once a location is chosen you must click the left mouse to draw
the line in the chart window.
© 2011 Visual Trading Systems, LLC
254
VT Trader 2.0 Help Manual
Once the horizontal line is drawn in the chart window you can change its properties 256 (by using the
contextual menu 255 ) or reposition it.
To reposition the horizontal line, you should click the left mouse button while the cursor is hovering
over it and with the left mouse button held down, drag the line to its new location. Release the left mouse
button to finalize the new location of the horizontal line.
You may click the right mouse button while the cursor is hovering over the horizontal line to access
its contextual menu 255 for additional functionality.
© 2011 Visual Trading Systems, LLC
Drawing Tools
4.2.2.1
255
Contextual Menu
A Horizontal Line's contextual menu contains the following commands:
Delete
This command deletes the selected horizontal line from the active chart window.
Delete All
This command deletes all horizontal lines from the active chart window.
Properties
This command opens the horizontal line's properties 256 window.
Set to Default
This command resets any custom properties currently used by the horizontal line back to their
default values.
Add Comment
This command adds a comment 243 and associates it specifically with the selected horizontal line.
© 2011 Visual Trading Systems, LLC
256
4.2.2.2
VT Trader 2.0 Help Manual
Properties
Using the Horizontal Line's properties, you can:
Change the color, width, and style of the horizontal line
Change the value (price) of the horizontal line
Choose to be alerted (in real-time and/or when the bar closes) if/when the horizontal line is
breached
4.2.3
Trend Lines
To draw a trend line in the active chart window you must select the Trend Line tool. With the Trend
Line tool selected, you must position the cursor over a location in the active chart window to start the
calculation of the trend line. This is typically from a low or high point in price. Once a starting position
is selected you must click and hold down the left mouse button while drawing the trend line on the
chart.
© 2011 Visual Trading Systems, LLC
Drawing Tools
257
Once drawn on the chart, you can change the properties 259 of the trend line (by using the contextual
menu 258 ), reposition it, or change the begin/end points used for calculations 259 .
To reposition the trend line, you should click the left mouse button while the cursor is hovering over it
and with the left mouse button held down, drag the line to its new location. Release the left mouse
button to finalize the new location of the trend line.
To recalculate where the trend line begins or ends, you must select the trend line by positioning the
cursor over it and clicking the left mouse button once. Next, position the cursor over either the box at the
beginning or the ending of the line; click and hold down the left mouse button to drag the calculation
point of the trend line to its new location. The trend line will redraw as the cursor is moved around
within the chart window. Release the left mouse button to finalize the redrawing according to the new
begin/end points. You may also use the Properties 259 option of the contextual menu 258 to manually
change the begin or end point using specific price and date/time values.
You may click the right mouse button while the cursor is hovering over the trend line to access its
contextual menu 258 for additional functionality.
© 2011 Visual Trading Systems, LLC
258
4.2.3.1
VT Trader 2.0 Help Manual
Contextual Menu
A Trend Line's contextual menu contains the following commands:
Delete
This command deletes the selected trend line from the active chart window.
Delete All
This command deletes all trend lines from the active chart window.
Properties
This command opens the trend line's properties 259 window.
Set to Default
This command resets any custom properties currently used by the trend line back to their default
values.
Add Comment
This command adds a comment 243 and associates it specifically with the selected trend line.
Draw Parallel Trend Line
This command creates an exact duplicate of the selected trend line.
© 2011 Visual Trading Systems, LLC
Drawing Tools
4.2.3.2
259
Properties
Using the Trend Line's properties, you can:
Change the color, width, and style of the trend line
Change the beginning and ending values (price/date/time) of the trend line
Extend the trend line from its beginning/ending points
Choose to be alerted (in real-time and/or when the bar closes) if/when the trend line is breached
4.2.4
Trend Lines by Angle
The Trend Line by Angle tool works in a similar fashion as the Trend Line 256 tool, except there is
© 2011 Visual Trading Systems, LLC
260
VT Trader 2.0 Help Manual
one major difference. The Trend Line by Angle is drawn relative to the computer screen. For example,
if you were to use a protractor to draw a line at 45 degrees on the screen, the line should rise by one
inch for each inch it extends (runs) to the right. This 45 degree angle also could be expressed as a slope
of 1. We say the angle it is relative to the computer screen because we are discussing inches, not
prices, on the screen. Regardless of how many bars are loaded or what the x-axis and y-axis of the
chart are set to, a 45 degree angle will slope up and to the right at 45 degrees relative to the computer
screen.
To draw a trend line by angle in the active chart window you must select the Trend Line by Angle
tool. With the Trend Line by Angle tool selected, you must position the cursor over a location in the
active chart window to start the calculation of the trend line. This is typically from a low or high point in
price. Once a starting position is selected you must click and hold down the left mouse button while
drawing the trend line by angle on the chart.
Once drawn on the chart, you can change the properties 262 of the trend line by angle (by using the
contextual menu 261 ), reposition it, or change the begin/end points used for calculations 262 .
To reposition the trend line, you should click the left mouse button while the cursor is hovering over it
and with the left mouse button held down, drag the line to its new location. Release the left mouse
button to finalize the new location of the trend line.
To recalculate where the trend line begins or ends, you must select the trend line by angle by
positioning the cursor over it and clicking the left mouse button once. Next, position the cursor over
either the box at the beginning or the ending of the line; click and hold down the left mouse button to
drag the calculation point of the trend line by angle to its new location. The trend line by angle will
redraw as the cursor is moved around within the chart window. Release the left mouse button to finalize
the redrawing according to the new begin/end points. You may also use the Properties 262 option of the
© 2011 Visual Trading Systems, LLC
Drawing Tools
261
contextual menu 261 to manually change the begin or end point using specific price and date/time
values.
You may click the right mouse button while the cursor is hovering over the trend line by angle to
access its contextual menu 261 for additional functionality.
4.2.4.1
Contextual Menu
A Trend Line (by Angle)'s contextual menu contains the following commands:
Delete
This command deletes the selected trend line (by angle) from the active chart window.
Delete All
This command deletes all trend lines (by angle) from the active chart window.
Properties
This command opens the trend line (by angle)'s properties 262 window.
Set to Default
This command resets any custom properties currently used by the trend line back to their default
© 2011 Visual Trading Systems, LLC
262
VT Trader 2.0 Help Manual
values.
Add Comment
This command adds a comment 243 and associates it specifically with the selected trend line (by
angle).
4.2.4.2
Properties
Using the Trend Line By Angle's properties, you can:
Change the color, width, and style of the trend line
Change the beginning and ending values (price/date/time) of the trend line
Extend the trend line from its beginning/ending points
Change the trend line's font attributes
Choose to be alerted (in real-time and/or when the bar closes) if/when the trend line is breached
© 2011 Visual Trading Systems, LLC
Drawing Tools
4.2.5
263
Linear Regression Lines
To draw a linear regression line in the active chart window you must select the Linear Regression
Line tool. With the Linear Regression Line tool selected, you must position the cursor over a location
in the active chart window to start the calculation of the linear regression line. This is typically from a
low or high point in price. Once a starting position is selected you must click and hold down the left
mouse button while drawing the linear regression line on the chart.
Once drawn on the chart, you can change the properties 265 of the linear regression line (by using the
contextual menu 264 ), reposition it, or change the begin/end points used for calculations 265 .
To reposition the linear regression line, you should click the left mouse button while the cursor is
hovering over it and with the left mouse button held down, drag the line to its new location. Release the
left mouse button to finalize the new location of the linear regression line.
To recalculate where the linear regression line begins or ends, you must select the linear regression
line by positioning the cursor over it and clicking the left mouse button once. Next, position the cursor
over either the box at the beginning or the ending of the line; Click and hold down the left mouse button
to drag the calculation point of the linear regression line to its new location. The linear regression
line will redraw as the cursor is moved around within the chart window. Release the left mouse button to
finalize the redrawing according to the new begin/end points.
You may click the right mouse button while the cursor is hovering over the linear regression line to
© 2011 Visual Trading Systems, LLC
264
VT Trader 2.0 Help Manual
access its contextual menu 264 for additional functionality.
4.2.5.1
Contextual Menu
A Linear Regression Line's contextual menu contains the following commands:
Delete
This command deletes the selected linear regression line from the active chart window.
Delete All
This command deletes all linear regression lines from the active chart window.
Properties
This command opens the linear regression line's properties 265 window.
Set to Default
This command resets any custom properties currently used by the linear regression line back to
their default values.
Add Comment
© 2011 Visual Trading Systems, LLC
Drawing Tools
265
This command adds a comment 243 and associates it specifically with the selected linear regression
line.
4.2.5.2
Properties
Using the Linear Regression Line's properties, you can:
Change the color, width, and style of the regression line
Change the data series that the regression line is based on
4.3
Channels
4.3.1
Standard Deviation Channels
To draw a standard deviation channel in the active chart window you must select the Standard
Deviation Channel tool. With the Standard Deviation Channel tool selected, you must position the
cursor over a location in the active chart window to start the calculation of the standard deviation
channel. Once a starting position is selected you must click and hold down the left mouse button while
drawing the standard deviation channel on the chart.
© 2011 Visual Trading Systems, LLC
266
VT Trader 2.0 Help Manual
Once drawn on the chart, you can change the properties 268 of the standard deviation channel (by
using the contextual menu 267 ), reposition it, or change the begin/end points used for calculations 267 .
To reposition the standard deviation channel, you should click the left mouse button while the cursor
is hovering over one of its lines and with the left mouse button held down, drag the channel to its new
location. Release the left mouse button to finalize the new location of the standard deviation channel.
To recalculate where the standard deviation channel begins or ends, you must select the standard
deviation channel by positioning the cursor over one of its lines and clicking the left mouse button
once. Next, position the cursor over either the box at the beginning or the ending of the middle line; Click
and hold down the left mouse button to drag the calculation point of the standard deviation channel to
its new location. The standard deviation channel will redraw as the cursor is moved around within the
chart window. Release the left mouse button to finalize the redrawing according to the new begin/end
points.
You may click the right mouse button while the cursor is hovering over the standard deviation channel
to access its contextual menu 267 for additional functionality.
© 2011 Visual Trading Systems, LLC
Drawing Tools
4.3.1.1
267
Contextual Menu
A Standard Deviation Channel's contextual menu contains the following commands:
Delete
This command deletes the selected standard deviation channel from the active chart window.
Delete All
This command deletes all standard deviation channels from the active chart window.
Properties
This command opens the standard deviation channel's properties 268 window.
Set to Default
This command resets any custom properties currently used by the standard deviation channel back
to their default values.
Add Comment
This command adds a comment 243 and associates it specifically with the selected standard
deviation channel.
© 2011 Visual Trading Systems, LLC
268
4.3.1.2
VT Trader 2.0 Help Manual
Properties
Using the Standard Deviation Channel's properties, you can:
Change the color, width, and style of the channel lines
Change the beginning and ending values (price/date/time) of the channel's middle line
Extend the channel from its beginning/ending points
Change the data series that the channel is based on
Change the number of standard errors used to calculate the channel
Choose to be alerted (in real-time and/or when the bar closes) if/when the channel lines are
breached
© 2011 Visual Trading Systems, LLC
Drawing Tools
4.3.2
269
Standard Error Channels
To draw a standard error channel in the active chart window you must select the Standard Error
Channel tool. With the Standard Error Channel tool selected, you must position the cursor over a
location in the active chart window to start the calculation of the standard error channel. Once a
starting position is selected you must click and hold down the left mouse button while drawing the
standard error channel on the chart.
Once drawn on the chart, you can change the properties 271 of the standard error channel (by using
the contextual menu 270 ), reposition it, or change the begin/end points used for calculations 271 .
To reposition the standard error channel, you should click the left mouse button while the cursor is
hovering over one of its lines and with the left mouse button held down, drag the channel to its new
location. Release the left mouse button to finalize the new location of the standard error channel.
To recalculate where the standard error channel begins or ends, you must select the standard error
channel by positioning the cursor over one of its lines and clicking the left mouse button once. Next,
position the cursor over either the box at the beginning or the ending of the middle line; Click and hold
down the left mouse button to drag the calculation point of the standard error channel to its new
location. The standard error channel will redraw as the cursor is moved around within the chart
window. Release the left mouse button to finalize the redrawing according to the new begin/end points.
You may click the right mouse button while the cursor is hovering over the standard error channel to
access its contextual menu 270 for additional functionality.
© 2011 Visual Trading Systems, LLC
270
4.3.2.1
VT Trader 2.0 Help Manual
Contextual Menu
A Standard Error Channel's contextual menu contains the following commands:
Delete
This command deletes the selected standard error channel from the active chart window.
Delete All
This command deletes all standard error channels from the active chart window.
Properties
This command opens the standard error channel's properties 271 window.
Set to Default
This command resets any custom properties currently used by the standard error channel back to
their default values.
Add Comment
© 2011 Visual Trading Systems, LLC
Drawing Tools
271
This command adds a comment 243 and associates it specifically with the selected standard error
channel.
4.3.2.2
Properties
Using the Standard Error Channel's properties, you can:
Change the color, width, and style of the channel lines
Change the beginning and ending values (price/date/time) of the channel's middle line
Extend the channel from its beginning/ending points
Change the data series that the channel is based on
Change the number of standard errors used to calculate the channel
Choose to be alerted (in real-time and/or when the bar closes) if/when the channel lines are
breached
© 2011 Visual Trading Systems, LLC
272
4.3.3
VT Trader 2.0 Help Manual
Raff Regression Channels
To draw a Raff regression channel in the active chart window you must select the Raff Regression
Channel tool. With the Raff Regression Channel tool selected, you must position the cursor over a
location in the active chart window to start the calculation of the Raff regression channel. Once a
starting position is selected you must click and hold down the left mouse button while drawing the Raff
regression channel on the chart.
© 2011 Visual Trading Systems, LLC
Drawing Tools
273
Once drawn on the chart, you can change the properties 275 of the Raff regression channel (by using
the contextual menu 274 ), reposition it, or change the begin/end points used for calculations 275 .
To reposition the Raff regression channel, you should click the left mouse button while the cursor is
hovering over one of its lines and with the left mouse button held down, drag the channel to its new
location. Release the left mouse button to finalize the new location of the Raff regression channel.
To recalculate where the Raff regression channel begins or ends, you must select the Raff
regression channel by positioning the cursor over one of its lines and clicking the left mouse button
once. Next, position the cursor over either the box at the beginning or the ending of the middle line; Click
and hold down the left mouse button to drag the calculation point of the Raff regression channel to its
new location. The Raff regression channel will redraw as the cursor is moved around within the chart
window. Release the left mouse button to finalize the redrawing according to the new begin/end points.
You may click the right mouse button while the cursor is hovering over the Raff regression channel to
access its contextual menu 274 for additional functionality.
© 2011 Visual Trading Systems, LLC
274
4.3.3.1
VT Trader 2.0 Help Manual
Contextual Menu
A Raff Regression Channel's contextual menu contains the following commands:
Delete
This command deletes the selected Raff regression channel from the active chart window.
Delete All
This command deletes all Raff regression channels from the active chart window.
Properties
This command opens the Raff regression channel's properties 275 window.
Set to Default
This command resets any custom properties currently used by the Raff regression channel back to
their default values.
Add Comment
This command adds a comment 243 and associates it specifically with the selected Raff regression
channel.
© 2011 Visual Trading Systems, LLC
Drawing Tools
4.3.3.2
Properties
Using the Raff Regression Channel's properties, you can:
Change the color, width, and style of the channel lines
Change the beginning and ending values (price/date/time) of the channel's middle line
Extend the channel from its beginning/ending points
Change the data series that the channel is based on
Change the number of standard errors used to calculate the channel
Choose to be alerted (in real-time and/or when the bar closes) if/when the channel lines are
breached
© 2011 Visual Trading Systems, LLC
275
276
4.3.4
VT Trader 2.0 Help Manual
Equidistant Channels
To draw an equidistant channel in the active chart window you must select the Equidistant Channel
Channel tool. With the Equidistant Channel tool selected, you must position the cursor over a
location in the active chart window to start the calculation of the equidistant channel. Once a starting
position is selected you must click and hold down the left mouse button while drawing the equidistant
channel on the chart.
Once drawn on the chart, you can change the properties 278 of the equidistant channel (by using the
contextual menu 277 ), reposition it, or change the begin/end points used for calculations 278 .
To reposition the equidistant channel, you should click the left mouse button while the cursor is
hovering over the lower channel line and with the left mouse button held down, drag the channel to its
new location. Release the left mouse button to finalize the new location of the equidistant channel.
To recalculate where the equidistant channel begins or ends, you must select the equidistant
channel by positioning the cursor over the lower channel line and clicking the left mouse button once.
Next, position the cursor over either the box at the beginning or the ending of the line; Click and hold
down the left mouse button to drag the calculation point of the equidistant channel to its new location.
The equidistant channel will redraw as the cursor is moved around within the chart window. Release
the left mouse button to finalize the redrawing according to the new begin/end points. you may also use
the Properties 278 option of the contextual menu 277 to manually change the begin or end point using
specific price and date/time values. Lastly, the upper channel line may be moved to increase or
decrease the width of the channel. With the equidistant channel selected, you should click the left
mouse button while the cursor is hovering over the upper channel line and with the left mouse button held
down, drag the upper channel line to its new location. Release the left mouse button to finalize the new
location of the upper channel line.
© 2011 Visual Trading Systems, LLC
Drawing Tools
277
You may click the right mouse button while the cursor is hovering over the equidistant channel to
access its contextual menu 277 for additional functionality.
4.3.4.1
Contextual Menu
A Equidistant Channel's contextual menu contains the following commands:
Delete
This command deletes the selected equidistant channel from the active chart window.
Delete All
This command deletes all equidistant channels from the active chart window.
Properties
This command opens the equidistant channel's properties 278 window.
Set to Default
This command resets any custom properties currently used by the equidistant channel back to their
default values.
Add Comment
© 2011 Visual Trading Systems, LLC
278
VT Trader 2.0 Help Manual
This command adds a comment 243 and associates it specifically with the selected equidistant
channel.
4.3.4.2
Properties
Using the Raff Regression Channel's properties, you can:
Change the color, width, and style of the channel lines
Change the beginning and ending values (price/date/time) of the channel's primary trend line
Extend the channel from its beginning/ending points
Choose to be alerted (in real-time and/or when the bar closes) if/when the channel lines are
breached
© 2011 Visual Trading Systems, LLC
Drawing Tools
4.3.5
279
Andrews' Pitchforks
Originally developed by Dr. Alan Andrews, the Andrews' Pitchfork (a.k .a. median line studies) is
typically constructed of three parallel trend lines used to identify potential support and resistance levels
(additional tines can be specified; please refer to the tool's properties 281 for details). These trend lines
are created using three different reference points which are typically sequential peaks and troughs. The
first trend line (the median or middle line) begins at the left-most reference point (either a peak or trough)
and equally divides the distance between the two right-most reference points. This median line is usually
referred to as the pitchfork handle. The second and third trend lines are drawn parallel to the first trend
line, beginning at the two right-most reference points (a trough and a peak ). The second and third trend
lines are usually referred to as the pitchfork tines (or prongs).
To draw an Andrews' pitchfork in the active chart window you must select the Andrews' Pitchfork
tool. With the Andrews' Pitchfork tool selected, you must position the cursor over a location in the
active chart window to start the calculation of the Andrews' pitchfork. Once a starting position is
selected you must click and hold down the left mouse button while drawing the Andrews' pitchfork on
the chart. Please note: Correctly drawing or positioning the Andrews' pitchfork initially in the active
chart window will be very difficult, if not impossible, due to the tool's drawing behavior. It is strongly
recommended that the Andrews' pitchfork simply be placed on the chart in a way that, when selected,
all three reference points (identified as small black boxes, see screenshot below) will be visible. Once
the Andrews' pitchfork has been drawn in active chart window, you may then easily reposition each
reference point accordingly.
Once drawn on the chart, you can change the properties 281 of the Andrews' pitchfork (by using the
contextual menu 280 ), reposition it, or change the reference points used for calculations 281 .
© 2011 Visual Trading Systems, LLC
280
VT Trader 2.0 Help Manual
To reposition the Andrews' pitchfork, you should click the left mouse button while the cursor is
hovering over any of the trend lines and with the left mouse button held down, drag the pitchfork to its
new location. Release the left mouse button to finalize the new location of the Andrews' pitchfork.
To recalculate the Andrews' pitchfork's reference points, you must select the Andrews' pitchfork by
positioning the cursor over any of the trend lines and clicking the left mouse button once. Next, position
the cursor over the box at the beginning of any trend line to be changed; Click and hold down the left
mouse button to drag the reference point of the Andrews' pitchfork to its new location. The Andrews'
pitchfork will redraw as the cursor is moved around within the chart window. Release the left mouse
button to finalize the redrawing according to the new reference points.
You may click the right mouse button while the cursor is hovering over the Andrews' pitchfork to
access its contextual menu 280 for additional functionality.
4.3.5.1
Contextual Menu
An Andrew's Pitchfork's contextual menu contains the following commands:
Delete
This command deletes the selected Andrew's pitchfork from the active chart window.
Properties
This command opens the Andrew's pitchfork's properties 281 window.
© 2011 Visual Trading Systems, LLC
Drawing Tools
281
Set to Default
This command resets any custom properties currently used by the Andrew's pitchfork back to their
default values.
4.3.5.2
Properties
Using the Andrew's Pitchfork's properties, you can:
Customize the tines (by click ing the [Define] button)
Choose to show or hide the tine labels
Change the tine labels' font attributes
By clicking the [Define] button, you can show or hide up to 16 custom tines (each with their own color,
width, and style). Each additional tine represents a multiple of the distance from the median (or middle)
line to the standard tines (tines with a multiple equal to 1).
© 2011 Visual Trading Systems, LLC
282
VT Trader 2.0 Help Manual
4.4
Shapes
4.4.1
Ellipses
To draw an ellipse in the active chart window you must select the Ellipse tool. With the Ellipse tool
selected, position the cursor over a location in the active chart window to draw the ellipse. Once a
location is chosen, click and hold down the left mouse button to draw the shape in the chart window.
© 2011 Visual Trading Systems, LLC
Drawing Tools
283
Once drawn on the chart, you can change the properties 285 of the ellipse (by using the contextual menu
283 ), reposition it, or change its selection points.
To reposition the ellipse, click the left mouse button while the cursor is hovering anywhere inside the
shape and with the left mouse button held down, drag the ellipse to its new location. Release the left
mouse button to finalize the new location of the ellipse.
To recalculate the area that the ellipse covers, select the ellipse by positioning the cursor anywhere
inside the shape and clicking the left mouse button once. Next, position the cursor over any of the
selection points around the shape's border and then click and hold down the left mouse button to drag
the selection point to its new location. The ellipse will redraw as the cursor is moved. Release the left
mouse button to finalize the redrawing according to the new selection point(s).
You can click the right mouse button while the cursor is positioned anywhere inside the shape to
access its contextual menu 283 for additional functionality.
4.4.1.1
Contextual Menu
The contextual menu of an Ellipse 282 can be accessed by clicking the right mouse button while the
cursor is positioned anywhere in the shape.
© 2011 Visual Trading Systems, LLC
284
VT Trader 2.0 Help Manual
An Ellipse's contextual menu contains the following commands:
Delete
This command deletes the selected ellipse from the active chart window.
Delete All
This command deletes all ellipses from the active chart window.
Properties
This command opens the ellipse's properties 285 window.
Set to Default
This command resets any custom properties currently used by the ellipse back to their default
values.
Symmetric by Min
This command resizes the ellipse into a circle based on the smallest distance between 2 opposing
selection points.
Symmetric by Max
This command resizes the ellipse into a circle based on the largest distance between 2 opposing
selection points.
© 2011 Visual Trading Systems, LLC
Drawing Tools
285
Add Comment
This command adds a comment 243 and associates it specifically with the selected ellipse.
4.4.1.2
Properties
Selecting the Properties option from an ellipse's contextual menu opens the Ellipse Properties window.
From the Colors section, you can change the color of the ellipse, the ellipse's border, and the border's
© 2011 Visual Trading Systems, LLC
286
VT Trader 2.0 Help Manual
line style.
From the Calculations section, you can change the coordinates of the ellipse's selection points. You can
also change the drawing action the ellipse uses to redraw when one or more of its selection points are
changed. If the Move option is selected, the ellipse will change its location in the chart window while
maintaining its original size; if the Resize option is selected, the ellipse will change its size while
maintaining its current location in the chart window. You can also rotate the shape by changing the
Angle (from Horizontal) value.
From the Labels section, you can show or hide the ellipse's selection point labels. You can also change
the font attributes of the labels.
4.4.2
Rectangles
To draw a rectangle in the active chart window you must select the Rectangle tool. With the Rectangle
tool selected, position the cursor over a location in the active chart window to draw the rectangle. Once a
location is chosen, click and hold down the left mouse button to draw the shape in the chart window.
Once drawn on the chart, you can change the properties 288 of the rectangle (by using the contextual
menu 287 ), reposition it, or change its drawing points.
To reposition the rectangle, click the left mouse button while the cursor is hovering anywhere inside the
shape and with the left mouse button held down, drag the rectangle to its new location. Release the left
mouse button to finalize the new location of the rectangle.
© 2011 Visual Trading Systems, LLC
Drawing Tools
287
To recalculate the area that the rectangle covers, select the rectangle by positioning the cursor
anywhere inside the shape and clicking the left mouse button once. Next, position the cursor over and of
the drawing points around the shape's border; click and hold down the left mouse button to drag the
drawing point to its new location. The rectangle will redraw as the cursor is moved. Release the left
mouse button to finalize the redrawing according to the new drawing points.
You can click the right mouse button while the cursor is positioned anywhere inside the shape to
access its contextual menu 287 for additional functionality.
4.4.2.1
Contextual Menu
The contextual menu of a Rectangle 286 can be accessed by clicking the right mouse button while the
cursor is positioned anywhere in the shape.
A Rectangle's contextual menu contains the following commands:
Delete
This command deletes the selected rectangle from the active chart window.
© 2011 Visual Trading Systems, LLC
288
VT Trader 2.0 Help Manual
Delete All
This command deletes all rectangles from the active chart window.
Properties
This command opens the rectangle's properties 288 window.
Set to Default
This command resets any custom properties currently used by the rectangle back to their default
values.
Symmetric by Min
This command resizes the rectangle into a circle based on the smallest distance between 2
opposing selection points.
Symmetric by Max
This command resizes the rectangle into a circle based on the largest distance between 2 opposing
selection points.
Add Comment
This command adds a comment 243 and associates it specifically with the selected rectangle.
4.4.2.2
Properties
Selecting the Properties option from a rectangle's contextual menu opens the Rectangle Properties
window.
© 2011 Visual Trading Systems, LLC
Drawing Tools
289
From the Colors section, you can change the color of the rectangle, the rectangle's border, and the
border's line style.
From the Calculations section, you can change the coordinates of the rectangle's selection points. You
can also change the drawing action the rectangle uses to redraw when one or more of its selection
points are changed. If the Move option is selected, the rectangle will change its location in the chart
window while maintaining its original size; if the Resize option is selected, the rectangle will change its
size while maintaining its current location in the chart window. You can also rotate the shape by
changing the Angle (from Horizontal) value.
From the Labels section, you can show or hide the rectangle's selection point labels. You can also
change the font attributes of the labels.
© 2011 Visual Trading Systems, LLC
290
4.4.3
VT Trader 2.0 Help Manual
Triangles
To draw a triangle in the active chart window you must select the Triangle tool. With the Triangle tool
selected, position the cursor over a location in the active chart window to draw the triangle. Once a
location is chosen, click and hold down the left mouse button to draw the shape in the chart window.
Once drawn on the chart, you can change the properties 292 of the triangle (by using the contextual
menu 291 ), reposition it, or change its drawing points.
To reposition the triangle, click the left mouse button while the cursor is hovering anywhere inside the
shape and with the left mouse button held down, drag the rectangle to its new location. Release the left
mouse button to finalize the new location of the triangle.
To recalculate the area that the triangle covers, select the rectangle by positioning the cursor anywhere
inside the shape and clicking the left mouse button once. Next, position the cursor over and of the
drawing points around the shape's border; click and hold down the left mouse button to drag the drawing
point to its new location. The triangle will redraw as the cursor is moved. Release the left mouse button
to finalize the redrawing according to the new drawing points.
You can click the right mouse button while the cursor is positioned anywhere inside the shape to
access its contextual menu 291 for additional functionality.
© 2011 Visual Trading Systems, LLC
Drawing Tools
4.4.3.1
291
Contextual Menu
The contextual menu of a Triangle 290 can be accessed by clicking the right mouse button while the
cursor is positioned anywhere in the shape.
A Triangle's contextual menu contains the following commands:
Delete
This command deletes the selected triangle from the active chart window.
Delete All
This command deletes all triangles from the active chart window.
Properties
This command opens the triangle's properties 292 window.
Set to Default
This command resets any custom properties currently used by the triangle back to their default
values.
Add Comment
This command adds a comment 243 and associates it specifically with the selected triangle.
© 2011 Visual Trading Systems, LLC
292
4.4.3.2
VT Trader 2.0 Help Manual
Properties
Selecting the Properties option from a triangle's contextual menu opens the Triangle Properties
window.
From the Colors section, you can change the color of the triangle, the triangle's border, and the border's
line style.
From the Calculations section, you can change the coordinates of the triangle's selection points. You
can also change the drawing action the triangle uses to redraw when one or more of its selection points
are changed. If the Move option is selected, the triangle will change its location in the chart window while
maintaining its original size; if the Resize option is selected, the rectangle will change its size while
© 2011 Visual Trading Systems, LLC
Drawing Tools
293
maintaining its current location in the chart window. You can also rotate the shape by changing the
Angle (from Horizontal) value.
From the Labels section, you can show or hide the triangle's selection point labels. You can also
change the font attributes of the labels.
4.5
Fibonacci
4.5.1
Fibonacci Retracements
To draw Fibonacci Retracements in the active chart window you must select the Fibonacci
Retracements tool. With the Fibonacci Retracements tool selected, position the cursor over a
location in the active chart window to draw the Fibonacci Retracements. Once a location is chosen,
click and hold down the left mouse button to draw the lines in the chart window.
Once drawn on the chart, you can change the properties 295 of the Fibonacci Retracements (by using
the contextual menu 294 ), reposition them, or change the begin/end points used for calculations 295 .
To reposition the Fibonacci Retracements, click the left mouse button while the cursor is hovering over
any of the lines and with the left mouse button held down, drag the lines to their new location. Release
the left mouse button to finalize the new location of the Fibonacci Retracements.
To recalculate where the Fibonacci Retracements begins or ends, select the Fibonacci
Retracements by positioning the cursor over any of the lines and clicking the left mouse button once.
© 2011 Visual Trading Systems, LLC
294
VT Trader 2.0 Help Manual
Next, position the cursor over either the box at the beginning or the ending of the underlying trend line;
Click and hold down the left mouse button to drag the calculation point of the Fibonacci Retracements
to its new location. The Fibonacci Retracements will redraw as the cursor is moved around within the
chart window. Release the left mouse button to finalize the redrawing according to the new begin/end
points.
You can click the right mouse button while the cursor is hovering over any of the Fibonacci
Retracements to access its contextual menu 303 for additional functionality.
4.5.1.1
Contextual Menu
A Fibonacci Retracement's contextual menu contains the following commands:
Delete
This command deletes the selected Fibonacci retracements from the active chart window.
Delete All
This command deletes all Fibonacci retracements from the active chart window.
Properties
This command opens the Fibonacci retracement's properties 295 window.
© 2011 Visual Trading Systems, LLC
Drawing Tools
295
Set to Default
This command resets any custom properties currently used by the Fibonacci retracements back to
their default values.
Add Comment
This command adds a comment 243 and associates it specifically with the selected Fibonacci
retracements.
4.5.1.2
Properties
Using the Fibonacci Retracement's properties, you can:
Customize the Fibonacci lines (by click ing the [Define] button)
Extend the Fibonacci lines beyond their base line's beginning/ending points
Choose to show (left, right, or left+right) or hide the Percent and/or Price line labels
Change the line labels' font attributes
Choose to be alerted (in real-time and/or when the bar closes) if/when any Fibonacci line is
breached
© 2011 Visual Trading Systems, LLC
296
VT Trader 2.0 Help Manual
By clicking the [Define] button, you can show or hide up to 16 custom Fibonacci lines (each with their
own color, width, and style).
© 2011 Visual Trading Systems, LLC
Drawing Tools
4.5.2
297
Fibonacci Expansions
To draw Fibonacci Expansions in the active chart window you must select the Fibonacci
Expansions tool. With the Fibonacci Expansions tool selected, position the cursor over a location in
the active chart window to draw the Fibonacci Expansions. Once a location is chosen, click and hold
down the left mouse button to draw the lines in the chart window. This will draw the underlying A->B line.
The underlying B->C line will be auto-drawn to a 50% retracement level of the underlying A->B trend line.
© 2011 Visual Trading Systems, LLC
298
VT Trader 2.0 Help Manual
Once drawn on the chart, you can change the properties 300 of the Fibonacci Expansions (by using
the contextual menu 299 ), reposition them, or change the begin/end points used for calculations 300 .
To reposition the Fibonacci Expansions, click the left mouse button while the cursor is hovering over
any of the lines and with the left mouse button held down, drag the lines to their new location. Release
the left mouse button to finalize the new location of the Fibonacci Expansions.
To recalculate where the Fibonacci Expansions begins or ends, select the Fibonacci Expansions by
positioning the cursor over any of the lines and clicking the left mouse button once. Next, position the
cursor over either the box at the beginning or the ending of the underlying A->B trend line or B->C trend
line; Click and hold down the left mouse button to drag the calculation point of the Fibonacci
Expansions to its new location. The Fibonacci Expansions will redraw as the cursor is moved around
within the chart window. Release the left mouse button to finalize the redrawing according to the new
begin/end points.
You can click the right mouse button while the cursor is hovering over any of the Fibonacci Expansions
to access its contextual menu 299 for additional functionality.
© 2011 Visual Trading Systems, LLC
Drawing Tools
4.5.2.1
299
Contextual Menu
A Fibonacci Expansion's contextual menu contains the following commands:
Delete
This command deletes the selected Fibonacci expansions from the active chart window.
Delete All
This command deletes all Fibonacci expansions from the active chart window.
Properties
This command opens the Fibonacci expansion's properties 300 window.
Set to Default
This command resets any custom properties currently used by the Fibonacci expansions back to
their default values.
Add Comment
This command adds a comment 243 and associates it specifically with the selected Fibonacci
expansions.
© 2011 Visual Trading Systems, LLC
300
4.5.2.2
VT Trader 2.0 Help Manual
Properties
Using the Fibonacci Expansion's properties, you can:
Customize the Fibonacci lines (by click ing the [Define] button)
Extend the Fibonacci lines beyond their base line's beginning/ending points
Choose to show (left, right, or left+right) or hide the Percent and/or Price line labels
Change the line labels' font attributes
Choose to be alerted (in real-time and/or when the bar closes) if/when any Fibonacci line is
breached
By clicking the [Define] button, you can show or hide up to 16 custom Fibonacci lines (each with their
own color, width, and style).
© 2011 Visual Trading Systems, LLC
Drawing Tools
4.5.3
301
Fibonacci Time Extensions
To draw vertical Fibonacci lines in the active chart window you must select the Fibonacci Time
Extension tool. With the Fibonacci Time Extension tool selected, position the cursor over a location
in the active chart window to draw the Fibonacci Time Extensions. Once a location is chosen, click
and hold down the left mouse button to draw the lines in the chart window.
© 2011 Visual Trading Systems, LLC
302
VT Trader 2.0 Help Manual
Once drawn on the chart, you can change the properties 304 of the Fibonacci Time Extensions (by
using the contextual menu 303 ), reposition them, or change the begin/end points used for calculations 304
.
To reposition the Fibonacci Time Extensions, click the left mouse button while the cursor is hovering
over any of the lines and with the left mouse button held down, drag the lines to their new location.
Release the left mouse button to finalize the new location of the Fibonacci Time Extensions.
To recalculate where the Fibonacci Time Extensions begin or end, select the Fibonacci Time
Extensions by positioning the cursor over any of the lines and clicking the left mouse button once. Next,
position the cursor over either the box at the beginning or the ending of the underlying trend line; Click
and hold down the left mouse button to drag the calculation point of the Fibonacci Time Extensions to
its new location. The Fibonacci Time Extensions will redraw as the cursor is moved around within the
chart window. Release the left mouse button to finalize the redrawing according to the new begin/end
points.
You can click the right mouse button while the cursor is hovering over any of the Fibonacci Time
Extensions to access its contextual menu 303 for additional functionality.
© 2011 Visual Trading Systems, LLC
Drawing Tools
4.5.3.1
303
Contextual Menu
A Fibonacci Time Extension's contextual menu contains the following commands:
Delete
This command deletes the selected Fibonacci time extensions from the active chart window.
Delete All
This command deletes all Fibonacci time extensions from the active chart window.
Properties
This command opens the Fibonacci time extension's properties 304 window.
Set to Default
This command resets any custom properties currently used by the Fibonacci time extensions back
to their default values.
Add Comment
This command adds a comment 243 and associates it specifically with the selected Fibonacci time
extensions.
© 2011 Visual Trading Systems, LLC
304
4.5.3.2
VT Trader 2.0 Help Manual
Properties
Using the Fibonacci Time Extension's properties, you can:
Customize the Fibonacci lines (by click ing the [Define] button)
Choose to show or hide the Percent line labels
Change the line labels' font attributes
By clicking the [Define] button, you can show or hide up to 16 custom Fibonacci lines (each with their
own color, width, and style).
© 2011 Visual Trading Systems, LLC
Drawing Tools
4.5.4
305
Fibonacci Channels
To draw a Fibonacci Channel in the active chart window you must select the Fibonacci Channel tool.
With the Fibonacci Channel tool selected, position the cursor over a location in the active chart
window to draw the Fibonacci Channel. Once a location is chosen, click and hold down the left mouse
button to draw the lines in the chart window.
© 2011 Visual Trading Systems, LLC
306
VT Trader 2.0 Help Manual
Once drawn on the chart, you can change the properties 308 of the Fibonacci Channel (by using the
contextual menu 307 ), reposition it, or change the begin/end points used for calculations 308 .
To reposition the Fibonacci Channel, click the left mouse button while the cursor is hovering over any
of the lines and with the left mouse button held down, drag the lines to their new location. Release the
left mouse button to finalize the new location of the Fibonacci Channel.
To recalculate where the Fibonacci Channel begins or ends, select the Fibonacci Channel by
positioning the cursor over any of the lines and clicking the left mouse button once. Next, position the
cursor over either the box at the beginning or the ending of the underlying trend line; Click and hold down
the left mouse button to drag the calculation point of the Fibonacci Channel to its new location. The
Fibonacci Channel will redraw as the cursor is moved around within the chart window. Release the left
mouse button to finalize the redrawing according to the new begin/end points.
You can click the right mouse button while the cursor is hovering over any of the Fibonacci Channel
lines to access its contextual menu 307 for additional functionality.
© 2011 Visual Trading Systems, LLC
Drawing Tools
4.5.4.1
307
Contextual Menu
A Fibonacci Channel's contextual menu contains the following commands:
Delete
This command deletes the selected Fibonacci channel from the active chart window.
Delete All
This command deletes all Fibonacci channels from the active chart window.
Properties
This command opens the Fibonacci channel's properties 308 window.
Set to Default
This command resets any custom properties currently used by the Fibonacci channel back to their
default values.
Add Comment
This command adds a comment 243 and associates it specifically with the selected Fibonacci
channel.
© 2011 Visual Trading Systems, LLC
308
4.5.4.2
VT Trader 2.0 Help Manual
Properties
Using the Fibonacci Channel's properties, you can:
Customize the Fibonacci lines (by click ing the [Define] button)
Extend the Fibonacci lines beyond their base line's beginning/ending points
Choose to show or hide the Percent line labels
Change the line labels' font attributes
Choose to be alerted (in real-time and/or when the bar closes) if/when any Fibonacci line is
breached
By clicking the [Define] button, you can show or hide up to 16 custom Fibonacci lines (each with their
own color, width, and style).
© 2011 Visual Trading Systems, LLC
Drawing Tools
4.5.5
309
Fibonacci Fans
To draw a Fibonacci Fan in the active chart window you must select the Fibonacci Fan tool. With the
Fibonacci Fan tool selected, position the cursor over a location in the active chart window to draw the
Fibonacci Fan. Once a location is chosen, click and hold down the left mouse button to draw the lines
in the chart window.
© 2011 Visual Trading Systems, LLC
310
VT Trader 2.0 Help Manual
Once drawn on the chart, you can change the properties 312 of the Fibonacci Fan (by using the
contextual menu 311 ), reposition it, or change the begin/end points used for calculations 312 .
To reposition the Fibonacci Fan, click the left mouse button while the cursor is hovering over one of its
lines and with the left mouse button held down, drag the fan to its new location. Release the left mouse
button to finalize the new location of the Fibonacci Fan.
To recalculate where the Fibonacci Fan begins or ends, select the Fibonacci Fan by positioning the
cursor over one of its lines and clicking the left mouse button once. Next, position the cursor over either
the box at the beginning or the ending of the underlying trend line; Click and hold down the left mouse
button to drag the calculation point of the Fibonacci Fan to its new location. The Fibonacci Fan will
redraw as the cursor is moved around within the chart window. Release the left mouse button to finalize
the redrawing according to the new begin/end points.
You can click the right mouse button while the cursor is hovering over the Fibonacci Fan to access its
contextual menu 311 for additional functionality.
© 2011 Visual Trading Systems, LLC
Drawing Tools
4.5.5.1
311
Contextual Menu
A Fibonacci Fan's contextual menu contains the following commands:
Delete
This command deletes the selected Fibonacci fan from the active chart window.
Delete All
This command deletes all Fibonacci fans from the active chart window.
Properties
This command opens the Fibonacci fan's properties 312 window.
Set to Default
This command resets any custom properties currently used by the Fibonacci fan back to their
default values.
Add Comment
This command adds a comment 243 and associates it specifically with the selected Fibonacci fan.
© 2011 Visual Trading Systems, LLC
312
4.5.5.2
VT Trader 2.0 Help Manual
Properties
Using the Fibonacci Fan's properties, you can:
Customize the Fibonacci lines (by click ing the [Define] button)
Extend the Fibonacci lines beyond their base line's beginning/ending points
Choose to show or hide the Percent line labels
Change the line labels' font attributes
Choose to be alerted (in real-time and/or when the bar closes) if/when any Fibonacci line is
breached
By clicking the [Define] button, you can show or hide up to 16 custom Fibonacci lines (each with their
own color, width, and style).
© 2011 Visual Trading Systems, LLC
Drawing Tools
4.5.6
313
Fibonacci Arcs
To draw a Fibonacci Arc in the active chart window you must select the Fibonacci Arc tool. With the
Fibonacci Arc tool selected, position the cursor over a location in the active chart window to draw the
Fibonacci Arc. Once a location is chosen, click and hold down the left mouse button to draw the lines
in the chart window.
© 2011 Visual Trading Systems, LLC
314
VT Trader 2.0 Help Manual
Once drawn on the chart, you can change the properties 316 of the Fibonacci Arc (by using the
contextual menu 315 ), reposition it, or change the begin/end points used for calculations 316 .
To reposition the Fibonacci Arc, click the left mouse button while the cursor is hovering over one of its
lines and with the left mouse button held down, drag the arc to its new location. Release the left mouse
button to finalize the new location of the Fibonacci Arc.
To recalculate where the Fibonacci Arc begins or ends, select the Fibonacci Arc by positioning the
cursor over one of its lines and clicking the left mouse button once. Next, position the cursor over either
the box at the beginning or the ending of the underlying trend line; Click and hold down the left mouse
button to drag the calculation point of the Fibonacci Arc to its new location. The Fibonacci Arc will
redraw as the cursor is moved around within the chart window. Release the left mouse button to finalize
the redrawing according to the new begin/end points.
You click the right mouse button while the cursor is hovering over the Fibonacci Arc to access its
contextual menu 315 for additional functionality.
© 2011 Visual Trading Systems, LLC
Drawing Tools
4.5.6.1
315
Contextual Menu
A Fibonacci Arc's contextual menu contains the following commands:
Delete
This command deletes the selected Fibonacci arc from the active chart window.
Delete All
This command deletes all Fibonacci arcs from the active chart window.
Properties
This command opens the Fibonacci arc's properties 316 window.
Set to Default
This command resets any custom properties currently used by the Fibonacci arc back to their
default values.
Add Comment
This command adds a comment 243 and associates it specifically with the selected Fibonacci arc.
© 2011 Visual Trading Systems, LLC
316
4.5.6.2
VT Trader 2.0 Help Manual
Properties
Using the Fibonacci Arc's properties, you can:
Customize the Fibonacci lines (by click ing the [Define] button)
Extend the Fibonacci lines beyond their base line's beginning/ending points into a full arc
Choose to show or hide the Percent line labels
Change the line labels' font attributes
Choose to be alerted (in real-time and/or when the bar closes) if/when any Fibonacci line is
breached
By clicking the [Define] button, you can show or hide up to 16 custom Fibonacci lines (each with their
own color, width, and style).
© 2011 Visual Trading Systems, LLC
Drawing Tools
4.6
Gann
4.6.1
Gann Lines
317
To draw a Gann line in the active chart window you must select the Gann Line tool. With the Gann
Line tool selected, position the cursor over a location in the active chart window to start the calculation
of the Gann line. This is typically from a low or high point in price. Once a starting position is selected,
click the left mouse button to draw the Gann on the chart. The Gann line will initially be drawn at an
exact 45 degree angle.
The Gann line at 45 degrees is commonly referred to as the 1x1 ratio; 1 unit of time is equal to a 1 unit
rise (or decline) in the instrument's measure of price. In Forex, the smallest unit of price is called a pip.
© 2011 Visual Trading Systems, LLC
318
VT Trader 2.0 Help Manual
Once drawn on the chart, you can change the properties 320 of the Gann line (by using the contextual
menu 319 ), reposition it, or change the begin/end points used for calculations 323 .
To reposition the Gann line, you should click the left mouse button while the cursor is hovering over it
and with the left mouse button held down, drag the line to its new location. Release the left mouse
button to finalize the new location of the Gann line.
To recalculate where the Gann line begins or ends, select the Gann line by positioning the cursor over
it and clicking the left mouse button once. Next, position the cursor over either the box at the beginning
or in the middle of the line (see screenshot above); Click and hold down the left mouse button to drag
the calculation point of the Gann line to its new location. The Gann line will redraw as the cursor is
moved around within the chart window. Release the left mouse button to finalize the redrawing according
to the new begin/end points.
As an alternate method of recalculation, you can manually adjust the beginning point and/or rise and run
values used for calculation 320 of the Gann line by clicking the right mouse button once while the cursor
is hovering over the line and selecting Properties from the contextual menu 319 .
You can click the right mouse button while the cursor is hovering over the Gann line to access its
contextual menu 319 for additional functionality.
© 2011 Visual Trading Systems, LLC
Drawing Tools
4.6.1.1
319
Contextual Menu
A Gann Line's contextual menu contains the following commands:
Delete
This command deletes the selected Gann line from the active chart window.
Delete All
This command deletes all Gann lines from the active chart window.
Properties
This command opens the Gann line's properties 320 window.
Set to Default
This command resets any custom properties currently used by the Gann line back to their default
values.
Add Comment
This command adds a comment 243 and associates it specifically with the selected Gann line.
© 2011 Visual Trading Systems, LLC
320
4.6.1.2
VT Trader 2.0 Help Manual
Properties
Using the Gann Line's properties, you can:
Change the color, width, and style of the Gann line
Change the run of the line (the # of bars between the beginning and ending points used for
calculation)
Change the rise of the line (the # of pips between the beginning and ending points used for
calculation)
Change the beginning values (price/date/time) of the Gann line
Extend the Gann line from its beginning point
Choose to be alerted (in real-time and/or when the bar closes) if/when the Gann line is breached
© 2011 Visual Trading Systems, LLC
Drawing Tools
4.6.2
321
Gann Fans
To draw a Gann Fan in the active chart window you must select the Gann Fan tool. With the Gann
Fan tool selected, position the cursor over a location in the active chart window to draw the Gann Fan.
Once a location is chosen, click the left mouse button to draw the Gann Fan in the chart window. The
Gann fan will initially be drawn with the middle (base) line at an exact 45 degree angle.
The Gann line at 45 degrees is commonly referred to as the 1x1 ratio; 1 unit of time is equal to a 1 unit
rise (or decline) in the instrument's measure of price. In Forex, the smallest unit of price is called a pip.
Other important lines used to construct the Gann fan (from top to bottom) are:
1x8 - 82.5 degrees
1x4 - 75 degrees
1x3 - 71.25 degrees
1x2 - 63.75 degrees
1x1 - 45 degrees (base line - most important according to Gann!)
2x1 - 26.25 degrees
3x1 - 18.75 degrees
4x1 - 15 degrees
8x1 - 7.5 degrees
Once drawn on the chart, you can change the properties 323 of the Gann Fan (by using the contextual
menu 322 ), reposition it, or change the begin/end points used for calculations 320 .
To reposition the Gann Fan, click the left mouse button while the cursor is hovering over one of its lines
and with the left mouse button held down, drag the fan to its new location. Release the left mouse button
to finalize the new location of the Gann Fan.
© 2011 Visual Trading Systems, LLC
322
VT Trader 2.0 Help Manual
To recalculate where the Gann Fan begins or ends, select the Gann Fan by positioning the cursor over
one of its lines and clicking the left mouse button once. Next, position the cursor over either the box at
the beginning or along the 1x1 line; Click and hold down the left mouse button to drag the calculation
point of the Gann Fan to its new location. The Gann Fan will redraw as the cursor is moved around
within the chart window. Release the left mouse button to finalize the redrawing according to the new
begin/end points.
As an alternate method of recalculation, you can manually adjust the beginning point and/or rise and run
values used for calculation 323 of the Gann fan by clicking the right mouse button while the cursor is
hovering over any of its lines and selecting Properties from the contextual menu 322 .
You can click the right mouse button while the cursor is hovering over the Gann Fan to access its
contextual menu 322 for additional functionality.
4.6.2.1
Contextual Menu
A Gann Fan's contextual menu contains the following commands:
Delete
This command deletes the selected Gann fan from the active chart window.
Delete All
This command deletes all Gann fans from the active chart window.
© 2011 Visual Trading Systems, LLC
Drawing Tools
323
Properties
This command opens the Gann fan's properties 323 window.
Set to Default
This command resets any custom properties currently used by the Gann fan back to their default
values.
Add Comment
This command adds a comment 243 and associates it specifically with the selected Gann fan.
4.6.2.2
Properties
Using the Gann Fan's properties, you can:
Change the color, width, and style of the Gann lines
Change the run of the Gann fan's base line (the # of bars between the beginning and ending points
used for calculation)
Change the rise of the Gann fan's base line (the # of pips between the beginning and ending points
used for calculation)
Change the beginning values (price/date/time) of the Gann fan's base line
Choose to be alerted (in real-time and/or when the bar closes) if/when any Gann line is breached
© 2011 Visual Trading Systems, LLC
324
4.6.3
VT Trader 2.0 Help Manual
Gann Grids
To draw a Gann Grid in the active chart window you must select the Gann Grid tool. With the Gann
Grid tool selected, position the cursor over a location in the active chart window to draw the Gann Grid.
Once a location is chosen, click the left mouse button to draw the Gann Grid in the chart window. The
Gann Grid will initially be drawn with the middle (base) line at an exact 45 degree angle.
The Gann line at 45 degrees is commonly referred to as the 1x1 ratio; 1 unit of time is equal to a 1 unit
rise (or decline) in the instrument's measure of price. In Forex, the smallest unit of price is called a pip.
The 1x1 ratio 45 degree line is considered to be the most important line for measuring the price trend
according to Gann.
© 2011 Visual Trading Systems, LLC
Drawing Tools
325
Once drawn on the chart, you can change the properties 327 of the Gann Grid (by using the contextual
menu 326 ), reposition it, or change the begin/end points used for calculations 327 .
To reposition the Gann Grid, click the left mouse button while the cursor is hovering over one of its lines
and with the left mouse button held down, drag the fan to its new location. Release the left mouse button
to finalize the new location of the Gann Grid.
To recalculate where the Gann Grid begins or ends, select the Gann Grid by positioning the cursor
over one of its lines and clicking the left mouse button once. Next, position the cursor over either the box
at the beginning or along the 1x1 line; Click and hold down the left mouse button to drag the calculation
point of the Gann Grid to its new location. The Gann Grid will redraw as the cursor is moved around
within the chart window. Release the left mouse button to finalize the redrawing according to the new
begin/end points.
As an alternate method of recalculation, you can manually adjust the beginning point and/or rise and run
values used for calculation 327 of the Gann Grid by clicking the right mouse button while the cursor is
hovering over any of its lines and selecting Properties from the contextual menu 326 .
You can click the right mouse button while the cursor is hovering over the Gann Grid to access its
contextual menu 326 for additional functionality.
© 2011 Visual Trading Systems, LLC
326
4.6.3.1
VT Trader 2.0 Help Manual
Contextual Menu
A Gann Grid's contextual menu contains the following commands:
Delete
This command deletes the selected Gann grid from the active chart window.
Delete All
This command deletes all Gann grids from the active chart window.
Properties
This command opens the Gann grid's properties 327 window.
Set to Default
This command resets any custom properties currently used by the Gann grid back to their default
values.
Add Comment
This command adds a comment 243 and associates it specifically with the selected Gann grid.
© 2011 Visual Trading Systems, LLC
Drawing Tools
4.6.3.2
327
Properties
Using the Gann Grid's properties, you can:
Change the color, width, and style of the Gann lines
Change the run of the Gann grid's base line (the # of bars between the beginning and ending points
used for calculation)
Change the rise of the Gann grid's base line (the # of pips between the beginning and ending points
used for calculation)
Change the beginning values (price/date/time) of the Gann grid's base line
Choose to be alerted (in real-time and/or when the bar closes) if/when any Gann line is breached
© 2011 Visual Trading Systems, LLC
VT Trader Scripting Language
Part
V
VT Trader Scripting Language
5
329
VT Trader Scripting Language
VT Trader's scripting language is simple, yet powerful. It enables you to create (and/or edit) custom
indicators and trading systems using the Indicators Builder 182 and/or Trading Systems Builder 205 . It's
extremely important that you take the time necessary to thoroughly read through this section of the help
manual. It explains VT Trader's scripting language's basic structure and syntax, lexical elements, and
instruction processing rules.
VT Trader's Scripting Language Structure
An indicator and/or trading system built with VT Trader's scripting language is constructed using one or
more statements. Each statement consists of an output variable, the variable assignment (:=), followed
by one or more logical expressions containing any combination of various input variables 195 , output
variables 200 , other scripting language elements 330 (see below), and ending with the statement
terminator (;).
VT Trader's scripting language evaluates each statement in a formula script one time for each bar loaded
into the chart window and continues to evaluate each statement one time per each new, incoming price
tick. Statements in a formula script are evaluated starting from the first (top) statement and ending with
the last (bottom) statement.
Important Notes:
* Each statement must be terminated by semicolon (;). Multiple lines of code will be treated as a single
statement until the terminating semicolon (allowing you to break apart long block s of code into separate
lines in the editor to increase your code's readability and clarity).
* Variable names are not case-sensitive; for example, using Periods is the same as using periods.
Variable names may include only letters and numbers. Use of the underscore ( _ ) character is also
allowed. Variable names may not include any spaces or begin with a number. Variables must not be the
same name as any existing function 334 or reserved function 400 , constant 333 , or predefined data array
334 . Additionally, no output variables 200 should have the same name as any input variables 195 within
the same formula script.
* When using fractional integers (integers with decimal places), if the whole number portion of the
fractional integer is 0, the 0 must be included in the formula. For example, .0030 is incorrect. 0.0030 is
correct; if the initial 0 is not included VT Trader will not recognize and evaluate the fractional integer
correctly.
Correct Statement Examples:
OutputVariable := Mov( C,12,E ) > Mov( C,26,E ) ;
OutputVariable1 := Mov( C,12,E ) ;
_OutputVariable := 26 ;
_OutputVariable_2 := (Mov( C,12,E ) > Mov( C,26,E )) AND C > ref(C,-1) ;
OutputVariable := abs(Mov( C,12,E ) - Mov( C,26,E )) > 0.0010 ;
Incorrect Statement Examples:
© 2011 Visual Trading Systems, LLC
330
VT Trader 2.0 Help Manual
OutputVariable 1 = Mov( C,12,E ) > Mov( C,26,E ) ; {the variable's name
and the variable's assignment punctuator is incorrect}
2OutputVariable := Mov( C,12,E ) {the variable's name is incorrect and
the statement terminator is missing}
Close = 26 ; {Close is a predefined data array and the variable's
assignment punctuator is incorrect}
InputVariable := InputVariable ; {the output variable and input variable
cannot have same name}
OutputVariable := abs(Mov( C,12,E ) - Mov( C,26,E )) > .0010 ; {the
fractional integer .0010 must be specified as 0.0010}
VT Trader's Scripting Language Elements
The following elements help form the basis of VT Trader's scripting language:
Comments 330
Punctuators (Separators) 331
Operators 331
Constants 333
Pre-Defined Data Arrays 334
Functions (Identifiers) - Alphabetical List 334
Functions (Identifiers) - Reserved For Future Use 400
To learn more about a particular element, please click on its name.
5.1
Comments
Comments are pieces of text used to annotate a formula script. Comments are for the programmer's
use only; they are stripped from the source code before parsing.
VT Trader's scripting language supports two types of comments.
Multiple-line Comments are any sequence of characters placed inside a set of balanced brackets ( {
and } ). The comment terminates at the first occurrence of right bracket " } " following the initial left
bracket " { ". { } can also be used to define only certain text within a single line as a comment as well.
However, comments delineated with a set of balanced brackets cannot be nested.
Single-line Comments are any sequence of characters placed after two adjacent slashes ( // ) in any
position within a line of code and extending until the next new line. Comments delineated by two
adjacent slashes ( // ) within a single line can be nested within comments delineated by a set of
balanced brackets ( { and } ). Comments delineated by two adjacent slashes ( // ) cannot be the last line
of code in the formula script.
© 2011 Visual Trading Systems, LLC
VT Trader Scripting Language
5.2
331
Punctuators
Punctuators (a.k .a. Separators) are used to maintain the basic syntax of VT Trader's scripting
language. The available punctuators and their descriptions are defined in the table below.
PUNCTUATOR
:=
Colon grouped with Equal sign; Variable Assignment
;
Semi-colon; Statement Terminator
,
Comma; Separates the parameters of a function argument list
( )
5.3
DESCRIPTION
Parentheses; Used to override normal order of precedence, group or
isolate conditional expressions, and indicate function calls and function
parameters
Operators
VT Trader's scripting language provides several operators that allow you to manipulate functions 334 and
values to create more complex expressions. The different types of operators available are:
Mathematical Operators 331
Relational Operators 332
Logical Operators 332
Operators are always evaluated in a specific order. This order is called an order of precedence. Each
type of operator has its own order of precedence within its group and each group has an overall order of
precedence. The exact order of the overall order of precedence is Logical Operators 332 , then Relational
Operators 332 , and lastly Mathematical Operators 331 .
Parentheses are always evaluated first so they can be used to control the operation precedence. This
allows the user to bypass part of the order of precedence to perform the calculations within the
parentheses first. However, the order of precedence is still enforced within the parentheses. If there are
multiple sets of parentheses in use, operations within the innermost parentheses are evaluated first.
5.3.1
Mathematical Operators
Mathematical operators are used to perform specific mathematical computations. The available
mathematical operators and their descriptions are defined in the table below.
SYMBOL
DESCRIPTION
+
Addition
-
Subtraction
*
Multiplication
/
Division
© 2011 Visual Trading Systems, LLC
332
VT Trader 2.0 Help Manual
SYMBOL
()
DESCRIPTION
Parentheses
Mathematical operators are always evaluated in a specific order. The exact order is Parentheses, M
ultiplication, Division, Addition, and then Subtraction. A common English expression used to remember
this order is: Please My Dear Aunt Sally.
Since parentheses are evaluated first, they can be used to control the operation precedence. This allows
you to bypass part of the order of precedence to perform the calculations within the parentheses first.
However, the order of precedence is still enforced within the parentheses.
If there is more than one instance of a particular type of mathematical operation (i.e. more than one
multiplication operation) within a set of parentheses the respective operations are evaluated from left to
right.
If there are multiple sets of parentheses in use, operations within the innermost parentheses are
evaluated first.
5.3.2
Relational Operators
Relational operators are used to perform standard comparisons. The result of a comparison will
always be True or False (1 or 0 respectively). The available relational operators are:
SYMBOL
DESCRIPTION
>
Greater Than
<
Less Than
>=
Greater Than or Equal To
<=
Less Than or Equal To
=
<>
Equal To
Not Equal To
Relational operators are always evaluated from left to right because they all have the same
precedence. Parentheses can be used to further control the order of precedence when necessary.
5.3.3
Logical Operators
Logical operators (a.k .a. Booleans) are used to combine two true/false expressions. There are 3
logical operators available in VT Trader's scripting language: AND, OR, and NOT
AND is used when the result of both true/false expressions must be true.
OR is used when the result of either one or both of the two true/false expressions must be true.
NOT is used when you want the opposite value (True or False) of an expression.
The tables below define the resulting values when using AND and OR.
© 2011 Visual Trading Systems, LLC
VT Trader Scripting Language
EXPRESSION 1
EXPRESSION 2
AND RESULT
True
True
True
True
False
False
False
True
False
False
False
False
EXPRESSION 1
333
EXPRESSION 2
OR RESULT
True
True
True
True
False
True
False
True
True
False
False
False
When using multiple AND's, OR's, and NOT's they are always evaluated in the order they appear, from
left to right, because they all have the same precedence. Parentheses can be used to further control the
order of precedence when necessary.
5.4
Constants
A constant is an predefined fixed value (or programming calculation) in VT Trader's scripting language
that cannot be altered. The available constants and their descriptions are defined in the tables below.
GLOBAL
DESCRIPTION
Pi
3.1415926535897932385
NULL
Not Defined; Empty Variable
MOVING AVERAGE (MOV()) FUNCTION
DESCRIPTION
S
Simple moving average
W
Weighted moving average
E
Exponential moving average
SW
Sine Weighted moving average
TRI
Triangle moving average
EP
End Point moving average
VOL
Volume-Adjusted moving average
RATE OF CHANGE (ROC()) FUNCTION
DESCRIPTION
Points
Calculate ROC() 376 using points (pips)
difference
Percent
Calculate ROC() 376 using percentage
difference
© 2011 Visual Trading Systems, LLC
334
5.5
VT Trader 2.0 Help Manual
Predefined Data Arrays
The following Predefined Data Arrays have been provided in VT Trader's scripting language. The
Predefined Data Arrays can be referenced in Functions 334 using either their Full Name or
Abbreviation. Please note that data arrays are not case-sensitive (i.e.: Open is the same as open).
FULL NAME
5.6
ABBREVIATION
DESCRIPTION
Close
C
Close price
Open
O
Open price
High
H
High price
Low
L
Low price
Median Price
MP or MP()
(High + Low) / 2
Typical Price
TP or TP()
(High + Low + Close) / 3
Weighted Close
WC or WC()
((Close * 2) + High + Low) / 4
haClose
haC
Heikin-Ashi Close price
haOpen
haO
Heikin-Ashi Open price
haHigh
haH
Heikin-Ashi High price
haLow
haL
Heikin-Ashi Low price
Volume
V
# of incoming price ticks
during bar
Prev
Prev
See PREV 374 function
Functions
At a basic level, functions are nothing more than a predefined, self-contained set of calculations that
can be used in comparisons and calculations. Each function has a specified name and returns a value
based on its underlying calculation routine. VT Trader's scripting language includes a large number of
built-in functions ranging from simple price calculations and indicators to specifically-designed
functions used in conjunction with technical analysis.
© 2011 Visual Trading Systems, LLC
VT Trader Scripting Language
The following alphabetical list of functions are available for use in VT Trader's scripting language:
A
Absolute Value 338
Arc Tangent 339
Aroon Down 339
Aroon Up 340
Average True Range 340
B
Bar Count 341
Bar Index 341
Bars Since 342
Bollinger Band 343
Bollinger Band Bottom 342
Bollinger Band Top 342
Buy Position Count 344
C
Ceiling 344
Commodity Channel Index 345
Cosine 346
Cross 346
Cumulate 348
D
Day Of Month 348
Day Of Week 349
Detrended Price Oscillator 349
E
Error 350
Event Count 351
Exponent 354
F
Floor 355
Fraction 355
G
Gap Down 356
Gap Up 356
H
© 2011 Visual Trading Systems, LLC
335
336
VT Trader 2.0 Help Manual
Highest 357
Highest Bars Ago 357
Highest High Value 358
Highest High Value Bars Ago 359
Highest Since 359
Highest Since Bars Ago 360
I
If () 360
Inside 362
Integer 362
IsDefined 362
IsUndefined 363
L
Linear Regression Indicator 363
Linear Regression Slope 364
Logarithm 364
Lowest 364
Lowest Bars Ago 364
Lowest Low Value 365
Lowest Low Value Bars Ago 366
Lowest Since 366
Lowest Since Bars Ago 367
M
Mama 367
Maximum 368
Median Price 368
Midpoint 369
Minimum 369
Minute 369
Modulus 370
Month 370
Moving Average 371
N
Negative 371
O
Outside 371
P
Parabolic SAR 372
Peak Value 373
Position Count 373
Power 373
© 2011 Visual Trading Systems, LLC
VT Trader Scripting Language
Precision 374
R
Rally 376
Random 376
Rate of Change 376
Reaction 377
Reference 377
Relative Strength Index (RSI) 379
Round 379
S
Sell Position Count 379
Signal Flag 380
Signal Hold 382
Signal Remove 384
Signal Remove Span 387
Sine 389
Square Root 389
Standard Deviation 389
Standard Error 390
Stochastic Momentum Index 390
Stochastic Oscillator 391
Summation 392
Symbol Digits 392
Symbol Point 394
T
Typical Price 397
U
Ultimate Oscillator 397
V
Value When 398
Vertical Horizontal Filter 398
W
Weighted Close 399
Williams %R 399
Y
Year 400
Z
© 2011 Visual Trading Systems, LLC
337
338
VT Trader 2.0 Help Manual
Zli 400
5.6.1
Absolute Value
Absolute Value
abs (DATA ARRAY)
The function calculates the Absolute Value of the DATA ARRAY.
The formula abs(-12) will return +12;
The formula abs(12) will also return +12.
5.6.2
Account Status
Account Status
* This function is not and never has been officially supported
** It is strongly recommended to use any of the PositionCount(), BuyPositionCount(), and/or
SellPositionCount() functions instead of the AccountStatus() function.
AccountStatus ()
This function returns one of four possible constants for any given tick (i.e. incoming price):
No_Position_Active, Buy_Position_Active, Sell_Position_Active, or Both_Position_Active. For this
reason, it is strongly advised that AccountStatus() not be used in trading systems that operate on the
premise of "always in the market" (i.e. when one position gets closed another position gets immediately
opened in the opposing direction, etc.).
No_Position_Active = This constant indicates that there are no open buy or sell positions in the
instrument the trading system is attached to based on the trading system's assigned account.
Buy_Position_Active = This constant indicates that there is at least one open buy position in the
instrument the trading system is attached to based on the trading system's assigned account.
Sell_Position_Active = This constant indicates that there is at least one open sell position in the
instrument the trading system is attached to based on the trading system's assigned account.
Both_Position_Active = This constant indicates that there is at least one open buy position and at
least one open sell position in the instrument the trading system is attached to based on the trading
system's assigned account.
OpenBuy:= AccountStatus()=No_Position_Active AND cross(C,mov(C,10,S));
CloseBuy:= AccountStatus()=Buy_Position_Active AND cross(mov(C,10,S),C);
* Please note, in this example (assuming OpenBuy and CloseBuy are logical variables and the trading
© 2011 Visual Trading Systems, LLC
VT Trader Scripting Language
339
system this code is included in is running in Auto-Trade mode), in order for AccountStatus() to function
properly OpenBuy and CloseBuy cannot both equal true on the same price tick; if such a thing were to
happen then only OpenBuy would be able to equal true and be able to execute its associated automated
trading request because it is evaluated in the code before CloseBuy. If CloseBuy needed to execute its
associated automated trading order on the same tick as OpenBuy it would not be able to because
AccountStatus() cannot return No_Position_Active and Buy_Position_Active at the same time for that
same tick.
5.6.3
Arc Tangent
Arc Tangent
atan (Y DATA ARRAY, X DATA ARRAY)
The function returns the Arc Tangent of Y/X.
The value is returned in degrees from 0 to 359.9.
Also acceptable is...
atan (DATA ARRAY)
The function returns the Arc Tangent of DATA ARRAY.
The value is returned in radians from -Pi/2 to Pi/2.
For translation to degrees in a range of -90 to +90 it is necessary to use:
Out:= ATAN(DATA ARRAY) * 180/Pi;
{where Pi is global constant 3.1415926535897932385}
5.6.4
Aroon Down
Aroon Down
AroonDown (DATA ARRAY, PERIODS)
Calculates the Aroon Down component of the Aroon Indicator. Use of the DATA ARRAY parameter is
only necessary if the user wishes to substitute a DATA ARRAY other than the Low price for the
calculations. Otherwise, it is acceptable to use the AroonDown() function without including it such as:
AroonDown (PERIODS)
The function AroonDown(DATA ARRAY, PERIODS) calculates the Aroon Down component of the
Aroon Indicator by formula:
{Aroon Down component of the Aroon Indicator}
_AroonDown := ((PERIODS - LLVBars(DATA ARRAY,PERIODS+1)) / PERIODS) * 100;
{end}
© 2011 Visual Trading Systems, LLC
340
VT Trader 2.0 Help Manual
The function AroonDown(Low,14) calculates the Aroon Down component of the Aroon Indicator over
14 periods.
5.6.5
Aroon Up
Aroon Up
AroonUp (DATA ARRAY, PERIODS)
Calculates the Aroon Up component of the Aroon Indicator. Use of the DATA ARRAY parameter is only
necessary if the user wishes to substitute a DATA ARRAY other than the High price for the calculations.
Otherwise, it is acceptable to use the AroonUp() function without including it such as:
AroonUp (PERIODS)
The function AroonUp(DATA ARRAY, PERIODS) calculates the Aroon Up component of the Aroon
Indicator by formula:
{Aroon Down component of the Aroon Indicator}
_AroonUp := ((PERIODS - HHVBars(DATA ARRAY,PERIODS+1)) / PERIODS) * 100;
{end}
The function AroonUp(High,14) calculates the Aroon Up component of the Aroon Indicator over 14
periods.
5.6.6
Average True Range
Average True Range
atr (PERIODS)
This function calculates the predefined Average True Range (ATR) indicator.
The function ATR(PERIODS) calculates the Average True Range (ATR) indicator by formula:
{Average True Range (ATR)}
TH:= If(Ref(Close,-1) > High, Ref(Close,-1), High);
TL:= If(Ref(Close,-1) < Low, Ref(Close,-1), Low);
TR:= TH-TL;
_ATR:= mov(TR, PERIODS, S);
{end}
© 2011 Visual Trading Systems, LLC
VT Trader Scripting Language
341
The formula atr(20) calculates the Average True Range (ATR) indicator over 20 periods.
5.6.7
Bar Count
Bar Count
BarCount ()
This function returns the total number of bars loaded in the chart previous to (and including) any given
bar. Stated more simply, this function assigns a numerical value to each bar in the chart starting with
the first (left most) bar and assigning it the number 1 and then incrementing the count by +1 for each
additional bar loaded in the chart.
By example, the formula:
Out:= BarCount();
can also be written as...
Out:= cum(1);
However, the BarCount() function processes much faster than cum(1) when included in an indicator
or trading sytem since it is an internal function.
5.6.8
Bar Index
Bar Index
BarIndex ()
BarIndex() returns zero-based bar numbers. This function returns the total number of bars loaded in
the chart previous to (and including) any given bar. Stated more simply, this function assigns a
numerical value to each bar in the chart starting with the first (left most) bar and assigning it the number
0 and then incrementing the count by +1 for each additional bar loaded in the chart.
By example, the formula:
Out:= BarIndex();
can also be written as...
Out:= cum(1) - 1;
or...
© 2011 Visual Trading Systems, LLC
342
VT Trader 2.0 Help Manual
Out:= if(prev(null)=null,0,ref(BarCount(),-1));
However, the BarIndex() function processes much faster than cum(1)-1 when included in an
indicator or trading sytem since it is an internal function.
5.6.9
Bars Since
Bars Since
BarsSince (DATA ARRAY)
This function calculates the number of bars (time periods) that have passed since DATA ARRAY was
true.
The formula BarsSince(RSI(14)>50) will return the value equal to the number of periods (bars) that
have passed since the 14-period RSI was greater than 50. The value is calculated using all data loaded
in the chart.
5.6.10 Bollinger Bands (Bottom Band)
Bollinger Bands (Bottom Band)
BBandBot (DATA ARRAY, PERIODS, METHOD, DEVIATIONS)
This function calculates the Bottom Bollinger Band component of the Bollinger Bands indicator of DATA
ARRAY using METHOD calculation method and shifted downwards DEVIATIONS standard deviations.
Valid methods are SIMPLE, WEIGHTED, EXPONENTIAL, SINE WEIGHTED, TRIANGLE, END POINT
, and VOLUME-ADJUSTED (Abbreviated respectively as S, W, E, SW, TRI, EP, and VOL).
The formula BBandBot(close, 20, S, 2) calculates the Bottom Bollinger Band of Close prices
over 20 PERIODS using the SIMPLE method and shifted 2 DEVIATIONS downwards.
5.6.11 Bollinger Bands (Top Band)
Bollinger Bands (Top Band)
BBandTop (DATA ARRAY, PERIODS, METHOD, DEVIATIONS)
This function calculates the Top Bollinger Band component of the Bollinger Bands indicator of DATA
ARRAY using METHOD calculation method and shifted upwards DEVIATIONS standard deviations.
© 2011 Visual Trading Systems, LLC
VT Trader Scripting Language
343
Valid methods are SIMPLE, WEIGHTED, EXPONENTIAL, SINE WEIGHTED, TRIANGLE, END POINT
, and VOLUME-ADJUSTED (Abbreviated respectively as S, W, E, SW, TRI, EP, and VOL).
The formula BBandTop(close, 20, S, 2) calculates the Top Bollinger Band of Close prices over
20 PERIODS using the SIMPLE method and shifted 2 DEVIATIONS upwards.
5.6.12 Bollinger Bands
Bollinger Bands
BBands (DATA_ARRAY, PERIODS, METHOD, DEVIATIONS, SWITCH)
This function calculates the Bottom Bollinger Band 342 and Top Bollinger Band 342 components of the
Bollinger Bands indicator of DATA ARRAY using METHOD calculation method and shifted upwards or
downwards DEVIATIONS standard deviations based on SWITCH.
Valid METHODs are SIMPLE, WEIGHTED, EXPONENTIAL, SINE WEIGHTED, TRIANGLE, END
POINT, and VOLUME-ADJUSTED (Abbreviated respectively as S, W, E, SW, TRI, EP, and VOL).
SWITCH=0 calculates the Top Bollinger Band. SWITCH=1 calculates the Bottom Bollinger Band.
The function BBands(DATA_ARRAY, PERIODS, METHOD, DEVIATIONS, 0) calculates the Top
Bollinger Band 342 component of the Bollinger Bands indicator.
TopBollingerBand:= BBands(DATA_ARRAY, PERIODS, METHOD, DEVIATIONS, 0);
--The function BBands(DATA_ARRAY, PERIODS, METHOD, DEVIATIONS, 1) calculates the
Bottom Bollinger Band 342 component of the Bollinger Bands indicator.
BottomBollingerBand:= BBands(DATA_ARRAY, PERIODS, METHOD, DEVIATIONS, 1);
The formula BBands(Close, 20, S, 2, 0) calculates a the Top Bollinger Band 342 of the Close
prices over 20 periods using the Simple method shifted 2 deviations upwards.
--The formula BBands(Close, 20, S, 2, 1) calculates a the Bottom Bollinger Band 342 of the Close
prices over 20 periods using the Simple method shifted 2 deviations downwards.
© 2011 Visual Trading Systems, LLC
344
VT Trader 2.0 Help Manual
The top and bottom Bollinger Bands can be calculated using the BBands() function as such:
{Bollinger Bands}
{The middle band is a n-period simple moving average}
MiddleBollingerBand:= mov(Close, PERIODS, S);
{Calculates the Bottom Bollinger Band and Top Bollinger Band components}
TopBollingerBand:= BBands(Close, 20, S, 2, 0);
BottomBollingerBand:= BBands(Close, 20, S, 2, 1);
{end}
--It is also acceptable to use the stdev() function to calculate the top and bottom Bollinger Bands as
such:
{Bollinger Bands}
{The middle band is a n-period simple moving average}
MiddleBollingerBand:= mov(Close, PERIODS, S);
{Calculates the Bottom Bollinger Band and Top Bollinger Band components}
TopBollingerBand:= MiddleBollingerBand + ( 2 * stdev(Close,PERIODS));
BottomBollingerBand:= MiddleBollingerBand - ( 2 * stdev(Close,PERIODS));
{end}
5.6.13 Buy Position Count
Buy Position Count
BuyPositionCount ()
This function returns the number of open buy positions in the instrument that the trading system is
attached to based on the trading system's assigned account. This function's output is updated one time
per incoming price tick.
5.6.14 Ceiling
Ceiling
ceiling (DATA ARRAY)
Calculates the lowest integer that is greater than DATA ARRAY.
© 2011 Visual Trading Systems, LLC
VT Trader Scripting Language
345
The formula ceiling(9.2) returns 10.
The formula ceiling(-9.2) returns -9.
5.6.15 Commodity Channel Index
Commodity Channel Index (CCI)
cci (DATA ARRAY, PERIODS)
Calculates the PERIODS Commodity Channel Index (CCI) of DATA ARRAY. This function calculates
the predefined CCI indicator according to Donald Lambert's original formula logic. Use of the DATA
ARRAY parameter is only necessary if the user wishes to substitute a DATA ARRAY other than Typical
Price ( TP() ) for the calculations. Otherwise, it is acceptable to use the cci() function without including it
such as:
cci (PERIODS)
The function CCI(DATA ARRAY, PERIODS) calculates a 20-Periods CCI Indicator by formula:
{ Typical Price }
vTp := (H + L + C) / 3;
{ Simple Moving Average of the Typical Price
vTpma := Mov(vTP, 20, S);
}
{Due to VTrader's lack of loop structures in its
programming language, the loop statement to find
Mean Deviation must be written out explicitly}
{ Mean Deviation }
vMd20 := (Abs(vTpma - vTp)
+ Abs(vTpma - Ref(vTp, -1))
+ Abs(vTpma - Ref(vTp, -2))
+ Abs(vTpma - Ref(vTp, -3))
+ Abs(vTpma - Ref(vTp, -4))
+ Abs(vTpma - Ref(vTp, -5))
+ Abs(vTpma - Ref(vTp, -6))
+ Abs(vTpma - Ref(vTp, -7))
+ Abs(vTpma - Ref(vTp, -8))
+ Abs(vTpma - Ref(vTp, -9))
+ Abs(vTpma - Ref(vTp, -10))
+ Abs(vTpma - Ref(vTp, -11))
+ Abs(vTpma - Ref(vTp, -12))
+ Abs(vTpma - Ref(vTp, -13))
+ Abs(vTpma - Ref(vTp, -14))
+ Abs(vTpma - Ref(vTp, -15))
© 2011 Visual Trading Systems, LLC
346
VT Trader 2.0 Help Manual
+
+
+
+
Abs(vTpma
Abs(vTpma
Abs(vTpma
Abs(vTpma
-
Ref(vTp,
Ref(vTp,
Ref(vTp,
Ref(vTp,
-16))
-17))
-18))
-19))) / 20;
{ CCI value and output CCI on chart }
vCCI := (vTp - vTpma) / (0.015 * vMd20);
5.6.16 Cosine
Cosine
cos (DATA ARRAY)
This function calculates the Cosine of DATA ARRAY.
It assumes the DATA ARRAY value is given in degrees.
The formula cos(0) returns 1.
The formula cos(Close) returns the Cosine of the Close price in degrees.
5.6.17 Cross
Cross
cross (DATA_ARRAY_1, DATA_ARRAY_2)
Returns +1 when DATA_ARRAY_1 crosses above DATA_ARRAY_2. Otherwise, 0 is returned. If it is
required to know when DATA_ARRAY_1 crosses below DATA_ARRAY_2, use the formula:
cross (DATA_ARRAY_2, DATA_ARRAY_1)
The formula cross(Close,mov(Close,9,S) returns +1 only for the specific bar interval when the
Close price crosses above the Moving Average. For all other bars – if and until the next crossover in this
direction (above) the formula cross(Close,mov(Close,9,S) returns 0.
© 2011 Visual Trading Systems, LLC
VT Trader Scripting Language
347
To monitor when the Close price crosses below the Moving Average, the formula cross(mov(Close,9
,S),Close) should be used. It returns +1 only for the specific bar interval when the Close price
crosses below the Moving Average. For all other bars – if and until the next crossover in this direction
(below) the formula cross(mov(Close,9,S),Close)returns 0.
The main difference in using the Cross() function versus making comparisons using Relational
Operators 332 (such as > or <, etc.) is that the condition being evaluated using Relational Operators 332
returns +1 as long as the condition remains true.
For example, the formula Close > mov(Close,9,S) is true (shown as the thick blue line in the
screenshot below) and returns +1 for every bar that the condition remains true. For all other bars when
the formula Close > mov(Close,9,S) condition is false, 0 is returned.
© 2011 Visual Trading Systems, LLC
348
VT Trader 2.0 Help Manual
5.6.18 Cumulate
Cumulate
cum (DATA ARRAY)
Calculates a Cumulative Sum of DATA ARRAY beginning from the first period in the chart.
The formula cum(1) calculates an indicator that rises one point for each bar since the beginning of the
chart.
The formula cum(Close) calculates the cumulative total of all closing prices from the beginning of the
chart.
5.6.19 Day Of Month
Day Of Month
DayOfMonth ()
© 2011 Visual Trading Systems, LLC
VT Trader Scripting Language
349
Plots the numerical day of the month.
If today was July 15th, 15 would be plotted.
5.6.20 Day Of Week
Day Of Week
DayOfWeek ()
Plots a numerical value corresonding to each day of the week.
1=
2=
3=
4=
5=
6=
7=
Monday
Tuesday
Wednesday
Thursday
Friday
Saturday
Sunday
Each new days begins at 00:00 Eastern Standard Time (12:00 A.M. Midnight).
For example, to create a simple indicator that will plot +1 for each price bar shown during Monday use
the formula:
TodayIsMonday:= DayOfWeek()=1;
Also acceptable is:
TodayIsMonday:= if(DayOfWeek()=1,1,0);
{Note: if a condition will always evaulate to true (1) or false (0)
it is not necessary to use the If() function - it is assumed.}
5.6.21 Detrended Price Oscillator
Detrended Price Oscillator
dpo (PERIODS)
This function calculates the predefined Detrended Price Oscillator.
The function dpo(PERIODS) calculates the Detrended Price Oscillator by formula:
© 2011 Visual Trading Systems, LLC
350
VT Trader 2.0 Help Manual
{Detrended Price Oscillator}
_DPO:= Close - ref(mov(Close,PERIODS,S),-(PERIODS/2+1));
{end}
5.6.22 Error
Error
error ( CONDITION, ' MESSAGE ' )
This function executes an immediate program stop. VT Trader shows a popup window containing the
MESSAGE (in signal quote mark s) if CONDITION is true. The Indicator Label also shows a "red circled,
exclamation point" icon (see screenshot below) next to it until the condition creating the Error has been
resolved.
As an example, create a simple indicator with the following formula:
_Error:= error(1<3,'1 is less than 3');
The result of attempting to add this indicator to a chart can be seen in the screenshots below...
© 2011 Visual Trading Systems, LLC
VT Trader Scripting Language
351
5.6.23 Event Count
Event Count
EventCount ('Logical Variable')
This function calculates the number of true states of the Logical Variable only from the moment the
trading system is started in Auto-Trade Mode until such time as it is stopped. The main purpose of
the EventCount() function is to allow the user to better manage the number of automated trading
actions taken by the trading system with respect to each of its Logical Variables in use.
A Logical Variable is defined as any output variable 221 within a trading system that has a checkmark
next to the Trading enabled 223 option in its respective Name tab 223 . A Logical Variable can exist only
in two states - true (1) or false (0). For example, if a certain condition determines the Logical Variable
'A' such as:
A:= cross(Close,mov(Close,13,S);
Then EventCount('A') will calculate the number of times the Close price crosses above the Moving
Average starting from the point in time when the trading system was started in Auto-Trade Mode.
Please note the following:
1)
After the trading system's Auto-Trade Mode has been stopped the value of EventCount
© 2011 Visual Trading Systems, LLC
352
VT Trader 2.0 Help Manual
('Logical Variable') resets to 0.
2)
If VT Trader experiences a temporary disconnection and then reconnects, the value of
EventCount ('Logical Variable') is saved and restored to its previous value before the
disconnection happened.
3)
If VT Trader experiences an abrupt exit or shutdown (such as a loss a loss of power, PC
crash, PC reboot, etc.) and VT Trader was not properly shutdown, the value of EventCount
('Logical Variable') will be reset to 0 after VT Trader is restarted, the trading system reattached to the chart, and then restarted in Auto-Trade Mode.
It's easiest to understand how EventCount() functions by working step-by-step through a pratical
implementation of its functionality.
In the screenshot below two conditions have been specified...
Long:= cross(Close,mov(Close,13,S); {Shown as Blue Arrow graphic}
Short:= cross(mov(Close,13,S),Close); {Shown as Red Arrow graphic}
* (please refer to the cross() 346 function if you require clarification on how it works)
Next, define the Logical Variables responsible for opening and closing market order BUY trades...
* Refer to the Trading tab 232 for each respective Logical Variable to ensure proper setup for requesting
the correct automated trading market order type (BUY or SELL).
OpenBuy:= Long and (EventCount('OpenBuy') = EventCount('CloseBuy'));
© 2011 Visual Trading Systems, LLC
VT Trader Scripting Language
353
CloseBuy:= Short and (EventCount('OpenBuy') > EventCount('CloseBuy'));
Let's assume OpenBuy will be used to request a BUY market order to initiate a long position in the
market, while CloseBuy will be used to request a SELL market order to close the existing long position
originally initiated by OpenBuy. When the trading system is started in Auto-Trade Mode EventCount
('OpenBuy') and EventCount('CloseBuy') are equal to 0.
The value of Logical Variable 'OpenBuy' will become equal to +1 if the condition defined for the Long
variable is true and the number of actions for EventCount('OpenBuy') in the OpenBuy condition is
equal to the number of actions for EventCount('CloseBuy') in the CloseBuy condition.
The value of Logical Variable 'CloseBuy' will become equal to +1 if the condition defined for the Short
variable is true and the number of actions for EventCount('OpenBuy') in the OpenBuy condition is
greater than the number of actions for EventCount('CloseBuy') in the CloseBuy condition. If the
EventCount('OpenBuy') value is greater than the EventCount('CloseBuy') value it is
assumed that a long trade was initiated previously by OpenBuy and it is necessary to initiate a SELL
market order to close the existing long trade.
Lastly, define the Logical Variables responsible for opening and closing market order SELL trades...
* Refer to the Trading tab 232 for each respective Logical Variable to ensure it's setup to properly
request the correct automated trading order type.
OpenSell:= Short and (EventCount('OpenSell') = EventCount('CloseSell'));
CloseSell:= Long and (EventCount('OpenSell') > EventCount('CloseSell'));
Let's assume OpenSell will be used to request a SELL market order to initiate a short position in the
market, while CloseSell will be used to request a BUY market order to close the existing short
position originally initiated by OpenSell. When the trading system is started in Auto-Trade Mode
EventCount('OpenSell') and EventCount('CloseSell') are equal to 0.
The value of Logical Variable 'OpenSell' will become equal to +1 if the condition defined for the Short
variable is true and the number of actions for EventCount('OpenSell') in the OpenSell condition
is equal to the number of actions for EventCount('CloseSell') in the CloseSell condition.
The value of Logical Variable 'CloseSell' will become equal to +1 if the condition defined for the Long
variable is true and the number of actions for EventCount('OpenSell') in the OpenSell condition
is greater than the number of actions for EventCount('CloseSell') in the CloseSell condition.
If the EventCount('OpenSell') value is greater than the EventCount('CloseSell') value it is
assumed that a short trade was initiated previously by OpenSell and it is necessary to initiate a BUY
market order to close the existing short trade.
It's recommended that when constructing a trading system using Logical Variables for auto-trading
functionality to follow a simple trading system template:
{START SAMPLE TRADING SYSTEM TEMPLATE}
{Preliminary calculations for the trading system...
this would include indicators that will be used, etc.}
© 2011 Visual Trading Systems, LLC
354
VT Trader 2.0 Help Manual
{We'll create 2 moving averages for this sample trading system}
Output1:= close;
Output2:= mov(close,13,S);
{Define the conditions for Long and Short trading signals}
{Again, we'll build from our sample output variables
to create a simple price & moving average crossover system}
Long:= Cross(Output1,Output2);
Short:= Cross(Output2,Output1);
{Define Logical Output Variables for Auto-Trading functionality}
{OpenBuy and CloseBuy control opening and closing BUY trades}
OpenBuy:= Long and (EventCount('OpenBuy') = EventCount('CloseBuy'));
CloseBuy:= Short and (EventCount('OpenBuy') > EventCount('CloseBuy'));
{OpenSell and CloseSell control opening and closing SELL trades}
OpenSell:= Short and (EventCount('OpenSell') = EventCount('CloseSell'));
CloseSell:= Long and (EventCount('OpenSell') > EventCount('CloseSell'));
{END SAMPLE TRADING SYSTEM TEMPLATE}
5.6.24 Exponent
Exponent
exp (DATA ARRAY)
This function calculates e raised to the DATA ARRAY power.
Exponent is the same as the Exponential Function o = e x .
The constand e is the base of the natural logarithm 364 . With the possible exception of Pi 333 , e is the
most important constant in mathematics.
e = 2.7183 in VT Trader; however, e's actual value =
2.718281828459045235360287471352662497757 ...
The formula exp(1) returns 2.7183.
This formula exp(5) returns 148.4132.
5.6.25 FAMA
FAMA
© 2011 Visual Trading Systems, LLC
VT Trader Scripting Language
355
Fama (DATA ARRAY, ALPHA MAXIMUM LIMIT, ALPHA MINIMUM LIMIT)
This function calculates the predefined Following Adaptive Moving Average (developed by John Ehlers) of
DATA ARRAY. According to John Ehler's literature, the alpha value in FAMA is allowed to range
between a maximum and a minimum value. The suggested ALPHA MAXIMUM LIMIT = 0.5 and the
suggested ALPHA MINIMUM LIMIT = 0.05.
The Following Adaptive Moving Average is actually a MESA Adaptive Moving Average calculated using
one-half the alpha value of MAMA 367 . This allows the Following Adaptive Moving Average to have steps
in time synchronization with the MESA Adaptive Moving Average (MAMA), but with less vertical
movement.
The formula fama(Close,0.5,0.05) calulates the Following Adaptive Moving Average applied to
Close prices using the suggested default values.
5.6.26 Floor
Floor
floor (DATA ARRAY)
This function calculates the highest integer that is less than DATA ARRAY.
The formula floor(17.8) returns 17.
The formula floor(-17.8) returns -18.
5.6.27 Fraction
Fraction
frac (DATA ARRAY)
Eliminates the integer portion of DATA ARRAY and returns the fractional part.
The formula frac(12.7) returns 0.7.
The formula frac(-12.7) returns -0.7.
© 2011 Visual Trading Systems, LLC
356
VT Trader 2.0 Help Manual
5.6.28 Gap Down
Gap Down
GapDown ()
Returns a +1 value on the current bar of the instrument when its price Gaps Down. Otherwise, 0 is
returned.
A Gap Down occurs if previous Low value is greater than the current High value.
5.6.29 Gap Up
Gap Up
GapUp ()
Returns a +1 value on the current bar of the instrument when its price Gaps Up. Otherwise, 0 is
returned.
© 2011 Visual Trading Systems, LLC
VT Trader Scripting Language
357
A Gap Up occurs if previous High value is less than the current Low value.
5.6.30 Highest
Highest
highest (DATA ARRAY)
This function calculates the highest value in the DATA ARRAY since the first value loaded in the chart.
The formula highest(Close) returns the highest Close price since the first value loaded in the chart.
5.6.31 Highest Bars Ago
Highest Bars Ago
HighestBars (DATA ARRAY)
© 2011 Visual Trading Systems, LLC
358
VT Trader 2.0 Help Manual
This function calculates the number of periods that have passed since the DATA ARRAY's highest
value. This includes all data loaded in the chart.
The formula HighestBars(Close) returns the number of periods that have passed since the Close
price reached its highest value.
5.6.32 Highest High Value
Highest High Value
hhv (DATA ARRAY, PERIODS)
This function calculates the highest value in the DATA ARRAY over the preceding PERIODS. It's
important to note that PERIODS includes the current period.
The formula hhv(Close,5) returns the highest Close price over the preceding five periods.
A common request for using this function is determining a price channel breakout. Because hhv()
includes the current period's value in its calculations, in order to create a condition to determine a
channel breakout using the previous n-PERIODS to create the channel the ref() function must be
used. The ref() function allows the comparison of the current period's DATA ARRAY value to its value
n-PERIODS ago. In this case, we need to reference 1 bar ago.
For example: Let's create a 10-periods High price channel and a simple indicator that will plot +1 when
the current Close price crosses above the price channel and plot 0 at any other time.
{Create a price channel using the previous 10 bars,
not including the current bar}
HighPriceChannelLevel:= ref(hhv(High,10),-1);
{Create the condition to determine when the current
bar's Close price crosses above the HighPriceChannelLevel}
ChannelBreakOutUp:= Cross(Close,HighPriceChannelLevel);
The results of the formula code above can be seen in the screenshot below. The 10-periods High price
channel is the thick blue line in the price frame and the result of the condition in the
ChannelBreakOutUp variable can be viewed in the additional frame below price frame. A blue arrow
graphic has been shown under the price bar when the breakout occurred.
© 2011 Visual Trading Systems, LLC
VT Trader Scripting Language
359
5.6.33 Highest High Value Bars Ago
Highest High Value Bars Ago
hhvbars (DATA ARRAY, PERIODS)
This function calculates the number of periods (bars) that have passed since DATA ARRAY reached its
PERIODS period peak.
The formula hhvbars(Close,55) returns the number of periods (bars) that have passed since the
Close price reached its 55-period peak.
5.6.34 Highest Since
Highest Since
HighestSince (Nth, EXPRESSION, DATA ARRAY)
© 2011 Visual Trading Systems, LLC
360
VT Trader 2.0 Help Manual
This function returns the highest value of DATA ARRAY since the Nth most recent occurrence of
EXPRESSION being true.
This includes all data loaded in the chart.
The formula HighestSince(2, Cross(Close,mov(Close,13,S)), Close) returns highest
value of the Close price since the second most recent occurrence of the Close price crossing above the
13-periods simple moving average.
5.6.35 Highest Since Bars Ago
Highest Since Bars Ago
HighestSinceBars (Nth, EXPRESSION, DATA ARRAY)
This function returns the number of periods that have passed from the highest value of DATA ARRAY
since the Nth most recent occurrence of EXPRESSION being true.
This includes all data loaded in the chart.
The formula HighestSinceBars(2, Cross(Close,mov(Close,13,S)), Close) returns the
number of periods that have passed since the highest value of the Close price since the second most
recent occurrence of the Close price crossing above the 13-periods simple moving average.
5.6.36 Hour
Hour
hour ()
This function returns to the number of hours that have passed during the day using a 24-hour clock that
starts each day at 00:00 (12:00 A.M. Midnight Eastern Standard Time).
If the current time is recorded as 10:17:27, the hour() function will return 10.
5.6.37 IF()
If
if (DATA ARRAY > >= < <= <> = DATA ARRAY, THEN DATA ARRAY, ELSE DATA ARRAY)
If() is a conditional function that returns the second parameter (THEN) if the conditional expression
© 2011 Visual Trading Systems, LLC
VT Trader Scripting Language
361
defined by the first parameter is true. Otherwise, the third parameter is returned (ELSE).
The formula if(1 < 2, 3, 5) will always return the value 3.
For example, the formula if(Close > mov(Close,9,S), 1, 0) is true (shown as the thick blue
line in the screenshot below) and returns +1 for every bar that the condition remains true. For all other
bars when the formula Close > mov(Close,9,S) condition is false, 0 is returned.
If it is implied that the resulting variable can only assume the value of true (1) or false (0), then the
formula:
Variable:= if(Close > mov(Close,9,S), 1, 0);
... may be written as ...
Variable:= Close > mov(Close,9,S);
... where Variable may be equal only to 0 or 1.
© 2011 Visual Trading Systems, LLC
362
VT Trader 2.0 Help Manual
5.6.38 Inside
Inside
inside ()
This function returns a +1 value whenever an Inside period occurs. It will continue to return this same +1
value until a Rally 376 , Reaction 377 , or Outside 371 period occurs. For any period when Inside() is not
equal to +1 it returns 0.
An Inside period occurs when the current High value is less than or equal to the previous Rally 376 or
Reaction 377 value's High and the current Low is greater than or equal to the previous Rally 376 or
Reaction 377 value's Low. A range is determined by the first Inside value and is only broken by a Rally 376
, Reaction 377 , or Outside 371 value.
5.6.39 Integer
Integer
int (DATA ARRAY)
This function removes the fractional portion of DATA ARRAY and returns the integer part.
The formula int(12.7) returns 12.
The formula int(-17.8) returns -17.
5.6.40 IsDefined
IsDefined
IsDefined (DATA ARRAY)
This function returns 1 if all data necessary to calculate DATA ARRAY is available, otherwise it returns
0.
The formula IsDefined(MA) defined in the Out variable shown below:
MA:= mov(C,20,S);
Out:= IsDefined(MA);
Returns 0 for the first 19 bars loading into the chart and then returns 1 beginning with the 20th bar and
© 2011 Visual Trading Systems, LLC
VT Trader Scripting Language
363
for all future bars.
5.6.41 IsUndefined
IsUndefined
IsUndefined (DATA ARRAY)
This function returns 0 if all data necessary to calculate DATA ARRAY is available, otherwise it returns
1.
The formula IsUndefined(MA) defined in the Out variable shown below:
MA:= mov(C,20,S);
Out:= IsUndefined(MA);
Returns 1 for the first 19 bars loading into the chart and then returns 0 beginning with the 20th bar and
for all future bars.
5.6.42 Linear Regression Indicator
Linear Regression Indicator
linreg (DATA ARRAY, PERIODS)
This function calculates the predefined Linear Regression Indicator.
The function LinReg(DATA ARRAY, PERIODS) calculates the Linear Regression Indicator by
formula:
{Linear Regression Indicator}
_LinReg:= (PERIODS * Sum(Cum(1)*DATA ARRAY,PERIODS) - Sum(Cum(1),PERIODS)
* Sum(DATA ARRAY,PERIODS)) /
(PERIODS * Sum(Power(Cum(1),2),PERIODS) - Power(Sum(Cum(1),
PERIODS),2)) * Cum(1) +
(Mov(DATA ARRAY,PERIODS,S) - Mov(Cum(1),PERIODS,S) * (PERIODS*Sum
(Cum(1)*DATA ARRAY,PERIODS) Sum(Cum(1),PERIODS) * Sum(DATA ARRAY,PERIODS)) / (PERIODS * Sum(
Power(Cum(1),2),PERIODS) Power(Sum(Cum(1),PERIODS),2)));
© 2011 Visual Trading Systems, LLC
364
VT Trader 2.0 Help Manual
{end}
The formula linreg(Close,50) calculates a 50-periods Linear Regression indicator of Close prices.
5.6.43 Linear Regression Slope
Linear Regression Slope
linregslope (DATA ARRAY, PERIODS)
This function calculates the predefined Linear Regression Slope indicator.
The formula LinRegSlope(Close,50) calculates a 50-periods Linear Regression Slope of Close
prices.
5.6.44 Logarithm
Logarithm (natural)
log (DATA ARRAY)
Calculates the natural logarithm of DATA ARRAY.
The formula log(1) will return 0.
The formula log(12) will return 2.4849.
5.6.45 Lowest
Lowest
lowest (DATA ARRAY)
This function calculates the lowest value in DATA ARRAY since the first value loaded in the chart.
The formula lowest(Close) returns the lowest Close price value since the first value loaded in the
chart.
5.6.46 Lowest Bars Ago
Lowest Bars Ago
© 2011 Visual Trading Systems, LLC
VT Trader Scripting Language
365
LowestBars (DATA ARRAY)
This function calculates the number of periods that have passed since the DATA ARRAY's lowest value.
This includes all data loaded in the chart.
The formula LowestBars(Close) returns the number of periods that have passed since the Close
price reached its lowest value.
5.6.47 Lowest Low Value
Lowest Low Value
llv (DATA ARRAY, PERIODS)
This function calculates the lowest value in the DATA ARRAY over the preceding PERIODS. It's
important to note that PERIODS includes the current period.
The formula llv(Close,5) returns the lowest Close price over the preceding five periods.
A common request for using this function is determining a price channel breakout. Because llv()
includes the current period's value in its calculations, in order to create a condition to determine a
channel breakout using the previous n-PERIODS to create the channel the ref() function must be
used. The ref() function allows the comparison of the current period's DATA ARRAY value to its value
n-PERIODS ago. In this case, we need to reference 1 bar ago.
For example: Let's create a 10-periods Low price channel and a simple indicator that will plot +1 when
the current Close price crosses below the price channel and plot 0 at any other time.
{Create a price channel using the previous 10 bars,
not including the current bar}
LowPriceChannelLevel:= ref(llv(Low,10),-1);
{Create the condition to determine when the current
bar's Close price crosses above the HighPriceChannelLevel}
ChannelBreakOutDown:= Cross(LowPriceChannelLevel,Close);
The results of the formula code above can be seen in the screenshot below. The 10-periods Low price
channel is the thick red line in the price frame and the result of the condition in the
ChannelBreakOutDown variable can be viewed in the additional frame below price frame. A red arrow
graphic has been shown above the price bar when the breakout occurred.
© 2011 Visual Trading Systems, LLC
366
VT Trader 2.0 Help Manual
5.6.48 Lowest Low Value Bars Ago
Lowest Low Value Bars Ago
llvbars (DATA ARRAY, PERIODS)
This function calculates the number of periods (bars) that have passed since DATA ARRAY reached its
PERIODS period trough.
The formula llvbars(Close,55) returns the number of periods (bars) that have passed since the
Close price reached its 55-period trough.
5.6.49 Lowest Since
Lowest Since
© 2011 Visual Trading Systems, LLC
VT Trader Scripting Language
367
LowestSince (Nth, EXPRESSION, DATA ARRAY)
This function returns the lowest value of DATA ARRAY since the Nth most recent occurrence of
EXPRESSION being true.
This includes all data loaded in the chart.
The formula LowestSince(2, Cross(Close,mov(Close,13,S)), Close) returns lowest value
of the Close price since the second most recent occurrence of the Close price crossing above the 13periods simple moving average.
5.6.50 Lowest Since Bars Ago
Lowest Since Bars Ago
LowestSinceBars (Nth, EXPRESSION, DATA ARRAY)
This function returns the number of periods that have passed from the lowest value of DATA ARRAY
since the Nth most recent occurrence of EXPRESSION being true.
This includes all data loaded in the chart.
The formula LowestSinceBars(2, Cross(Close,mov(Close,13,S)), Close) returns the
number of periods that have passed since the lowest value of the Close price since the second most
recent occurrence of the Close price crossing above the 13-periods simple moving average.
5.6.51 MACD
MACD
MACD (DATA_ARRAY, FAST_EMA_PERIODS, SLOW_EMA_PERIODS, SIGNAL_EMA_PERIODS)
This function returns the histogram portion of the Moving Average Convergence/Divergence (MACD)
indicator. All parameters are optional; if a particular parameter is not defined in the MACD() function its
default value will be applied.
The MACD() function's default parameter values are as follows:
DATA_ARRAY = Close
FAST_EMA_PERIODS = 12
SLOW_EMA_PERIODS = 26
SIGNAL_EMA_PERIODS = 9
5.6.52 MAMA
MAMA
© 2011 Visual Trading Systems, LLC
368
VT Trader 2.0 Help Manual
Mama (DATA ARRAY, ALPHA MAXIMUM LIMIT, ALPHA MINIMUM LIMIT)
This function calculates the predefined MESA Adaptive Moving Average (developed by John Ehlers) of
DATA ARRAY. According to John Ehler's literature, the alpha value in MAMA is allowed to range
between a maximum and a minimum value. The suggested ALPHA MAXIMUM LIMIT = 0.5 and the
suggested ALPHA MINIMUM LIMIT = 0.05.
The formula mama(Close,0.5,0.05) calulates the MESA Adaptive Moving Average applied to Close
prices using the suggested default values.
5.6.53 Maximum
Maximum
max (DATA_ARRAY_1, DATA_ARRAY_2)
This function returns the largest value of two parameters (DATA_ARRAY_1 and DATA_ARRAY_2).
The formula max(Close,mov(Close,13,E) returns the greater of the Close price or the 13-periods
exponential moving average.
The formula max(-17,13) always returns 13.
5.6.54 Median Price
Median Price
mp ()
This function calculates the predefined Median Price indicator.
The Median Price is calculated by adding the High price and the Low price together and then dividing by
two. The result is the average, or median, price.
The function mp() calculates the Median Price by formula:
{Median Price Indicator}
_MedianPrice:= (High + Low) / 2;
{end}
© 2011 Visual Trading Systems, LLC
VT Trader Scripting Language
369
5.6.55 Midpoint
Midpoint
mid (DATA ARRAY, PERIODS)
Returns the midpoint of the DATA ARRAY over the specified PERIODS. The midpoint is the value
halfway between the highest and lowest DATA ARRAY values during the specified PERIODS.
The function mid(DATA ARRAY, PERIODS) is calculated by formula:
{Midpoint}
_Midpoint:= llv(DATA ARRAY,PERIODS) + ((hhv(DATA ARRAY,PERIODS) - llv(DATA
ARRAY,PERIODS)) / 2);
{end}
The formula mid(Close,7) is equivalent to llv(Close,7) + ((hhv(Close,7) - llv(Close,
7)) / 2).
5.6.56 Minimum
Minimum
min (DATA_ARRAY_1, DATA_ARRAY_2)
This function returns the smallest value of two parameters (DATA_ARRAY_1 and DATA_ARRAY_2).
The formula min(Close,mov(Close,13,E) returns the smaller of the Close price or the 13-periods
exponential moving average.
The formula min(-17,13) always returns -17.
5.6.57 Minute
Minute
minute ()
This function returns the value of the minute in a two-digit format.
© 2011 Visual Trading Systems, LLC
370
VT Trader 2.0 Help Manual
If a bar had the date/time stamp of 02/17/2006, 13:44:00 (Feb. 17th, 2006, 1:44 P.M. EST), the minute
() function would return 44.
5.6.58 Modulus
Modulus
mod (DATA ARRAY_1, DATA ARRAY_2)
Calculates the remainder (i.e. the fractional portion) of DATA ARRAY_1 divided by DATA ARRAY_2.
A division by zero produces a NULL result.
The formula mod(10,3) returns 1.0.
The formula mod(-10.7,3) returns -1.7.
The same can be written as: -10.7 - (int(-10.7 / 3) * 3).
The function mod(DATA_ARRAY_1,DATA_ARRAY_2) calculates by formula:
{Modulus}
_mod :=
);
DATA_ARRAY_1
- (int(DATA_ARRAY_1 / DATA_ARRAY_2) *
DATA_ARRAY_2
{end}
5.6.59 Month
Month
month ()
This function returns the value of the month of the year.
If a bar had the date/time stamp of 02/17/2006, 13:44:00 (Feb. 17th, 2006, 1:44 P.M. EST), the month
() function would return 02.
© 2011 Visual Trading Systems, LLC
VT Trader Scripting Language
371
5.6.60 Moving Average
Moving Average
mov (DATA ARRAY, PERIODS, METHOD)
This function calculates a PERIODS moving average of DATA ARRAY using METHOD calculation
method.
Valid METHODS are:
S = Simple
W = Weighted
E = Exponential
SW = Sine Weighted
TRI = Triangular
EP = End Point
VOL = Volume-Adjusted
The formula mov(Close,25,E) returns the value of a 25-Period Exponential Moving Average of the
Close prices.
5.6.61 Negative
Negative
neg (DATA ARRAY)
This function calculates the negative value of DATA ARRAY.
The formula neg(10) returns -10.
The formula neg(-17) returns +17.
5.6.62 Outside
Outside
outside ()
This function returns a +1 value whenever an Outside period occurs. It will continue to return this
same +1 value until a Rally 376 , Reaction 377 , or Inside 362 period occurs. For any period when Outside
() is not equal to +1 it returns 0.
© 2011 Visual Trading Systems, LLC
372
VT Trader 2.0 Help Manual
An Outside period occurs when the current High value is greater than the previous Rally 376 or Reaction
377 value's High and the current Low is less than the previous Rally 376 or Reaction 377 value's Low. A
range is determined by the first Outside value and is only broken by a Rally 376 , Reaction 377 , or Inside
362 value.
5.6.63 Parabolic SAR
Parabolic SAR
sar (STEP, MAXIMUM)
This function calculates the predefined Parabolic SAR Indicator.
Optionally, the user may choose to define the DATA ARRAY's used to calculate the Parabolic SAR
indicator. This is useful, for example, when the user wishes to construct the Parabolic SAR using any
data series other than price. The extended function format is:
sar (DATA ARRAY, DATA ARRAY HIGH, DATA ARRAY LOW, STEP, MAXIMUM)
Please Note: When using the extended sar() function, the user must specify all 3 DATA ARRAY's or
none of the DATA ARRAY's.
STEP - As the price makes new Highs and Lows the Parabolic SAR rises and declines according to the
STEP size. For example: If the price makes new Highs for three consequetive bars, then the SAR Step
increases by 0.02 each bar (i.e.: 0.02 to 0.04 to 0.06, etc.). The SAR Step size of 0.02 is recommended
in most cases.
MAXIMUM - The Maximum value is the largest value the SAR Step can achieve. The SAR Maximum of
0.20 is recommended in most cases.
The formula SAR(0.02,0.20) calculates the Parabolic SAR Indicator with STEP=0.02 and
MAXIMUM=0.20.
The formula SAR(0.02,0.20) is equivalent to SAR(Close, High, Low, 0.02,0.20).
5.6.64 Peak Bars
Peak Bars
PeakBars (Nth, DATA ARRAY, % MINIMUM CHANGE)
© 2011 Visual Trading Systems, LLC
VT Trader Scripting Language
373
Plots the number of bars that have passed from the Nth peak . N=1 would return the number of bars that
have passed since the most recent peak . N=2 would return the number of bars that have passed since
the 2nd most recent peak . Etc.
5.6.65 Peak Value
Peak Value
peak (Nth, DATA ARRAY, % MINIMUM CHANGE)
This function returns the value of DATA ARRAY Nth peak(s) ago. N=1 would return the value of the most
recent peak . N=2 would return the value of the 2nd most recent peak , etc. The % MINIMUM CHANGE
parameter determines how much greater the new peak() value must be in comparison to the previous
peak() value before a new peak value is returned.
The formula Peak(1, Rsi(14), 10) returns the most recent peak() value of Rsi(14) if there has
been at least a 10% change from the previous peak value.
5.6.66 Position Count
Position Count
PositionCount ()
This function returns the total cumulative number of open buy and sell positions in the instrument that
the trading system is attached to based on the trading system's assigned account. This function's
output is updated one time per incoming price tick. For this reason, it is strongly advised that
PositionCount() not be used in trading systems that operate on the premise of "always in the market" (i.
e. when one position gets closed another position gets immediately opened in the opposing direction,
etc.).
5.6.67 Power
Power
power (DATA ARRAY, POWER)
This function calculates DATA ARRAY raised to the POWER power.
© 2011 Visual Trading Systems, LLC
374
VT Trader 2.0 Help Manual
A negative DATA ARRAY value raised to a non-integer POWER returns a NULL value.
The formula power(10,3) returns 1000.
The formula power(-10,3) returns -1000.
The formula power(-10,3.5) returns NULL.
5.6.68 Precision
Precision
prec (DATA ARRAY, PRECISION)
This function truncates DATA ARRAY to PRECISION decimal places.
The formula prec(10.56789, 2) returns 10.560.
The formula prec(10.56789, 3) returns 10.5670.
The formula prec(10.56789, 4) returns 10.56780.
Small binary rounding errors may cause some minor distortion in the decimal portion of any number
stored in a computer.
5.6.69 Prev
Previous
Prev
Prev()
prev (DATA ARRAY)
Prev makes it possible to refer from the formula to its own prior calculations on a previous bar. Prev
can be used as Prev and Prev() constants and as function Prev(DATA ARRAY). It is essential to
understand the peculiarities of PREV, PREV(0), and PREV(DATA ARRAY) and use them correctly
when necessary.
Prev and Prev()return into the current calculations of the variable its calculations on a previous bar or
NULL if the previous data is not defined or is missing. The output from these functions is synonymous
with ref(DATA ARRAY,-1).
Prev(DATA ARRAY) returns into the current calculations of the variable its calculations on the previous
bar or the value of DATA ARRAY if the previous data is not defined or missing.
© 2011 Visual Trading Systems, LLC
VT Trader Scripting Language
375
IMPORTANT NOTE: The use of Prev, Prev(), or Prev(DATA ARRAY) in fairly complex calculations
may significantly delay the calculation of an indicator. Their use should be avoided whenever possible!
Examples for use of the PREV function:
The calculation of the On Balance Volume indicator demonstrates the use of the PREV constant:
{On Balance Volume}
_OBV:= (If(C>Ref(C,-1), 1, If(C<Ref(C,-1), -1, 0)) * VOLUME) + PREV;
The On Balance Volume indicator may also be calculated without the use of the PREV constant by using
the cum(DATA ARRAY) function instead:
{On Balance Volume}
FactorOBV:= If(C>Ref(C,-1), 1, If(C<Ref(C,-1), -1, 0)) * VOLUME;
_OBV:= cum(FactorOBV);
This simple formula divides (High + Low + Close) by 3 and then adds this value to the previous
value of ((High + Low + Close) / 3) calculated on the previous bar of the price chart.
OUT:= ((High + Low + Close) / 3) + PREV(0);
The next example shows the Prev, Prev() and their Prev(NULL) analogy. However, this example
deals more with the characteristics of NULL. In the absence of the previous data Prev and Prev()
both return NULL (nothing, not even zero) so any further operations with NULL logically make no sense.
Whatever mathematical operations with the NULL take place: multiplication, addition, etc. - the result
will always be the same - NULL.
Using the following code(s) to illustrate:
OUT:= ((High + Low + Close) / 3) + PREV;
OUT:= ((High + Low + Close) / 3) + PREV();
These formulas on the first bar can be interpreted as:
OUT {on the first bar of loaded data}:= ((High + Low + Close) / 3) + NULL
{=NULL};
... and on the next bar...
© 2011 Visual Trading Systems, LLC
376
VT Trader 2.0 Help Manual
OUT:= NULL + NULL {=NULL};
... The indicator exists, but all of its values are equal to NULL. Therefore, the values will not be shown on
the chart.
5.6.70 Rally
Rally
rally ()
This function returns a +1 value whenever a Rally period occurs. It will continue to return this same +1
value until a Reaction 377 , Inside 362 , or Outside 371 period occurs. For any period when Rally() is not
equal to +1 it returns 0.
A Rally period occurs when the current High is greater than the previous Rally or Reaction 377 value's
High and the current Low is greater than or equal to the previous Rally or Reaction 377 value's Low.
5.6.71 Random
Random
random (DATA ARRAY)
This function returns a random value within the range of X >= 0 and X < 1.
5.6.72 Rate of Change
Rate of Change
roc (DATA ARRAY, PERIODS, DIFF_METHOD)
Calculates the PERIODS Rate of Change (ROC) of DATA ARRAY expressed as DIFF_METHOD.
Valid DIFF_METHOD's are PERCENT and POINTS.
The formula roc(Close, 12, PERCENT)returns the 12-period Percent Rate of Change of the Close
© 2011 Visual Trading Systems, LLC
VT Trader Scripting Language
377
prices.
The function roc(DATA ARRAY, PERIODS, PERCENT) calculates the Rate of Change (ROC)
Indicator by formula:
{Rate-Of-Change -> roc(DATA ARRAY, PERIODS, PERCENT)}
_ROC:= ((DATA ARRAY - ref(DATA ARRAY, - PERIODS)) / ref(DATA ARRAY, PERIODS)) * 100;
{end}
The function roc(DATA ARRAY, PERIODS, POINTS) calculates the Rate of Change (ROC) Indicator
by formula:
{Rate-Of-Change -> roc(DATA ARRAY, PERIODS, POINTS)}
_ROC:= DATA ARRAY - ref(DATA ARRAY, - PERIODS);
{end}
5.6.73 Reaction
Reaction
reaction ()
This function returns a +1 value whenever a Reaction period occurs. It will continue to return this
same +1 value until a Rally 376 , Inside 362 , or Outside 371 period occurs. For any period when Reaction
() is not equal to +1 it returns 0.
A Reaction period occurs when the current High is less than or equal to the previous Rally or Reaction
377 value's High and the current Low is less than the previous Rally 376 or Reaction value's Low.
5.6.74 Reference
Reference
ref (DATA ARRAY, -PERIODS, DEFAULT VALUE)
References a previous or subsequent element in a DATA ARRAY. Use of the DEFAULT VALUE
parameter is only necessary if the user wishes to substitute a value other than 0 for the beginning
calculation assigned to the left-most bar loaded in the chart window. Otherwise, it is acceptable to the
ref() function without including it such as:
ref (DATA ARRAY, -PERIODS)
© 2011 Visual Trading Systems, LLC
378
VT Trader 2.0 Help Manual
A negative PERIODS value references N periods ago. Therefore, the formula ref(Close, -12)
returns the Close price 12 periods ago. Thus, the 12-period price Rate-Of-Change 376 (expressed in
points) can be written as Close-ref(Close,-12). It is also allowable to use the ref() function to
reference previous value of a calculated DATA ARRAY such as the Relative Strength Index (RSI) 379
indicator. The resulting formula ref(RSI(14),-12) returns the 14-period RSI value 12 periods ago.
A positive PERIODS value references N periods ahead. Therefore, the formula ref(Close,+12)
returns the Close price 12 periods ahead (using the + sign is not necessary for positive integers). Using
the ref() function in the manner effectively shifts the resulting variable's data plot to the left N periods
ago in the chart window. It should also be noted that while it is allowable to use the ref() function to
reference N periods ahead values using a DATA ARRAY that does not need to be calculated (such as
raw price data: Close, Open, High, Low, haClose, haOpen, haHigh, and haLow), it is not allowable to use
with a DATA ARRAY that must be calculated (such as the Relative Strength Index (RSI) 379 indicator).
Therefore, the formula ref(RSI(14),+12) is not allowed and the result will always return NULL.
However, any resulting DATA ARRAY (such as the Relative Strength Index (RSI) 379 indicator) that uses
price to derive calculations can be recoded to effectively simulate the ref(RSI(14),+12) functionality
and resulting variable's data plot by first calculating the raw price data using the ref() function to
reference the element N periods ahead.
By example:
-------------------{Normal RSI Code}
rsi_r:= (Close - ref(Close,-1));
rsi_rs:= Wilders(if(rsi_r>0,rsi_r,0),tpr) / Wilders(if(rsi_r<0,Abs(rsi_r),0
),tpr);
RSIndex:= 100-(100/(1+rsi_rs));
-------------------{Restructured Code Allowing RSI to Shift
N Periods to the Left in the Chart Window}
prc:= ref(Close,+12);
rsi_r:= (prc - ref(prc,-1));
rsi_rs:= Wilders(if(rsi_r>0,rsi_r,0),tpr) / Wilders(if(rsi_r<0,Abs(rsi_r),0
),tpr);
RSIndex:= 100-(100/(1+rsi_rs));
-------------------The restuctured code is the equivalent to ref(RSIndex,+12) under the prior VT Trader programming
language structure (versions 1.7.5 and previous). The restructured code works equally well under the
previous and the new VT Trader programming language structure (VT Trader 1.7.6 and beyond).
© 2011 Visual Trading Systems, LLC
VT Trader Scripting Language
379
5.6.75 Relative Strength Index
Relative Strength Index (RSI)
rsi (DATA ARRAY, PERIODS)
Calculates the predefined Relative Strength Index (RSI) Indicator. The DATA ARRAY argument is
optional; rsi() will use the Close price as the default if it is not included. Please Note: The optional
DATA ARRAY parameter is currently not available for use.
The formula RSI(Close,14) calculates the RSI Indicator of the 14-periods Close prices.
The formula RSI(14) calculates the RSI Indicator of the 14-periods Close prices.
The formula RSI(Low,14) calculates the RSI Indicator of the14-periods Low prices.
The function RSI (DATA ARRAY, PERIODS) calculates the RSI Indicator by formula:
{Relative Strength Index -> RSI(DATA ARRAY, PERIODS)}
rsi_r:= (DATA ARRAY - ref(DATA ARRAY,-1));
rsi_rs:= Wilders(if(rsi_r>0,rsi_r,0),PERIODS) / Wilders(if(rsi_r<0,Abs
(rsi_r),0),PERIODS);
_RSI:= 100-(100/(1+rsi_rs));
{end}
5.6.76 Round
Round
round (DATA ARRAY)
This function rounds DATA ARRAY to the nearest integer.
The formula round(+12.5) returns +13.
The formula round(-12.5) returns -13.
The formula round(-12.4) returns -12.
5.6.77 Sell Position Count
Sell Position Count
SellPositionCount ()
© 2011 Visual Trading Systems, LLC
380
VT Trader 2.0 Help Manual
This function returns the number of open sell positions in the instrument that the trading system is
attached to based on the trading system's assigned account. This function's output is updated one time
per incoming price tick.
5.6.78 Signal Flag
Signal Flag
SignalFlag (DATA_ARRAY_1, DATA_ARRAY_2)
This function works as a flip/flop device; it returns 1 from the first occurrence of a "true" value in DATA
ARRAY 1 until the first occurrence of a "true" value in DATA ARRAY 2 which resets the state back to
zero until next first occurrence of a "true" value is detected in DATA ARRAY 1 ... etc.
The function SignalFlag(DATA_ARRAY_1, DATA_ARRAY_2) is identical to If(DATA_ARRAY_1,
1, If(DATA_ARRAY_2, 0, PREV(0)))
However, the SignalFlag() function processes much faster than If(DATA_ARRAY_1, 1, If
(DATA_ARRAY_2, 0, PREV(0))) when included in an indicator or trading sytem since it is an
internal function.
By Example (for practical application of function):
Let's assume the user has decided to use the Close price crossing above its 20-period simple moving
average as a simple entry condition to alert a possible Buy trade. Let's also assume that the user
wishes to show a simulated stoploss level on the chart for this simulated trade entry and create a simple
exit condition to alert when the Close price has crossed below the simulated stoploss level.
The formula logic to create this simple system is shown below (if the use of any functions in the formula
below is unclear, please refer to their respective documentation):
StoplossValue:= 30; {this would typically be a user-defined Input variable}
{Create the simulated Buy trade entry; ActiveBuyTrade
is checked to ensure no simulated trade is active;
0 = No Buy Trade Open, 1 = Buy Trade Currently Open}
{Displayed as blue Up Arrow grahic in price frame}
Buy:= ActiveBuyTrade=0 and Cross(Close,mov(C,20,S));
{Create a simulated entry price for the Buy trade;
this uses the Close price of the bar when the simulated
Buy trade is entered}
{Displayed as small, red dots in the price frame}
BuyPrice:= valuewhen(1,Buy,Close);
{Create the simulated stoploss level}
{Displayed as thin, dashed blue line in price frame}
BuyStop:= BuyPrice - (StoplossValue * SymbolPoint());
© 2011 Visual Trading Systems, LLC
VT Trader Scripting Language
381
{Create the simulated Buy trade exit; ActiveBuyTrade
is checked to ensure a simulated trade is active;
0 = No Buy Trade Open, 1 = Buy Trade Currently Open}
{Displayed as blue Exit graphic in price frame}
BuyExit:= ActiveBuyTrade=1 and Cross(BuyStop,Close);
{Determine current simulated trade condition;
this is necessary to ensure the simulated stoploss
level stays associated with the proper simulated
entry point on the chart}
{ActiveBuyTrade can only be 0 or 1; It is set equal
to 1 when the Buy condition is true; the 1 (true)
value is maintained until BuyExit condition is true,
which resets it to zero and the process begins again.}
{Displayed as thicker black line in Additional Frame 1}
ActiveBuyTrade:= SignalFlag(Buy,BuyExit);
The end result of the formula logic above (using the Trading System Builder 205 to create this logic as a
simple alert system) can be seen in the screenshot below.
© 2011 Visual Trading Systems, LLC
382
VT Trader 2.0 Help Manual
5.6.79 Signal Hold
Signal Hold
SignalHold (DATA ARRAY, PERIODS)
This function holds a "true" value of DATA ARRAY for the specified number of PERIODS. This "true"
value is held "true" over the number of PERIODS specified even if a "false" value is generated. It should
be noted that this function starts (or resets) PERIODS using the most recent "true" value of DATA
ARRAY.
© 2011 Visual Trading Systems, LLC
VT Trader Scripting Language
383
The SignalHold() function is best explained by a visual example. In the screenshot below there are
two additional frames below the price frame. Visible in the price frame are two moving averages. Each of
the two additional frames corresponds to a visual representation of an output variable evaluating a
specific condition. Since each variable's value is based on a conditional statement, the output of each
variable can only be either +1 (true) or 0 (false).
The formula used to create the output variables shown in the screenshot below is as follows:
{Plots +1 for each bar when 10-period simple MA
crosses above the 30-period simple MA,
otherwise it plots 0}
{Additional Frame 1 - Blue line}
Buy:= Cross(Close,10,S),mov(Close,30,S));
{Plots +1 on the first bar when Buy is true,
then holds the +1 value until PERIODS (10 bars)
has passed, then plots 0 again until the
next occurrence of Buy being true}
{Additional Frame 2 - Dark Blue line}
BuySignalHold:= SignalHold(Buy,10);
The end result of the formula logic above (using the Trading System Builder 205 to create this logic as a
simple trading system) can be seen in the screenshot below.
© 2011 Visual Trading Systems, LLC
384
VT Trader 2.0 Help Manual
5.6.80 Signal Remove
Signal Remove
© 2011 Visual Trading Systems, LLC
VT Trader Scripting Language
385
SignalRemove (DATA_ARRAY_1, DATA_ARRAY_2)
This function removes excesssive (redundant) "true" values. It returns +1 on the first occurence of a
"true" value in DATA_ARRAY_1 and then returns 0 until after at least one "true" occurrence of
DATA_ARRAY_2 even if there are additional "true" value occurrences in DATA_ARRAY_1.
The SignalRemove() function is best explained by a visual example. In the screenshot below there
are four additional frames below the price frame. Visible in the price frame are two moving averages with
vertical black lines marking the bars when the moving averages cross above and below each other. Each
of the four additional frames corresponds to a visual representation of an output variable evaluating a
specific condition. Since each variable's value is based on a conditional statement, the output of each
variable can only be either +1 (true) or 0 (false).
The formula used to create the output variables shown in the screenshot below is as follows:
{Plots +1 for every bar when 10-period simple MA
is greater than the 30-period simple MA,
otherwise it plots 0}
{Additional Frame 1 - Blue line}
Buy:= mov(Close,10,S) > mov(Close,30,S);
{Plots +1 for every bar when 10-period simple MA
is less than the 30-period simple MA,
otherwise it plots 0}
(Additional Frame 3 - Red line}
Sell:= mov(Close,10,S) < mov(Close,30,S);
{Plots +1 on the first bar when Buy is true,
then plots 0 for each additional bar until after
Sell is true for at least one bar, then plots +1
again on the next first occurrence of Buy being true}
{Additional Frame 2 - Dark Blue line}
RemoveBuySignals:= SignalRemove(Buy,Sell);
{Plots +1 on the first bar when Sell is true,
then plots 0 for each additional bar until after
Buy is true for at least one bar, then plots +1
again on the next first occurrence of Sell being true}
{Additional Frame 4 - Dark Red line}
RemoveSellSignals:= SignalRemove(Sell,Buy);
The end result of the formula logic above (using the Trading System Builder 205 to create this logic as a
simple trading system) can be seen in the screenshot below.
© 2011 Visual Trading Systems, LLC
386
VT Trader 2.0 Help Manual
© 2011 Visual Trading Systems, LLC
VT Trader Scripting Language
387
5.6.81 Signal Remove Span
Signal Remove Span
SignalRemoveSpan (DATA ARRAY, PERIODS)
This function removes excesssive (redundant) "true" values that span PERIODS since intial "true" value.
The first non-zero bar passes through then all subsequent non-zero bars are ignored (zero is returned)
until PERIODS have passed since initial signal; From then on a new "true" value may pass through. In
other words, it returns +1 on the first occurence of a "true" value in DATA ARRAY and then returns 0
until after PERIODS have passed since initial signal.
The SignalRemoveSpan() function is best explained by a visual example. In the screenshot below
there are four additional frames below the price frame. Visible in the price frame are two moving
averages. Each of the four additional frames corresponds to a visual representation of an output variable
evaluating a specific condition. Since each variable's value is based on a conditional statement, the
output of each variable can only be either +1 (true) or 0 (false).
The formula used to create the output variables shown in the screenshot below is as follows:
{Plots +1 for every bar when 10-period simple MA
is greater than the 30-period simple MA,
otherwise it plots 0}
{Additional Frame 1 - Blue line}
Buy:= mov(Close,10,S) > mov(Close,30,S);
{Plots +1 for every bar when 10-period simple MA
is less than the 30-period simple MA,
otherwise it plots 0}
(Additional Frame 3 - Red line}
Sell:= mov(Close,10,S) < mov(Close,30,S);
{Plots +1 on the first bar when Buy is true,
then plots 0 for each additional bar until after
PERIODS has passed, then plots +1 again on the
next first occurrence of Buy being true}
{Additional Frame 2 - Dark Blue line}
RemoveBuySignals:= SignalRemoveSpan(Buy,10);
{Plots +1 on the first bar when Sell is true,
then plots 0 for each additional bar until after
PERIODS has passed, then plots +1 again on the
next first occurrence of Sell being true}
{Additional Frame 4 - Dark Red line}
RemoveSellSignals:= SignalRemoveSpan(Sell,10);
The end result of the formula logic above (using the Trading System Builder 205 to create this logic as a
simple trading system) can be seen in the screenshot below.
© 2011 Visual Trading Systems, LLC
388
VT Trader 2.0 Help Manual
© 2011 Visual Trading Systems, LLC
VT Trader Scripting Language
389
5.6.82 Sine
Sine
sin (DATA ARRAY)
sin() returns the sine of DATA ARRAY.
This function assumes that the DATA ARRAY values are in degrees.
A sine wave can be plotted using formula sin(cum(7)). Increasing the value in this formula (i.e.:7) will
increase the frequency of the sine wave.
5.6.83 Square Root
Square Root
sqrt (DATA ARRAY)
The function calculations the Square Root of DATA ARRAY.
The Square Root of a negative DATA ARRAY always returns a NULL result.
The formula sqrt(16) returns 4.
The formula sqrt(-16)returns NULL.
5.6.84 Standard Deviation
Standard Deviation
stdev (DATA ARRAY, PERIODS, TYPE, DATA ARRAY 2)
This function calculates the predefined Standard Deviation Indicator of DATA ARRAY for the specified
PERIODS. TYPE and DATA ARRAY 2 are optional parameters. Valid TYPE's are simple, weighted,
exponential, sine weighted, triangle, end point, and volume-adjusted (Abbreviated respectively as S, W,
E, SW, TRI, EP, and VOL).
For example,
stdev (Close, 4, Simple, Close) = stdev (C, 4)
stdev (Close, 4, Simple) = stdev (C, 4) {DataArray = DataArray2}
© 2011 Visual Trading Systems, LLC
390
VT Trader 2.0 Help Manual
The formula stdev(Close,21) calculates Standard Deviation of Close prices over 21-periods.
A 4-periods Standard Deviation Indicator can be written by first assigning a 4-periods Simple Moving
Average to the variable named 4PeriodMA and then summing the squares of the differences between
the Moving Average and the Close prices on each of the preceding four periods. Finally, calculate the
square root of this total.
{A 4-period Standard Deviation Indicator}
4PeriodMA:= Mov(Close,4,S);
_StDev:= Sqrt((Power(4PeriodMA-Close,2)+Power((4PeriodMA)-Ref(Close,-1),2)
+
Power((4PeriodMA)-Ref(Close,-2),2)+Power((4PeriodMA)-Ref(Close,-3
),2))/4);
5.6.85 Standard Error
Standard Error
ste (DATA ARRAY, PERIODS)
This function calculates the predefined Standard Error of DATA ARRAY for the specified PERIODS.
The formula ste(Close,21) calculates the Standard Error of Close prices over 21-periods.
5.6.86 Stochastic Momentum Index
Stochastic Momentum Index
stochmomentum (PERIODS, SMOOTHING, DOUBLE SMOOTHING)
This function calculates the predefined Stochastic Momentum Index.
The formula stochmomentum(PERIODS, SMOOTHING, DOUBLE SMOOTHING) calculates the
Stochastic Momentum Index by formula:
{Stochastic Momentum Index}
_StochMomentum:= 100 * (Mov(Mov(Close - (0.5 * (hhv(High,PERIODS) + llv
(Low,PERIODS))), SMOOTHING,E),DOUBLE SMOOTHING,E) / (0.5 * Mov(Mov(hhv
© 2011 Visual Trading Systems, LLC
VT Trader Scripting Language
(High,PERIODS) - llv(Low,PERIODS),
391
SMOOTHING,E),DOUBLE SMOOTHING,E)));
{end}
The following formula calculates a stochmomentum(13,25,2) Stochastic Momentum Index:
{Stochastic Momentum Index -> stochmomentum(13,25,2)}
_StochMomentum:= 100 * (Mov(Mov(Close - (0.5 * (hhv(High,13) + llv(Low,13
))),25,E),2,E) / (0.5 * Mov(Mov(hhv(High,13) - llv(Low,13),25,E),2,E)));
{end}
5.6.87 Stochastic Oscillator
Stochastic Oscillator
stoch (%K PERIODS, %K SLOWING)
This function calculates the predefined Stochastic Oscillator.
The function stoch(%K PERIODS,%K SLOWING) calculates the %K Stochastic Oscillator by formula:
{%K Stochastic Oscillator}
_K_Stoch:= (sum(Close - llv(Low,%K PERIODS),%K SLOWING) / sum(hhv(High,%K
PERIODS) - llv(Low,%K PERIODS),%K SLOWING)) * 100;
{end}
This next formula calculates a N-period %D of the %K in the preceding formula stoch(%K PERIODS,%
K SLOWING).
{%D Stochastic Oscillator}
_D_Stoch:= Mov(sum(Close - llv(Low,%K PERIODS),%K SLOWING) / sum(hhv(High,%
K PERIODS) - llv(Low,%K PERIODS),%K SLOWING)) * 100),%D PERIODS,S);
{end}
... Or...
{%D Stochastic Oscillator}
_D_Stoch:= Mov(stoch(%K PERIODS,%K SLOWING),%D PERIODS,S);
{end}
The formula stoch(5,3) returns the value of a 5-period %K slowed 3-periods.
The following formula calculates a 5-period %K Stochastic Oscillator with 3-period slowing:
© 2011 Visual Trading Systems, LLC
392
VT Trader 2.0 Help Manual
{%K Stochastic Oscillator}
_K_Stoch:= (sum(Close - llv(Low,5),3) / sum(hhv(High,5) - llv(Low,5),3)) *
100;
{end}
This next formula calculates a 3-period %D of the %K in the preceding formula.
{%D Stochastic Oscillator}
_D_Stoch:= Mov((sum(Close - llv(Low,5),3) / sum(hhv(High,5) - llv(Low,5),3
)) * 100),3,S);
{end}
... Or...
{%D Stochastic Oscillator}
_D_Stoch:= Mov(stoch(5,3),3,S);
{end}
5.6.88 Summation
Summation
sum (DATA ARRAY, PERIODS)
This function calculates a Cumulative Sum of DATA ARRAY for the specified PERIODS (including the
current period).
The formula sum(Close,12) returns the sum of the preceding 12 Close prices.
A 12-periods Simple Moving Average could be written as:
MA:= sum(Close,12) / 12;
5.6.89 Symbol Digits
Symbol Digits
SymbolDigits ()
This function returns a whole integer value as it corresponds to the number of digits to the right of the
decimal point for the current symbol loaded in the chart window.
For currency pairs with prices quoted out to four decimal places (such as EURUSD), SymbolDigits()
returns 4. For currency pairs with prices quoted out to two decimal places (such as USDJPY),
SymbolDigits() returns 2.
© 2011 Visual Trading Systems, LLC
VT Trader Scripting Language
393
By Example (for practical application of function):
Let's assume the user has decided to use the Close price crossing above its 20-period simple moving
average as a simple entry condition to alert a possible Buy trade. Let's also assume that the user
wishes to show a simulated stoploss level on the chart for this simulated trade entry and create a simple
exit condition to alert when the Close price has crossed below the simulated stoploss level.
The formula logic to create this simple system is shown below (if the use of any functions in the formula
below is unclear, please refer to their respective documentation):
StoplossValue:= 30; {this would typically be a user-defined Input variable}
{Convert the whole integer StoplossValue variable value
to a pip value that is comparable to the current symbol's
price scale}
CurrencyStoplossValue:= if(SymbolDigits()=4, StoplossValue * 0.0001,
if(SymbolDigits()=2, StoplossValue * 0.01,
0));
{Create the simulated Buy trade entry; ActiveBuyTrade
is checked to ensure no simulated trade is active;
0 = No Buy Trade Open, 1 = Buy Trade Currently Open}
{Displayed as blue Up Arrow grahic in price frame}
Buy:= ActiveBuyTrade=0 and Cross(Close,mov(C,20,S));
{Create a simulated entry price for the Buy trade;
this uses the Close price of the bar when the simulated
Buy trade is entered}
BuyPrice:= valuewhen(1,Buy,Close);
{Create the simulated stoploss level}
{Displayed as thin, dotted blue line in price frame}
BuyStop:= BuyPrice - CurrencyStoplossValue;
{Create the simulated Buy trade exit; ActiveBuyTrade
is checked to ensure a simulated trade is active;
0 = No Buy Trade Open, 1 = Buy Trade Currently Open}
{Displayed as blue Exit graphic in price frame}
BuyExit:= ActiveBuyTrade=1 and Cross(BuyStop,Close);
{Determine current simulated trade condition;
this is necessary to ensure the simulated stoploss
level stays associated with the proper simulated
entry point on the chart}
{ActiveBuyTrade can only be 0 or 1; It is set equal
to 1 when the Buy condition is true; the 1 (true)
value is maintained until BuyExit condition is true,
which resets it to zero and the process begins again.}
{Displayed as thicker black line in Additional Frame 1}
© 2011 Visual Trading Systems, LLC
394
VT Trader 2.0 Help Manual
ActiveBuyTrade:= SignalFlag(Buy,BuyExit);
The end result of the formula logic above (using the Trading System Builder 205 to create this logic as a
simple alert system) can be seen in the screenshot below.
5.6.90 Symbol Point
Symbol Point
SymbolPoint ()
This function returns the point (pip) value for the current symbol loaded in the chart window. For
reference, a "pip" is the smallest increment of movement for any currency pair in the spot FOREX
© 2011 Visual Trading Systems, LLC
VT Trader Scripting Language
395
market.
For currency pairs with prices quoted out to four decimal places a pip is equal to 0.0001. For example,
in EURUSD a movement of 1.2231 to 1.2232 is equal to one pip (0.0001).
For currency pairs with prices quoted out to only two decimal places a pip is equal to 0.01 (or 0.0100).
For example, in USDJPY a movement of 118.28 to 118.29 is equal to one pip (0.01).
By Example (for practical application of function):
Let's assume the user has decided to use the Close price crossing above its 20-period simple moving
average as a simple entry condition to alert a possible Buy trade. Let's also assume that the user
wishes to show a simulated stoploss level on the chart for this simulated trade entry and create a simple
exit condition to alert when the Close price has crossed below the simulated stoploss level.
The formula logic to create this simple system is shown below (if the use of any functions in the formula
below is unclear, please refer to their respective documentation):
StoplossValue:= 30; {this would typically be a user-defined Input variable}
{Create the simulated Buy trade entry; ActiveBuyTrade
is checked to ensure no simulated trade is active;
0 = No Buy Trade Open, 1 = Buy Trade Currently Open}
{Displayed as blue Up Arrow grahic in price frame}
Buy:= ActiveBuyTrade=0 and Cross(Close,mov(C,20,S));
{Create a simulated entry price for the Buy trade;
this uses the Close price of the bar when the simulated
Buy trade is entered}
BuyPrice:= valuewhen(1,Buy,Close);
{Create the simulated stoploss level}
{Displayed as thin, dotted blue line in price frame}
BuyStop:= BuyPrice - (StoplossValue * SymbolPoint());
{Create the simulated Buy trade exit; ActiveBuyTrade
is checked to ensure a simulated trade is active;
0 = No Buy Trade Open, 1 = Buy Trade Currently Open}
{Displayed as blue Exit graphic in price frame}
BuyExit:= ActiveBuyTrade=1 and Cross(BuyStop,Close);
{Determine current simulated trade condition;
this is necessary to ensure the simulated stoploss
level stays associated with the proper simulated
entry point on the chart}
{ActiveBuyTrade can only be 0 or 1; It is set equal
to 1 when the Buy condition is true; the 1 (true)
value is maintained until BuyExit condition is true,
which resets it to zero and the process begins again.}
{Displayed as thicker black line in Additional Frame 1}
© 2011 Visual Trading Systems, LLC
396
VT Trader 2.0 Help Manual
ActiveBuyTrade:= SignalFlag(Buy,BuyExit);
The end result of the formula logic above (using the Trading System Builder 205 to create this logic as a
simple alert system) can be seen in the screenshot below.
5.6.91 Trough Value
Trough Value
trough (Nth, DATA ARRAY, % MINIMUM CHANGE)
This function returns the value of DATA ARRAY Nth trough(s) ago. N=1 would return the value of the
most recent trough. N=2 would return the value of the 2nd most recent trough, etc. The % MINIMUM
CHANGE parameter determines how much greater the new trough() value must be in comparison to
© 2011 Visual Trading Systems, LLC
VT Trader Scripting Language
397
the previous trough() value before a new trough value is returned.
The formula Trough(1, Rsi(14), 10) returns the most recent trough() value of Rsi(14) if
there has been at least a 10% change from the previous trough value.
5.6.92 Trough Bars
Trough Bars
TroughBars (Nth, DATA ARRAY, % MINIMUM CHANGE)
Plots the number of bars that have passed from the Nth trough. N=1 would return the number of bars that
have passed since the most recent trough. N=2 would return the number of bars that have passed since
the 2nd most recent trough. Etc.
5.6.93 Typical Price
Typical Price
tp ()
This function calculates the predefined Typical Price Indicator.
The function tp() calculates the Typical Price by formula:
{Typical Price Indicator}
_TypicalPrice:= (High + Low + Close) / 3;
{end}
5.6.94 Ultimate Oscillator
Ultimate Oscillator
ult (CYCLE1, CYCLE2, CYCLE3)
This function calculates the predefined Ultimate Oscillator Indicator using the three cycle lengths
supplied as parameters.
© 2011 Visual Trading Systems, LLC
398
VT Trader 2.0 Help Manual
The formula ult(7,14,28) calculates the default Ultimate Oscillator Indicator.
The function ult(CYCLE1,CYCLE2,CYCLE3)calculates the Ultimate Oscillator Indicator by formula:
{Ultimate Oscillator Indicator}
_Ult:= (((((Sum((Max((C-L),(C-Ref(L,-1)))),CYCLE1)) / (Sum((Max(Max((H-L),
H-Ref(L,-1)),Max((Ref(H,-1)-L),(Ref(H,-1)-Ref(L,-1))))),CYCLE1)))*4)+(((Sum
((Max((C-L),(C-Ref(L,-1)))), CYCLE2)) / (Sum((Max(Max((H-L),H-Ref(L,-1)),
Max((Ref(H,-1)-L),(Ref(H,-1)-Ref(L,-1))))),CYCLE2)))*2)+((Sum((Max((C-L),
(C-Ref(L,-1)))),CYCLE3)) / (Sum((Max(Max((H-L),H-Ref(L,-1)) ,Max((Ref(H,-1
)-L),(Ref(H,-1)-Ref(L,-1))))),CYCLE3)))) / CYCLE1) * 100;
{end}
5.6.95 Value When
Value When
valuewhen (Nth, EXPRESSION, DATA ARRAY)
This function returns the value of the DATA ARRAY when the EXPRESSION was true on the Nth most
recent occurrence. This includes all data loaded in the chart.
The formula valuewhen(2, cross(close,mov(close,13,S), rsi(14)) returns the value of
the 14-periods RSI on the 2nd most recent occurrence of the Close price crossing above its 13-periods
moving average.
5.6.96 Vertical Horizontal Filter
Vertical Horizontal Filter
vhf (DATA ARRAY, PERIODS)
Calculates the predefined Vertical Horizontal Filter of DATA ARRAY over the specified PERIODS.
The formula vhf(Close,28) calculates the Vertical Horizontal Filter of Close prices over the specified
28-periods.
© 2011 Visual Trading Systems, LLC
VT Trader Scripting Language
399
5.6.97 Weighted Close
Weighted Close
wc ()
The wc() function calculates the predefined Weighted Close Indicator.
The Weighted Close Indicator is calculated by multiplying the Close by two, adding the High and the
Low together, and then dividing by four. The result is the average price for the period with extra weight
given to the Close price.
The function wc() calculates the Weighted Close Indicator by formula:
{Weighted Close Indicator}
_WC:= ((Close * 2) + High + Low) / 4;
{end}
5.6.98 Wilder's Smoothing
Wilders Smoothing
Wilders (DATA ARRAY, PERIODS)
The Wilders() function calculates the predefined Wilder's Smoothing.
The function Wilders(DATA ARRAY, PERIODS) calculates the Wilder's Smoothing by formula:
{Wilder's Smoothing Indicator}
_Wilders:= Mov(DATA ARRAY, (PERIODS * 2) - 1, E);
{end}
The formula Wilders(Close,8) is equivalent to Mov(Close,8*2-1,E) or Mov(Close,15,E).
5.6.99 Williams' % R
Williams' %R
willr (PERIODS)
This function calculates the predefined Williams' %R indicator.
© 2011 Visual Trading Systems, LLC
400
VT Trader 2.0 Help Manual
The function willr() calculates the Williams' %R Indicator by formula:
{Williams' %R Indicator}
_Willr:= ((hhv(High,PERIODS) - Close) / (hhv(High, PERIODS) - llv(Low,
PERIODS))) * -100;
{end}
Notice that the formula is inverted by multiplying it by -100. Williams' %R is plotted on an upside down
scale with 0 at the top and -100 at the bottom. Values ranging from 0 to -20% indicate overbought levels
while values ranging from -80 to -100% indicate oversold levels.
5.6.100 Year
Year
year ()
This function returns the value of the year in a four-digit format.
If a bar had the date/time stamp of 02/17/2006, 13:44:00 (Feb. 17th, 2006, 1:44 P.M. EST), the year()
function would return 2006.
5.6.101 Zli
Zli
zli (DATA ARRAY, PERIODS, GAIN LIMIT)
Calculates the PERIODS zero-lag indicator of DATA ARRAY with the specified GAIN LIMIT value.
Valid GAIN LIMIT values are any positive integer.
The Zero-Lag Indicator was described in the article, "Zero Lag (Well Almost)" by John Ehlers and Ric
Way published in the November 2010 edition of Technical Analysis of Stocks and Commodities
magazine.
5.7
Functions (Reserved for Future Use)
Functions (Reserved for Future Use) cannot be used in the construction of custom indicators and
trading systems.The following Functions (Identifiers) are currently reserved for future use in VT Trader's
scripting language.
AD
ADX
ADXR
© 2011 Visual Trading Systems, LLC
VT Trader Scripting Language
ALERT
ASWING
BBANDLINES
BUYP
CCIE
CMF
CO
CORREL
CSI
DELTA
DEMA
DI
DIVERGENCE
DMI
DX
EMV
EXTFML
FFF
FML
FMLVAR
FORECASTOSC
GAMMA
HIGHESTSINCEBARS
HPI
IMI
INERTIA
INPUT
KVO
LIFE
LINEARREG
LOWESTSINCEBARS
MACD
MARKETFACINDEX
MASS
MDI
MESALEADSINE
MESASINEWAVE
MFI
NVI
OBV
OPTION
OPTIONEXP
OSCP
OSCV
PDI
PEAKBARS
PER
PFE
PRICECHANNELHIGH
PRICECHANNELLOW
PROJBANDBOT
PROJBANDTOP
PROJOSC
© 2011 Visual Trading Systems, LLC
401
402
VT Trader 2.0 Help Manual
PVI
PVT
QSTICK
RALLYWITHVOL
RANGEINDICATOR
REACTIONWITHVOL
RMI
RSQUARED
RVI
RWIH
RWIL
SECURITY
SELLP
STEBANDBOT
STEBANDTOP
SWING
TEMA
THETA
TICK
TRIX
TROUGHBARS
TSF
TVI
TYPICAL
VAR
VEGA
VOL
VOLO
WILLA
WRITEIF
WRITEVAL
ZIG
© 2011 Visual Trading Systems, LLC
Technical Indicators
Part
VI
404
6
VT Trader 2.0 Help Manual
Technical Indicators
VT Trader includes 120+ of the most well-known technical indicators available to traders. Below is an
alphabetical listing of the technical indicators available in VT Trader. Click on the indicator's name for full
details.
A 404 B 404 C 404 D 404 E 405 F 405 G 405 H 405 I 405 J 405 K 405 L 405 M 406 N 406 O 406 P 406 Q
406 R 406 S 407 T 407 U 407 V 407 W 407 X 407 Y 407 Z 407
A
Aroon Indicator 408
Aroon Oscillator 410
Average Directional Movement Index (ADX) 412
Average Directional Movement Index Rating (ADXR) 415
Average True Range (ATR) 417
B
Balance of Power 419
Bollinger Bands 422
Bollinger Bands - Fibonacci Ratios 424
Bollinger Bandwidth 428
Bollinger Percent B (%b) 432
C
Chaikin's Volatility 434
Chande's Dynamic Momentum Index 436
Chande's Momentum Oscillator (CMO) 440
Chande's QStick 442
Chande's Range Action Verification Index (RAVI) 445
Chande's TrendScore 446
Chande's Variable Index Dynamic Average (VIDYA) 448
Chaos Accelerator Oscillator 450
Chaos Alligator Indicator 453
Chaos Awesome Oscillator 456
Chaos Fractals 459
Chaos Gator Oscillator 462
Choppiness Index 465
Commodity Channel Index (CCI) 467
Coppock Curve 471
D
Darvas Box 473
DeMark's DeMarker I 475
DeMark's Projected Range 478
DeMark's Range Expansion Index (REI) 480
Detrended Price Oscillator (DPO) 482
Directional Movement Index 484
© 2011 Visual Trading Systems, LLC
Technical Indicators
Directional Movement System 486
Disparity Index 490
Donchian Channel 492
Double Exponential Moving Average (DEMA) 494
Double Stochastic Oscillator 496
E
Ehlers Fisher Transform 499
Ehlers Laguerre Relative Strength Index 502
Ehlers MESA Adaptive Moving Average (MAMA and FAMA) 504
Ehlers Relative Vigor Index (RVI) 506
Elder-Ray Bear Power 509
Elder-Ray Bull Power 512
Elliot Oscillator 516
F
-G
Gann HiLo Activator 519
Gann Swing Oscillator 520
Gann Trend Oscillator 522
H
Hull Moving Average 525
I
Ichimoku Kinko Huo 527
Inertia 531
J
-K
Kase CD 533
Kase DevStop II 536
Kase Peak Oscillator 538
Kaufman's Adaptive Moving Average (KAMA) 540
Kaufman's Efficiency Ratio 543
Keltner Bands (Based on ATR) 545
Keltner Channels 548
Kurtosis Indicator 550
L
Linear Regression Acceleration 553
© 2011 Visual Trading Systems, LLC
405
406
VT Trader 2.0 Help Manual
Linear Regression Indicator 556
Linear Regression Slope 558
M
MACD 561
MACD-Histogram 565
MACD-Line 568
Mass Index 571
McClellan Histogram 574
McClellan Oscillator 576
McClellan Summation Index 579
McGinley Dynamic 581
Momentum 583
Moving Average (MA) 585
Moving Average Envelope 588
Moving Averages of Relative Strength Index (MA's of RSI) 592
Moving Slope Rate of Change 595
N
-O
-P
Parabolic SAR 597
Percentage Price Oscillator (PPO) 599
Pivot Points - 24-Hour Cycle 603
Pivot Points - 24-Hour Cycle - Fibonacci Ratios 609
Pivot Points - Monthly Cycle 613
Pivot Points - Monthly Cycle - Fibonacci Ratios 619
Pivot Points - Weekly Cycle 623
Pivot Points - Weekly Cycle - Fibonacci Ratios 629
Polarized Fractal Efficiency 634
Q
Quantitative Qualitative Estimation (QQE) 636
R
Rainbow Charts 640
Rainbow Oscillator 644
Rate of Change (ROC) 648
Recursive Moving Trend Average 651
Relative Momentum Index (RMI) 653
Relative Strength Index (RSI) 656
Relative Volatility Index (RVI) 658
R-Squared (R2) 661
© 2011 Visual Trading Systems, LLC
Technical Indicators
S
Schaff Trend Cycle 664
Stochastic Momentum Index 666
Stochastic Oscillator (Fast) 669
Stochastic Oscillator (Slow) 675
Stochastic Oscillator (Full) 672
Stochastic RSI Oscillator 678
Stoller Average Range Channels (STARC Bands) 682
Support and Resistance 685
T
T3 Moving Average 688
Trailing Stoploss Levels (Volatility-Based) 690
Trailing Stoploss Reversal Level 692
Trend Continuation Factor (TCF) 695
Trend Intensity Index (TII) 698
Trend Oscillator (tosc) 700
Trend Trigger Factor (TTF) 702
Triple Exponential Average (TRIX) 704
Triple Exponential Moving Average (TEMA) 706
True Strength Index (TSI) 708
U
Ulcer Index 712
Ultimate Oscillator 714
V
Volatility Quality Index 717
W
Williams Percent Range (%R) 719
X
-Y
-Z
--
© 2011 Visual Trading Systems, LLC
407
408
6.1
VT Trader 2.0 Help Manual
Aroon Indicator
Overview
The Aroon indicator was developed by Tushar Chande in 1995. The Aroon indicator attempts to
determine if a trading instrument is trending or not as well as define how strong the trend is. Since
Chande designed this indicator to reveal the beginning of a new trend he named it "Aroon" which means
"Dawn's Early Light" in Sanskrit.
Interpretation
The Aroon indicator is constructed with two lines - Aroon(Up) and Aroon(Down). Aroon(up) is the amount
of time (on a percentage basis) that has elapsed between the start of the time period and the point at
which the highest price during that time period occurred. If the trading instrument is setting a new low for
the given time period, Aroon(up) will be zero. However, if the trading instrument closes higher than it has
during the rest of the time period, Aroon(up) will be +100. For each subsequent period that passes
without another new high, Aroon(up) moves down by an amount equal to (1 / # of periods) x 100.
© 2011 Visual Trading Systems, LLC
Technical Indicators
409
Technically, the formula for Aroon(up) is:
[ [ (# of periods) - (# of periods since highest high during that time) ] / (# of periods) ] x 100
For example, consider plotting a 10-period Aroon(up) line on a daily chart. If the highest price for the past
ten days occurred 6 days ago (4 days since the start of the time period), Aroon(up) for today would be
equal to ((10-6)/10) x 100 = 40. If the lowest price in that same period happened yesterday (i.e. on day
9), Aroon(down) for today would be 90.
Aroon(down) is calculated in just the opposite manner, looking for new lows instead of new highs. When
a new low is set, Aroon(down) is equal to +100. If the stock is setting a new high for the given time
period, Aroon(down) will be zero. And so on...
The formula for Aroon(down) is:
[ [ (# of periods) - (# of periods since lowest low during that time) ] / (# of periods) ] x 100
Chande states that when Aroon(up) and Aroon(down) are in close proximity to each other and
descending lower that the market is consolidating and no strong trend is evident. Aroon(up) dipping
below 50 indicates that the current trend's upward momentum is gone. Similarly, Aroon(down) dipping
below 50 indicates that the current trend's downward momentum is gone. Values above 70 indicate a
strong trend in the same direction as the Aroon (up or down). Values below 30 indicate a strong trend in
the opposite direction.
Construction
1. Click the Ribbon>Technical Analysis menu>Indicators group>Indicator Builder command>
Indicator Builder window's [New] button
2. In the General tab, type the following text for each field:
Name: Aroon Indicator
Function Name Alias: vt_Aroon
Label Mask:
Aroon Up (%Periods%) = %_AroonUp%
Aroon Down (%Periods%) = %_AroonDown%
Placement: New Frame
Data Inspection Alias: Aroon Indicator
3. In the Input Variable(s) tab, create the following variables:
[New] button...
Name: Periods
Display Name: Periods
Type: integer
Default: 14
4. In the Output Variable(s) tab, create the following variables:
[New] button...
© 2011 Visual Trading Systems, LLC
410
VT Trader 2.0 Help Manual
Var Name: _AroonUp
Name: (Aroon Up)
Line Color: dark blue
Line Width: thin
Line Type: solid
[New] button...
Var Name: _AroonDown
Name: (Aroon Down)
Line Color: dark blue
Line Width: thin
Line Type: dashed
5. In the Horizontal Line tab, create the following lines:
[New] button...
Value: +70.0000
Color: red
Width: thin
Type: dashed
[New] button...
Value: +50.0000
Color: gray
Width: thin
Type: dashed
[New] button...
Value: +30.0000
Color: red
Width: thin
Type: dashed
6. In the Formula tab, copy and paste the following formula:
_AroonUp:= ((Periods-HHVBars(H,Periods+1))/Periods)*100;
_AroonDown:= ((Periods-LLVBars(L,Periods+1))/Periods)*100;
7. Click the "Save" icon to finish building the Aroon indicator.
6.2
Aroon Oscillator
Overview
The Aroon Oscillator is derived from the Aroon Indicator. The Aroon Oscillator is constructed by
subtracting Aroon(down) from Aroon(up). Since Aroon(up) and Aroon(down) oscillate between 0
and +100, the Aroon Oscillator oscillates between -100 and +100.
© 2011 Visual Trading Systems, LLC
Technical Indicators
411
Interpretation
The Aroon Oscillator indicates and upward trend when it is above zero and a downward trend when it is
below zero. The farther away the oscillator is from the zero line, the stronger the trend.
Construction
1. Click the Ribbon>Technical Analysis menu>Indicators group>Indicator Builder command>
Indicator Builder window's [New] button
2. In the General tab, type the following text for each field:
Name: Aroon Oscillator
Function Name Alias: vt_AroonOsc
Label Mask: Aroon Oscillator (%Periods%) = %_AroonOsc%
Placement: New Frame
Data Inspection Alias: Aroon Oscillator
3. In the Input Variable(s) tab, create the following variables:
[New] button...
Name: Periods
Display Name: Periods
Type: integer
Default: 14
© 2011 Visual Trading Systems, LLC
412
VT Trader 2.0 Help Manual
4. In the Output Variable(s) tab, create the following variables:
[New] button...
Var Name: _AroonOsc
Name: (Osc)
Line Color: dark blue
Line Width: thin
Line Type: histogram
5. In the Horizontal Line tab, create the following lines:
[New] button...
Value: +50.0000
Color: red
Width: thin
Type: dashed
[New] button...
Value: +0.0000
Color: black
Width: thin
Type: dashed
[New] button...
Value: -50.0000
Color: red
Width: thin
Type: dashed
6. In the Formula tab, copy and paste the following formula:
_AroonUp:= ((Periods-HHVBars(H,Periods+1))/Periods)*100;
_AroonDown:= ((Periods-LLVBars(L,Periods+1))/Periods)*100;
_AroonOsc:= _AroonUp - _AroonDown;
7. Click the "Save" icon to finish building the Aroon Oscillator.
6.3
Average Directional Movement Index (ADX)
Overview
The Average Directional Movement Index (ADX) is a momentum indicator developed by J. Welles Wilder
and described in his book "New Concepts in Technical Trading Systems", written in 1978. The ADX is
constructed from two other Wilders' indicators: the Positive Directional indicator (+DI) and the Negative
Directional Indicator (-DI). The +DI and -DI indicators are commonly referred to as the Directional
Movement Index. Combining the +/-DI and applying a Wilders() smoothing filter results in the final ADX
© 2011 Visual Trading Systems, LLC
Technical Indicators
413
value.
Interpretation
The ADX's main purpose is to measure the strength of market trends on a 0-100 scale; the higher the
ADX value the stronger the trend. It should be noted that while the direction of price is important to the
ADX's calculation, the ADX itself is not a directional indicator. Values above 40 indicate very strong
trending while values below 20 indicate non-trending or ranging market conditions.
Traders typically use the ADX as a filter along with other indicators to create a more concrete trading
methodology. Many traders view ADX turning up from below 20 as an early signal of a new emerging
trend while, conversely, a declining ADX turning down from above 40 as deterioration of the current trend.
Wilder suggests using the ADX as part of a system that includes the +DI and -DI indicators; please refer
to the Directional Movement System indicator for additional details.
Construction
1. Click the Ribbon>Technical Analysis menu>Indicators group>Indicator Builder command>
Indicator Builder window's [New] button
2. In the General tab, type the following text for each field:
Name: Average Directional Movement Index (ADX)
Function Name Alias: vt_ADX
Label Mask: ADX (%Pr%,%SmPr%) = %_ADX%
© 2011 Visual Trading Systems, LLC
414
VT Trader 2.0 Help Manual
Placement: New Frame
Data Inspection Alias: ADX
3. In the Input Variable(s) tab, create the following variables:
[New] button...
Name: Pr
Display Name: DX Periods
Type: integer
Default: 14
[New] button...
Name: SmPr
Display Name: ADX Smoothing Periods
Type: integer
Default: 14
4. In the Output Variable(s) tab, create the following variables:
[New] button...
Var Name: _ADX
Name: (ADX)
Line Color: dark green
Line Width: slightly thicker
Line Type: solid
5. In the Horizontal Line tab, create the following lines:
[New] button...
Value: +20.0000
Color: red
Width: thin
Type: dashed
6. In the Formula tab, copy and paste the following formula:
TH:= if(Ref(C,-1)>H,Ref(C,-1),H);
TL:= if(Ref(C,-1)<L,Ref(C,-1),L);
TR:= TH-TL;
PlusDM:= if(H>Ref(H,-1) AND L>=Ref(L,-1), H-Ref(H,-1),
if(H>Ref(H,-1) AND L<Ref(L,-1) AND H-Ref(H,-1)>Ref(L,-1)-L, HRef(H,-1),
0));
PlusDI:= 100 * Wilders(PlusDM,Pr)/Wilders(Tr,Pr);
MinusDM:= if(L<Ref(L,-1) AND H<=Ref(H,-1), Ref(L,-1)-L,
if(H>Ref(H,-1) AND L<Ref(L,-1) AND H-Ref(H,-1)<Ref(L,-1)-L,
Ref(L,-1)-L,
0));
MinusDI:= 100 * Wilders(MinusDM,Pr)/Wilders(Tr,Pr);
© 2011 Visual Trading Systems, LLC
Technical Indicators
415
DIDif:= Abs(PlusDI-MinusDI);
DISum:= PlusDI + MinusDI;
_ADX:= 100 * Wilders(DIDif/DISum,SmPr);
7. Click the "Save" icon to finish building the Average Directional Movement Index (ADX).
6.4
Average Directional Movement Index Rating (ADXR)
Overview
The Average Directional Movement Index Rating (ADXR) indicator is an attempt to quantify the
momentum change of the ADX indicator. It was developed by J. Welles Wilder and described in his book
"New Concepts in Technical Trading Systems", written in 1978. The ADXR is constructed adding the
current ADX value and an ADX value n-Periods ago and then dividing that sum by two. This additional
smoothing step causes the ADXR to be slightly less responsive to changes in the trend than the ADX.
According to Wilder, this smoothing step was used to help compensate for the variance of excessive
tops and bottoms.
Interpretation
© 2011 Visual Trading Systems, LLC
416
VT Trader 2.0 Help Manual
The ADXR is used in much the same way as the ADX; the higher the ADXR value the stronger the trend.
Values above 40 indicate very strong trending while values below 20 indicate non-trending or ranging
market conditions.
Wilder suggests using the ADXR (or ADX) as part of a system that includes the +DI and -DI indicators;
please refer to the Directional Movement System indicator for additional details.
Construction
1. Click the Ribbon>Technical Analysis menu>Indicators group>Indicator Builder command>
Indicator Builder window's [New] button
2. In the General tab, type the following text for each field:
Name: Average Average Directional Movement Index Rating (ADXR)
Function Name Alias: vt_ADXR
Label Mask: ADXR (%Pr%,%SmPeriods%) = %_ADXR%
Placement: New Frame
Data Inspection Alias: ADXR
3. In the Input Variable(s) tab, create the following variables:
[New] button...
Name: Pr
Display Name: DX Periods
Type: integer
Default: 14
[New] button...
Name: SmPeriods
Display Name: ADXR Smoothing Periods
Type: integer
Default: 14
4. In the Output Variable(s) tab, create the following variables:
[New] button...
Var Name: _ADXR
Name: (ADXR)
Line Color: dark blue
Line Width: slightly thicker
Line Type: solid
5. In the Horizontal Line tab, create the following lines:
[New] button...
Value: +20.0000
Color: red
Width: thin
Type: dashed
© 2011 Visual Trading Systems, LLC
Technical Indicators
417
6. In the Formula tab, copy and paste the following formula:
TH:= if(Ref(C,-1)>H,Ref(C,-1),H);
TL:= if(Ref(C,-1)<L,Ref(C,-1),L);
TR:= TH-TL;
PlusDM:= if(H>Ref(H,-1) AND L>=Ref(L,-1), H-Ref(H,-1),
if(H>Ref(H,-1) AND L<Ref(L,-1) AND H-Ref(H,-1)>Ref(L,-1)-L, HRef(H,-1),
0));
PlusDI:= 100 * Wilders(PlusDM,Pr)/Wilders(Tr,Pr);
MinusDM:= if(L<Ref(L,-1) AND H<=Ref(H,-1), Ref(L,-1)-L,
if(H>Ref(H,-1) AND L<Ref(L,-1) AND H-Ref(H,-1)<Ref(L,-1)-L,
Ref(L,-1)-L,
0));
MinusDI:= 100 * Wilders(MinusDM,Pr)/Wilders(Tr,Pr);
DIDif:= Abs(PlusDI-MinusDI);
DISum:= PlusDI + MinusDI;
ADXFinal:= 100 * Wilders(DIDif/DISum,SmPeriods);
_ADXR:= (ADXFinal + Ref(ADXFinal,1-SmPeriods)) / 2;
7. Click the "Save" icon to finish building the Average Directional Movement Index Rating (ADXR).
6.5
Average True Range (ATR)
Overview
Introduced by Welles Wilder in his book "New Concepts in Technical Trading Systems" (1978), the
Average True Range (ATR) is a measure of a trading instrument's volatility. It measures the degree of
price movement, not the direction or duration of the price movement. The True Range is first calculated
using the is the greatest of the following:
Difference between the current high and the current low
Difference between the previous closing price and the current high
Difference between the previous closing price and the current low
The Average True Range is then formulated by adding smoothing to the True Range. The True Range can
be smoothed using a variety of techniques to create the final Average True Range indicator such as
Wilders' Smoothing function or a simple moving average (which are the two most common smoothing
methods used).
© 2011 Visual Trading Systems, LLC
418
VT Trader 2.0 Help Manual
Interpretation
Wilder stated that high ATR values often indicated market bottoms after a sell-off, while low ATR values
typically indicated extended periods of sideways price movement (such as those found at tops and after
consolidation periods). The Average True Range can be interpreted using the same techniques that are
used with the other volatility indicators.
Construction
1. Click the Ribbon>Technical Analysis menu>Indicators group>Indicator Builder command>
Indicator Builder window's [New] button
2. In the General tab, type the following text for each field:
Name: Average True Range (ATR)
Function Name Alias: vt_ATR
Label Mask: ATR (%tPr%,%stp%) = %_ATR%
Placement: New Frame
Data Inspection Alias: Average True Range
3. In the Input Variable(s) tab, create the following variables:
[New] button...
Name: tPr
Display Name: Periods
© 2011 Visual Trading Systems, LLC
Technical Indicators
419
Type: integer
Default: 14
[New] button...
Name: stp
Display Name: Smoothing Type
Type: Enumeration
Default: click [...] button, [New] button, then create the following
entries:
Wilders
Simple_Moving_Average
... then, click [OK] button
Default: Wilders
4. In the Output Variable(s) tab, create the following variables:
[New] button...
Var Name: _ATR
Name: (ATR)
Line Color: dark green
Line Width: thin
Line Type: solid
5. In the Horizontal Line tab, create the following variables:
This indicator requires no horizontal levels.
6. In the Formula tab, copy and paste the following formula:
TH:= if(Ref(C,-1) > H,Ref(C,-1),H);
TL:= if(Ref(C,-1) < L,Ref(C,-1),L);
TR:= TH-TL;
_ATR:= if(stp=0, Wilders(TR,tPr), mov(TR,tPr,S));
7. Click the "Save" icon to finish building the Average True Range (ATR) indicator.
6.6
Balance of Power
Overview
The Balance of Power (BOP) indicator was described by Igor Livshin in the August 2001 edition of
Technical Analysis of Stocks and Commodities magazine. Livshin explains that, "The balance of power
(BOP) indicator measures the strength of the bulls vs. bears by assessing the ability of each to push
price to an extreme level." The Balance of Power indicator is calculated by the formula:
BOP = (Close price – Open price) / (High price – Low price)
© 2011 Visual Trading Systems, LLC
420
VT Trader 2.0 Help Manual
The resulting Balance of Power value is then typically smoothed by a moving average.
Interpretation
There are three basic techniques for using the Balance of Power indicator to generate trading signals.
Trend Direction: When the BOP is rising, prices are in an upwards trend. When the BOP is declining,
prices are in a downwards trend. BOP / Zero crossovers may also be useful. When the BOP crosses
above zero a buy signal is given. Alternatively, when the BOP crosses below zero a sell signal is given.
Divergence: Looking for divergences between the BOP and price can prove to be very effective in
identifying potential reversal and/or trend continuation points in price movement. There are several types
of divergences:
Classic Divergence (aka: Regular Divergence)
Bullish Divergence = Lower lows in price and higher lows in the BOP
Bearish Divergence = Higher highs in price and lower highs in the BOP
Hidden Divergence (aka: Reverse, Continuation, Trend Divergence)
Bullish Divergence = Lower lows in BOP and higher lows in price
Bearish Divergence = Higher highs in BOP and lower highs in price
Overbought/Oversold Conditions: The BOP can be used to identify potential overbought and oversold
conditions in price movements thereby providing an early warning for potential trend reversals. These
conditions are generated by observing where the BOP clusters its tops and bottoms and setting its
© 2011 Visual Trading Systems, LLC
Technical Indicators
421
overbought and oversold levels around those values.
Construction
1. Click the Ribbon>Technical Analysis menu>Indicators group>Indicator Builder command>
Indicator Builder window's [New] button
2. In the General tab, type the following text for each field:
Name: Balance of Power
Function Name Alias: vt_BOP
Label Mask: Balance of Power (%SmPer%,%SmType%) = %BOP%
Placement: New Frame
Data Inspection Alias: Balance of Power
3. In the Input Variable(s) tab, create the following variables:
[New] button...
Name: SmPer
Display Name: Smoothing Periods
Type: integer (with bounds)
Default: 14
Min. Bounds: 1
Max. Bounds: 9999
[New] button...
Name: SmType
Display Name: Smoothing Type
Type: MA type
Default: Exponential
4. In the Output Variable(s) tab, create the following variables:
[New] button...
Var Name: BOP
Name: (BOP)
Line Color: black
Line Width: thin
Line Type: histogram
5. In the Horizontal Line tab, create the following variables:
[New] button...
Value: +0.0000
Color: black
Width: thin
Type: dashed
6. In the Formula tab, copy and paste the following formula:
BOP:= Mov((C-O)/(H-L),SmPer,SmType);
© 2011 Visual Trading Systems, LLC
422
VT Trader 2.0 Help Manual
7. Click the "Save" icon to finish building the Balance of Power indicator.
6.7
Bollinger Bands
Overview
Bollinger Bands were developed by John Bollinger and introduced in the late 1980's. Bollinger Bands
serve these primary functions:
To provide a relative definition of high and low
To identify periods of high and low volatility
To identify periods when prices are at extreme levels
They do this by using standard deviation as a measure of volatility. Since standard deviation is a
measure of volatility, the bands are self-adjusting; they widen during periods of higher volatility and
contract during periods of lower volatility. Bollinger Bands consist of 3 bands designed to encompass the
majority of a trading instrument's price action. The middle band is a basis for the intermediate-term
trend, typically a 20-periods simple moving average, which also serves as the base for the upper and
lower bands. The upper band's and lower band's distance from the middle band is determined by
volatility. Typically, the upper band is plotted +2 standard deviations above the middle band while the
lower band is plotted -2 standard deviations below the middle band.
© 2011 Visual Trading Systems, LLC
Technical Indicators
423
Interpretation
Bollinger Bands are usually calculated using the trading instrument's prices, but they can also be
calculated using other indicators as their base. These comments refer to bands based on prices. Mr.
Bollinger notes the following characteristics of Bollinger Bands.
Sharp price changes tend to occur after the bands tighten as volatility lessens (a.k.a. "the
Squeeze")
When prices move outside the bands a continuation of the current trend is implied
Bottoms and tops made outside the bands followed by bottoms and tops made inside the
bands call for reversals in the trend
A move that originates at one band tends to go all the way to the other band
Construction
1. Click the Ribbon>Technical Analysis menu>Indicators group>Indicator Builder command>
Indicator Builder window's [New] button
2. In the General tab, type the following text for each field:
Name: Bollinger Bands
Function Name Alias: vt_BBands
Label Mask:
Bollinger Bands (%Pr%,%tPr%,%ma%,%D%)
MB = %MB%, UB = %UB%, LB = %LB%
Placement: Price Frame
Data Inspection Alias: Bollinger Bands
3. In the Input Variable(s) tab, create the following variables:
[New] button...
Name: Pr
Display Name: Price
Type: price
Default: Close
[New] button...
Name: tPr
Display Name: Periods
Type: integer
Default: 20
[New] button...
Name: ma
Display Name: MA Type
Type: MA Type
Default: Simple
[New] button...
Name: D
© 2011 Visual Trading Systems, LLC
424
VT Trader 2.0 Help Manual
Display Name: Standard Deviations
Type: float
Default: 2.0000
4. In the Output Variable(s) tab, create the following variables:
[New] button...
Var Name: MB
Name: (Middle Band)
Line Color: dark green
Line Width: thin
Line Type: dashed
[New] button...
Var Name: UB
Name: (Upper Band)
Line Color: dark green
Line Width: thin
Line Type: solid
[New] button...
Var Name: LB
Name: (Lower Band)
Line Color: dark green
Line Width: thin
Line Type: solid
5. In the Horizontal Line tab, create the following variables:
This indicator requires no horizontal levels.
6. In the Formula tab, copy and paste the following formula:
MB:= Mov(Pr,tPr,ma);
UB:= BLines(Pr,mov(Pr,tPr,ma),tPr,D,0);
LB:= BLines(Pr,mov(Pr,tPr,ma),tPr,D,1);
7. Click the "Save" icon to finish building the Bollinger Bands indicator.
6.8
Bollinger Bands - Fibonacci Ratios
Overview
The Fibonacci Bollinger Bands indicator is based on the same principles as the standard Bollinger
Bands indicator developed by John Bollinger. The Fibonacci Bollinger Bands indicator bases its upper
and lower bands on volatility just like the Bollinger Bands indicator does, but instead of using standard
deviation as the measure of volatility, a Wilders Smoothed ATR is used in its place.
© 2011 Visual Trading Systems, LLC
Technical Indicators
425
The middle band is a moving average used to establish the intermediate-term trend. The 3 upper bands
are constructed by using the Wilders Smoothed ATR and multiplying it by each of the Fibonacci factors
(1.6180, 2.6180, and 4.2360) and then adding the results to the middle band. The 3 lower bands are
constructed in the same manner as the upper bands except their results are subtracted from the middle
band.
Interpretation
The Fibonacci Bollinger Bands indicator may provide good clues to price reversals when used in
conjunction with other technical analysis methods or indicators.
Construction
1. Click the Ribbon>Technical Analysis menu>Indicators group>Indicator Builder command>
Indicator Builder window's [New] button
2. In the General tab, type the following text for each field:
Name: Bollinger Bands - Fibonacci Ratios
Function Name Alias: vt_BBandsFibs
Label Mask:
Bollinger Bands - Fibonacci (%pr%,%periods%,%mat%,%factor1%,%
factor2%,%factor3%)
MB = %MidPoint%, UB1 = %UpperBand1%, UB2 = %UpperBand2%, UB3 = %
UpperBand3%
© 2011 Visual Trading Systems, LLC
426
VT Trader 2.0 Help Manual
LB1 = %LowerBand1%, LB2 = %LowerBand2%, LB3 = %LowerBand3%
Placement: Price Frame
Data Inspection Alias: Bollinger Bands - Fibonacci
3. In the Input Variable(s) tab, create the following variables:
[New] button...
Name: Pr
Display Name: Price
Type: price
Default: Close
[New] button...
Name: Periods
Display Name: Periods
Type: integer
Default: 20
[New] button...
Name: mat
Display Name: MA Type
Type: MA Type
Default: Simple
[New] button...
Name: Factor1
Display Name: Fibonacci Ratio 1
Type: float (with bounds)
Default: 1.6180
Max Bounds: 1.0000
Min Bounds: 13.0000
[New] button...
Name: Factor1
Display Name: Fibonacci Ratio 2
Type: float (with bounds)
Default: 2.6180
Max Bounds: 1.0000
Min Bounds: 13.0000
[New] button...
Name: Factor1
Display Name: Fibonacci Ratio 3
Type: float (with bounds)
Default: 4.2360
Max Bounds: 1.0000
Min Bounds: 13.0000
4. In the Output Variable(s) tab, create the following variables:
[New] button...
Var Name: UpperBand3
Name: (Upper Band 3)
© 2011 Visual Trading Systems, LLC
Technical Indicators
Line Color: dark green
Line Width: slightly thicker
Line Type: solid
[New] button...
Var Name: UpperBand2
Name: (Upper Band 2)
Line Color: green
Line Width: thin
Line Type: solid
[New] button...
Var Name: UpperBand1
Name: (Upper Band 1)
Line Color: light green
Line Width: thin
Line Type: dashed
[New] button...
Var Name: MidPoint
Name: (Middle Band)
Line Color: blue
Line Width: thin
Line Type: solid
[New] button...
Var Name: LowerBand3
Name: (Lower Band 3)
Line Color: dark green
Line Width: slightly thicker
Line Type: solid
[New] button...
Var Name: LowerBand2
Name: (Lower Band 2)
Line Color: green
Line Width: thin
Line Type: solid
[New] button...
Var Name: LowerBand1
Name: (Lower Band 1)
Line Color: light green
Line Width: thin
Line Type: dashed
5. In the Horizontal Line tab, create the following variables:
This indicator requires no horizontal levels.
6. In the Formula tab, copy and paste the following formula:
TH:=If(Ref(C,-1) > H,Ref(C,-1),H);
© 2011 Visual Trading Systems, LLC
427
428
VT Trader 2.0 Help Manual
TL:=If(Ref(C,-1) < L,Ref(C,-1),L);
TR:=TH-TL;
TRA:= Wilders(TR,Periods);
MidPoint:= Mov(pr,Periods,mat);
UpperBand3:= MidPoint + (factor3 * TRa);
UpperBand2:= MidPoint + (factor2 * TRa);
UpperBand1:= MidPoint + (factor1 * TRa);
LowerBand1:= MidPoint - (factor1 * TRa);
LowerBand2:= MidPoint - (factor2 * TRa);
LowerBand3:= MidPoint - (factor3 * TRa);
7. Click the "Save" icon to finish building the Fibonacci Bollinger Bands indicator.
6.9
Bollinger Bandwidth
Overview
Bollinger Bandwidth is an important indicator derived from John Bollinger's original Bollinger Bands
indicator. Bandwidth is a relative measure of the width of the Bollinger Bands.
The Bollinger Bandwidth equation can be constructed as:
Bandwidth = (Bollinger Upper Band - Bollinger Lower Band) / Bollinger Middle Band
Volatility is high when the Bollinger Bands are farther apart and low when the Bollinger Bands are closer
together. Based on the assumption that price (and volatility) generally operates in cycles - periods of low
volatility inevitably followed by periods of high volatility and so on and so forth - traders can learn to take
advantage of these cycles.
© 2011 Visual Trading Systems, LLC
Technical Indicators
429
Interpretation
The Bollinger Bandwidth is particularly useful in helping traders identify "the Squeeze". Bollinger states
that Bollinger Bands "are driven by volatility, and the Squeeze is a pure reflection of that volatility". The
Squeeze is similar to "the calm before the storm". The Squeeze is identified when the Bandwidth is at
its lowest low value within n-periods.
Trading signals can be generated based on the breakout of price (and volatility) following the Squeeze.
The most difficult part of trading breakout signals is determining the direction of the price breakout.
Bollinger suggests using other indicators like the Relative Strength Index (RSI) and a volume-based
indicator such as Accumulation/Distribution for confirmation combined with the Squeeze setup.
Bollinger also suggests looking for positive and negative divergence between indicators and price as an
indication of the potential breakout direction. Positive divergence (indicators rising while price is declining
or remaining neutral) is often considered a bullish sign while negative divergence (indicators declining
while price is rising) is considered a bearish sign.
Lastly, traders should be on the lookout for "false breakouts" (a.k.a. "Head Fakes" by Bollinger). Price
often breaks out in one direction immediately following the Squeeze causing many traders to think the
breakout will continue in that direction, only to quickly reverse and make the true, more significant
breakout in the opposite direction. Traders acting quickly on the initial breakout (and perhaps without
confirmation from other indicators) often get caught on the wrong side of the price action, while those
traders expecting a "false breakout" can quickly close out their original position (if they have one open)
and enter a trade in the direction of the reversal.
© 2011 Visual Trading Systems, LLC
430
VT Trader 2.0 Help Manual
Implementation
Reference lines for “The Bulge” (blue line - the highest Bandwidth value within the previous n-periods) and
“The Squeeze” (red line - lowest Bandwidth value within the previous n-periods) have been included.
Construction
1. Click the Ribbon>Technical Analysis menu>Indicators group>Indicator Builder command>
Indicator Builder window's [New] button
2. In the General tab, type the following text for each field:
Name: Bollinger Bandwidth
Function Name Alias: vt_Bandwidth
Label Mask:
Bollinger Bandwidth (%Pr%,%tPr%,%ma%,%D%,%bulgeper%,%squeezeper%)
Bw = %Bandwidth%, Bulge = %Bulge%, Squeeze = %Squeeze%
Placement: New Frame
Data Inspection Alias: Bollinger Bandwidth
3. In the Input Variable(s) tab, create the following variables:
[New] button...
Name: Pr
Display Name: Bollinger Bands Price
Type: price
Default: Close
[New] button...
Name: tPr
Display Name: Bollinger Bands Periods
Type: integer
Default: 20
[New] button...
Name: ma
Display Name: Bollinger Bands MA Type
Type: MA Type
Default: Simple
[New] button...
Name: D
Display Name: Bollinger Bands Standard Deviations
Type: float
Default: 2.0000
[New] button...
Name: bulgeper
Display Name: Bandwidth Bulge Periods
Type: Integer
© 2011 Visual Trading Systems, LLC
Technical Indicators
Default: 150
[New] button...
Name: squeezeper
Display Name: Bandwidth Squeeze Periods
Type: Interger
Default: 150
4. In the Output Variable(s) tab, create the following variables:
[New] button...
Var Name: Bandwidth
Name: (Bandwidth)
Line Color: purple
Line Width: thin
Line Type: solid
[New] button...
Var Name: Bulge
Name: (The Bulge)
Line Color: blue
Line Width: thin
Line Type: dashed
[New] button...
Var Name: Squeeze
Name: (The Squeeze)
Line Color: red
Line Width: thin
Line Type: dashed
5. In the Horizontal Line tab, create the following variables:
This indicator requires no horizontal levels.
6. In the Formula tab, copy and paste the following formula:
MB:= Mov(Pr,tPr,ma);
UB:= BLines(Pr,mov(Pr,tPr,ma),tPr,D,0);
LB:= BLines(Pr,mov(Pr,tPr,ma),tPr,D,1);
Bandwidth:= (UB-LB)/MB;
Bulge:= hhv(Bandwidth,bulgeper);
Squeeze:= llv(Bandwidth,squeezeper);
7. Click the "Save" icon to finish building the Bollinger Bandwidth indicator.
© 2011 Visual Trading Systems, LLC
431
432
6.10
VT Trader 2.0 Help Manual
Bollinger Percent B (%b)
Overview
Bollinger Percent B (%b) is an important indicator derived from John Bollinger's original Bollinger Bands
indicator. %b depicts the location of the most recent close price in relation to the Bollinger Bands as
well as to what degree it is above or below any of the bands.
The Bollinger Percent B equation can be constructed as:
Percent B = ((Close - Bollinger Lower Band) / (Bollinger Upper Band - Bollinger Lower Band))*100
Interpretation
If the close price is equal to the upper Bollinger Band, %b will be 100 (percent). If the close price is
equal to the lower Bollinger Band, %b will be 0.0. A %b value of 50 means the close price is equal to the
middle Bollinger Band.
Furthermore, readings above 100 and below 0 indicate that the close price is outside of the Bollinger
Bands by a corresponding percentage or the Bollinger Bandwidth. A %b value of 125 means that the
close price is above the upper Bollinger Band by 25% of the Bandwidth while a %b value of -25 means
that the close price is below the lower Bollinger Band by 25% of the Bandwidth.
Construction
© 2011 Visual Trading Systems, LLC
Technical Indicators
433
1. Click the Ribbon>Technical Analysis menu>Indicators group>Indicator Builder command>
Indicator Builder window's [New] button
2. In the General tab, type the following text for each field:
Name: Bollinger Percent B (%b)
Function Name Alias: vt_PercentB
Label Mask: Bollinger %%b (%Pr%,%tPr%,%ma%,%D%) = %B%
Placement: New Frame
Data Inspection Alias: Bollinger %b
3. In the Input Variable(s) tab, create the following variables:
[New] button...
Name: Pr
Display Name: Bollinger Bands Price
Type: price
Default: Close
[New] button...
Name: tPr
Display Name: Bollinger Bands Periods
Type: integer
Default: 20
[New] button...
Name: ma
Display Name: Bollinger Bands MA Type
Type: MA Type
Default: Simple
[New] button...
Name: D
Display Name: Bollinger Bands Standard Deviations
Type: float
Default: 2.0000
4. In the Output Variable(s) tab, create the following variables:
[New] button...
Var Name: B
Name: (%b)
Line Color: dark green
Line Width: thin
Line Type: histogram
5. In the Horizontal Line tab, create the following lines:
[New] button...
Value: +100.0000
Color: red
© 2011 Visual Trading Systems, LLC
434
VT Trader 2.0 Help Manual
Width: thin
Type: dashed
[New] button...
Value: +50.0000
Color: red
Width: thin
Type: dashed
[New] button...
Value: +0.0000
Color: black
Width: thin
Type: dashed
6. In the Formula tab, copy and paste the following formula:
MB:= Mov(Pr,tPr,ma);
UB:= BLines(Pr,mov(Pr,tPr,ma),tPr,D,0);
LB:= BLines(Pr,mov(Pr,tPr,ma),tPr,D,1);
B:= ((Pr-LB)/(UB-LB))*100;
7. Click the "Save" icon to finish building the Bollinger Percent B indicator.
6.11
Chaikin's Volatility
Overview
Developed by Marc Chaikin, the Chaikin Volatility indicator quantifies volatility as the widening of the
range between high and low prices by comparing the spread between the instrument's high and low
prices over n-periods. Chaikin's Volatility indicator is created by first calculating an exponential moving
average of the difference between the High and Low price for each period over n-periods (typically 10
periods) and then by calculating the percentage change in the exponential moving average over n-periods
(also typically 10 periods).
© 2011 Visual Trading Systems, LLC
Technical Indicators
435
Interpretation
There are two basic methods to interpret Chaikin's measure of volatility.
Method 1: Assume that market tops are generally accompanied by increased volatility while the late
stages of market bottoms are generally accompanied by decreased volatility.
Method 2: Assume that a shorter term increase in the Volatility indicator indicates an approaching
market bottom while a longer term decrease in the volatility indicator indicates an approaching market
top.
Construction
1. Click the Ribbon>Technical Analysis menu>Indicators group>Indicator Builder command>
Indicator Builder window's [New] button
2. In the General tab, type the following text for each field:
Name: Chaikin's Volatility
Function Name Alias: vt_CVOL
Label Mask: Chaikin's Volatility (%hlper%,%rocper%) = %CVOL%
Placement: New Frame
Data Inspection Alias: Chaikin's Volatility
3. In the Input Variable(s) tab, create the following variables:
© 2011 Visual Trading Systems, LLC
436
VT Trader 2.0 Help Manual
[New] button...
Name: hlper
Display Name: High-Low Average Periods
Type: integer
Default: 10
[New] button...
Name: rocper
Display Name: Rate of Change Periods
Type: integer
Default: 10
4. In the Output Variable(s) tab, create the following variables:
[New] button...
Var Name: CVOL
Name: (Volatility)
Line Color: purple
Line Width: thin
Line Type: solid
5. In the Horizontal Line tab, create the following lines:
[New] button...
Value: +0.0000
Color: black
Width: thin
Type: dashed
6. In the Formula tab, copy and paste the following formula:
HLAverage:= Mov((H-L),hlper,E);
HLAverageChange:= Ref(HLAverage,-rocper);
CVOL:= ((HLAverage - HLAverageChange) / HLAverageChange) * 100;
7. Click the "Save" icon to finish building Chaikin's Volatility indicator.
6.12
Chande's Dynamic Momentum Index
Overview
The Dynamic Momentum Index (DMI) was developed by Tushar Chande and Stanley Kroll. The indicator
is described in detail in their book "The New Technical Trader".
© 2011 Visual Trading Systems, LLC
Technical Indicators
437
Interpretation
Chande's DMI is very similar to Welles Wilder’s Relative Strength Index (RSI), however, there is one very
important difference. Unlike the RSI which uses a fixed number of periods, the Dynamic Momentum
Index uses a variable amount of periods as market volatility changes. The number of periods the DMI
uses decreases as market volatility increases thereby allowing the indicator to be more responsive to
price changes.
The Dynamic Momentum Index can be interpreted in much the same way was as the more traditional
RSI as an overbought and oversold indicator. Readings above 70 are considered to be overbought while
readings under 30 are considered to be oversold.
Implementation
The DMI indicator has 2 indicator plots available. The default data plot is the Dynamic Momentum Index
indicator itself. The secondary data plot is the dynamic periods. The dynamic periods data plot shows
what periods length is being used for any given bar loaded in the chart.
Construction
1. Click the Ribbon>Technical Analysis menu>Indicators group>Indicator Builder command>
Indicator Builder window's [New] button
© 2011 Visual Trading Systems, LLC
438
VT Trader 2.0 Help Manual
2. In the General tab, type the following text for each field:
Name: Chande's Dynamic Momentum Index
Function Name Alias: vt_ChandeDMI
Label Mask:
Chande's DMI (%price%,%stdevPeriods%,%stdevmaper%,%stdevmat%,%
DmiPeriods%,%DmiLowerLimit%/%DmiUpperLimit%)
%plot% = %IndicatorPlot%
Placement: New Frame
Data Inspection Alias: Chande's DMI
3. In the Input Variable(s) tab, create the following variables:
[New] button...
Name: Price
Display Name: Price
Type: price
Default: Close
[New] button...
Name: stdevPeriods
Display Name: Standard Deviation Periods
Type: integer
Default: 5
[New] button...
Name: stdevmaper
Display Name: MA of Standard Deviation Periods
Type: integer
Default: 10
[New] button...
Name: stdevmat
Display Name: MA of Standard Deviation Type
Type: MA Type
Default: Simple
[New] button...
Name: DmiPeriods
Display Name: Dynamic Momentum Index Periods
Type: integer
Default: 14
[New] button...
Name: DmiLowerLimit
Display Name: Dynamic Periods Lower Bounds
Type: integer
Default: 3
[New] button...
Name: DmiUpperLimit
Display Name: Dynamic Periods Upper Bounds
Type: integer
© 2011 Visual Trading Systems, LLC
Technical Indicators
439
Default: 30
[New] button...
Name: plot
Display Name: Display DMI or Periods Length
Type: Enumeration
Default: click [...] button, [New] button, then create the following
entries:
Dynamic_Momentum_Index
Dynamic_Periods_Length
... then, click [OK] button
Default: Dynamic_Momentum_Index
4. In the Output Variable(s) tab, create the following variables:
[New] button...
Var Name: IndicatorPlot
Name: (DMI)
Line Color: blue
Line Width: slightly thicker
Line Type: solid line
5. In the Horizontal Line tab, create the following lines:
[New] button...
Value: +70.0000
Color: red
Width: thin
Type: dashed
[New] button...
Value: +50.0000
Color: gray
Width: thin
Type: dashed
[New] button...
Value: +30.0000
Color: red
Width: thin
Type: dashed
6. In the Formula tab, copy and paste the following formula:
Vi:= Stdev(price,stdevPeriods) / Mov(Stdev(price,stdevPeriods),
stdevmaper,stdevmat);
Td:= Int(DmiPeriods/Vi);
Td:= if(Td>DmiUpperLimit,DmiUpperLimit,if(Td<DmiLowerLimit,
DmiLowerLimit,Td));
rsi_r:= (price - ref(price,-1));
rsi_rs:= Wilders(if(rsi_r>0,rsi_r,0),Td) / Wilders(if(rsi_r<0,Abs
(rsi_r),0),Td);
© 2011 Visual Trading Systems, LLC
440
VT Trader 2.0 Help Manual
DMIndex:= 100-(100/(1+rsi_rs));
IndicatorPlot:= if(plot=0,DMIndex,Td);
7. Click the "Save" icon to finish building Chande's DMI indicator.
6.13
Chande's Momentum Oscillator (CMO)
Overview
The Chande Momentum Oscillator (CMO) was developed by Tushar Chande and explained in the book
"The New Technical Trader" by Tushar Chande and Stanley Kroll. The CMO was designed to calculate
what Chande refers to as “pure momentum”. The CMO is similar to, yet unique from, other momentumoriented indicators such as the RSI, Stochastic, and Rate-of-Change.
The CMO uses data for both up days and down days in the numerator, thereby directly measuring
momentum. The calculations are performed on unsmoothed data. This allows for short-term extreme
movements to be less hidden. However, smoothing can be applied to the CMO if desired. The scale is
bound between +100 and -100 thus allowing the user to clearly see changes in net momentum using the
0 level as a balance point.
Interpretation
© 2011 Visual Trading Systems, LLC
Technical Indicators
441
The Chande Momentum Oscillator can be used to measure several conditions:
Identifying Overbought/oversold Conditions: Looking for extreme overbought or oversold conditions is the
primary method of interpreting the CMO. As a general rule, Mr. Chande quantifies an overbought level
at +50 and the oversold level at -50. At +50, up-day momentum is three times the down-day momentum;
At -50, down-day momentum is three times the up-day momentum. These levels essentially correspond
to the common 70/30 levels used with the RSI indicator.
Using a CMO Trigger Line: Trade entry and exit rules can be created by plotting a moving average of the
CMO as a "trigger" line. For example, using the default 20-period CMO, a 9-period moving average may
serve as a good trigger line. Buy when the CMO crosses above the 9-period trigger line; sell when it
crosses below it.
Trendiness: The CMO can also be used to measure the degree of trendiness an instrument exhibits.
Higher CMO values correspond to betting trendiness while lower values of CMO indicate a possible
trading range.
Divergence: Although not specifically mentioned in Chande’s book, looking for divergence between the
CMO and the instrument's price may also be a viable strategy as it often is with other similar
momentum-oriented indicators.
Construction
1. Click the Ribbon>Technical Analysis menu>Indicators group>Indicator Builder command>
Indicator Builder window's [New] button
2. In the General tab, type the following text for each field:
Name: Chande's Momentum Oscillator
Function Name Alias: vt_CMO
Label Mask: Chande's Momentum Osc. (%Price%,%Periods%) = %ChMomOcs%
Placement: New Frame
Data Inspection Alias: Chande's Momentum Osc.
3. In the Input Variable(s) tab, create the following variables:
[New] button...
Name: Price
Display Name: Price
Type: price
Default: close
[New] button...
Name: Periods
Display Name: Periods
Type: integer
Default: 14
4. In the Output Variable(s) tab, create the following variables:
© 2011 Visual Trading Systems, LLC
442
VT Trader 2.0 Help Manual
[New] button...
Var Name: ChMomOcs
Name: (CMO)
Line Color: dark blue
Line Width: thin
Line Type: solid
5. In the Horizontal Line tab, create the following lines:
[New] button...
Value: +50.0000
Color: red
Width: thin
Type: dashed
[New] button...
Value: +0.0000
Color: black
Width: thin
Type: dashed
[New] button...
Value: -50.0000
Color: red
Width: thin
Type: dashed
6. In the Formula tab, copy and paste the following formula:
UpDay:= Sum((Price-Ref(Price,-1))*(Price>Ref(Price,-1)),Periods);
DownDay:= Sum((Ref(Price,-1)-Price)*(Price<Ref(Price,-1)),Periods);
ChMomOcs:= 100 * ((UpDay-DownDay)/(UpDay+DownDay));
7. Click the "Save" icon to finish building Chandes' Momentum Oscillator indicator.
6.14
Chande's QStick
Overview
The Chande QStick was developed by Tushar Chande to help identify market trends. It is a moving
average of the difference between the opening and closing prices.
© 2011 Visual Trading Systems, LLC
Technical Indicators
443
Interpretation
Signals can be generated by identifying peaks and troughs, zero line crossings, and/or divergences
between the QStick and the instrument's price.
Implementation
The indicator is shown as a bi-color histogram to make identifying peaks, troughs, and zero line
crossings easier.
Construction
1. Click the Ribbon>Technical Analysis menu>Indicators group>Indicator Builder command>
Indicator Builder window's [New] button
2. In the General tab, type the following text for each field:
Name: Chande's QStick
Function Name Alias: vt_ChandeQS
Label Mask:
Chande's QStick (%periods%,%mat%)
Up = %CQS_Up%, Down = %CQS_Down%
Placement: New Frame
© 2011 Visual Trading Systems, LLC
444
VT Trader 2.0 Help Manual
Data Inspection Alias: Chande's QStick
3. In the Input Variable(s) tab, create the following variables:
[New] button...
Name: periods
Display Name: QStick Periods
Type: integer
Default: 8
[New] button...
Name: mat
Display Name: QStick Type
Type: MA Type
Default: Simple
4. In the Output Variable(s) tab, create the following variables:
[New] button...
Var Name: CQS_Up
Name: (CQS-Up)
Line Color: green
Line Width: thin
Line Type: histogram
[New] button...
Var Name: CQS_Down
Name: (CQS-Down)
Line Color: red
Line Width: thin
Line Type: histogram
5. In the Horizontal Line tab, create the following lines:
[New] button...
Value: +0.0000
Color: black
Width: thin
Type: dashed
6. In the Formula tab, copy and paste the following formula:
CQS:= mov((C-O),periods,mat);
CQS_Up:= if(CQS>ref(CQS,-1),CQS,CQS);
CQS_Down:= if(CQS<ref(CQS,-1),CQS,null);
7. Click the "Save" icon to finish building Chande's QStick indicator.
© 2011 Visual Trading Systems, LLC
Technical Indicators
6.15
445
Chande's Range Action Verification Index (RAVI)
Overview
Developed by Tushar Chande, The Range Action Verification Index (RAVI) indicator is used to help
identify whether the market is trending (similar to the ADX).
Interpretation
If the RAVI is over 3% the market is said to be trending.
Construction
1. Click the Ribbon>Technical Analysis menu>Indicators group>Indicator Builder command>
Indicator Builder window's [New] button
2. In the General tab, type the following text for each field:
Name: Chande's Range Action Verification Index
Function Name Alias: vt_RAVI
Label Mask: Chande's RAVI (%pr%,%ShortMA%,%LongMA%) = %RAVI%
Placement: New Frame
Data Inspection Alias: Chande's RAVI
© 2011 Visual Trading Systems, LLC
446
VT Trader 2.0 Help Manual
3. In the Input Variable(s) tab, create the following variables:
[New] button...
Name: Pr
Display Name: Price
Type: price
Default: close
[New] button...
Name: ShortMA
Display Name: Short Periods
Type: integer
Default: 7
[New] button...
Name: LongMA
Display Name: Long Periods
Type: integer
Default: 65
4. In the Output Variable(s) tab, create the following variables:
[New] button...
Var Name: RAVI
Name: (RAVI)
Line Color: dark green
Line Width: slightly thicker
Line Type: solid
5. In the Horizontal Line tab, create the following lines:
[New] button...
Value: +3.0000
Color: red
Width: thin
Type: dashed
6. In the Formula tab, copy and paste the following formula:
RAVI:= abs(1000*(mov(pr,ShortMA,S)-mov(pr,LongMA,S))/mov(pr,LongMA,S));
7. Click the "Save" icon to finish building Chande's RAVI indicator.
6.16
Chande's TrendScore
Overview
© 2011 Visual Trading Systems, LLC
Technical Indicators
447
Chande's Trendscore indicator was described by Tushar Chande in the September 1993 edition of Stock
& Commodities magazine. The TrendScore attempts to make a quantitative and qualitative determination
of the direction and strength of a market trend by comparing the current close price to previous close
prices over the last 20 periods.
Interpretation
The TrendScore indicator oscillates between +10 and -10. A +10 reading indicates a strong uptrend is
underway. A -10 reading indicates a strong downtrend is underway. Readings above 0 suggest an
upward trend of varying strength and readings below 0 suggest a downward trend of varying strength.
Construction
1. Click the Ribbon>Technical Analysis menu>Indicators group>Indicator Builder command>
Indicator Builder window's [New] button
2. In the General tab, type the following text for each field:
Name: Chande's TrendScore
Function Name Alias: vt_ChandeTS
Label Mask: Chande's TrendScore (%price%) = %TrendScore%
Placement: New Frame
Data Inspection Alias: Chande's TrendScore
© 2011 Visual Trading Systems, LLC
448
VT Trader 2.0 Help Manual
3. In the Input Variable(s) tab, create the following variables:
[New] button...
Name: Price
Display Name: Price
Type: price
Default: close
4. In the Output Variable(s) tab, create the following variables:
[New] button...
Var Name: TrendScore
Name: (TrendScore)
Line Color: dark green
Line Width: slightly thicker
Line Type: solid
5. In the Horizontal Line tab, create the following lines:
[New] button...
Value: +0.0000
Color: black
Width: thin
Type: dashed
6. In the Formula tab, copy and paste the following formula:
TrendScore:= If(price>=Ref(price,-11),1,-1)
12),1,-1) +
If(price>=Ref(price,-13),1,-1)
14),1,-1) +
If(price>=Ref(price,-15),1,-1)
16),1,-1) +
If(price>=Ref(price,-17),1,-1)
18),1,-1) +
If(price>=Ref(price,-19),1,-1)
20),1,-1);
+ If(price>=Ref(price,+ If(price>=Ref(price,+ If(price>=Ref(price,+ If(price>=Ref(price,+ If(price>=Ref(price,-
7. Click the "Save" icon to finish building Chande's TrendScore indicator.
6.17
Chande's Variable Index Dynamic Average (VIDYA)
Overview
Developed by Tushar Chande, the Variable Index Dynamic Average (VIDYA) indicator was described in
the March 1992 edition of Stock & Commodities magazine. Chande's VIDYA is a moving average that
automatically adjusts its speed based on market volatility. The absolute value of a 9-period Chande
Momentum Oscillator is used for the volatility index.
© 2011 Visual Trading Systems, LLC
Technical Indicators
449
Interpretation
Chande's VIDYA can be used in place of traditional moving averages. Please refer to the "Moving
Average" indicator for additional details.
Construction
1. Click the Ribbon>Technical Analysis menu>Indicators group>Indicator Builder command>
Indicator Builder window's [New] button
2. In the General tab, type the following text for each field:
Name: Chande's Variable Index Dynamic Average (VIDYA)
Function Name Alias: vt_VIDYA
Label Mask: Chande's VIDYA (%Price%, %Periods%,%pds%) = %Vidya%
Placement: Price Frame
Data Inspection Alias: Chande's VIDYA
3. In the Input Variable(s) tab, create the following variables:
[New] button...
Name: Price
Display Name: Price
Type: price
© 2011 Visual Trading Systems, LLC
450
VT Trader 2.0 Help Manual
Default: Close
[New] button...
Name: Periods
Display Name: CMO Periods
Type: integer (with bounds)
Default: 9
Min Bounds: 3
Max Bounds: 9999
[New] button...
Name: pds
Display Name: VIDYA Periods
Type: integer (with bounds)
Default: 20
Min Bounds: 1
Max Bounds: 9999
4. In the Output Variable(s) tab, create the following variables:
[New] button...
Var Name: Vidya
Name: (VIDYA)
Line Color: blue
Line Width: thin
Line Type: solid
5. In the Horizontal Line tab, create the following variables:
This indicator requires no horizontal levels.
6. In the Formula tab, copy and paste the following formula:
UpDay:= Sum((Price-Ref(Price,-1))*(Price>Ref(Price,-1)),Periods);
DownDay:= Sum((Ref(Price,-1)-Price)*(Price<Ref(Price,-1)),Periods);
_CMO:= 100 * ((UpDay-DownDay)/(UpDay+DownDay));
SC:= 2/(pds+1);
absCMO:= abs(_CMO)/100;
Vidya:= If(BarCount()<=(pds+1), Price, (SC*AbsCMO*Price) + (1(SC*AbsCMO)) * PREV(Price));
7. Click the "Save" icon to finish building Chande's VIDYA indicator.
6.18
Chaos Accelerator Oscillator
Overview
© 2011 Visual Trading Systems, LLC
Technical Indicators
451
The Chaos Accelerator/Decelerator Oscillator is discussed by Bill M. Williams, PhD in his "Trading
Chaos" book(s).
Interpretation
Bill Williams' "Trading Chaos" book(s) describe some basic (and advanced) concepts for trading using
the Chaos Accelerator Oscillator as part of a larger, more inclusive Chaos-based trading methodology.
For a full, detailed description of Bill Williams' Chaos trading methods, please refer to:
"Trading Chaos: Applying Expert Techniques to Maximize Your Profits" by Bill M. Williams, PhD (1995)
"New Trading Dimensions: How to Profit from Chaos in Stocks, Bonds, and Commodities" by Bill M.
Williams, PhD (1998)
"Trading Chaos: Maximize Profits with Proven Technical Techniques" by Bill M. Williams, PhD (2004)
Construction
1. Click the Ribbon>Technical Analysis menu>Indicators group>Indicator Builder command>
Indicator Builder window's [New] button
2. In the General tab, type the following text for each field:
© 2011 Visual Trading Systems, LLC
452
VT Trader 2.0 Help Manual
Name: Chaos Accelerator Oscillator
Function Name Alias: vt_ChaosAC
Label Mask: Chaos AC (%Prc%,%ShortMAPer%,%LongMAPer%,%SignalMAPer%) = %
ACGreen%
Placement: New Frame
Data Inspection Alias: Chaos AC
3. In the Input Variable(s) tab, create the following variables:
[New] button...
"Read Only" Enabled
Name: Prc
Display Name: Price
Type: price
Default: Median Price
[New] button...
"Read Only" Enabled
Name: ShortMAPeriods
Display Name: Short MA Periods
Type: integer
Default: 5
[New] button...
"Read Only" Enabled
Name: LongMAPeriods
Display Name: Long MA Periods
Type: integer
Default: 34
[New] button...
"Read Only" Enabled
Name: SignalMAPeriods
Display Name: Signal MA Periods
Type: integer
Default: 5
4. In the Output Variable(s) tab, create the following variables:
[New] button...
Var Name: ACGreen
Name: (AC-Green)
Line Color: dark green
Line Width: slightly thicker
Line Type: histogram
[New] button...
Var Name: ACRed
Name: (AC-Red)
Line Color: red
Line Width: slightly thicker
Line Type: histogram
© 2011 Visual Trading Systems, LLC
Technical Indicators
453
5. In the Horizontal Line tab, create the following lines:
[New] button...
Value: +0.0000
Color: black
Width: thin
Type: dashed
6. In the Formula tab, copy and paste the following formula:
AC:= Mov(Prc,5,S) - Mov(Prc,34,S) - Mov(Mov(Prc,5,S) - Mov(Prc,34,S),5,
S);
ACGreen:= If(AC>=Ref(AC,-1), AC, AC);
ACRed:= If(AC<Ref(AC,-1), AC, null);
7. Click the "Save" icon to finish building the Chaos Accelerator Oscillator indicator.
6.19
Chaos Alligator Indicator
Overview
The Chaos Alligator Indicator is discussed by Bill M. Williams, PhD in his "Trading Chaos" book(s).
© 2011 Visual Trading Systems, LLC
454
VT Trader 2.0 Help Manual
Interpretation
Bill Williams' "Trading Chaos" book(s) describe some basic (and advanced) concepts for trading using
the Chaos Alligator Indicator as part of a larger, more inclusive Chaos-based trading methodology.
For a full, detailed description of Bill Williams' Chaos trading methods, please refer to:
"Trading Chaos: Applying Expert Techniques to Maximize Your Profits" by Bill M. Williams, PhD (1995)
"New Trading Dimensions: How to Profit from Chaos in Stocks, Bonds, and Commodities" by Bill M.
Williams, PhD (1998)
"Trading Chaos: Maximize Profits with Proven Technical Techniques" by Bill M. Williams, PhD (2004)
Construction
1. Click the Ribbon>Technical Analysis menu>Indicators group>Indicator Builder command>
Indicator Builder window's [New] button
2. In the General tab, type the following text for each field:
Name: Chaos Alligator Indicator
Function Name Alias: vt_ChaosAlligator
Label Mask:
Chaos Alligator (%Prc%,%LipPer%,%TeethPer%,%JawPer%)
Lip = %Lip%, Jaw = %Jaw%, Teeth = %Teeth%
Placement: Price Frame
Data Inspection Alias: Chaos Alligator
3. In the Input Variable(s) tab, create the following variables:
[New] button...
"Read Only" Enabled
Name: Prc
Display Name: Price
Type: price
Default: Median Price
[New] button...
"Read Only" Enabled
Name: LipPer
Display Name: Lip Periods
Type: integer
Default: 5
[New] button...
"Read Only" Enabled
Name: ShLp
Display Name: Lip Horizontal Shift
© 2011 Visual Trading Systems, LLC
Technical Indicators
Type: Bars Forward
Default: 3
Min Bounds: 3
Max Bounds: 3
[New] button...
"Read Only" Enabled
Name: TeethPer
Display Name: Teeth Periods
Type: integer
Default: 8
[New] button...
"Read Only" Enabled
Name: ShTth
Display Name: Teeth Horizontal Shift
Type: Bars Forward
Default: 5
Min Bounds: 5
Max Bounds: 5
[New] button...
"Read Only" Enabled
Name: JawPer
Display Name: Jaw Periods
Type: integer
Default: 13
[New] button...
"Read Only" Enabled
Name: ShJw
Display Name: Jaw Horizontal Shift
Type: Bars Forward
Default: 8
Min Bounds: 8
Max Bounds: 8
4. In the Output Variable(s) tab, create the following variables:
[New] button...
Var Name: Lip
Name: (Lip)
Line Color: green
Line Width: thin
Line Type: solid
[New] button...
Var Name: Teeth
Name: (Teeth)
Line Color: red
Line Width: thin
Line Type: solid
© 2011 Visual Trading Systems, LLC
455
456
VT Trader 2.0 Help Manual
[New] button...
Var Name: Jaw
Name: (Jaw)
Line Color: blue
Line Width: thin
Line Type: solid
5. In the Horizontal Line tab, create the following variables:
This indicator requires no horizontal levels.
6. In the Formula tab, copy and paste the following formula:
Lip:= Ref(Wilders(Prc,LipPer),-ShLp);
Teeth:= Ref(Wilders(Prc,TeethPer),-ShTth);
Jaw:= Ref(Wilders(Prc,JawPer),-ShJw);
7. Click the "Save" icon to finish building the Chaos Alligator Indicator.
6.20
Chaos Awesome Oscillator
Overview
The Chaos Awesome Oscillator is discussed by Bill M. Williams, PhD in his "Trading Chaos" book(s).
© 2011 Visual Trading Systems, LLC
Technical Indicators
457
Interpretation
Bill Williams' "Trading Chaos" book(s) describe some basic (and advanced) concepts for trading using
the Chaos Awesome Oscillator as part of a larger, more inclusive Chaos-based trading methodology.
For a full, detailed description of Bill Williams' Chaos trading methods, please refer to:
"Trading Chaos: Applying Expert Techniques to Maximize Your Profits" by Bill M. Williams, PhD (1995)
"New Trading Dimensions: How to Profit from Chaos in Stocks, Bonds, and Commodities" by Bill M.
Williams, PhD (1998)
"Trading Chaos: Maximize Profits with Proven Technical Techniques" by Bill M. Williams, PhD (2004)
Construction
1. Click the Ribbon>Technical Analysis menu>Indicators group>Indicator Builder command>
Indicator Builder window's [New] button
2. In the General tab, type the following text for each field:
Name: Chaos Awesome Oscillator
Function Name Alias: vt_ChaosAO
Label Mask:
Chaos AO (%Prc%,%ShortMAPer%,%LongMAPer%,%SignalMAPer%)
AO = %AOGreen%, AO-Signal = %SL%
Placement: New Frame
Data Inspection Alias: Chaos AO
3. In the Input Variable(s) tab, create the following variables:
[New] button...
"Read Only" Enabled
Name: Prc
Display Name: Price
Type: price
Default: Median Price
[New] button...
"Read Only" Enabled
Name: ShortMAPeriods
Display Name: Short MA Periods
Type: integer
Default: 5
[New] button...
"Read Only" Enabled
Name: LongMAPeriods
© 2011 Visual Trading Systems, LLC
458
VT Trader 2.0 Help Manual
Display Name: Long MA Periods
Type: integer
Default: 34
[New] button...
"Read Only" Enabled
Name: SignalMAPeriods
Display Name: Signal MA Periods
Type: integer
Default: 5
4. In the Output Variable(s) tab, create the following variables:
[New] button...
Var Name: AOGreen
Name: (AO-Green)
Line Color: dark green
Line Width: slightly thicker
Line Type: histogram
[New] button...
Var Name: AORed
Name: (AO-Red)
Line Color: red
Line Width: slightly thicker
Line Type: histogram
[New] button...
Var Name: SL
Name: (AO-Signal Line)
Line Color: blue
Line Width: thin
Line Type: dashed
5. In the Horizontal Line tab, create the following variables:
This indicator requires no horizontal levels.
6. In the Formula tab, copy and paste the following formula:
AO:= Mov(Prc,5,S) - Mov(Prc,34,S);
SL:= Mov(AO,5,S);
AOGreen:= if(AO>=Ref(AO,-1), AO, AO);
AORed:= if(AO<Ref(AO,-1), AO, null);
7. Click the "Save" icon to finish building the Chaos Awesome Oscillator indicator.
© 2011 Visual Trading Systems, LLC
Technical Indicators
6.21
459
Chaos Fractals
Overview
The concept of Fractals was discussed by Bill M. Williams, PhD in his book "Trading with Chaos".
According to Williams, an "up fractal" is defined as a middle bar with two lower highs on each side of it.
A "down fractal" is defined as a middle bar with two higher lows on each side of it.
Interpretation
Bill Williams' book "Trading Chaos" described some basic (and advanced) concepts for trading using
fractals as part of a larger, more inclusive Chaos-based trading methodology.
One simple method of utilizing fractals to initiate trades is to take trade based on the direction of a price
breakout above/below the most recent fractal. If price breaks above the most recent UpFractal - enter
long; If price breaks below the most recent DownFractal - enter short. Protective stops should be placed
below the lowest low of the most recent Down Fractal or 2nd most recent DownFractal for long trades
and above the highest high of the most recent UpFractal or 2nd most recent UpFractal for short trades.
For a full, detailed description of Bill Williams' Chaos trading methods, please refer to "Trading Chaos:
Applying Expert Techniques to Maximize Your Profits" by Bill M. Williams, PhD (Wiley - 1995)
Construction
© 2011 Visual Trading Systems, LLC
460
VT Trader 2.0 Help Manual
1. Click the Ribbon>Technical Analysis menu>Indicators group>Indicator Builder command>
Indicator Builder window's [New] button
2. In the General tab, type the following text for each field:
Name: Chaos Fractals
Function Name Alias: vt_ChaosFractals
Label Mask:
Chaos Up-Fractal = %UpFractal%
Chaos Down-Fractal = %DownFractal%
Placement: Price Frame
Data Inspection Alias: Chaos Fractals
3. In the Input Variable(s) tab, create the following variables:
This indicator requires no input variables.
4. In the Output Variable(s) tab, create the following variables:
[New] button...
Var Name: UpFractal
Name: (Up Fractal)
Line Color: blue
Line Width: thin
Line Type: dots
[New] button...
Var Name: DownFractal
Name: (Down Fractal)
Line Color: red
Line Width: thin
Line Type: dots
[New] button...
Var Name: Display_UpFractal
Name: (HHV of Up Fractal)
Line Color: dark blue
Line Width: thick
Line Type: dots
[New] button...
Var Name: Display_DownFractal
Name: (LLV of Down Fractal)
Line Color: dark red
Line Width: thick
Line Type: dots
5. In the Horizontal Line tab, create the following variables:
This indicator requires no horizontal levels.
6. In the Formula tab, copy and paste the following formula:
© 2011 Visual Trading Systems, LLC
Technical Indicators
461
{Generate Fractal Levels}
High1:=
High2:=
High3:=
High4:=
High5:=
Low1:=
Low2:=
Low3:=
Low4:=
Low5:=
Ref(H,-4);
Ref(H,-3);
Ref(H,-2);
Ref(H,-1);
H;
Ref(L,-4);
Ref(L,-3);
Ref(L,-2);
Ref(L,-1);
L;
UpFractal:= valuewhen(1,High3>high1 and High3>High2 and High3>High4 and
High3>High5,High3);
DownFractal:= valuewhen(1,Low3<Low1 and Low3<Low2 and Low3<Low4 and
Low3<Low5,Low3);
{Mark Highest High Bar of UpFractal}
{Mark Lowest Low Bar of DownFractal}
{This section is FOR DISPLAY USE ONLY!}
Display_High1:=
Display_High2:=
Display_High3:=
Display_High4:=
Display_High5:=
Display_Low1:=
Display_Low2:=
Display_Low3:=
Display_Low4:=
Display_Low5:=
Ref(H,-2);
Ref(H,-1);
Ref(H,0);
Ref(H,1);
Ref(H,2);
Ref(L,-2);
Ref(L,-1);
Ref(L,0);
Ref(L,1);
Ref(L,2);
Display_UpFractal:= If(Display_High3>Display_High1 and
Display_High3>Display_High2 and
Display_High3>Display_High4 and
Display_High3>Display_High5,
Display_High3,
null);
Display_DownFractal:= If(Display_Low3<Display_Low1 and
Display_Low3<Display_Low2 and
Display_Low3<Display_Low4 and
Display_Low3<Display_Low5,
Display_Low3,
null);
7. Click the "Save" icon to finish building the Chaos Fractals indicator.
© 2011 Visual Trading Systems, LLC
462
6.22
VT Trader 2.0 Help Manual
Chaos Gator Oscillator
Overview
The Chaos Gator Oscillator is discussed by Bill M. Williams, PhD in his "Trading Chaos" book(s).
Interpretation
Bill Williams' "Trading Chaos" book(s) describe some basic (and advanced) concepts for trading using
the Chaos Gator Oscillator as part of a larger, more inclusive Chaos-based trading methodology.
For a full, detailed description of Bill Williams' Chaos trading methods, please refer to:
"Trading Chaos: Applying Expert Techniques to Maximize Your Profits" by Bill M. Williams, PhD (1995)
"New Trading Dimensions: How to Profit from Chaos in Stocks, Bonds, and Commodities" by Bill M.
Williams, PhD (1998)
"Trading Chaos: Maximize Profits with Proven Technical Techniques" by Bill M. Williams, PhD (2004)
Construction
© 2011 Visual Trading Systems, LLC
Technical Indicators
463
1. Click the Ribbon>Technical Analysis menu>Indicators group>Indicator Builder command>
Indicator Builder window's [New] button
2. In the General tab, type the following text for each field:
Name: Chaos Gator Oscillator
Function Name Alias: vt_ChaosGator
Label Mask:
Chaos Gator Osc. (%Prc%,%LipPer%,%TeethPer%,%JawPer%)
GatorUp-Green = %GatorUpGr%, GatorUp-Red = %GatorUpRed%
GatorDown-Green = %GatorDnGr%, GatorDown-Red = %GatorDnRed%
Placement: New Frame
Data Inspection Alias: Chaos Gator Osc.
3. In the Input Variable(s) tab, create the following variables:
[New] button...
"Read Only" Enabled
Name: Prc
Display Name: Price
Type: price
Default: Median Price
[New] button...
"Read Only" Enabled
Name: LipPer
Display Name: Lip Periods
Type: integer
Default: 5
[New] button...
"Read Only" Enabled
Name: ShLp
Display Name: Lip Horizontal Shift
Type: Bars Forward
Default: 3
Min Bounds: 3
Max Bounds: 3
[New] button...
"Read Only" Enabled
Name: TeethPer
Display Name: Teeth Periods
Type: integer
Default: 8
[New] button...
"Read Only" Enabled
Name: ShTth
Display Name: Teeth Horizontal Shift
Type: Bars Forward
© 2011 Visual Trading Systems, LLC
464
VT Trader 2.0 Help Manual
Default: 5
Min Bounds: 5
Max Bounds: 5
[New] button...
"Read Only" Enabled
Name: JawPer
Display Name: Jaw Periods
Type: integer
Default: 13
[New] button...
"Read Only" Enabled
Name: ShJw
Display Name: Jaw Horizontal Shift
Type: Bars Forward
Default: 8
Min Bounds: 8
Max Bounds: 8
4. In the Output Variable(s) tab, create the following variables:
[New] button...
Var Name: GatorUpGr
Name: (Gator Up - Green)
Line Color: dark green
Line Width: slightly thicker
Line Type: histogram
[New] button...
Var Name: GatorUpRed
Name: (Gator Up - Red)
Line Color: red
Line Width: slightly thicker
Line Type: histogram
[New] button...
Var Name: GatorDnGr
Name: (Gator Down - Green)
Line Color: dark green
Line Width: slightly thicker
Line Type: histogram
[New] button...
Var Name: GatorDnRed
Name: (Gator Down - Red)
Line Color: red
Line Width: slightly thicker
Line Type: histogram
5. In the Horizontal Line tab, create the following lines:
[New] button...
© 2011 Visual Trading Systems, LLC
Technical Indicators
465
Value: +0.0000
Color: black
Width: thin
Type: dashed
6. In the Formula tab, copy and paste the following formula:
Lip:= Ref(Wilders(Prc,LipPer),-ShLp);
Teeth:= Ref(Wilders(Prc,TeethPer),-ShTth);
Jaw:= Ref(Wilders(Prc,JawPer),-ShJw);
GatorUp:= if(Teeth>Jaw,Teeth-Jaw,Jaw-Teeth);
GatorDn:= if(Jaw<Lip,Jaw-Lip,Lip-Jaw);
GatorUpGr:= If(GatorUp>=Ref(GatorUp,-1),GatorUp,GatorUp);
GatorUpRed:= If(GatorUp<Ref(GatorUp,-1),GatorUp,null);
GatorDnGr:= If(GatorDn<=Ref(GatorDn,-1),GatorDn,GatorDn);
GatorDnRed:= If(GatorDn>Ref(GatorDn,-1),GatorDn,null);
7. Click the "Save" icon to finish building the Chaos Gator Oscillator.
6.23
Choppiness Index
Overview
Developed by E.W. Dreiss, the Choppiness Index was designed to be a simple yet practical way to help
a trader determine if the market prices are trending or consolidating. It is similar to the ADX (which is
also designed to evaluate the strength of a trend and determine if the market is trending or
consolidating), however, Dreiss considers the Choppiness Index the superior of the two indicators.
The Choppiness Index uses a scale between 0 and 100. It also typically uses upper and lower bands at
61.8 and 38.2 respectively. The Choppiness Index is constructed by first calculating the true range for
each period and summing those values over n-periods. Second, it calculates the highest high value and
lowest low value over n-periods and calculates their difference. Third, it divides the sum of the true ranges
and calculates the base-10 logarithm of the value. Finally, it divides this value by the base-10 logarithm
of n-periods and multiplies the results by 100.
© 2011 Visual Trading Systems, LLC
466
VT Trader 2.0 Help Manual
Interpretation
The Choppiness Index does not determine in which direction the market is moving. Its basic premise is
that the more heavily the market is trending over the last n-periods the closer to zero the Choppiness
Index will be and the more heavily the market is consolidating (i.e. moving sideways or becoming
"choppy") over the last n-periods the closer to 100 the Choppiness Index will be.
Choppiness Index values above 61.8 indicate that the market is likely “choppy” (i.e. moving sideways
and consolidating). Higher values typically occur during/after a strong consolidation phase. Higher values
could also be interpreted as a warning sign of potential upcoming breakouts after significant
consolidation has occurred.
Choppiness Index values below 38.2 indicate that the market is likely trending. Lower values typically
occur during/after a strong trending phase. Lower values could also be interpreted as a warning sign of
potential upcoming consolidation and choppiness after a strong trend phase has occurred.
Construction
1. Click the Ribbon>Technical Analysis menu>Indicators group>Indicator Builder command>
Indicator Builder window's [New] button
2. In the General tab, type the following text for each field:
Name: Choppiness Index
Function Name Alias: vt_ChopIndex
© 2011 Visual Trading Systems, LLC
Technical Indicators
467
Label Mask: Choppiness Index (%periods%) = %ChopIndex%
Placement: New Frame
Data Inspection Alias: Choppiness Index
3. In the Input Variable(s) tab, create the following variables:
[New] button...
Name: periods
Display Name: Periods
Type: integer (with bounds)
Default: 14
4. In the Output Variable(s) tab, create the following variables:
[New] button...
Var Name: ChopIndex
Name: (CI)
Line Color: blue
Line Width: slightly thicker
Line Type: solid
5. In the Horizontal Line tab, create the following variables:
[New] button...
Value: +61.8000
Color: red
Width: thin
Type: dashed
[New] button...
Value: +38.2000
Color: red
Width: thin
Type: dashed
6. In the Formula tab, copy and paste the following formula:
ChopIndex:= ((Log(Sum(Atr(1),periods)/(HHV(H,periods)-LLV(L,periods)))/
Log(10)) / (Log(periods)/Log(10))) * 100;
7. Click the "Save" icon to finish building the Choppiness Index.
6.24
Commodity Channel Index (CCI)
Overview
Developed by Donald Lambert, the Commodity Channel Index (CCI) measures the variation of a
security's price from its statistical mean. High values show that prices are unusually high compared to
© 2011 Visual Trading Systems, LLC
468
VT Trader 2.0 Help Manual
average prices whereas low values indicate that prices are unusually low. Contrary to its name, the CCI
can be used effectively on any type of trading instrument, not just commodities.
The Commodity Channel Index (CCI) is calculated by first determining the difference between the mean
price of a commodity and the average of the means over the time period chosen (where Mean is the
exact middle between 2 extremes - MidPrice). This difference is then compared to the average difference
over the time period (this factors in the commodity's own inherent volatility). The result is then multiplied
by a constant that is designed to adjust the CCI so that it fits into a "normal" trading range of +/-100.
Interpretation
The CCI is a versatile indicator capable of producing a wide array of buy and sell signals. However, there
are three basic methods of interpreting the CCI: looking for divergences, trend line breaks, and as an
overbought/oversold indicator.
A divergence occurs when the instrument's prices are making new highs while the CCI is failing to
surpass its previous highs or when the instrument's prices are making new lows while the CCI is failing
to surpass its previous lows. These classic divergences are usually followed by a correction in the
instrument's price.
Trend line breaks can also be used to generate signals. Trend lines can be drawn connecting the peaks
and troughs of the CCI. From oversold levels, an advance above -100 and trend line breakout could be
considered bullish. From overbought levels, a decline below +100 and a trend line break could be
considered bearish.
The CCI typically oscillates between ±100. To use the CCI as an overbought/oversold indicator, readings
above +100 imply an overbought condition (and a pending price correction) while readings below -100
© 2011 Visual Trading Systems, LLC
Technical Indicators
469
imply an oversold condition (and a pending rally).
Implementation
VT Trader includes 2 different methods of calculation for the Commodity Channel Index. Both are similar
in design, but plot slightly different values.
The first method of calculation is the MetaStock formula equivalent.
Diff:= TP()-Mov(TP(),Pr,S);
AveDiff:= Mov(Abs(Diff),Pr,S);
EquationComp:= Diff/AveDiff;
AdjCon:= 66.66667{equivelant=2/3tds};
MS_CCI:= EquationComp*AdjCon;
The second method of calculation is Donald Lambert's original formula calculation. For scaling purposes,
Lambert set the constant at 0.015 to ensure that approximately 70 to 80 percent of CCI values would fall
between -100 and +100. The percentage of CCI values that fall between +100 and -100 will depend on
the number of periods used. A shorter CCI will be more volatile with a smaller percentage of values
between +100 and -100. Conversely, the more periods used to calculate the CCI, the higher the
percentage of values between +100 and -100.
DL_CCI:= CCI(TP(),Pr);
Construction
1. Click the Ribbon>Technical Analysis menu>Indicators group>Indicator Builder command>
Indicator Builder window's [New] button
2. In the General tab, type the following text for each field:
Name: Commodity Channel Index (CCI)
Function Name Alias: vt_CCI
Label Mask: CCI (%Pr%,%FormulaChoice%) = %CCIndex%
Placement: New Frame
Data Inspection Alias: CCI
3. In the Input Variable(s) tab, create the following variables:
[New] button...
Name: Pr
Display Name: CCI Periods
Type: integer
Default: 14
[New] button...
Name: FormulaChoice
Display Name: CCI Formula Calc Method
Type: Enumeration
© 2011 Visual Trading Systems, LLC
470
VT Trader 2.0 Help Manual
Default: click [...] button, [New] button, then create the following
entries:
MetaStock_Equivalent_Formula
Donald_Lambert_Formula
... then, click [OK] button
Default: Donald_Lambert_Formula
4. In the Output Variable(s) tab, create the following variables:
[New] button...
Var Name: CCIndex
Name: (CCI)
Line Color: dark blue
Line Width: thin
Line Type: solid
5. In the Horizontal Line tab, create the following lines:
[New] button...
Value: +100.0000
Color: red
Width: thin
Type: dashed
[New] button...
Value: +0.0000
Color: black
Width: thin
Type: dashed
[New] button...
Value: -100.0000
Color: red
Width: thin
Type: dashed
6. In the Formula tab, copy and paste the following formula:
{MetaStock Equivalent Calculation}
Diff:= TP()-Mov(TP(),Pr,S);
AveDiff:= Mov(Abs(Diff),Pr,S);
EquationComp:= Diff/AveDiff;
AdjCon:= 66.66667;
MS_CCI:= EquationComp * AdjCon;
{Donald Lambert's Original Formula}
DL_CCI:= CCI(TP(),Pr);
{Display CCI Based on User's Choice}
CCIndex:= if(FormulaChoice=0,MS_CCI,DL_CCI);
© 2011 Visual Trading Systems, LLC
Technical Indicators
471
7. Click the "Save" icon to finish building the Commodity Channel Index (CCI) indicator.
6.25
Coppock Curve
Overview
The Coppock Curve was developed by Edwin Sedgwick Coppock in 1962 and featured in the November
1994 issue of Technical Analysis of Stocks & Commodities, in the article "The Coppock Curve", written
by Elliot Middleton:
"We are creatures of habit. We judge the world relative to what we have experienced. If we're
shopping for a mortgage and rates have been in the teens (as they were in the early 1980s) and then
drop to 10%, we are elated. If, however, they've been at 8% and then rise to 10%, we are
disappointed. It all depends on our perspective. The principle of adaptation-level applies to how we
judge our income levels, stock prices and virtually every other variable in our lives. Psychologically,
relativity prevails..."
-- Tak en from Stock s & Commodities, V. 12:11 (459-462): The Coppock Curve by Elliott Middleton
Interpretation
© 2011 Visual Trading Systems, LLC
472
VT Trader 2.0 Help Manual
The moving average is the simplest form of adaptation-level. The Coppock Curve Indicator is a longer
term oscillator based on adaptation-levels, but in a different way. Oscillators usually begin by calculating
a % change of current price from some previous price, where the previous price is the reference point
(adaptation-level).
Edwin Coppock reasoned that the market participants' emotional state could be quantified by summing
up the % changes over the recent past to get a general sense of the market's longer term momentum.
For example: If we compare prices relative to a year ago and we see that this month the market is up
15% over a year ago, last month it was up 12.5% over a year ago, and 10%, 7.5% and 5% respectively
the months before that, then we may gauge that the market is gaining momentum.
Basic signals can be generated using the Coppock Curve by trading reversals from extreme levels.
Looking for divergence and trend line breaks may also be useful.
Construction
1. Click the Ribbon>Technical Analysis menu>Indicators group>Indicator Builder command>
Indicator Builder window's [New] button
2. In the General tab, type the following text for each field:
Name: Coppock Curve
Function Name Alias: vt_Coppock
Label Mask: Coppock Curve (%ROC_per%,%ma1_per%,%ma2_per%) = %CC%
Placement: New Frame
Data Inspection Alias: Coppock Curve
3. In the Input Variable(s) tab, create the following variables:
[New] button...
Name: ROC_per
Display Name: ROC Periods
Type: integer
Default: 250
[New] button...
Name: ma1_per
Display Name: MA1 Periods
Type: integer
Default: 22
[New] button...
Name: ma2_per
Display Name: MA2 Periods
Type: integer
Default: 150
4. In the Output Variable(s) tab, create the following variables:
© 2011 Visual Trading Systems, LLC
Technical Indicators
473
[New] button...
Var Name: CC
Name: (CC)
Line Color: dark green
Line Width: slightly thicker
Line Type: solid
5. In the Horizontal Line tab, create the following lines:
[New] button...
Value: +0.0000
Color: black
Width: thin
Type: dashed
6. In the Formula tab, copy and paste the following formula:
CC:= (Mov(Roc(Mov(C,ma1_per,S),ROC_per,Percent),ma2_per,E))/100;
7. Click the "Save" icon to finish building the Coppock Curve indicator.
6.26
Darvas Box
Overview
The Darvas Box Theory was created by Nicolas Darvas and described in his first book, "How I Made
$2,000,000 In the Stock Market" (1986, Lyle Stuart Kensington Publishing, New York).
The "Darvas Box" is a very simplistic basic element of Darvas's trading methodology. Coupling this
indicator with his strict discipline, uncanny market insights, and risk management, Darvas amassed a
fortune of over $2.2 million dollars starting with an account of only $10,000. This was in 1959 and would
be equivalent to over $20 million dollars today.
© 2011 Visual Trading Systems, LLC
474
VT Trader 2.0 Help Manual
Interpretation
One method of using the Darvas Box to signal trades is based on a simple breakout strategy of the
Darvas Box lines. If price breaks the top box, trade long; if price breaks below the bottom box, trade
short.
Construction
1. Click the Ribbon>Technical Analysis menu>Indicators group>Indicator Builder command>
Indicator Builder window's [New] button
2. In the General tab, type the following text for each field:
Name: Darvas Box
Function Name Alias: vt_DarvasBox
Label Mask:
Darvas Box (%Periods%)
Box Top = %TopBox%
Box Bottom = %BottomBox%
Placement: Price Frame
Data Inspection Alias: Darvas Box
3. In the Input Variable(s) tab, create the following variables:
[New] button...
© 2011 Visual Trading Systems, LLC
Technical Indicators
475
Name: Periods
Display Name: Periods
Type: integer
Default: 100
4. In the Output Variable(s) tab, create the following variables:
[New] button...
Var Name: TopBox
Name: (Top)
Line Color: blue
Line Width: slightly thicker
Line Type: solid
[New] button...
Var Name: BottomBox
Name: (Bottom)
Line Color: red
Line Width: slightly thicker
Line Type: solid
5. In the Horizontal Line tab, create the following variables:
This indicator requires no horizontal levels.
6. In the Formula tab, copy and paste the following formula:
_TopBox:= If(Ref(H,-3)>=Ref(HHV(H,Periods),-4) AND Ref(H,-2)<Ref(H,-3)
AND Ref(H,-1)<Ref(H,-3) AND H<Ref(H,-3),Ref(H,-3),PREV(0));
_BottomBox:= If(Ref(H,-3)>=Ref(HHV(H,Periods),-4) AND Ref(H,-2)<Ref(H,3) AND Ref(H,-1)<Ref(H,-3) AND H<Ref(H,-3),LLV(L,4),PREV(0));
TopBox:= If(_TopBox<>0,_TopBox,NULL);
BottomBox:= If(_BottomBox<>0,_BottomBox,NULL);
7. Click the "Save" icon to finish building the Darvas Box indicator.
6.27
DeMark's DeMarker I
Overview
The TD DeMarker I is designed to overcome the common shortcomings of traditional overbought /
oversold indicators. The DeMarker I helps identify potential price bottoms and tops by making price
comparisons from one bar to the next and measuring the level of price demand.
© 2011 Visual Trading Systems, LLC
476
VT Trader 2.0 Help Manual
Interpretation
The TD DeMarker I can be interpreted in many of the same ways as other overbought / oversold
indicators such as RSI.
Divergence: Looking for divergences between the TD DeMarker and price can prove to be very effective in
identifying potential reversal points in price movement. Trade long on Classic Bullish Divergence: Lower
lows in price and higher lows in the TD DeMarker; Trade short on Classic Bearish Divergence: Higher
highs in price and lower highs in the TD DeMarker. These types of divergence are often indications of an
impending reversal.
Overbought/Oversold Conditions: The TD DeMarker can be used to identify potential overbought and
oversold conditions in price movements. An Overbought condition is generally described as the TD
DeMarker being greater than or equal to the 70% level while an oversold condition is generally described
as the TD DeMarker being less than or equal to the 30% level. Trades can be generated when the TD
DeMarker crosses these levels. When the TD DeMarker crosses above 30 a buy signal is given.
Alternatively, when the TD DeMarker crosses below 70 a sell signal is given.
Support/Resistance and “Failure Swings”: The TD DeMarker shows, sometimes more clearly than price
itself, levels of support and resistance. Failure swings (a.k.a. support/resistance breakouts) occur when
the TD DeMarker surpasses a previous high (peak) or falls below a recent low (trough).
TD DeMarker / 50-level Crossover: When the TD DeMarker crosses above 50 a buy signal is given.
Alternatively, when the TD DeMarker crosses below 50 a sell signal is given.
Construction
© 2011 Visual Trading Systems, LLC
Technical Indicators
477
1. Click the Ribbon>Technical Analysis menu>Indicators group>Indicator Builder command>
Indicator Builder window's [New] button
2. In the General tab, type the following text for each field:
Name: DeMark's DeMarker I
Function Name Alias: vt_TDDMI
Label Mask: DeMark's DeMarker I (%periods%) = %DeMarker%
Placement: New Frame
Data Inspection Alias: DeMark's DeMarker I
3. In the Input Variable(s) tab, create the following variables:
[New] button...
Name: Periods
Display Name: Periods
Type: integer
Default: 13
4. In the Output Variable(s) tab, create the following variables:
[New] button...
Var Name: DeMarker
Name: (DeMarker I)
Line Color: dark green
Line Width: slightly thicker
Line Type: solid
5. In the Horizontal Line tab, create the following lines:
[New] button...
Value: +70.0000
Color: red
Width: thin
Type: dashed
[New] button...
Value: +30.0000
Color: red
Width: thin
Type: dashed
6. In the Formula tab, copy and paste the following formula:
highm:= if(H>Ref(H,-1),H-Ref(H,-1),0);
lowm:= if(L<Ref(L,-1),Ref(L,-1)-L,0);
DeMarker:= 100 * Sum(highm,periods) / (Sum(lowm,periods) + Sum(highm,
periods));
7. Click the "Save" icon to finish building DeMark's DeMarker I indicator.
© 2011 Visual Trading Systems, LLC
478
6.28
VT Trader 2.0 Help Manual
DeMark's Projected Range
Overview
The TD Projected Range indicator, developed by Tom Demark, attempts to identify benchmark
expectations for the next bar's potential high and low prices. The range projection is based on the
relationship of the open to close prices of the most recent period.
Interpretation
If the next bar opens within the projected range, you may anticipate that prices should remain within that
range. If the next bar opens above the projected high you may anticipate that the market will continue in
an uptrend; if the bar opens below the projected low you may anticipate that the market will continue in a
downtrend.
Construction
1. Click the Ribbon>Technical Analysis menu>Indicators group>Indicator Builder command>
Indicator Builder window's [New] button
© 2011 Visual Trading Systems, LLC
Technical Indicators
2. In the General tab, type the following text for each field:
Name: DeMark's Projected Range
Function Name Alias: vt_TDPR
Label Mask:
DeMark's Projected Range
Projected High = %PH%
Projected Low = %PL%
Placement: Price Frame
Data Inspection Alias: DeMark's Projected Range
3. In the Input Variable(s) tab, create the following variables:
This indicator requires no input variables.
4. In the Output Variable(s) tab, create the following variables:
[New] button...
Var Name: PH
Name: (Projected High)
Line Color: green
Line Width: slightly thicker
Line Type: dots
[New] button...
Var Name: PL
Name: (Projected Low)
Line Color: red
Line Width: slightly thicker
Line Type: dots
5. In the Horizontal Line tab, create the following variables:
This indicator requires no horizontal levels.
6. In the Formula tab, copy and paste the following formula:
TDH1:=(H+C+2*L)/2-L;
TDH2:=(2*H+L+C)/2-L;
TDH3:=(H+L+2*C)/2-L;
TDL1:=(H+C+2*L)/2-H;
TDL2:=(2*H+L+C)/2-H;
TDL3:=(H+L+2*C)/2-H;
PH:= If((C<O),TDH1,If((C>O),TDH2,If((C=O),TDH3,0)));
PL:= If((C<O),TDL1,If((C>O),TDL2,If((C=O),TDL3,0)));
7. Click the "Save" icon to finish building DeMark's Projected Range indicator.
© 2011 Visual Trading Systems, LLC
479
480
6.29
VT Trader 2.0 Help Manual
DeMark's Range Expansion Index (REI)
Overview
The TD Range Expansion Index was created by Tom DeMark and described in, "DeMark on Day Trading
Options" written by T.R. DeMark and T.R. Demark, Jr. (McGraw Hill, 1999).
The TD REI is a market-timing oscillator that attempts to overcome problems with exponentially
calculated oscillators, such as the MACD, by being arithmetically calculated.
Interpretation
The TD REI typically produces values of -100 to +100; Readings of +45 or higher indicates overbought
conditions while readings -45 or lower indicate oversold conditions. DeMark advises against trading in
extreme overbought or oversold conditions indicated by six or more bars above or below the 45
thresholds.
Construction
1. Click the Ribbon>Technical Analysis menu>Indicators group>Indicator Builder command>
Indicator Builder window's [New] button
2. In the General tab, type the following text for each field:
© 2011 Visual Trading Systems, LLC
Technical Indicators
Name: DeMark's Range Expansion Index
Function Name Alias: vt_TDREI
Label Mask: DeMark's REI (%Periods%) = %TDREI%
Placement: New Frame
Data Inspection Alias: DeMark's REI
3. In the Input Variable(s) tab, create the following variables:
[New] button...
Name: Periods
Display Name: Periods
Type: integer
Default: 5
4. In the Output Variable(s) tab, create the following variables:
[New] button...
Var Name: TDREI
Name: (TDREI)
Line Color: yellow-green
Line Width: slightly thicker
Line Type: solid
5. In the Horizontal Line tab, create the following lines:
[New] button...
Value: +45.0000
Color: red
Width: thin
Type: dashed
[New] button...
Value: +0.0000
Color: black
Width: thin
Type: dashed
[New] button...
Value: -45.0000
Color: red
Width: thin
Type: dashed
6. In the Formula tab, copy and paste the following formula:
HighMom:= H - Ref(H,-2);
LowMom:= L - Ref(L,-2);
TD1:=
TD2:=
TD3:=
TD4:=
(H>=Ref(L,-5) OR H>=Ref(L,-6));
(Ref(H,-2)>=Ref(C,-7) OR Ref(H,-2)>=Ref(C,-8));
(L<=Ref(H,-5) OR L<=Ref(H,-6));
(Ref(L,-2)<=Ref(C,-7) OR Ref(L,-2)<=Ref(C,-8));
© 2011 Visual Trading Systems, LLC
481
482
VT Trader 2.0 Help Manual
TD5:= (TD1 OR TD2) AND (TD3 OR TD4);
TD6:= If(TD5,HighMom + LowMom,0);
TD7:= Abs(HighMom) + Abs(LowMom);
TDREI:= 100 * Sum(TD6,Periods) / Sum(TD7,Periods);
7. Click the "Save" icon to finish building DeMark's Range Expansion Index (REI) indicator.
6.30
Detrended Price Oscillator (DPO)
Overview
The Detrended Price Oscillator (DPO), described in Steven Achelis' book "Technical Analysis A-Z",
attempts to eliminate the trend in prices by filtering out cycles longer than its moving average. It
accomplishes this by comparing the current price to a moving of price (n/2)+1 periods ago. By
detrending prices, shorter-term cycles are more easily identified allowing for a quicker determination of
potential overbought and oversold levels.
Interpretation
© 2011 Visual Trading Systems, LLC
Technical Indicators
483
The Detrended Price Oscillator can be used in a variety of ways:
Identifying Overbought/oversold Conditions: Identifying common overbought and oversold values based on
observation of past behavior of the DPO, trade long when the DPO crosses below and then back above
the oversold value and trade short when the DPO crosses above and then back below the overbought
value.
Going with the trend: The DPO can also be used to signal long trades when the DPO crosses above the
zero line and short trades when it crosses below the zero line.
Divergence: Look for divergence between the DPO and the instrument's price; bullish divergence occurs
when the DPO makes a higher low while price makes a lower low; bearish divergence occurs when the
DPO makes a lower high while the price makes a higher high.
Construction
1. Click the Ribbon>Technical Analysis menu>Indicators group>Indicator Builder command>
Indicator Builder window's [New] button
2. In the General tab, type the following text for each field:
Name: Detrended Price Oscillator (DPO)
Function Name Alias: vt_DPO
Label Mask: DPO (%price%,%periods%) = %DPOsc%
Placement: New Frame
Data Inspection Alias: DPO
3. In the Input Variable(s) tab, create the following variables:
[New] button...
Name: Price
Display Name: Price
Type: price
Default: close
[New] button...
Name: Periods
Display Name: Periods
Type: integer
Default: 20
4. In the Output Variable(s) tab, create the following variables:
[New] button...
Var Name: DPOsc
Name: (Osc)
Line Color: blue
Line Width: thin
Line Type: solid
© 2011 Visual Trading Systems, LLC
484
VT Trader 2.0 Help Manual
5. In the Horizontal Line tab, create the following lines:
[New] button...
Value: +0.0000
Color: black
Width: thin
Type: dashed
6. In the Formula tab, copy and paste the following formula:
DPOsc:= price - Ref(mov(price,periods,S),-(periods/2+1));
7. Click the "Save" icon to finish building the Detrended Price Oscillator indicator.
6.31
Directional Movement Index
Overview
The Directional Movement Index (DX) was developed by J. Welles Wilder and described in his book "New
Concepts In Technical Trading Systems", written in 1978. The DX consists of two parts: the Positive
Directional Index (+DI) and the Negative Directional Index (-DI). The DX's main purpose is to help identify
equilibrium points in the price movement by measuring true directional movement. The +DI line
measures positive (upward) movement while the -DI measures negative (downward) movement.
© 2011 Visual Trading Systems, LLC
Technical Indicators
485
Interpretation
Below are a few common methods for generating trading signals using the Directional Movement Index.
+DI/-DI Crossovers: When the +DI line crosses above the -DI line a buy signal is initiated (indicating that
positive price direction is greater than negative price direction). Conversely, when the -DI line crosses
above the +DI line a sell signal is initiated (indicating that negative price direction is greater than positive
price direction). When using the DMI crossover method to generate trading signals, Wilder stresses the
use of an additional "extreme point rule". The extreme price rule states that when the +DI/-DI crossover
occurs, the extreme point will become the high or low of that bar. Before entering a trade based on the
direction of the +DI/-DI crossover, the price must first break above the high (for a buy) or break below the
low (for a sell) and remain above/below those respective levels for several bars before intiating a new
trade or exiting a existing trade. The "extreme point rule" is useful in reducing the number of whipsaws
and false breakouts a trader may encounter if trading based on +DI/-DI crossovers alone.
Directional Movement System: Wilder typically suggests to use the DX as a filter along with other
indicators (such as the ADX or ADX(R)) to create a more concrete trading methodology. Wilder suggests
using the DMI as part of a system that includes the ADX indicator. (See the Directional Movement
System indicator for additional details)
Construction
1. Click the Ribbon>Technical Analysis menu>Indicators group>Indicator Builder command>
Indicator Builder window's [New] button
2. In the General tab, type the following text for each field:
Name: Directional Movement Index
Function Name Alias: vt_DMI
Label Mask:
Directional Movement Index (%Pr%)
+DI = %PlusDI%, -D = %MinusDI%
Placement: New Frame
Data Inspection Alias: DMI
3. In the Input Variable(s) tab, create the following variables:
[New] button...
Name: Pr
Display Name: Periods
Type: integer
Default: 14
4. In the Output Variable(s) tab, create the following variables:
[New] button...
Var Name: PlusDI
Name: (+DI)
© 2011 Visual Trading Systems, LLC
486
VT Trader 2.0 Help Manual
Line Color: blue
Line Width: thin
Line Type: solid
[New] button...
Var Name: MinusDI
Name: (-DI)
Line Color: red
Line Width: thin
Line Type: solid
5. In the Horizontal Line tab, create the following lines:
[New] button...
Value: +20.0000
Color: red
Width: thin
Type: dashed
6. In the Formula tab, copy and paste the following formula:
TH:= if(Ref(C,-1)>H,Ref(C,-1),H);
TL:= if(Ref(C,-1)<L,Ref(C,-1),L);
TR:= TH-TL;
PlusDM:= if(H>Ref(H,-1) AND L>=Ref(L,-1), H-Ref(H,-1),
if(H>Ref(H,-1) AND L<Ref(L,-1) AND H-Ref(H,-1)>Ref(L,-1)-L, HRef(H,-1),
0));
PlusDI:= 100 * Wilders(PlusDM,Pr)/Wilders(Tr,Pr);
MinusDM:= if(L<Ref(L,-1) AND H<=Ref(H,-1), Ref(L,-1)-L,
if(H>Ref(H,-1) AND L<Ref(L,-1) AND H-Ref(H,-1)<Ref(L,-1)-L,
Ref(L,-1)-L,
0));
MinusDI:= 100 * Wilders(MinusDM,Pr)/Wilders(Tr,Pr);
7. Click the "Save" icon to finish building the Directional Movement Index (DMI) indicator.
6.32
Directional Movement System
Overview
The Directional Movement System is a complex indicator developed by J. Welles Wilder and described
in his book "New Concepts In Technical Trading Systems", written in 1978. The Directional Movement
© 2011 Visual Trading Systems, LLC
Technical Indicators
487
System consists of the ADX (or ADX(R)) and the Directional Movement Index indicators.
Interpretation
Through the use of the ADX (or ADX(R)) and Directional Movement Index indicators, a concrete trading
methodology can be constructed. For example, one variation of the rules for trading using the Directional
Movement System as defined by Dr. Alexander Elder in "Trading For A Living" is as follows:
Buy Entry: ADX (or ADXR) rises while +DI and ADX (or ADXR) are above -DI; or ADX (or ADXR) turns
upwards from below +DI and -DI
Buy Exit: +DI crosses below -DI; or ADX turns downwards from above +DI and -DI
Sell Entry: ADX (or ADXR) rises while - DI and ADX (or ADXR) are above +DI; or ADX (or ADXR) turns
upwards from below +DI and -DI
Sell Exit: -DI crosses below +DI; or ADX (or ADXR) turns downwards from above +DI and -DI
No trades are entered while ADX (or ADXR) is below both +DI and -DI; this indicates what's commonly
referred to as a "lifeless" market. The longer that ADX (or ADXR) remains below the +DI and -DI the
stronger the next emerging trend will likely be. Dr. Elder also recommends waiting to enter new trades
until after the ADX (or ADXR) rises a minimum of 4 steps from its low (i.e.: if the ADX low was 16 it must
rise to at least 20) indicating that that it has clearly turned upwards from its bottom.
Construction
1. Click the Ribbon>Technical Analysis menu>Indicators group>Indicator Builder command>
© 2011 Visual Trading Systems, LLC
488
VT Trader 2.0 Help Manual
Indicator Builder window's [New] button
2. In the General tab, type the following text for each field:
Name: Directional Movement System
Function Name Alias: vt_DMSystem
Label Mask:
Directional Movement System (%Pr%,%SmPr%,%cT%)
+DI = %PlusDI%, -DI = %MinusDI%, ADX = %Final_ADX%
Placement: New Frame
Data Inspection Alias: Directional Movement System
3. In the Input Variable(s) tab, create the following variables:
[New] button...
Name: Pr
Display Name: DX Periods
Type: integer
Default: 14
[New] button...
Name: SmPr
Display Name: ADX/ADXR Smoothing Periods
Type: integer
Default: 14
[New] button...
Name: cT
Display Name: Display ADX or ADXR?
Type: Enumeration
Default: click [...] button, [New] button, then create the following
entries:
ADX
ADXR
... then, click [OK] button
Default: ADX
4. In the Output Variable(s) tab, create the following variables:
[New] button...
Var Name: PlusDI
Name: (+DI)
Line Color: blue
Line Width: thin
Line Type: solid
[New] button...
Var Name: MinusDI
Name: (-DI)
Line Color: red
Line Width: thin
Line Type: solid
© 2011 Visual Trading Systems, LLC
Technical Indicators
489
[New] button...
Var Name: Final_ADX
Name: (ADX)
Line Color: dark green
Line Width: slightly thicker
Line Type: solid
5. In the Horizontal Line tab, create the following lines:
[New] button...
Value: +20.0000
Color: red
Width: thin
Type: dashed
6. In the Formula tab, copy and paste the following formula:
TH:= if(Ref(C,-1)>H,Ref(C,-1),H);
TL:= if(Ref(C,-1)<L,Ref(C,-1),L);
TR:= TH-TL;
PlusDM:= if(H>Ref(H,-1) AND L>=Ref(L,-1), H-Ref(H,-1),
if(H>Ref(H,-1) AND L<Ref(L,-1) AND H-Ref(H,-1)>Ref(L,-1)-L, HRef(H,-1),
0));
PlusDI:= 100 * Wilders(PlusDM,Pr)/Wilders(Tr,Pr);
MinusDM:= if(L<Ref(L,-1) AND H<=Ref(H,-1), Ref(L,-1)-L,
if(H>Ref(H,-1) AND L<Ref(L,-1) AND H-Ref(H,-1)<Ref(L,-1)-L,
Ref(L,-1)-L,
0));
MinusDI:= 100 * Wilders(MinusDM,Pr)/Wilders(Tr,Pr);
DIDif:= Abs(PlusDI-MinusDI);
DISum:= PlusDI + MinusDI;
_ADX:= 100 * Wilders(DIDif/DISum,SmPr);
_ADXR:= (_ADX + Ref(_ADX,1-SmPr)) / 2;
Final_ADX:= if(cT=0,_ADX,_ADXR);
7. Click the "Save" icon to finish building the Directional Movement System indicator.
© 2011 Visual Trading Systems, LLC
490
6.33
VT Trader 2.0 Help Manual
Disparity Index
Overview
Developed by Steve Nison and described in his book entitled "Beyond Candlesticks", the Disparity Index
compares the market price to an n-periods moving average of market prices and calculates a
percentage-based oscillator.
When the Disparity Index is at 0, the current market price is the same as the n-periods moving average
value. When the Disparity Index is below 0, the current market price is below the n-periods moving
average by that percentage amount. When the Display Index is above 0, the current market price is
above the n-periods moving average by that percentage amount.
The Disparity Index is calculated by subtracting an n-periods moving average of market prices from the
current market price, dividing that value by the n-periods moving average, and then multiplying the result
by 100.
Interpretation
The Disparity Index is a very versatile indicator and can be used with several different techniques to
generate trading signals.
Disparity Index / Zero Level Crossover: A buy signal occurs when the Disparity Index crosses above zero
and a sell signal occurs when the Disparity Index crosses below zero.
© 2011 Visual Trading Systems, LLC
Technical Indicators
491
Divergence: Looking for divergences between the Disparity Index and price can prove to be very effective
in identifying potential reversal and/or trend continuation points in price movement. There are several
types of divergences:
Classic Divergence (aka: Regular Divergence)
Bullish Divergence = Lower lows in price and higher lows in the Disparity Index
Bearish Divergence = Higher highs in price and lower highs in the Disparity Index
Hidden Divergence (aka: Reverse, Continuation, Trend Divergence)
Bullish Divergence = Lower lows in Disparity Index and higher lows in price
Bearish Divergence = Higher highs in Disparity Index and lower highs in price
Overbought/Oversold Conditions: The Disparity Index can be used to identify potential overbought and
oversold conditions in price movements. An Overbought condition is generally described as the Disparity
Index being greater than or equal to its upper bound level while an oversold condition is generally
described as the Disparity Index being less than or equal to its lower bound level. The Disparity Index’s
upper and lower bounds values must be carefully determined after studying how the index reacts to the
instrument’s price movements that it is being used to evaluate. Trades can be generated when the
Disparity Index crosses these levels. A buy signal occurs when the Disparity Index declines below its
lower bound and then rises above that level. A sell signal occurs when the Disparity Index rises above its
upper bound and then declines below that level.
Nison also recommends combining the Disparity Index with candlesticks patterns such as harami cross
patterns, koma’s (a.k.a. spinning tops or small real body candles) and doji’s.
Construction
1. Click the Ribbon>Technical Analysis menu>Indicators group>Indicator Builder command>
Indicator Builder window's [New] button
2. In the General tab, type the following text for each field:
Name: Disparity Index
Function Name Alias: vt_DisparityIndex
Label Mask: Disparity Index (%price%,%periods%,%matype%) = %
DisparityIndex%
Placement: New Frame
Data Inspection Alias: Disparity Index
3. In the Input Variable(s) tab, create the following variables:
[New] button...
Name: price
Display Name: Price
Type: price
Default: Close
[New] button...
Name: periods
© 2011 Visual Trading Systems, LLC
492
VT Trader 2.0 Help Manual
Display Name: Periods
Type: integer (with bounds)
Default: 13
Min. Bounds: 1
Max. Bounds: 9999
[New] button...
Name: matype
Display Name: MA Type
Type: MA type
Default: Exponential
4. In the Output Variable(s) tab, create the following variables:
[New] button...
Var Name: DisparityIndex
Name: (Index)
Line Color: dark green
Line Width: thin
Line Type: solid
5. In the Horizontal Line tab, create the following lines:
[New] button...
Value: +0.0000
Color: black
Width: thin
Type: dashed
6. In the Formula tab, copy and paste the following formula:
DisparityIndex:= (price-mov(price,periods,matype))/mov(price,periods,
matype)*100;
7. Click the "Save" icon to finish building the Disparity Index indicator.
6.34
Donchian Channel
Overview
The Donchian Channel is a very simple trend-following indicator developed by Richard Donchian. It plots
the highest high and lowest low over the last period time intervals.
© 2011 Visual Trading Systems, LLC
Technical Indicators
493
Interpretation
When the market is trending, signals can be derived from this indicator based on the following basic
rules:
1. When price closes above the Donchian Channel, buy long and cover short positions.
2. When price closes below the Donchian Channel, sell short and liquidate long positions.
Construction
1. Click the Ribbon>Technical Analysis menu>Indicators group>Indicator Builder command>
Indicator Builder window's [New] button
2. In the General tab, type the following text for each field:
Name: Donchian Channel
Function Name Alias: vt_DC
Label Mask:
Donchian Channel (%Pds%)
DU = %DU%, DM = %DM%, DL = %DL%
Placement: New Frame
Data Inspection Alias: Donchian Channel
3. In the Input Variable(s) tab, create the following variables:
© 2011 Visual Trading Systems, LLC
494
VT Trader 2.0 Help Manual
[New] button...
Name: Pds
Display Name: Periods
Type: integer
Default: 20
4. In the Output Variable(s) tab, create the following variables:
[New] button...
Var Name: DU
Name: (Donchian-Upper)
Line Color: blue
Line Width: thin
Line Type: solid
[New] button...
Var Name: DL
Name: (Donchian-Lower)
Line Color: red
Line Width: thin
Line Type: solid
[New] button...
Var Name: DM
Name: (Donchian-Middle)
Line Color: dark green
Line Width: thin
Line Type: dashed
5. In the Horizontal Line tab, create the following variables:
This indicator requires no horizontal levels.
6. In the Formula tab, copy and paste the following formula:
DU:= HHV(Ref(H,-1),Pds);
DL:= LLV(Ref(L,-1),Pds);
DM:= (DU+DL)/2;
7. Click the "Save" icon to finish building the Donchian Channel indicator.
6.35
Double Exponential Moving Average (DEMA)
Overview
Developed by Patrick Mulloy and introduced in the February 1994 issue of Technical Analysis of Stocks
& Commodities magazine, this trend indicator is an acronym standing for "Double Exponential Moving
© 2011 Visual Trading Systems, LLC
Technical Indicators
495
Average". DEMA was designed to lessen the lag of a regular exponential moving average. It is a
composite of a single exponential MA and a double exponential MA that produces less lag than its two
components individually; it is NOT a moving average of a moving average.
Interpretation
The DEMA can be used in place of traditional moving averages. Please refer to the "Moving Average"
indicator for additional details.
Construction
1. Click the Ribbon>Technical Analysis menu>Indicators group>Indicator Builder command>
Indicator Builder window's [New] button
2. In the General tab, type the following text for each field:
Name: Double Exponential Moving Average (DEMA)
Function Name Alias: vt_DEMA
Label Mask: DEMA (%pr%,%len%,%mat%) = %_Dema%
Placement: Price Frame
Data Inspection Alias: DEMA
3. In the Input Variable(s) tab, create the following variables:
[New] button...
© 2011 Visual Trading Systems, LLC
496
VT Trader 2.0 Help Manual
Name: pr
Display Name: MA Price
Type: price
Default: close
[New] button...
Name: len
Display Name: MA Periods
Type: integer
Default: 20
[New] button...
Name: mat
Display Name: MA Type
Type: MA Type
Default: Exponential
4. In the Output Variable(s) tab, create the following variables:
[New] button...
Var Name: _Dema
Name: (Dema)
Line Color: orange
Line Width: thin
Line Type: solid
5. In the Horizontal Line tab, create the following variables:
This indicator requires no horizontal levels.
6. In the Formula tab, copy and paste the following formula:
_Dema:= 2 * mov(pr,len,mat) - mov(mov(pr,len,mat),len,mat);
7. Click the "Save" icon to finish building the Double Exponential Moving Average (DEMA) indicator.
6.36
Double Stochastic Oscillator
Overview
The Double Stochastic Oscillator is a deviation from the Stochastic Oscillators developed by George C.
Lane in the 1950's. The Double Stochastic Oscillator can be interpreted in the same manner as other
Stochastic Oscillators. Like the original Stochastic Oscillators, it is a momentum indicator designed to
show the relation of the current close price relative to the high/low range over a given number of periods
using a scale of 0-100. It is based on the assumption that in a rising market the price(s) will close near
the high of the range and in a declining market the price(s) will close near the low of the range.
© 2011 Visual Trading Systems, LLC
Technical Indicators
497
The Double Stochastic Oscillator is plotted as 2 lines: %K and %D. %K is the main (fast) line and %D
is the signal (slow) line.
The Double Stochastic Oscillator is calculated by the formula:
Fast %K = ((Today's Close - Lowest Low in %K Periods) / (Highest High in %K Periods - Lowest Low in
%K Periods)) * 100
Slowing %K = N-period moving average of Fast %K
Double %K = ((Today's Slowing %K - Lowest Low Slowing %K in %K Periods) / (Highest High Slowing
%K in %K Periods - Lowest Low Slowing %K in %K Periods)) * 100
Double Slowing %K = N-period moving average of Double %K
%D = 3-period simple moving average of Double Slowing %K
Interpretation
There are three basic techniques for using the Double Stochastic Oscillator to generate trading signals.
Crossovers: 1) %K line / %D line Crossover: A buy signal occurs When the %K line crosses above the
%D line and a sell signal occurs when the %K line crosses below the %D line. 2) %K line / 50-level
Crossover: When the %K line crosses above 50 a buy signal is given. Alternatively, when the %K line
crosses below 50 a sell signal is given.
Divergence: Looking for divergences between the Double Stochastic Oscillator and price can prove to be
© 2011 Visual Trading Systems, LLC
498
VT Trader 2.0 Help Manual
very effective in identifying potential reversal points in price movement. Trade long on Classic Bullish
Divergence: Lower lows in price and higher lows in the Double Stochastic Oscillator; Trade short on
Classic Bearish Divergence: Higher highs in price and lower highs in the Double Stochastic Oscillator.
Overbought/Oversold Conditions: The Double Stochastic Oscillator can be used to identify potential
overbought and oversold conditions in price movements. An Overbought condition is generally described
as the Double Stochastic Oscillator being greater than or equal to the 80% level while an oversold
condition is generally described as the Double Stochastic Oscillator being less than or equal to the 20%
level. Trades can be generated when the Double Stochastic Oscillator crosses these levels. A buy signal
occurs when the Double Stochastic Oscillator declines below 20% and then rises above that level. A sell
signal occurs when the Double Stochastic Oscillator rises above 80% and then declines below that level.
Construction
1. Click the Ribbon>Technical Analysis menu>Indicators group>Indicator Builder command>
Indicator Builder window's [New] button
2. In the General tab, type the following text for each field:
Name: Double Stochastic Oscillator
Function Name Alias: vt_DoubleStochOsc
Label Mask:
Double Stochastic Osc. (%K%,%Sl%,%Mt%,%D%,%MtD%)
DSO = %DSt%, Signal = %DStD%
Placement: New Frame
Data Inspection Alias: Double Stochastic Osc.
3. In the Input Variable(s) tab, create the following variables:
[New] button...
Name: K
Display Name: %K Periods
Type: integer
Default: 10
[New] button...
Name: Sl
Display Name: %K Slowing Periods
Type: integer
Default: 3
[New] button...
Name: Mt
Display Name: %K Slowing Method
Type: MA Type
Default: Simple
[New] button...
Name: D
Display Name: %D Periods
Type: integer
© 2011 Visual Trading Systems, LLC
Technical Indicators
Default: 3
[New] button...
Name: MtD
Display Name: %D Method
Type: MA Type
Default: Simple
4. In the Output Variable(s) tab, create the following variables:
[New] button...
Var Name: DSt
Name: (DSO)
Line Color: dark blue
Line Width: thin
Line Type: solid
[New] button...
Var Name: DStD
Name: (DSO Signal)
Line Color: dark blue
Line Width: thin
Line Type: dashed
5. In the Horizontal Line tab, create the following lines:
[New] button...
Value: +80.0000
Color: red
Width: thin
Type: dashed
[New] button...
Value: +20.0000
Color: red
Width: thin
Type: dashed
6. In the Formula tab, copy and paste the following formula:
St:= Mov(((C-LLV(L,K))/(HHV(H,K)-LLV(L,K)))*100,Sl,Mt);
DSt:= Mov(((St-LLV(St,K))/(HHV(St,K)-LLV(St,K)))*100,Sl,Mt);
DStD:= Mov(DSt,D,MtD);
7. Click the "Save" icon to finish building the Double Stochastic Oscillator indicator.
6.37
Ehlers Fisher Transform
Overview
© 2011 Visual Trading Systems, LLC
499
500
VT Trader 2.0 Help Manual
Introduced by John Elhers, the Fisher Transform is based on the article "Using the Fisher Transform" in
the November 2002 issue of Stocks and Commodities Magazine.
It was designed to clearly define major price reversals with its rapid response time and sharp, distinct
turning points. It is based on the assumption that prices do not have a Gaussian probability density
function (PDF) (bell-shaped curve movement), but that by normalizing price and applying the Fisher
Transform you could create a nearly Gaussian PDF.
Interpretation
Signals can be generated with pinpoint precision, according to Ehlers, by the crossover points of the
Fisher and its signal line.
Construction
1. Click the Ribbon>Technical Analysis menu>Indicators group>Indicator Builder command>
Indicator Builder window's [New] button
2. In the General tab, type the following text for each field:
Name: Ehlers Fisher Transform
Function Name Alias: vt_Fisher
Label Mask:
© 2011 Visual Trading Systems, LLC
Technical Indicators
Ehlers Fisher Transform (%pr%,%prd%)
Fisher = %fisher%, Signal = %signal%
Placement: New Frame
Data Inspection Alias: Ehlers Fisher Transform
3. In the Input Variable(s) tab, create the following variables:
[New] button...
Name: pr
Display Name: Price
Type: price
Default: close
[New] button...
Name: prd
Display Name: Periods
Type: integer
Default: 10
4. In the Output Variable(s) tab, create the following variables:
[New] button...
Var Name: fisher
Name: (Fisher)
Line Color: red
Line Width: thin
Line Type: solid
[New] button...
Var Name: signal
Name: (Signal Line)
Line Color: yellow
Line Width: thin
Line Type: solid
5. In the Horizontal Line tab, create the following lines:
[New] button...
Value: +0.0000
Color: black
Width: thin
Type: dashed
6. In the Formula tab, copy and paste the following formula:
maxh:= HHV(pr,prd);
minl:= LLV(pr,prd);
val1:= 0.33 * 2 * ((pr-minl)/(maxh-minl)-0.5) + 0.67 * PREV(0);
val2:= If(val1>0.99,0.999,If(val1<-0.99,-0.999,val1));
fisher:= 0.5 * Log((1+val2)/(1-val2)) + 0.5 * PREV(0);
signal:= ref(fisher,-1);
7. Click the "Save" icon to finish building Ehlers Fisher Transform indicator.
© 2011 Visual Trading Systems, LLC
501
502
6.38
VT Trader 2.0 Help Manual
Ehlers Laguerre Relative Strength Index
Overview
The Laguerre Relative Strength Index was introduced by John Ehlers in his book "Cybernetic Analysis for
Stocks and Futures". It uses a 4-Element Laguerre filter to provide a "time warp" such that the low
frequency components are delayed much more than the high frequency components. This enables much
smoother filters to be created using shorter amounts of data.
Interpretation
A typical use of the Laguerre RSI is to buy after it crosses back over the 20% level and sell after it
crosses back down through the 80% level.
Implementation
This implementation of the Laguerre RSI has been normalized to a scale of 0-100 rather than the original
0-1 scale.
© 2011 Visual Trading Systems, LLC
Technical Indicators
503
Construction
1. Click the Ribbon>Technical Analysis menu>Indicators group>Indicator Builder command>
Indicator Builder window's [New] button
2. In the General tab, type the following text for each field:
Name: Ehlers Laguerre Relative Strength Index
Function Name Alias: vt_LgRSI
Label Mask: Ehlers Laguerre RSI (%prc%,%df%) = %LRSI%
Placement: New Frame
Data Inspection Alias: Ehlers Laguerre RSI
3. In the Input Variable(s) tab, create the following variables:
[New] button...
Name: prc
Display Name: Price
Type: price
Default: close
[New] button...
Name: df
Display Name: Damping Factor
Type: float (with bounds)
Default: 0.5000
Min Bounds: 0.5000
Max Bounds: 0.8500
4. In the Output Variable(s) tab, create the following variables:
[New] button...
Var Name: LRSI
Name: (LRSI)
Line Color: dark green
Line Width: slightly thicker
Line Type: solid
5. In the Horizontal Line tab, create the following lines:
[New] button...
Value: +80.0000
Color: red
Width: thin
Type: dashed
[New] button...
Value: +20.0000
Color: red
Width: thin
© 2011 Visual Trading Systems, LLC
504
VT Trader 2.0 Help Manual
Type: dashed
6. In the Formula tab, copy and paste the following formula:
g:= df;
L0:= ((1-g)*prc) + (g*PREV(0));
L1:= (-g*L0) + Ref(L0,-1) + (g*PREV(0));
L2:= (-g*L1) + Ref(L1,-1) + (g*PREV(0));
L3:= (-g*L2) + Ref(L2,-1) + (g*PREV(0));
cu:= If(L0>L1, L0-L1,0) + If(L1>L2, L1-L2,0) + If(L2>L3, L2-L3,0);
cd:= If(L0<L1, L1-L0,0) + If(L1<L2, L2-L1,0) + If(L2<L3, L3-L2,0);
temp:= If(cu+cd=0,-1,cu+cd);
LRSI:= If(temp=-1,0,100*cu/temp);
7. Click the "Save" icon to finish building Ehlers Laguerre Relative Strength Index indicator.
6.39
Ehlers MESA Adaptive Moving Average (MAMA and FAMA)
Overview
Excerpted from the article entitled "Mesa Adaptive Moving Averages" by John F. Ehlers in the Sept.
2001 edition of Technical Analysis of Stocks and Commodities magazine…
“The MESA Adaptive Moving Average (MAMA) adapts to price movement based on the rate of
change of phase as measured by the Hilbert Transform Discriminator (Technical Analysis of Stock s
and Commodities magazine, December 2000). This method features a fast attack average and a
slow decay average so that composite average rapidly ratchets behind price changes and holds the
average value until the next ratchet occurs.”
For a more detailed description of the MESA Adaptive Moving Average, please refer to the
aforementioned article.
© 2011 Visual Trading Systems, LLC
Technical Indicators
505
Interpretation
Ehlers MESA Adaptive Moving Average can be used in place of traditional moving averages. Please refer
to the "Moving Average" indicator for additional details.
Additionally, the crossing of the MAMA and FAMA lines can be used to generate Buy and Sell signals.
When the MAMA crosses above the FAMA a buy signal is given. Alternatively, when the MAMA crosses
below the FAMA a sell signal is given.
Construction
1. Click the Ribbon>Technical Analysis menu>Indicators group>Indicator Builder command>
Indicator Builder window's [New] button
2. In the General tab, type the following text for each field:
Name: Ehlers MESA Adaptive Moving Average (MAMA and FAMA)
Function Name Alias: vt_MESA
Label Mask:
Ehlers MESA (%Price%,%FastLimit%,%SlowLimit%)
MAMA = %_MAMA%, FAMA = %_FAMA%
Placement: Price Frame
Data Inspection Alias: MESA Adaptive MA
3. In the Input Variable(s) tab, create the following variables:
© 2011 Visual Trading Systems, LLC
506
VT Trader 2.0 Help Manual
[New] button...
Name: Price
Display Name: Price
Type: price
Default: Median Price
[New] button...
Name: FastLimit
Display Name: Fast Limit
Type: float
Default: 0.5000
[New] button...
Name: SlowLimit
Display Name: Slow Limit
Type: float
Default: 0.0500
4. In the Output Variable(s) tab, create the following variables:
[New] button...
Var Name: _MAMA
Name: (MAMA)
Line Color: dark green
Line Width: slightly thicker
Line Type: solid
[New] button...
Var Name: _FAMA
Name: (FAMA)
Line Color: dark red
Line Width: slightly thicker
Line Type: solid
5. In the Horizontal Line tab, create the following variables:
This indicator requires no horizontal levels.
6. In the Formula tab, copy and paste the following formula:
_MAMA:= Mama(Price,FastLimit,SlowLimit);
_FAMA:= Fama(Price,FastLimit,SlowLimit);
7. Click the "Save" icon to finish building Ehlers MESA Adaptive Moving Average indicator.
6.40
Ehlers Relative Vigor Index (RVI)
Overview
© 2011 Visual Trading Systems, LLC
Technical Indicators
507
The Relative Vigor Index (RVI) was described in the January 2002 edition of Technical Analysis of
Stocks and Commodities magazine in an article titled, "Something Old, Something New - Relative Vigor
Index (RVI)" by John Ehlers. The RVI merges the older concepts of technical analysis with modern
digital signal processing theory and filters to create a practical and useful indicator.
The basic principle behind the RVI is simple - prices tend to close higher than they open in up-trending
markets and close lower than they open in down-trending markets. The energy (vigor) of the move is
thereby established by where the prices end up at the close. The RVI is essentially based on the
measure of the average difference between the close and open, normalized to the average daily trading
range. The end result is a responsive oscillator with crisp turning points that is basically in phase with
the cyclic component of market prices.
Interpretation
The Relative Vigor Index is a unique indicator. The basic method of interpreting the RVI is to use the
crossovers of the RVI and the RVI Signal Line. A buy signal occurs when the RVI crosses above the RVI
Signal Line and a sell signal occurs when the RVI crosses below the RVI Signal Line.
Construction
1. Click the Ribbon>Technical Analysis menu>Indicators group>Indicator Builder command>
Indicator Builder window's [New] button
© 2011 Visual Trading Systems, LLC
508
VT Trader 2.0 Help Manual
2. In the General tab, type the following text for each field:
Name: Ehlers Relative Vigor Index
Function Name Alias: vt_RVI
Label Mask:
Ehlers Relative Vigor Index (%periods%)
RVI = %_rvi%, Signal = %_rvisig%
Placement: New Frame
Data Inspection Alias: Relative Vigor Index
3. In the Input Variable(s) tab, create the following variables:
[New] button...
Name: periods
Display Name: Periods
Type: integer
Default: 10
4. In the Output Variable(s) tab, create the following variables:
[New] button...
Var Name: _rvi
Name: (RVI)
Line Color: blue
Line Width: thin
Line Type: solid
[New] button...
Var Name: _rvisig
Name: (RVI Signal Line)
Line Color: red
Line Width: thin
Line Type: solid
5. In the Horizontal Line tab, create the following variables:
This indicator requires no horizontal levels.
6. In the Formula tab, copy and paste the following formula:
value1:= ((C-O)+(2*Ref(C-O,-1))+(2*Ref(C-O,-2))+Ref(C-O,-3))/6;
value2:= ((H-L)+(2*Ref(H-L,-1))+(2*Ref(H-L,-2))+Ref(H-L,-3))/6;
{Avoid Divide By Zero Error}
denom:= If(Sum(value2,periods)=0,0.0001,Sum(value2,periods));
{Plot Indicator to Chart}
_rvi:= Sum(value1,periods)/denom;
_rvisig:= (_rvi+Ref(2*_rvi,-1)+Ref(2*_rvi,-2)+Ref(_rvi,-3))/6;
7. Click the "Save" icon to finish building Ehlers Relative Vigor Index indicator.
© 2011 Visual Trading Systems, LLC
Technical Indicators
6.41
509
Elder-Ray Bear Power
Overview
Developed by Dr. Alexander Elder in 1989 and described in his book “Trading for a Living”, the Elder-Ray
indicator consists of three components: Bear Power, Bull Power, and a 13-periods exponential moving
average.
Bull Power is calculated by subtracting a 13-periods exponential moving average from the High price.
Bear Power is calculated by subtracting a 13-periods exponential moving average from the Low price of
the bar.
The High price of any bar represents the maximum power of the bulls and the Low price of any bar
represents the maximum power of the bears. Elder refers to the exponential moving average as the
average consensus of price value. Therefore, Bull Power represents the ability of the bulls to raise prices
above the average consensus of value and Bear Power represents the ability of the bears to push prices
below the average consensus of value.
Interpretation
© 2011 Visual Trading Systems, LLC
510
VT Trader 2.0 Help Manual
According the Elder, Bull Power should normally remain positive and Bear Power should normally remain
negative. However, if Bull Power turns negative it means that the bears have gained control of the market
and if Bear Power turns positive it means that the bulls have gained control. You should not buy when
Bear Power is positive and you should not sell when Bull Power is negative.
Elder suggests using the exponential moving average’s slope to determine the market trend direction. He
describes the best buy signals as being when bullish divergence occurs between Bear Power and price
(i.e. lower lows in price and higher lows in Bear Power) and the best sell signals as being when bearish
divergence occurs between Bull Power and price (i.e. higher highs in price and lower highs in Bull
Power).
Elder described four basic conditions for buying and selling using only the Elder-Ray method, but also
recommended combining it with the Triple Screen method.
Buying Conditions:
(Essential)
1. Prices are trending upwards according to the 13-periods exponential moving average
2. Bear Power is negative, but rising
(Optional)
3. The latest Bull Power peak is higher than its previous peak
4. Bear Power is rising from a bullish divergence
Selling Conditions:
(Essential)
1. Prices are trending downwards according to the 13-periods exponential moving average
2. Bull Power is positive, but declining
(Optional)
3. The latest Bear Power trough is lower than its previous trough
4. Bull Power is declining from a bearish divergence
Elder mentions that if you want to increase your position, you should:
Increase your long position whenever Bear Power declines below zero and then rises back into
positive territory.
Increase your short position whenever Bull Power rises above zero and then falls back into
negative territory.
Elder’s Triple Screen method suggests identifying the price trend on a higher chart interval (like Weekly
charts) and applying the Elder-Ray on a lower chart interval (like Daily charts). Signals are taken
according to the Elder-Ray, but only in the direction of the price trend in the higher chart interval. A
Trailing Buy Stop and Trailing Sell Stop technique can then be used to pinpoint entry points. For
example, if the weekly trend is up and the daily oscillator is declining Elder suggests placing a buy stop
order 1 point above the previous bar's High. If the market reverses you will be stopped in long. However, if
the market continues to decline, you must adjust your buy stop order so that it is always 1 point above
the previous bar's High. The buy stop order remains active until it is either triggered or the weekly trend
© 2011 Visual Trading Systems, LLC
Technical Indicators
511
reverses (at which time you would cancel your order). If the weekly trend is down and the daily oscillator
is rising Elder suggests placing a sell stop order 1 point below the previous bar's Low. If the market
reverses you will be stopped in short. However, if the market continues to rise, you must adjust your sell
stop order so that it is always 1 point below the previous bar's Low. The sell stop order remains active
until it is either triggered or the weekly trend reverses (at which time you would cancel your order).
Construction
1. Click the Ribbon>Technical Analysis menu>Indicators group>Indicator Builder command>
Indicator Builder window's [New] button
2. In the General tab, type the following text for each field:
Name: Elder-Ray Bear Power
Function Name Alias: vt_ElderRayBearPwr
Label Mask: Elder-Ray Bear Power (%LDA%,%MaPrice%,%MaPeriods%,%MaType%) = %BearPowe
Placement: New Frame
Data Inspection Alias: Elder-Ray Bear Power
3. In the Input Variable(s) tab, create the following variables:
[New] button...
Name: LDA
Display Name: Low Price
Type: Price
Default: Low
[New] button...
Name: MaPrice
Display Name: MA Price
Type: Price
Default: Close
[New] button...
Name: MaPeriods
Display Name: MA Periods
Type: integer (with bounds)
Default: 13
Min. Bounds: 1
Max. Bounds: 9999
[New] button...
Name: MaType
Display Name: MA Type
Type: MA type
Default: Exponential
4. In the Output Variable(s) tab, create the following variables:
[New] button...
Var Name: BearPower
© 2011 Visual Trading Systems, LLC
512
VT Trader 2.0 Help Manual
Name: (Bear Pwr)
Line Color: red
Line Width: slightly thicker
Line Type: histogram
5. In the Horizontal Line tab, create the following variables:
[New] button...
Value: +0.0000
Color: black
Width: thin
Type: dashed
6. In the Formula tab, copy and paste the following formula:
BearPower:= LDA - Mov(MaPrice,MaPeriods,MaType);
7. Click the "Save" icon to finish building the Elder-Ray Bear Power indicator.
6.42
Elder-Ray Bull Power
Overview
Developed by Dr. Alexander Elder in 1989 and described in his book “Trading for a Living”, the Elder-Ray
indicator consists of three components: Bear Power, Bull Power, and a 13-periods exponential moving
average.
Bull Power is calculated by subtracting a 13-periods exponential moving average from the High price.
Bear Power is calculated by subtracting a 13-periods exponential moving average from the Low price of
the bar.
The High price of any bar represents the maximum power of the bulls and the Low price of any bar
represents the maximum power of the bears. Elder refers to the exponential moving average as the
average consensus of price value. Therefore, Bull Power represents the ability of the bulls to raise prices
above the average consensus of value and Bear Power represents the ability of the bears to push prices
below the average consensus of value.
© 2011 Visual Trading Systems, LLC
Technical Indicators
513
Interpretation
According the Elder, Bull Power should normally remain positive and Bear Power should normally remain
negative. However, if Bull Power turns negative it means that the bears have gained control of the market
and if Bear Power turns positive it means that the bulls have gained control. You should not buy when
Bear Power is positive and you should not sell when Bull Power is negative.
Elder suggests using the exponential moving average’s slope to determine the market trend direction. He
describes the best buy signals as being when bullish divergence occurs between Bear Power and price
(i.e. lower lows in price and higher lows in Bear Power) and the best sell signals as being when bearish
divergence occurs between Bull Power and price (i.e. higher highs in price and lower highs in Bull
Power).
Elder described four basic conditions for buying and selling using only the Elder-Ray method, but also
recommended combining it with the Triple Screen method.
Buying Conditions:
(Essential)
1. Prices are trending upwards according to the 13-periods exponential moving average
2. Bear Power is negative, but rising
(Optional)
3. The latest Bull Power peak is higher than its previous peak
4. Bear Power is rising from a bullish divergence
© 2011 Visual Trading Systems, LLC
514
VT Trader 2.0 Help Manual
Selling Conditions:
(Essential)
1. Prices are trending downwards according to the 13-periods exponential moving average
2. Bull Power is positive, but declining
(Optional)
3. The latest Bear Power trough is lower than its previous trough
4. Bull Power is declining from a bearish divergence
Elder mentions that if you want to increase your position, you should:
Increase your long position whenever Bear Power declines below zero and then rises back into
positive territory.
Increase your short position whenever Bull Power rises above zero and then falls back into
negative territory.
Elder’s Triple Screen method suggests identifying the price trend on a higher chart interval (like Weekly
charts) and applying the Elder-Ray on a lower chart interval (like Daily charts). Signals are taken
according to the Elder-Ray, but only in the direction of the price trend in the higher chart interval. A
Trailing Buy Stop and Trailing Sell Stop technique can then be used to pinpoint entry points. For
example, if the weekly trend is up and the daily oscillator is declining Elder suggests placing a buy stop
order 1 point above the previous bar's High. If the market reverses you will be stopped in long. However, if
the market continues to decline, you must adjust your buy stop order so that it is always 1 point above
the previous bar's High. The buy stop order remains active until it is either triggered or the weekly trend
reverses (at which time you would cancel your order). If the weekly trend is down and the daily oscillator
is rising Elder suggests placing a sell stop order 1 point below the previous bar's Low. If the market
reverses you will be stopped in short. However, if the market continues to rise, you must adjust your sell
stop order so that it is always 1 point below the previous bar's Low. The sell stop order remains active
until it is either triggered or the weekly trend reverses (at which time you would cancel your order).
Construction
1. Click the Ribbon>Technical Analysis menu>Indicators group>Indicator Builder command>
Indicator Builder window's [New] button
2. In the General tab, type the following text for each field:
Name: Elder-Ray Bull Power
Function Name Alias: vt_ElderRayBullPwr
Label Mask: Elder-Ray Bull Power (%HDA%,%MaPrice%,%MaPeriods%,%MaType%) = %BullPowe
Placement: New Frame
Data Inspection Alias: Elder-Ray Bull Power
3. In the Input Variable(s) tab, create the following variables:
[New] button...
Name: HDA
© 2011 Visual Trading Systems, LLC
Technical Indicators
Display Name: High Price
Type: Price
Default: High
[New] button...
Name: MaPrice
Display Name: MA Price
Type: Price
Default: Close
[New] button...
Name: MaPeriods
Display Name: MA Periods
Type: integer (with bounds)
Default: 13
Min. Bounds: 1
Max. Bounds: 9999
[New] button...
Name: MaType
Display Name: MA Type
Type: MA type
Default: Exponential
4. In the Output Variable(s) tab, create the following variables:
[New] button...
Var Name: BullPower
Name: (Bull Pwr)
Line Color: light green
Line Width: slightly thicker
Line Type: histogram
5. In the Horizontal Line tab, create the following variables:
[New] button...
Value: +0.0000
Color: black
Width: thin
Type: dashed
6. In the Formula tab, copy and paste the following formula:
BullPower:= HDA - Mov(MaPrice,MaPeriods,MaType);
7. Click the "Save" icon to finish building the Elder-Ray Bull Power indicator.
© 2011 Visual Trading Systems, LLC
515
516
6.43
VT Trader 2.0 Help Manual
Elliot Oscillator
Overview
Elliot Wave Theory is named after Ralph Nelson Elliot. It was inspired by the Dow Theory and by
observations found throughout nature; Fibonacci numbers provide the mathematical foundation. Each of
the cycles defined by Elliot are compromised of a total wave count that falls within the Fibonacci number
sequence. From this information, Elliot concluded that the movements of the financial markets could be
predicted by identifying this naturally repetitive series of waves.
After Elliot's passing, much research and advancement was done on Elliot Wave Theory during the
1950's - 1970's by Hamilton Bolton, Robert Prechter, and A.J. Frost. However, the basic concepts of
Elliot Wave Theory are outlined below:
Action is followed by reaction
The basic Elliot Wave pattern consists of 8 waves which are often labeled as 1, 2, 3, 4, 5, a, b, c
There are 5 waves in the direction of the main trend followed by 3 corrective waves (a.k.a. "5-3"
count); Waves 1, 3, and 5 are called "impulse" waves while waves 2 and 4 are called "corrective"
waves; Waves 1-5 can be either up or down; Waves a, b, and c correct the main trend and always
travel in the oppisite direction of waves 1 - 5.
A 5-3 count completes a cycle; this completed count then becomes 2 subdivisions of the next
higher 5-3 wave; The cycles are as follows: The largest wave count is called the Grand Supercycle
which consists of Supercycles which consist of Cycles. This process continues into Primary,
Intermediate, Minute, Minuette, and Sub-minuette wave cycles.
The underlying 5-3 pattern remains constant, but the time frame required to complete the pattern
may vary
However, there is an inherent weakness of the Elliott Wave Theory - its predictive nature is very
dependent on an accurate wave count. Determining where one wave starts and another wave ends can
be extremely subjective.
Enter the Elliot Oscillator indicator.
In an effort to keep better track of the complicated and very subjective Elliot Wave counts the Elliot
Oscillator measures the Rate of change of one wave compared to the Rate of Change of another wave.
The Elliot Oscillator is simply the difference of a 5-periods simple moving average and a 34-periods
simple moving average shown as a histogram that oscillates above/below a zero line.
© 2011 Visual Trading Systems, LLC
Technical Indicators
517
Interpretation
The most important Elliot Oscillator concepts are:
The highest/lowest value of the oscillator identifies a potential bullish/bearish wave 3
Wave 4 almost always pulls back to or crosses over the zero line in the opposite direction of the
main trend
Wave 5 usually makes a new high or low price for the swing, but often diverges from the Elliot
Oscillator; if Wave 5 makes a new high/low price, but doesn't diverge from the indicator, alternate
analysis may conclude that the wave was not wave 5, but instead an extended wave 3.
Construction
1. Click the Ribbon>Technical Analysis menu>Indicators group>Indicator Builder command>
Indicator Builder window's [New] button
2. In the General tab, type the following text for each field:
Name: Elliot Oscillator
Function Name Alias: vt_ElliotOsc
Label Mask: Elliot Oscillator (%Price%,%ShortMA%,%LongMA%,%Mat%) = %
EllOsc%
Placement: New Frame
© 2011 Visual Trading Systems, LLC
518
VT Trader 2.0 Help Manual
Data Inspection Alias: Elliot Oscillator
3. In the Input Variable(s) tab, create the following variables:
[New] button...
Name: Price
Display Name: Price
Type: price
Default: Median Price
[New] button...
Name: ShortMA
Display Name: Short MA Periods
Type: integer
Default: 5
[New] button...
Name: LongMA
Display Name: Long MA Periods
Type: integer
Default: 34
[New] button...
Name: Mat
Display Name: MA Type
Type: MA Type
Default: Simple
4. In the Output Variable(s) tab, create the following variables:
[New] button...
Var Name: EllOsc
Name: (EO)
Line Color: red
Line Width: thin
Line Type: histogram
5. In the Horizontal Line tab, create the following lines:
[New] button...
Value: +0.0000
Color: black
Width: thin
Type: dashed
6. In the Formula tab, copy and paste the following formula:
EllOsc:= Mov(Price,ShortMA,Mat)-Mov(Price,LongMA,Mat);
7. Click the "Save" icon to finish building the Elliot Oscillator indicator.
© 2011 Visual Trading Systems, LLC
Technical Indicators
6.44
519
Gann HiLo Activator
Overview
The Gann HiLo Activator was first introduced by Robert Krausz in the Feb. 1998 issue of Stocks &
Commodities Magazine. Further information about this indicator was gathered from Robert Krausz's
Fibonacci Trader Journal (Volume 1, Issue 2).
The Gann HiLo Activator is basically a simple moving average of the previous 3 periods' highs or lows
plotted based in relation to the HiLo Activator. When price is above the HiLo Activator it can be used as
a buy stop (uses the previous period’s lows for calculations) and when price is below the HiLo Activator it
can be used as a sell stop (using the previous period’s highs for calculation).
Interpretation
The Gann HiLo Activator is meant to be used in conjunction with the Gann Swing and Gann Trend
indicators to form a trading system methodology commonly referred to as the "New Gann Swing Chartist
Plan". Within this methodology the Gann HiLo Activator can be used as an entry trigger and stoploss
point.
Construction
© 2011 Visual Trading Systems, LLC
520
VT Trader 2.0 Help Manual
1. Click the Ribbon>Technical Analysis menu>Indicators group>Indicator Builder command>
Indicator Builder window's [New] button
2. In the General tab, type the following text for each field:
Name: Gann HiLo Activator
Function Name Alias: vt_GannHiLo
Label Mask: Gann HiLo Activator (%Lb%) = %HiLo%
Placement: Price Frame
Data Inspection Alias: Gann HiLo Activator
3. In the Input Variable(s) tab, create the following variables:
[New] button...
Name: Lb
Display Name: Lookback Periods
Type: integer
Default: 3
4. In the Output Variable(s) tab, create the following variables:
[New] button...
Var Name: HiLo
Name: (HiLo)
Line Color: blue
Line Width: slightly thicker
Line Type: solid
5. In the Horizontal Line tab, create the following variables:
This indicator requires no horizontal levels.
6. In the Formula tab, copy and paste the following formula:
HLd:=If(C>Ref(Mov(H,Lb,S),-1),1,If(C<Ref(Mov(L,Lb,S),-1),-1,0));
HLv:=ValueWhen(1,HLd<>0,HLd);
HiLo:=If(HLv=-1,Mov(H,Lb,S),Mov(L,Lb,S));
7. Click the "Save" icon to finish building the Gann HiLo Activator indicator.
6.45
Gann Swing Oscillator
Overview
The Gann Swing Oscillator has been adapted from Robert Krausz's book, "A W.D. Gann Treasure
Discovered".
© 2011 Visual Trading Systems, LLC
Technical Indicators
521
Interpretation
The Gann Swing Oscillator helps define market swings. A market swing up is defined by 2 higher highs
while a market swing low is defined by 2 lower lows. An up-swing is indicated by a +1 value of the
oscillator while a down-swing is indicated by a -1 value.
The Gann Swing Oscillator is meant to be used in conjunction with the Gann HiLo Activator and Gann
Trend indicators to form a trading system methodology commonly referred to as the "New Gann Swing
Chartist Plan". Within this methodology the Gann Swing Oscillator is used to help determine market
direction for trading only with the current market trend.
Construction
1. Click the Ribbon>Technical Analysis menu>Indicators group>Indicator Builder command>
Indicator Builder window's [New] button
2. In the General tab, type the following text for each field:
Name: Gann Swing Oscillator
Function Name Alias: vt_GannSwing
Label Mask: Gann Swing Osc. = %TD1%
Placement: New Frame
Data Inspection Alias: Gann Swing Osc.
3. In the Input Variable(s) tab, create the following variables:
© 2011 Visual Trading Systems, LLC
522
VT Trader 2.0 Help Manual
This indicator requires no input variables.
4. In the Output Variable(s) tab, create the following variables:
[New] button...
Var Name: TD1
Name: (Osc)
Line Color: purple
Line Width: slightly thicker
Line Type: solid
5. In the Horizontal Line tab, create the following variables:
This indicator requires no horizontal levels.
6. In the Formula tab, copy and paste the following formula:
{Market swing is defined as: Up = 2 higher highs, Down = 2 lower lows}
Us:= BarsSince(Sum(H>Ref(H,-1),2)=2);
Ds:= BarsSince(Sum(L<Ref(L,-1),2)=2);
Hc:= HighestSince(1,Us=0,H);
Lc:= LowestSince(1,Ds=0,L);
Sd1:= If(Us=0, If((L<>Lc) AND (Ref(L,-1)<>Lc), 1, 0), If(Ds=0, If
((H<>HC) AND (Ref(H,-1)<>Hc), -1, 0), 0));
Sd2:= If(Sd1=1,If(Ref(BarsSince(Sd1=1),-1) > Ref(BarsSince(Sd1=-1),-1),
1, 0), If(Sd1=-1, If(Ref(BarsSince(Sd1=1),-1) < Ref(BarsSince(Sd1=-1),1), -1, 0), 0));
TD1:= ValueWhen(1,Sd2<>0,Sd2);
7. Click the "Save" icon to finish building the Gann Swing Oscillator indicator.
6.46
Gann Trend Oscillator
Overview
The Gann Trend Oscillator has been adapted from Robert Krausz's book, "A W.D. Gann Treasure
Discovered".
© 2011 Visual Trading Systems, LLC
Technical Indicators
523
Interpretation
The Gann Trend Oscillator helps define overall market trend direction. An up-trending market is defined
by a +1 value of the oscillator while a down-trending market is indicated by a -1 value.
The Gann Trend Oscillator is meant to be used in conjunction with the Gann HiLo Activator and Gann
Swing indicators to form a trading system methodology commonly referred to as the "New Gann Swing
Chartist Plan". Within this methodology the Gann Trend Oscillator is used to determine the overall trend
direction of the market.
Construction
1. Click the Ribbon>Technical Analysis menu>Indicators group>Indicator Builder command>
Indicator Builder window's [New] button
2. In the General tab, type the following text for each field:
Name: Gann Trend Oscillator
Function Name Alias: vt_GannTrend
Label Mask: Gann Trend Osc. = %Tdv%
Placement: New Frame
Data Inspection Alias: Gann Trend Osc.
3. In the Input Variable(s) tab, create the following variables:
© 2011 Visual Trading Systems, LLC
524
VT Trader 2.0 Help Manual
This indicator requires no input variables.
4. In the Output Variable(s) tab, create the following variables:
[New] button...
Var Name: Tdv
Name: (Osc)
Line Color: dark green
Line Width: slightly thicker
Line Type: solid
5. In the Horizontal Line tab, create the following variables:
This indicator requires no horizontal levels.
6. In the Formula tab, copy and paste the following formula:
{Market swing is defined as: Up = 2 higher highs, Down = 2 lower lows}
Us:= BarsSince(Sum(H>Ref(H,-1),2)=2);
Ds:= BarsSince(Sum(L<Ref(L,-1),2)=2);
Hc:= HighestSince(1,Us=0,H);
Lc:= LowestSince(1,Ds=0,L);
Sd1:= If(Us=0, If((L<>Lc) AND (Ref(L,-1)<>Lc), 1, 0), If(Ds=0, If
((H<>HC) AND (Ref(H,-1)<>Hc), -1, 0), 0));
Sd2:= If(Sd1=1,If(Ref(BarsSince(Sd1=1),-1) > Ref(BarsSince(Sd1=-1),-1),
1, 0), If(Sd1=-1, If(Ref(BarsSince(Sd1=1),-1) < Ref(BarsSince(Sd1=-1),1), -1, 0), 0));
TD1:= ValueWhen(1,Sd2<>0,Sd2);
{Swing Direction}
Sd:= TD1;
{Swing Change High}
Sch:= If(Sd=1 AND Ref(sd,-1)=-1, 1, 0);
{Swing Change Low}
Scl:= If(Sd=-1 AND Ref(Sd,-1)=1, 1, 0);
{Peak Value}
Pv:= If(Scl=1, HighestSince(1,Sch=1,H), 0);
{Trough Value}
Tv:= If(Sch=1, LowestSince(1,Scl=1,L), 0);
{Trend Direction}
Td:= If(H>ValueWhen(1,Pv>0,Pv), 1, If(L<ValueWhen(1,Tv>0,Tv), -1, 0));
© 2011 Visual Trading Systems, LLC
Technical Indicators
525
{UpTrend=1 | DownTrend =-1}
Tdv:= ValueWhen(1,Td<>0,Td);
7. Click the "Save" icon to finish building the Gann Trend Oscillator indicator.
6.47
Hull Moving Average (HMA)
Overview
The Hull Moving Average (HMA), developed by Alan Hull, is an extremely fast and smooth moving
average. In fact, the HMA almost eliminates lag altogether and manages to improve smoothing at the
same time.
Interpretation
The Hull Moving Average can be used in place of traditional moving averages. Please refer to the "Moving
Average" indicator for additional details.
© 2011 Visual Trading Systems, LLC
526
VT Trader 2.0 Help Manual
Construction
1. Click the Ribbon>Technical Analysis menu>Indicators group>Indicator Builder command>
Indicator Builder window's [New] button
2. In the General tab, type the following text for each field:
Name: Hull Moving Average
Function Name Alias: vt_HMA
Label Mask: Hull MA (%price%,%length%,%method%) = %HMA%
Placement: Price Frame
Data Inspection Alias: Hull MA
3. In the Input Variable(s) tab, create the following variables:
[New] button...
Name: price
Display Name: Price
Type: price
Default: close
[New] button...
Name: length
Display Name: Periods
Type: integer
Default: 20
[New] button...
Name: method
Display Name: Type
Type: MA Type
Default: Weighted
4. In the Output Variable(s) tab, create the following variables:
[New] button...
Var Name: HMA
Name: (HMA)
Line Color: purple
Line Width: slightly thicker
Line Type: solid
5. In the Horizontal Line tab, create the following variables:
This indicator requires no horizontal levels.
6. In the Formula tab, copy and paste the following formula:
halvedLength:= if((ceiling(length/2) - (length/2) <= 0.5), ceiling
(length/2), floor(length/2));
sqrRootLength:= if((ceiling(sqrt(length)) - sqrt(length) <= 0.5),
ceiling(sqrt(length)), floor(sqrt(length)));
© 2011 Visual Trading Systems, LLC
Technical Indicators
527
Value1:= 2 * mov(price,halvedLength,method);
Value2:= mov(price,length,method);
HMA:= mov((Value1-Value2),sqrRootLength,method);
7. Click the "Save" icon to finish building the Hull Moving Average indicator.
6.48
Ichimoku Kinko Huo
Overview
The Ichimoku Kinko Hyo Japanese charting technique was developed before World War II by a Japanese
newspaper writer with the pen name of Ichimoku Sanjin. The word Ichimoku can be translated to mean
"a glance" or "one look". Kinko translates into "equilibrium" or "balance", and Hyo is the Japanese word
for "chart". Thus, Ichimoku Kinko Hyo simply means, "a glance at an equilibrium chart". Ichimoku charts
attempt to identify the probably direction of price and help the trader to determine the most suitable
times to enter and/or exit the market.
The Ichimoku chart consists of five lines constructed using only the midpoints of previous highs and
lows. The five lines are calculated as follows:
1) Tenkan-Sen = Conversion Line = (Highest High + Lowest Low) / 2, for the past 9 periods
2) Kijun-Sen = Base Line = (Highest High + Lowest Low) / 2, for the past 26 periods
3) Chikou Span = Lagging Span = Today's closing price plotted 26 periods behind
4) Senkou Span A = Leading Span A = (Tenkan-Sen + Kijun-Sen) / 2, plotted 26 periods ahead
5) Senkou Span B = Leading Span B = (Highest High + Lowest Low) / 2, for the past 52 periods, plotted
26 periods ahead
The Kumo (or clouds) is the area between Senkou Span A and Senkou Span B.
© 2011 Visual Trading Systems, LLC
528
VT Trader 2.0 Help Manual
Interpretation
A bullish signal is issued when the Tenkan-Sen crosses the Kijun-Sen from below. A bearish signal is
issued when the Tenkan-Sen crosses the Kijun-Sen from above. However, there are different levels of
strength for the buy and sell signals of an Ichimoku chart.
If a bullish crossover signal occurs above the Kumo (or clouds), it is considered a very strong buy signal.
In contrast, a bearish crossover signal that occurs below the Kumo is considered a very strong sell
signal.
If a bullish or bearish crossover signal takes place within the Kumo (or clouds) it's considered an average
or medium strength buy or sell signal.
A bullish crossover that occurs below the Kumo (or clouds) is considered a weak buy signal while a
bearish crossover that occurs above the Kumo is considered a weak sell signal.
Additionally, support and resistance levels can be predicted by the presence of Kumo (or clouds). The
Kumo can also be used to help identify the prevailing trend of the market. If the price is above the Kumo,
the prevailing trend is said to be up; if the price is below the Kumo, the prevailing trend is said to be
down.
Lastly, the Chikou Span (or Lagging Span) can also be used to determine the strength of the buy or sell
signal. If the Chikou Span is below the closing price for 26 periods ago and a sell signal is issued, then
the strength is to the downside, otherwise it is considered a weak sell signal. Conversely, if there is a
buy signal and the Chikou Span is above the price for 26 periods ago, then the strength is to the upside,
otherwise it can be considered a weak buy signal.
© 2011 Visual Trading Systems, LLC
Technical Indicators
529
Construction
1. Click the Ribbon>Technical Analysis menu>Indicators group>Indicator Builder command>
Indicator Builder window's [New] button
2. In the General tab, type the following text for each field:
Name: Ichimoku Kinko Huo
Function Name Alias: vt_Ichimoku
Label Mask:
Ichimoku Kinko Huo (%TSpr%,%KSPr%,%SSBPr%)
TS = %TS%, KS = %KS%, CS = %CS%
SSA = %SSA%, SSB = %SSB%
Placement: Price Frame
Data Inspection Alias: Ichimoku Kinko Huo
3. In the Input Variable(s) tab, create the following variables:
[New] button...
Name: TSpr
Display Name: Tenkan-Sen
Type: integer
Default: 9
[New] button...
Name: KSPr
Display Name: Kijun-Sen
Type: Bars Forward
Default: 26
Min Bounds: 0
Max Bounds: 9999
[New] button...
Name: SSBPr
Display Name: Senkou Span B
Type: integer
Default: 52
4. In the Output Variable(s) tab, create the following variables:
[New] button...
Var Name: SSA
Name: (Senkou Span A)
Line Color: dark blue
Line Width: thin
Line Type: solid
[New] button...
Var Name: SSB
Name: (Senkou Span B)
Line Color: black
© 2011 Visual Trading Systems, LLC
530
VT Trader 2.0 Help Manual
Line Width: thin
Line Type: solid
[New] button...
Var Name: TS
Name: (Tenkan-Sen)
Line Color: red
Line Width: slightly thicker
Line Type: solid
[New] button...
Var Name: KS
Name: (Kijun-Sen)
Line Color: blue
Line Width: slightly thicker
Line Type: solid
[New] button...
Var Name: CS
Name: (Chinkou Span)
Line Color: dark green
Line Width: slightly thicker
Line Type: solid
[New] button...
Var Name: KumoUp
Name: (Kumo Up)
Line Color: light blue
Line Width: thin
Line Type: solid
[New] button...
Var Name: Kumo_Up
Name: (Kumo Up)
Line Color: light blue
Line Width: thin
Line Type: solid
[New] button...
Var Name: KumoDown
Name: (Kumo Down)
Line Color: pink
Line Width: thin
Line Type: solid
[New] button...
Var Name: Kumo_Down
Name: (Kumo Down)
Line Color: pink
Line Width: thin
Line Type: solid
5. In the Horizontal Line tab, create the following variables:
© 2011 Visual Trading Systems, LLC
Technical Indicators
531
This indicator requires no horizontal levels.
6. In the Formula tab, copy and paste the following formula:
{Tenkan-Sen}
TS:= (HHV(H,TSpr)+LLV(L,TSpr))/2;
{Kijun-Sen}
KS:= (HHV(H,KSPr)+LLV(L,KSPr))/2;
{Senkou Span A}
SSA:= Ref((ts+ks)/2,-(KSPr-1));
{Senkou Span B}
SSB:= Ref((HHV(H,SSBPr)+LLV(L,SSBPr))/2,-(KSPr-1));
{Chinkou Span}
CS:= Ref(C,(KSPr-1));
{Paint the Clouds}
KumoUp:=if(ssa>ssb,if(prev=ref(ssb,-1),ssa,ssb),null);
Kumo_Up:=if(ssa>ssb,if(prev=ref(ssa,-1),ssb,ssa),null);
KumoDown:=if(ssa<ssb,if(prev=ref(ssb,-1),ssa,ssb),null);
Kumo_Down:=if(ssa<ssb,if(prev=ref(ssa,-1),ssb,ssa),null);
7. Click the "Save" icon to finish building the Ichimoku Kinko Huo indicator.
6.49
Inertia
Overview
The Inertia indicator was developed by Donald Dorsey and first appeared in the September 1995 issue of
Technical Analysis of Stocks &Commodities magazine.
Dorsey chose the name "Inertia" because of his interpretation of a trend. He claimed that a trend is the
outward result of inertia; thus it takes more energy for a market to reverse direction than to continue in
the same direction. Therefore, a trend is a measurement of market inertia.
In physics, Inertia is defined in terms of mass and direction of motion. Using standard technical
© 2011 Visual Trading Systems, LLC
532
VT Trader 2.0 Help Manual
analysis, the direction of motion is easily defined. However, mass is not so easily defined. Dorsey
claimed that volatility may be the simplest and most accurate measurement of inertia. This theory led
him to use the Relative Volatility Index (RVI) as the basis for a trend indicator. Inertia is a RVI smoothed
by a linear regression indicator.
Interpretation
The Inertia indicator is relatively simple to interpret. If the Inertia indicator is above 50, positive inertia is
indicated thereby defining the long-term trend as up while the indicator remains above 50. If the Inertia
indicator is below 50, negative inertia is indicated thereby defining the long-term trend is down while the
indicator remains below 50.
Construction
1. Click the Ribbon>Technical Analysis menu>Indicators group>Indicator Builder command>
Indicator Builder window's [New] button
2. In the General tab, type the following text for each field:
Name: Inertia
Function Name Alias: vt_Inertia
Label Mask: Inertia (%periods%,%mt%) = %_Inertia%
Placement: New Frame
Data Inspection Alias: Inertia
© 2011 Visual Trading Systems, LLC
Technical Indicators
533
3. In the Input Variable(s) tab, create the following variables:
[New] button...
Name: Periods
Display Name: Smoothing Periods
Type: integer
Default: 20
[New] button...
Name: mt
Display Name: Smoothing Type
Type: MA Type
Default: Simple
4. In the Output Variable(s) tab, create the following variables:
[New] button...
Var Name: _Inertia
Name: (Inertia)
Line Color: dark green
Line Width: slightly thicker
Line Type: solid
5. In the Horizontal Line tab, create the following lines:
[New] button...
Value: +50.0000
Color: red
Width: thin
Type: dashed
6. In the Formula tab, copy and paste the following formula:
_Inertia:= Mov(((100 * Mov(If(H>Ref(H,-1),Stdev(H,10),0),14,E) /
(Mov(If(H>Ref(H,-1),Stdev(H,10),0),14,E) +
Mov(If(H<Ref(H,-1),Stdev(H,10),0),14,E)) +
100 * Mov(If(L>Ref(L,-1),Stdev(L,10),0),14,E) /
(Mov(If(L>Ref(L,-1),Stdev(L,10),0),14,E) +
Mov(If(L<Ref(L,-1),Stdev(L,10),0),14,E))) / 2),periods,mt);
7. Click the "Save" icon to finish building the Inertia indicator.
6.50
Kase CD
Overview
The Kase CD is the derivative of the Kase Peak Oscillator. It is calculated in much the same way as the
© 2011 Visual Trading Systems, LLC
534
VT Trader 2.0 Help Manual
MACD histogram is calculated from a moving average oscillator. That is, it is the difference between the
Kase Peak Oscillator and the average of the Kase Peak Oscillator. However, because its basis is
statistical, it generates cleaner crossover signals and more reliable divergences.
Construction
1. Click the Ribbon>Technical Analysis menu>Indicators group>Indicator Builder command>
Indicator Builder window's [New] button
2. In the General tab, type the following text for each field:
Name: Kase CD
Function Name Alias: vt_KaseCD
Label Mask:
Kase CD (%Per1%)
KCD-Green = %Green%
KCD-Red = %Red%
Placement: New Frame
Data Inspection Alias: Kase CD
3. In the Input Variable(s) tab, create the following variables:
[New] button...
Name: Per1
Display Name: Periods
Type: integer
Default: 8
© 2011 Visual Trading Systems, LLC
Technical Indicators
4. In the Output Variable(s) tab, create the following variables:
[New] button...
Var Name: LN
Name: (LN)
Line Color: yellow
Line Width: slightly thicker
Line Type: solid
[New] button...
Var Name: Red
Name: (Red KCD Histogram)
Line Color: red
Line Width: thin
Line Type: histogram
[New] button...
Var Name: Green
Name: (Green KCD Histogram)
Line Color: green
Line Width: thin
Line Type: histogram
5. In the Horizontal Line tab, create the following lines:
[New] button...
Value: +0.0000
Color: black
Width: thin
Type: dashed
6. In the Formula tab, copy and paste the following formula:
RWH:=(H-Ref(L,-Per1))/(ATR(Per1)*Sqrt(Per1));
RWL:=(Ref(H,-Per1)-L)/(ATR(Per1)*Sqrt(Per1));
Pk:= Mov(Mov((RWH-RWL),3,W),3,S);
KCD:= PK-Mov(PK,8,S);
MN:= Mov(KCD,Per1,S);
SD:= Stdev(KCD,Per1);
Val1:= If(MN+(1.33*SD)>2.08,MN+(1.33*SD),2.08);
Val2:= If(MN-(1.33*SD)<-1.92,MN-(1.33*SD),-1.92);
LN:= If(Ref(KCD,-1)>=0 AND KCD>0,Val1,If(Ref(KCD,-1)<=0 AND KCD<0,
Val2,0));
Red:= If(Ref(KCD,-1)>KCD,KCD,0);
Green:= If(KCD>Ref(KCD,-1),KCD,0);
7. Click the "Save" icon to finish building the Kase CD indicator.
© 2011 Visual Trading Systems, LLC
535
536
6.51
VT Trader 2.0 Help Manual
Kase DevStop II
Overview
The Kase DevStop indicator is described in Cynthia Kase's "Trading with the Odds". The KDS calculates
an average range and 3 standard deviations of the range.
Interpretation
The DevStop is used to determine realistic exit points for trades based on volatility, the variance of
volatility, and volatility skew. The 4 lines are defined as a Warning Line and Standard Deviations of 1, 2
and 3. This allows traders to take profit or cut losses at levels at which the probability of a trade
remaining profitable is low, without taking more of a loss or cutting profits any sooner than necessary.
Construction
1. Click the Ribbon>Technical Analysis menu>Indicators group>Indicator Builder command>
Indicator Builder window's [New] button
2. In the General tab, type the following text for each field:
Name: Kase DevStop II
Function Name Alias: vt_KaseDS
© 2011 Visual Trading Systems, LLC
Technical Indicators
Label Mask:
Kase DevStop II (%Per1%)
Warning = %Val1%
1 StDev = %Val2%
2 StDevs = %Val3%
3 StDevs = %Val4%
Placement: Price Frame
Data Inspection Alias: Kase DevStop II
3. In the Input Variable(s) tab, create the following variables:
[New] button...
Name: Per1
Display Name: Periods
Type: integer (with bounds)
Default: 30
Min Bounds: 2
Max Bounds: 100
4. In the Output Variable(s) tab, create the following variables:
[New] button...
Var Name: Val1
Name: (Warning Line)
Line Color: yellow
Line Width: slightly thicker
Line Type: solid
[New] button...
Var Name: Val2
Name: (1 Deviation)
Line Color: red
Line Width: thin
Line Type: solid
[New] button...
Var Name: Val3
Name: (2 Deviations)
Line Color: red
Line Width: thin
Line Type: solid
[New] button...
Var Name: (3 Deviations)
Name: Val4
Line Color: red
Line Width: thin
Line Type: solid
5. In the Horizontal Line tab, create the following variables:
This indicator requires no horizontal levels.
© 2011 Visual Trading Systems, LLC
537
538
VT Trader 2.0 Help Manual
6. In the Formula tab, copy and paste the following formula:
RWH:=(H-Ref(L,-Per1))/(ATR(Per1)*Sqrt(Per1));
RWL:=(Ref(H,-Per1)-L)/(ATR(Per1)*Sqrt(Per1));
Pk:=Mov((RWH-RWL),3,W);
AVTR:=Mov(HHV(H,2) - LLV(L,2),20, S);
SD:=Stdev(HHV(H,2) - LLV(L,2),20);
Val4:=If(Pk>0,HHV(H-AVTR-3*SD,20),LLV(L+AVTR+3*SD,20));
Val3:=If(Pk>0,HHV(H-AVTR-2*SD,20),LLV(L+AVTR+2*SD,20));
Val2:=If(Pk>0,HHV(H-AVTR-SD,20),LLV(L+AVTR+SD,20));
Val1:=If(Pk>0,HHV(H-AVTR,20),LLV(L+AVTR,20));
7. Click the "Save" icon to finish building the Kase DevStop II indicator.
6.52
Kase Peak Oscillator
Overview
The Kase Peak Oscillator is used similarly to traditional oscillators, but is derived from a statistical
evaluation of trend that evaluates over 50 different trend lengths. It is capable of automatically adapting
for cycle length and volatility changes.
© 2011 Visual Trading Systems, LLC
Technical Indicators
539
Construction
1. Click the Ribbon>Technical Analysis menu>Indicators group>Indicator Builder command>
Indicator Builder window's [New] button
2. In the General tab, type the following text for each field:
Name: Kase Peak Oscillator
Function Name Alias: vt_KasePO
Label Mask:
Kase Peak Oscillator (%Per1%)
KPO-Green = %Green%
KPO-Red = %Red%
LN = %LN%
Placement: New Frame
Data Inspection Alias: Kase Peak Oscillator
3. In the Input Variable(s) tab, create the following variables:
[New] button...
Name: Per1
Display Name: Periods
Type: integer
Default: 30
4. In the Output Variable(s) tab, create the following variables:
[New] button...
Var Name: LN
Name: (LN)
Line Color: yellow
Line Width: slightly thicker
Line Type: solid
[New] button...
Var Name: Red
Name: (Red KPO Histogram)
Line Color: red
Line Width: thin
Line Type: histogram
[New] button...
Var Name: Green
Name: (Green KPO Histogram)
Line Color: green
Line Width: thin
Line Type: histogram
5. In the Horizontal Line tab, create the following lines:
[New] button...
© 2011 Visual Trading Systems, LLC
540
VT Trader 2.0 Help Manual
Value: +0.0000
Color: black
Width: thin
Type: dashed
6. In the Formula tab, copy and paste the following formula:
RWH:= (H-Ref(L,-Per1))/(ATR(Per1)*Sqrt(Per1));
RWL:= (Ref(H,-Per1)-L)/(ATR(Per1)*Sqrt(Per1));
Pk:= Mov((RWH-RWL),3,W);
MN:= Mov(Pk,Per1,S);
SD:= Stdev(Pk,Per1);
Val1:= If(MN+(1.33*SD)>2.08,MN+(1.33*SD),2.08);
Val2:= If(MN-(1.33*SD)<-1.92,MN-(1.33*SD),-1.92);
LN:= If(Ref(Pk,-1)>=0 AND Pk>0,Val1,If(Ref(Pk,-1)<=0 AND Pk<0,Val2,0));
Red:= If(Ref(Pk,-1)>Pk,Pk,0);
Green:= If(Pk>Ref(Pk,-1),Pk,0);
7. Click the "Save" icon to finish building the Kase Peak Oscillator indicator.
6.53
Kaufman's Adaptive Moving Average (KAMA)
Overview
Developed by Perry Kaufman, this indicator is a moving average that automatically adjusts its speed
based on market volatility.
© 2011 Visual Trading Systems, LLC
Technical Indicators
541
Interpretation
The KAMA can be used in place of traditional moving averages. Please refer to the "Moving Average"
indicator for additional details.
Construction
1. Click the Ribbon>Technical Analysis menu>Indicators group>Indicator Builder command>
Indicator Builder window's [New] button
2. In the General tab, type the following text for each field:
Name: Kaufman's Adaptive Moving Average (KAMA)
Function Name Alias: vt_KAMA
Label Mask: Kaufman's AMA (%Pr%,%periods%,%fsp%,%ssp%) = %Kama%
Placement: Price Frame
Data Inspection Alias: Kaufman's AMA
3. In the Input Variable(s) tab, create the following variables:
[New] button...
Name: Price
Display Name: Price
Type: price
Default: Close
© 2011 Visual Trading Systems, LLC
542
VT Trader 2.0 Help Manual
[New] button...
Name: Periods
Display Name: Periods
Type: integer
Default: 20
[New] button...
Name: fsp
Display Name: Fast Smoothing Constant
Type: integer (with bounds)
Default: 2
Min Bounds: 2
Max Bounds: 300
[New] button...
Name: ssp
Display Name: Slow Smoothing Constant
Type: integer (with bounds)
Default: 30
Min Bounds: 2
Max Bounds: 300
4. In the Output Variable(s) tab, create the following variables:
[New] button...
Var Name: Kama
Name: (Kama)
Line Color: red
Line Width: thin
Line Type: solid
5. In the Horizontal Line tab, create the following variables:
This indicator requires no horizontal levels.
6. In the Formula tab, copy and paste the following formula:
Direction:= Pr - ref(Pr,-periods);
Volatility:= sum(abs(roc(Pr,1,Points)),periods);
Volatility:= if(Volatility>0, Volatility, 0.0001);
ER:= abs(Direction/Volatility);
FastSC:= 2/(fsp + 1);
SlowSC:= 2/(ssp + 1);
SSC:= ER * (FastSC - SlowSC) + SlowSC;
Constant:= power(SSC,2);
Kama:= If(BarCount()<=periods, Pr, PREV(0) + constant * (Pr - PREV(0)));
7. Click the "Save" icon to finish building Kaufman's Adaptive Moving Average indicator.
© 2011 Visual Trading Systems, LLC
Technical Indicators
6.54
543
Kaufman's Efficiency Ratio
Overview
Developed by Perry Kaufman and described in his book entitled “New Trading Systems and Methods”,
the Efficiency Ratio is a measure of relative market speed to volatility. It is often used as a filter to help
avoid “choppy” or flat markets and help identify smoother market trends.
The Efficiency Ratio is calculated by dividing the net change in price movement over n-periods by the
sum of all bar-to-bar price changes (taken as absolute values) over those same n-periods.
Interpretation
The smoother the market is trending the greater the Efficiency Ratio. Efficiency Ratio readings around
zero indicate a lot of inefficiency and “choppiness” in the market movements.
For example, the Efficiency Ratio will read +100 for an instrument that is up-trending with perfect
efficiency and -100 for an instrument that is down-trending with perfect efficiency. Obviously, it is virtually
impossible for an instrument to have a perfect efficiency ratio since any adverse movement against the
prevailing trend direction during the time period being evaluated would decrease the efficiency ratio.
Efficiency Ratio values above +30 generally indicate a smoother uptrend while values below -30 generally
indicate a smoother downtrend. However, it’s important that you experiment with these values to
determine the most appropriate levels for the instrument(s) being evaluated and the trading methodology
being used.
© 2011 Visual Trading Systems, LLC
544
VT Trader 2.0 Help Manual
Construction
1. Click the Ribbon>Technical Analysis menu>Indicators group>Indicator Builder command>
Indicator Builder window's [New] button
2. In the General tab, type the following text for each field:
Name: Kaufman's Efficiency Ratio
Function Name Alias: vt_Efficiency
Label Mask: Kaufman's Efficiency Ratio (%prc%,%periods%) = %KER%
Placement: New Frame
Data Inspection Alias: Efficiency Ratio
3. In the Input Variable(s) tab, create the following variables:
[New] button...
Name: prc
Display Name: Price
Type: Price
Default: Close
[New] button...
Name: Periods
Display Name: Periods
Type: integer (with bounds)
Default: 20
Min. Bounds: 1
Max. Bounds: 9999
4. In the Output Variable(s) tab, create the following variables:
[New] button...
Var Name: KER
Name: (KER)
Line Color: dark yellow-gold
Line Width: slightly thicker
Line Type: solid
5. In the Horizontal Line tab, create the following variables:
[New] button...
Value: +30.0000
Color: red
Width: thin
Type: dashed
[New] button...
Value: +0.0000
Color: black
Width: thin
© 2011 Visual Trading Systems, LLC
Technical Indicators
545
Type: dashed
[New] button...
Value: -30.0000
Color: red
Width: thin
Type: dashed
6. In the Formula tab, copy and paste the following formula:
Speed:= prc-Ref(prc,-periods);
Volatility:= Sum(Abs(prc-Ref(prc,-1)),periods);
KER:= Speed/Volatility*100;
7. Click the "Save" icon to finish building Kaufman's Efficiency Ratio indicator.
6.55
Keltner Bands (Based on ATR)
Overview
Originally developed by Chester W. Keltner and first introduced in his 1960 book "How to Make Money in
Commodities", Keltner Channels help identify market trends using a rather simple volatility channel. The
original Keltner Channels formulas were later modified by Linda B. Raschke. To differentiate Raschke's
modified indicator from the original Keltner Channels, VT Trader refers it as Keltner ATR Bands.
Raschke replaced the original price-range simple moving average channels with bands based on an
average true range (ATR) measure of volatility. Raschke's modified Keltner Channels (Bands) are similar
to Bollinger Bands except that Bollinger Bands use a standard deviation method to determine volatility.
The Keltner Bands indicator is an n-period exponential moving average of the closing price. The bands
are created by adding (for the upper band) and subtracting (for the lower band) an (n-period simple
moving average of an n-period ATR) * an ATR multiplier.
© 2011 Visual Trading Systems, LLC
546
VT Trader 2.0 Help Manual
Interpretation
The modified Keltner ATR Bands can be traded in much the same methods as Bollinger Bands.
When prices move outside the bands a continuation of the current trend is implied
Bottoms and tops made outside the bands followed by bottoms and tops made inside the bands
call for reversals in the trend
A move that originates at one band tends to go all the way to the other band
Construction
1. Click the Ribbon>Technical Analysis menu>Indicators group>Indicator Builder command>
Indicator Builder window's [New] button
2. In the General tab, type the following text for each field:
Name: Keltner Bands (Based on ATR)
Function Name Alias: vt_KeltnerBandsATR
Label Mask:
Keltner Bands (Based on ATR) (%Pds1%,%Pds2%,%Mult%)
EMA = %MidKB%, UB = %UpperKB%, LB = %LowerKB%
Placement: Price Frame
Data Inspection Alias: Keltner ATR Bands
3. In the Input Variable(s) tab, create the following variables:
© 2011 Visual Trading Systems, LLC
Technical Indicators
[New] button...
Name: Pds1
Display Name: EMA Periods
Type: integer
Default: 20
[New] button...
Name: Pds2
Display Name: ATR Periods
Type: integer
Default: 10
[New] button...
Name: Mult
Display Name: ATR Multiple
Type: float (with bounds)
Default: 2.5000
Min Bounds: 1.0000
Max Bounds:= 10.0000
4. In the Output Variable(s) tab, create the following variables:
[New] button...
Var Name: MidKB
Name: (Middle EMA)
Line Color: dark blue
Line Width: thin
Line Type: dashed
[New] button...
Var Name: UpperKB
Name: (Upper Band)
Line Color: purple
Line Width: thin
Line Type: solid
[New] button...
Var Name: LowerKB
Name: (Lower Band)
Line Color: purple
Line Width: thin
Line Type: solid
5. In the Horizontal Line tab, create the following variables:
This indicator requires no horizontal levels.
6. In the Formula tab, copy and paste the following formula:
TH:= if(Ref(C,-1) > H,Ref(C,-1),H);
TL:= if(Ref(C,-1) < L,Ref(C,-1),L);
TR:= TH-TL;
© 2011 Visual Trading Systems, LLC
547
548
VT Trader 2.0 Help Manual
MidKB:= Mov(C,pds1,E);
Diff:= Mov(TR,Pds2,S)*Mult;
UpperKB:= Mov(C,pds1,E)+Diff;
LowerKB:= Mov(C,pds1,E)-Diff;
7. Click the "Save" icon to finish building the Keltner ATR Bands indicator.
6.56
Keltner Channels
Overview
Originally developed by Chester W. Keltner and first introduced in his 1960 book "How to Make Money in
Commodities", Keltner Channels help identify market trends using a rather simple volatility channel.
Keltner Channels consist of a middle moving average and two channel lines. The middle line of the
Keltner Channels indicator is an n-period simple moving average of typical price. The channel lines are
created by adding (for the upper channel line) and subtracting (for the lower channel line) an n-period
simple moving average of the High/Low range.
Interpretation
© 2011 Visual Trading Systems, LLC
Technical Indicators
549
Keltner’s trading strategy regards price breaking above the upper channel line as a strong bullish (buy)
signal. Conversely, price breaking below the lower channel line is considered a strong bearish (sell)
signal.
It’s also mentioned that sometimes other confirming indicators such as the RSI or MACD should be
used along with Keltner’s own “Minor Trend Rule”.
The “Minor Trend Rule” is a method for using the daily trend as a trading guide. Comparing today’s
prices with yesterday’s prices, Keltner defines a downtrend by an absence of new highs and an uptrend
by the failure of price to make new lows. Essentially, the “Minor Trend Rule” is a simple breakout
method that buys on new highs (today’s high > yesterday’s high) and sells on new lows (today’s low is
< yesterday’s low).
Construction
1. Click the Ribbon>Technical Analysis menu>Indicators group>Indicator Builder command>
Indicator Builder window's [New] button
2. In the General tab, type the following text for each field:
Name: Keltner Channels
Function Name Alias: vt_KeltnerChannels
Label Mask:
Keltner Channels (%Pr%)
SMA = %MidKC%, UC = %UpperKC%, LC = %LowerKC%
Placement: Price Frame
Data Inspection Alias: Keltner Channels
3. In the Input Variable(s) tab, create the following variables:
[New] button...
Name: Pr
Display Name: SMA Periods
Type: integer
Default: 10
4. In the Output Variable(s) tab, create the following variables:
[New] button...
Var Name: MidKB
Name: (Middle SMA)
Line Color: dark blue
Line Width: thin
Line Type: dashed
[New] button...
Var Name: UpperKB
Name: (Upper Band)
Line Color: purple
Line Width: thin
Line Type: solid
© 2011 Visual Trading Systems, LLC
550
VT Trader 2.0 Help Manual
[New] button...
Var Name: LowerKB
Name: (Lower Band)
Line Color: purple
Line Width: thin
Line Type: solid
5. In the Horizontal Line tab, create the following variables:
This indicator requires no horizontal levels.
6. In the Formula tab, copy and paste the following formula:
MidKC:= Mov(TP(),Pr,S);
UpperKC:= MidKC + Mov((H-L),Pr,S);
LowerKC:= MidKC - Mov((H-L),Pr,S);
7. Click the "Save" icon to finish building the Keltner Channels indicator.
6.57
Kurtosis Indicator
Overview
The Kurtosis Indicator is used to help determine market sentiment.
The Kurtosis Indicator is calculated in three parts.
The Kurtosis portion is calculated by the formula:
K = n-periods momentum – n-periods momentum of 1 bar ago (current bar’s momentum value minus the
previous bar’s momentum value)
The Fast Kurtosis portion is calculated by the formula:
FK = n-periods moving average of K
The Fast/Slow Kurtosis portion is calculated by the formula:
FSK = n-periods moving average of FK
© 2011 Visual Trading Systems, LLC
Technical Indicators
551
Interpretation
A buy signal occurs when the Kurtosis indicator crosses above zero and a sell signal occurs when the
Kurtosis indicator crosses below zero.
Construction
1. Click the Ribbon>Technical Analysis menu>Indicators group>Indicator Builder command>
Indicator Builder window's [New] button
2. In the General tab, type the following text for each field:
Name: Kurtosis Indicator
Function Name Alias: vt_Kurtosis
Label Mask: Kurtosis (%kprc%,%kper%,%fkper%,%fkmat%,%fskper%,%fskmat%) = %fsk%
Placement: New Frame
Data Inspection Alias: Kurtosis
3. In the Input Variable(s) tab, create the following variables:
[New] button...
Name: kprc
Display Name: Price
Type: Price
Default: Close
© 2011 Visual Trading Systems, LLC
552
VT Trader 2.0 Help Manual
[New] button...
Name: kper
Display Name: Periods
Type: integer (with bounds)
Default: 3
Min. Bounds: 1
Max. Bounds: 9999
[New] button...
Name: fkper
Display Name: Smoothing Periods
Type: integer (with bounds)
Default: 66
Min. Bounds: 1
Max. Bounds: 9999
[New] button...
Name: fkmat
Display Name: Smoothing Type
Type: MA type
Default: Exponential
[New] button...
Name: fskper
Display Name: Double Smoothing Periods
Type: integer (with bounds)
Default: 3
Min. Bounds: 1
Max. Bounds: 9999
[New] button...
Name: fskmat
Display Name: Double Smoothing Type
Type: MA type
Default: Simple
4. In the Output Variable(s) tab, create the following variables:
[New] button...
Var Name: fsk
Name: (FSK)
Line Color: light blue
Line Width: slightly thicker
Line Type: solid
5. In the Horizontal Line tab, create the following variables:
[New] button...
Value: +0.0000
Color: black
Width: thin
Type: dashed
© 2011 Visual Trading Systems, LLC
Technical Indicators
553
6. In the Formula tab, copy and paste the following formula:
mom:= kprc - Ref(kprc,-kper);
k:= mom - Ref(mom,-1);
fk:= Mov(k,fkper,fkmat);
fsk:= Mov(fk,fskper,fskmat);
7. Click the "Save" icon to finish building the Kurtosis indicator.
6.58
Linear Regression Acceleration
Overview
The Linear Regression Acceleration indicator calculates the change in the regression line's normalized
slope on the current bar from its normalized slope from the previous bar. The normalized acceleration
value is then plotted for each bar loaded in the chart.
Interpretation
The Linear Regression Acceleration indicator calculates the change in normalized slope of the
regression line from one bar to the next for each bar loaded in the chart. (See the Linear Regression
© 2011 Visual Trading Systems, LLC
554
VT Trader 2.0 Help Manual
Slope indicator for additional details about regression slope)
If the normalized acceleration is 0.20, then the regression line's normalized slope is rising at a rate of
0.20 per bar. Similarly, a normalized slope of -0.55 would indicate that the regression line's normalized
slope is declining at the rate of 0.55 per bar. For example, if the current bar's normalized slope value is
0.45 and the previous bar's normalized slope value is 0.37, then the normalized acceleration of the
current bar would be calculated as 0.45 - 0.37 = 0.08.
PLEASE NOTE: It's important to understand that a positive acceleration value does not equate to a
positive slope value; it simply means the slope is increasing. A negative acceleration value does not
equate to a negative slope value; it simply means the slope is decreasing.
Implementation
The Linear Regression Acceleration indicator allows for price selection, regression periods, smoothing of
RAW price before applying the regression and selection of smoothing type. The resulting regression
slope indicator is shown as a bi-color histogram that oscillates above and below 0. A reference line is
set at the 0 level. A rising slope (greater than its previous value 1 bar ago) is shown in the UpSlope color,
while a declining slope (lower than its previous value 1 bar ago) is shown in the DownSlope color.
Construction
1. Click the Ribbon>Technical Analysis menu>Indicators group>Indicator Builder command>
Indicator Builder window's [New] button
2. In the General tab, type the following text for each field:
Name: Linear Regression Acceleration
Function Name Alias: vt_LinRegAccel
Label Mask: Linear Reg. Accel. (%RegPeriods%,%Price%,%SmoothPeriods%,%
SmoothType%) = %PlusAcceleration%
Placement: New Frame
Data Inspection Alias: Linear Reg. Accel.
3. In the Input Variable(s) tab, create the following variables:
[New] button...
Name: RegPeriods
Display Name: Regression Periods
Type: integer
Default: 13
[New] button...
Name: Price
Display Name: Regression Price
Type: Price
Default: close
[New] button...
© 2011 Visual Trading Systems, LLC
Technical Indicators
555
Name: SmoothPeriods
Display Name: Pre-Smoothing Price Periods
Type: integer
Default: 1
[New] button...
Name: SmoothType
Display Name: Pre-Smoothing MA Type
Type: MA Type
Default: Simple
4. In the Output Variable(s) tab, create the following variables:
[New] button...
Var Name: PlusAcceleration
Name: (Plus Acceleration)
Line Color: blue
Line Width: thin
Line Type: histogram
[New] button...
Var Name: MinusAcceleration
Name: (Minus Acceleration)
Line Color: red
Line Width: thin
Line Type: histogram
5. In the Horizontal Line tab, create the following lines:
[New] button...
Value: +0.0000
Color: black
Width: thin
Type: dashed
6. In the Formula tab, copy and paste the following formula:
SmoothData:= mov(Price,SmoothPeriods,SmoothType);
Slope:= (linregslope(smoothdata,RegPeriods))*100/Price;
Acceleration:= Slope - ref(Slope,-1);
PlusAcceleration:= if(Acceleration>=ref(Acceleration,-1),Acceleration,
Acceleration);
MinusAcceleration:= if(Acceleration<ref(Acceleration,-1),Acceleration,
null);
7. Click the "Save" icon to finish building the Linear Regression Acceleration indicator.
© 2011 Visual Trading Systems, LLC
556
6.59
VT Trader 2.0 Help Manual
Linear Regression Indicator
Overview
The Linear Regression Indicator plots the trend of a market instrument's price over a specified length of
time. The trend is determined by calculating a Linear Regression Trend Line using the "least squares fit"
method. This method helps to minimum distance between the data points and a Linear Regression
Trend Line.
Unlike the straight Linear Regression Trend Line, the Linear Regression indicator plots the ending values
of multiple Linear Regression trend lines. Any point along the Linear Regression Indicator will be equal to
the ending value of a Linear Regression Trend line, but the result looks like a Moving Average.
However, unlike a Moving Average, the Linear Regression Indicator does not exhibit as much delay since
it is fitting a line to data points rather than averaging them. The Linear Regression Indicator is actually a
forecast of the tomorrow's price plotted today. When prices are persistently higher or lower than the
forecasted price, expect them to quickly return to more realistic levels. In other words, the Linear
Regression Indicator shows where prices "should" be trading on a statistical basis and any excessive
deviation from the regression line is likely to be short-lived.
Interpretation
The Linear Regression Indicator can be used in place of traditional moving averages. Please refer to the
"Moving Average" indicator for additional details.
© 2011 Visual Trading Systems, LLC
Technical Indicators
557
Implementation
The Linear Regression Indicator allows for price selection, regression periods, smoothing of RAW price
before applying the regression and selection of smoothing type. It's presented as a bi-color indicator. A
rising regression line (greater than its previous value 1 bar ago) is shown in the UpLine color, while a
declining line (lower than its previous value 1 bar ago) is shown in the DownLine color.
Construction
1. Click the Ribbon>Technical Analysis menu>Indicators group>Indicator Builder command>
Indicator Builder window's [New] button
2. In the General tab, type the following text for each field:
Name: Linear Regression Indicator
Function Name Alias: vt_LinReg
Label Mask: Linear Regression (%RegPeriods%,%Price%,%SmoothPeriods%,%
SmoothType%) = %UpLine%
Placement: Price Frame
Data Inspection Alias: Linear Regression
3. In the Input Variable(s) tab, create the following variables:
[New] button...
Name: RegPeriods
Display Name: Regression Periods
Type: integer
Default: 13
[New] button...
Name: Price
Display Name: Price
Type: Price
Default: close
[New] button...
Name: SmoothPeriods
Display Name: Pre-Smoothing Price Periods
Type: integer
Default: 1
[New] button...
Name: SmoothType
Display Name: Pre-Smoothing MA Type
Type: MA Type
Default: Simple
4. In the Output Variable(s) tab, create the following variables:
© 2011 Visual Trading Systems, LLC
558
VT Trader 2.0 Help Manual
[New] button...
Var Name: UpLine
Name: (Upward Line)
Line Color: blue
Line Width: slightly thicker
Line Type: solid
[New] button...
Var Name: DownLine
Name: (Downward Line)
Line Color: red
Line Width: slightly thicker
Line Type: solid
5. In the Horizontal Line tab, create the following variables:
This indicator requires no horizontal levels.
6. In the Formula tab, copy and paste the following formula:
SmoothData:= mov(Price,SmoothPeriods,SmoothType);
Line:= linreg(SmoothData,RegPeriods);
UpLine:= if(Line>=ref(Line,-1),Line,Line);
DownLine:= if(Line<ref(Line,-1),Line,null);
7. Click the "Save" icon to finish building the Linear Regression Indicator.
6.60
Linear Regression Slope
Overview
The Linear Regression Slope indicator calculates the slope value of theoretical regression lines which
involve that bar and the previous n-1 bars (n = regression periods) for each bar loaded in the chart. (See
the Linear Regression Indicator for additional details about regression lines). The slope values are then
normalized by multiplying the raw slope values by 100 and then dividing by the price (raw slope * 100 /
price).
© 2011 Visual Trading Systems, LLC
Technical Indicators
559
Interpretation
The normalization of the slope values is important when comparing markets that trade within different
price ranges. The normalized slope value basically shows the percent change in price per bar of the
regression (best fit) line. If the normalized slope is 0.20, then the regression line is rising at a rate of
0.20% per bar. Similarly, a normalized slope of -0.55 would indicate that the regression line is declining
at the rate o 0.55% per bar.
Implementation
The Linear Regression Slope indicator allows for price selection, regression periods, smoothing of RAW
price before applying the regression and selection of smoothing type. The resulting regression slope
indicator is shown as a bi-color histogram that oscillates above and below 0. A reference line is set at
the 0 level. A rising slope (greater than its previous value 1 bar ago) is shown in the UpSlope color, while
a declining slope (lower than its previous value 1 bar ago) is shown in the DownSlope color.
Construction
1. Click the Ribbon>Technical Analysis menu>Indicators group>Indicator Builder command>
Indicator Builder window's [New] button
2. In the General tab, type the following text for each field:
© 2011 Visual Trading Systems, LLC
560
VT Trader 2.0 Help Manual
Name: Linear Regression Slope
Function Name Alias: vt_LinRegSlope
Label Mask: Linear Reg. Slope (%RegPeriods%,%Price%,%SmoothPeriods%,%
SmoothType%) = %UpSlope%
Placement: New Frame
Data Inspection Alias: Linear Reg. Slope
3. In the Input Variable(s) tab, create the following variables:
[New] button...
Name: RegPeriods
Display Name: Regression Periods
Type: integer
Default: 13
[New] button...
Name: Price
Display Name: Regression Price
Type: Price
Default: close
[New] button...
Name: SmoothPeriods
Display Name: Pre-Smoothing Price Periods
Type: integer
Default: 1
[New] button...
Name: SmoothType
Display Name: Pre-Smoothing MA Type
Type: MA Type
Default: Simple
4. In the Output Variable(s) tab, create the following variables:
[New] button...
Var Name: UpSlope
Name: (Upward Slope)
Line Color: blue
Line Width: thin
Line Type: histogram
[New] button...
Var Name: DownSlope
Name: (Downward Slope)
Line Color: red
Line Width: thin
Line Type: histogram
5. In the Horizontal Line tab, create the following lines:
[New] button...
Value: +0.0000
© 2011 Visual Trading Systems, LLC
Technical Indicators
561
Color: black
Width: thin
Type: dashed
6. In the Formula tab, copy and paste the following formula:
SmoothData:= mov(Price,SmoothPeriods,SmoothType);
Slope:= (linregslope(smoothdata,RegPeriods))*100/Price;
UpSlope:= if(Slope>=ref(Slope,-1),Slope,Slope);
DownSlope:= if(Slope<ref(Slope,-1),Slope,null);
7. Click the "Save" icon to finish building the Linear Regression Slope indicator.
6.61
MACD
Overview
Developed by Gerald Appel, publisher of "Systems & Forecasts", the Moving Average Convergence/
Divergence (MACD) indicator is one of the simplest, most reliable, and most commonly used indicators
available. The MACD is a momentum oscillator with some trend-following characteristics.
The most popular construction of the MACD first calculates the difference between two moving averages
and plots that as the "Fast" line; a second "Signal" (trigger) line is then calculated from the resulting
"Fast" line and plotted in the same frame as the "Fast" line. The "standard" MACD values for the "Fast"
line are a 12-period exponential moving average and a 26-period exponential moving average and a 9period exponential moving average for the "Signal" line.
© 2011 Visual Trading Systems, LLC
562
VT Trader 2.0 Help Manual
Interpretation
The MACD is widely used as a trend-following indicator and tends to work most effectively when
measuring wide-swinging market movements. There are three basic techniques for using the MACD to
generate trading signals.
Crossovers: 1) Fast line/Signal line Crossover: A buy signal occurs when the Fast line crosses above
the Signal line and a sell signal occurs when the Fast line crosses below the Signal line. 2) Fast line /
Zero-Level Crossover: When the Fast line crosses above zero a buy signal is given. Alternatively, when
the Fast line crosses below zero a sell signal is given.
Divergence: Looking for divergences between the MACD and price can prove to be very effective in
identifying potential reversal and/or trend continuation points in price movement. There are several types
of divergences:
Classic Divergence (aka: Regular Divergence)
Bullish Divergence = Lower lows in price and higher lows in the MACD
Bearish Divergence = Higher highs in price and lower highs in the MACD
Hidden Divergence (aka: Reverse, Continuation, Trend Divergence)
Bullish Divergence = Lower lows in MACD and higher lows in price
Bearish Divergence = Higher highs in MACD and lower highs in price
Overbought/Oversold Conditions: The MACD can be used to identify potential overbought and oversold
conditions in price movements. These conditions are generated by comparing the distance between the
© 2011 Visual Trading Systems, LLC
Technical Indicators
563
shorter moving average and the longer moving average; if the shorter moving average separates
dramatically from the longer moving average it may be an indication that price is over-extending and will
soon return to more realistic levels.
Construction
1. Click the Ribbon>Technical Analysis menu>Indicators group>Indicator Builder command>
Indicator Builder window's [New] button
2. In the General tab, type the following text for each field:
Name: Moving Average Convergence/Divergence (MACD)
Function Name Alias: vt_MACD
Label Mask:
MACD (%FastPeriods%,%SlowPeriods%,%SigPeriods%)
Fast = %Fast%
Signal = %Signal%
Placement: New Frame
Data Inspection Alias: MACD
3. In the Input Variable(s) tab, create the following variables:
[New] button...
Name: FastPrice
Display Name: Fast MA Price
Type: price
Default: close
[New] button...
Name: FastPeriods
Display Name: Fast MA Periods
Type: float
Default: 12.0000
[New] button...
Name: FastType
Display Name: Fast MA Type
Type: MA Type
Default: Exponential
[New] button...
Name: SlowPrice
Display Name: Slow MA Price
Type: price
Default: close
[New] button...
Name: SlowPeriods
Display Name: Slow MA Periods
Type: float
Default: 26.0000
© 2011 Visual Trading Systems, LLC
564
VT Trader 2.0 Help Manual
[New] button...
Name: SlowType
Display Name: Slow MA Type
Type: MA Type
Default: Exponential
[New] button...
Name: SigPeriods
Display Name: Signal MA Periods
Type: float
Default: 9.0000
[New] button...
Name: SigType
Display Name: Signal MA Type
Type: MA Type
Default: Exponential
4. In the Output Variable(s) tab, create the following variables:
[New] button...
Var Name: Fast
Name: (Fast Line)
Line Color: blue
Line Width: thin
Line Type: solid
[New] button...
Var Name: Signal
Name: (Signal Line)
Line Color: red
Line Width: thin
Line Type: solid
[New] button...
Var Name: OsMA
Name: (Histogram)
Line Color: dark green
Line Width: thin
Line Type: histogram
5. In the Horizontal Line tab, create the following lines:
[New] button...
Value: +0.0000
Color: black
Width: thin
Type: dashed
6. In the Formula tab, copy and paste the following formula:
Fast:= Mov(FastPrice,FastPeriods,FastType) - Mov(SlowPrice,SlowPeriods,
© 2011 Visual Trading Systems, LLC
Technical Indicators
565
SlowType);
Signal:= Mov(Fast,SigPeriods,SigType);
OsMA:= Fast-Signal;
7. Click the "Save" icon to finish building the MACD indicator.
6.62
MACD-Histogram
Overview
Developed by Gerald Appel, publisher of "Systems & Forecasts", the Moving Average Convergence/
Divergence (MACD) indicator is one of the simplest, most reliable, and most commonly used indicators
available. The MACD is a momentum oscillator with some trend-following characteristics.
The most popular construction of the MACD first calculates the difference between two moving averages
and plots that as the "Fast" line; a second "Signal" (trigger) line is then calculated from the resulting
"Fast" line and plotted in the same frame as the "Fast" line. The "standard" MACD values for the "Fast"
line are a 12-period exponential moving average and a 26-period exponential moving average and a 9period exponential moving average for the "Signal" line.
Interpretation
© 2011 Visual Trading Systems, LLC
566
VT Trader 2.0 Help Manual
The MACD is widely used as a trend-following indicator and tends to work most effectively when
measuring wide-swinging market movements. There are three basic techniques for using the MACD to
generate trading signals.
Histogram / Zero-Level Crossover: When the MACD Histogram crosses above zero a buy signal is given.
Alternatively, when the MACD Histogram crosses below zero a sell signal is given.
Divergence: Looking for divergences between the MACD Histogram and price can prove to be very
effective in identifying potential reversal and/or trend continuation points in price movement. There are
several types of divergences:
Classic Divergence (aka: Regular Divergence)
Bullish Divergence = Lower lows in price and higher lows in the MACD Histogram
Bearish Divergence = Higher highs in price and lower highs in the MACD Histogram
Hidden Divergence (aka: Reverse, Continuation, Trend Divergence)
Bullish Divergence = Lower lows in MACD Histogram and higher lows in price
Bearish Divergence = Higher highs in MACD Histogram and lower highs in price
Construction
1. Click the Ribbon>Technical Analysis menu>Indicators group>Indicator Builder command>
Indicator Builder window's [New] button
2. In the General tab, type the following text for each field:
Name: Moving Average Convergence/Divergence (MACD) - Histogram
Function Name Alias: vt_MACDHist
Label Mask: MACD Histogram (%FastPeriods%,%SlowPeriods%,%SigPeriods%) =
%OsMA%
Placement: New Frame
Data Inspection Alias: MACD Histogram
3. In the Input Variable(s) tab, create the following variables:
[New] button...
Name: FastPrice
Display Name: Fast MA Price
Type: price
Default: close
[New] button...
Name: FastPeriods
Display Name: Fast MA Periods
Type: float
Default: 12.0000
© 2011 Visual Trading Systems, LLC
Technical Indicators
[New] button...
Name: FastType
Display Name: Fast MA Type
Type: MA Type
Default: Exponential
[New] button...
Name: SlowPrice
Display Name: Slow MA Price
Type: price
Default: close
[New] button...
Name: SlowPeriods
Display Name: Slow MA Periods
Type: float
Default: 26.0000
[New] button...
Name: SlowType
Display Name: Slow MA Type
Type: MA Type
Default: Exponential
[New] button...
Name: SigPeriods
Display Name: Signal MA Periods
Type: float
Default: 9.0000
[New] button...
Name: SigType
Display Name: Signal MA Type
Type: MA Type
Default: Exponential
4. In the Output Variable(s) tab, create the following variables:
[New] button...
Var Name: OsMA
Name: (Histogram)
Line Color: dark green
Line Width: thin
Line Type: histogram
5. In the Horizontal Line tab, create the following lines:
[New] button...
Value: +0.0000
Color: black
Width: thin
Type: dashed
© 2011 Visual Trading Systems, LLC
567
568
VT Trader 2.0 Help Manual
6. In the Formula tab, copy and paste the following formula:
Fast:= Mov(FastPrice,FastPeriods,FastType) - Mov(SlowPrice,SlowPeriods,
SlowType);
Signal:= Mov(Fast,SigPeriods,SigType);
OsMA:= Fast-Signal;
7. Click the "Save" icon to finish building the MACD-Histogram indicator.
6.63
MACD-Line
Overview
Developed by Gerald Appel, publisher of "Systems & Forecasts", the Moving Average Convergence/
Divergence (MACD) indicator is one of the simplest, most reliable, and most commonly used indicators
available. The MACD is a momentum oscillator with some trend-following characteristics.
The most popular construction of the MACD first calculates the difference between two moving averages
and plots that as the "Fast" line; a second "Signal" (trigger) line is then calculated from the resulting
"Fast" line and plotted in the same frame as the "Fast" line. The "standard" MACD values for the "Fast"
line are a 12-period exponential moving average and a 26-period exponential moving average and a 9period exponential moving average for the "Signal" line.
© 2011 Visual Trading Systems, LLC
Technical Indicators
569
Interpretation
The MACD is widely used as a trend-following indicator and tends to work most effectively when
measuring wide-swinging market movements. There are three basic techniques for using the MACD to
generate trading signals.
Crossovers: 1) Fast line/Signal line Crossover: A buy signal occurs when the Fast line crosses above
the Signal line and a sell signal occurs when the Fast line crosses below the Signal line. 2) Fast line /
Zero-Level Crossover: When the Fast line crosses above zero a buy signal is given. Alternatively, when
the Fast line crosses below zero a sell signal is given.
Divergence: Looking for divergences between the MACD and price can prove to be very effective in
identifying potential reversal and/or trend continuation points in price movement. There are several types
of divergences:
Classic Divergence (aka: Regular Divergence)
Bullish Divergence = Lower lows in price and higher lows in the MACD
Bearish Divergence = Higher highs in price and lower highs in the MACD
Hidden Divergence (aka: Reverse, Continuation, Trend Divergence)
Bullish Divergence = Lower lows in MACD and higher lows in price
Bearish Divergence = Higher highs in MACD and lower highs in price
Overbought/Oversold Conditions: The MACD can be used to identify potential overbought and oversold
conditions in price movements. These conditions are generated by comparing the distance between the
shorter moving average and the longer moving average; if the shorter moving average separates
dramatically from the longer moving average it may be an indication that price is over-extending and will
soon return to more realistic levels.
Construction
1. Click the Ribbon>Technical Analysis menu>Indicators group>Indicator Builder command>
Indicator Builder window's [New] button
2. In the General tab, type the following text for each field:
Name: Moving Average Convergence/Divergence (MACD) - Line
Function Name Alias: vt_MACDLine
Label Mask:
MACD Line (%FastPeriods%,%SlowPeriods%,%SigPeriods%)
Fast = %Fast%
Signal = %Signal%
Placement: New Frame
Data Inspection Alias: MACD Line
3. In the Input Variable(s) tab, create the following variables:
© 2011 Visual Trading Systems, LLC
570
VT Trader 2.0 Help Manual
[New] button...
Name: FastPrice
Display Name: Fast MA Price
Type: price
Default: close
[New] button...
Name: FastPeriods
Display Name: Fast MA Periods
Type: float
Default: 12.0000
[New] button...
Name: FastType
Display Name: Fast MA Type
Type: MA Type
Default: Exponential
[New] button...
Name: SlowPrice
Display Name: Slow MA Price
Type: price
Default: close
[New] button...
Name: SlowPeriods
Display Name: Slow MA Periods
Type: float
Default: 26.0000
[New] button...
Name: SlowType
Display Name: Slow MA Type
Type: MA Type
Default: Exponential
[New] button...
Name: SigPeriods
Display Name: Signal MA Periods
Type: float
Default: 9.0000
[New] button...
Name: SigType
Display Name: Signal MA Type
Type: MA Type
Default: Exponential
4. In the Output Variable(s) tab, create the following variables:
[New] button...
Var Name: Fast
© 2011 Visual Trading Systems, LLC
Technical Indicators
571
Name: (Fast Line)
Line Color: blue
Line Width: thin
Line Type: solid
[New] button...
Var Name: Signal
Name: (Signal Line)
Line Color: red
Line Width: thin
Line Type: solid
5. In the Horizontal Line tab, create the following lines:
[New] button...
Value: +0.0000
Color: black
Width: thin
Type: dashed
6. In the Formula tab, copy and paste the following formula:
Fast:= Mov(FastPrice,FastPeriods,FastType) - Mov(SlowPrice,SlowPeriods,
SlowType);
Signal:= Mov(Fast,SigPeriods,SigType);
7. Click the "Save" icon to finish building the MACD-Line indicator.
6.64
Mass Index
Overview
Developed by Donald Dorsey and described in his article entitled “The Mass Index” in the June 1992
issue of Technical Analysis of Stocks & Commodities magazine, the Mass Index indicator was designed
to warn of upcoming trend reversals. It does this by measuring the narrowing and widening of the average
range between the high and low prices. As the price range widens the Mass Index increases and as the
price range narrows the Mass Index decreases.
The Mass Index is created by calculating an n-periods moving summation (average) of the ratio of two
moving averages. The first moving average is divided by a second moving average (which is actually a
moving average of the first moving average). The moving averages ratio is then summed over n-periods to
calculate the final Mass Index.
© 2011 Visual Trading Systems, LLC
572
VT Trader 2.0 Help Manual
Interpretation
According to Dorsey, the “reversal bulge” pattern is the most method of generating potential trading
opportunities. A “reversal bulge” occurs when the Mass Index rises above 27 and then declines back
below 26.5.
It should be noted that the Mass Index does not indicate market direction. Dorsey suggests using an
additional moving average of price to help determine the market direction and classify the “reversal bulge”
pattern as a potential buy or sell signal.
Construction
1. Click the Ribbon>Technical Analysis menu>Indicators group>Indicator Builder command>
Indicator Builder window's [New] button
2. In the General tab, type the following text for each field:
Name: Mass Index
Function Name Alias: vt_MassIndex
Label Mask: Mass Index (%maperiods%,%matype%,%sumperiods%) = %MassIndex%
Placement: New Frame
Data Inspection Alias: Mass Index
3. In the Input Variable(s) tab, create the following variables:
© 2011 Visual Trading Systems, LLC
Technical Indicators
[New] button...
Name: maperiods
Display Name: MA Periods
Type: integer (with bounds)
Default: 9
Min. Bounds: 1
Max. Bounds: 9999
[New] button...
Name: matype
Display Name: MA Type
Type: MA type
Default: Exponential
[New] button...
Name: sumperiods
Display Name: Summation Periods
Type: integer (with bounds)
Default: 25
Min. Bounds: 1
Max. Bounds: 9999
4. In the Output Variable(s) tab, create the following variables:
[New] button...
Var Name: MassIndex
Name: (Mass)
Line Color: purple
Line Width: slightly thicker
Line Type: solid
5. In the Horizontal Line tab, create the following variables:
[New] button...
Value: +27.0000
Color: dark red
Width: thin
Type: dashed
[New] button...
Value: +26.5000
Color: red
Width: thin
Type: dashed
6. In the Formula tab, copy and paste the following formula:
MA1:= Mov((H-L),maperiods,matype);
MA2:= Mov(MA1,maperiods,matype);
MassIndex:= Sum(MA1/MA2,sumperiods);
7. Click the "Save" icon to finish building the Mass Index indicator.
© 2011 Visual Trading Systems, LLC
573
574
6.65
VT Trader 2.0 Help Manual
McClellan Histogram
Overview
The McClellan Histogram is a visual representation of the McClellan Oscillator and its signal line. This
difference is plotted as a histogram, making zero-line crossovers and divergences more easily
identifiable.
Interpretation
The McClellan Histogram is momentum indicator. As such, it can be traded in much the same way as
the MACD indicator. There are two basic techniques for using the McClellan Histogram to generate
trading signals.
Histogram / Zero-Level Crossover: When the histogram crosses above zero a buy signal is given.
Alternatively, when the histogram crosses below zero a sell signal is given.
Divergence: Looking for divergences between the McClellan Histogram and price can prove to be very
effective in identifying potential reversal and/or trend continuation points in price movement. There are
several types of divergences:
Classic Divergence (a.k.a.: Regular Divergence)
© 2011 Visual Trading Systems, LLC
Technical Indicators
575
Bullish Divergence = Lower lows in price and higher lows in the McClellan Histogram
Bearish Divergence = Higher highs in price and lower highs in the McClellan Histogram
Hidden Divergence (a.k.a.: Reverse, Continuation, Trend Divergence)
Bullish Divergence = Lower lows in McClellan Histogram and higher lows in price
Bearish Divergence = Higher highs in McClellan Histogram and lower highs in price
Construction
1. Click the Ribbon>Technical Analysis menu>Indicators group>Indicator Builder command>
Indicator Builder window's [New] button
2. In the General tab, type the following text for each field:
Name: McClellan Histogram
Function Name Alias: vt_McClellanHist
Label Mask: McClellan Histogram (%Pr%,%Sh%,%Lg%,%Sig%,%mat%) = %McClHist
%
Placement: New Frame
Data Inspection Alias: McClellan Histogram
3. In the Input Variable(s) tab, create the following variables:
[New] button...
Name: pr
Display Name: Price
Type: price
Default: close
[New] button...
Name: Sh
Display Name: Short MA Periods
Type: integer
Default: 19
[New] button...
Name: Lg
Display Name: Long MA Periods
Type: integer
Default: 39
[New] button...
Name: sig
Display Name: Signal MA Periods
Type: integer
Default: 9
[New] button...
Name: mat
© 2011 Visual Trading Systems, LLC
576
VT Trader 2.0 Help Manual
Display Name: MA Type
Type: MA Type
Default: Exponential
4. In the Output Variable(s) tab, create the following variables:
[New] button...
Var Name: McClHist
Name: (Histogram)
Line Color: red
Line Width: thin
Line Type: histogram
5. In the Horizontal Line tab, create the following lines:
[New] button...
Value: +0.0000
Color: black
Width: thin
Type: dashed
6. In the Formula tab, copy and paste the following formula:
McClOsc:= Mov(Pr,Sh,mat) - Mov(Pr,Lg,mat);
McClHist:= McClOsc - Mov(McClOsc,Sig,mat);
7. Click the "Save" icon to finish building the McClellan Histogram indicator.
6.66
McClellan Oscillator
Overview
The McClellan Oscillator, developed by Sherman and Marian McClellan, is a market breadth indicator
that is based on the smoothed difference between the numbers of advancing/declining statistics. In
depth coverage of the McClellan Oscillator is provided in their book “Patterns for Profit”.
© 2011 Visual Trading Systems, LLC
Technical Indicators
577
Interpretation
The McClellan Oscillator is momentum indicator. As such, it can be traded in much the same way as
the MACD indicator. There are three basic techniques for using the McClellan Oscillator to generate
trading signals.
Oscillator / Zero-Level Crossover: When the oscillator crosses above zero a buy signal is given.
Alternatively, when the oscillator crosses below zero a sell signal is given.
Divergence: Looking for divergences between the McClellan Oscillator and price can prove to be very
effective in identifying potential reversal and/or trend continuation points in price movement. There are
several types of divergences:
Classic Divergence (a.k.a.: Regular Divergence)
Bullish Divergence = Lower lows in price and higher lows in the McClellan Histogram
Bearish Divergence = Higher highs in price and lower highs in the McClellan Histogram
Hidden Divergence (a.k.a.: Reverse, Continuation, Trend Divergence)
Bullish Divergence = Lower lows in McClellan Histogram and higher lows in price
Bearish Divergence = Higher highs in McClellan Histogram and lower highs in price
Overbought/Oversold Conditions: The McClellan Oscillator can also be used to identify potential
overbought and oversold conditions in price movements. These conditions are generated by comparing
the distance between the shorter moving average and the longer moving average. If the shorter moving
average separates dramatically from the longer moving average it may be an indication that price is over© 2011 Visual Trading Systems, LLC
578
VT Trader 2.0 Help Manual
extending and will soon return to more realistic levels.
Construction
1. Click the Ribbon>Technical Analysis menu>Indicators group>Indicator Builder command>
Indicator Builder window's [New] button
2. In the General tab, type the following text for each field:
Name: McClellan Oscillator
Function Name Alias: vt_McClellanOsc
Label Mask: McClellan Osc. (%Pr%,%Sh%,%Lg%,%mat%) = %McClOsc%
Placement: New Frame
Data Inspection Alias: McClellan Osc.
3. In the Input Variable(s) tab, create the following variables:
[New] button...
Name: Pr
Display Name: Price
Type: price
Default: close
[New] button...
Name: Sh
Display Name: Short MA Periods
Type: integer
Default: 19
[New] button...
Name: Lg
Display Name: Long MA Periods
Type: integer
Default: 39
[New] button...
Name: mat
Display Name: MA Type
Type: MA Type
Default: Exponential
4. In the Output Variable(s) tab, create the following variables:
[New] button...
Var Name: McClOsc
Name: (Osc)
Line Color: blue
Line Width: thin
Line Type: histogram
5. In the Horizontal Line tab, create the following lines:
© 2011 Visual Trading Systems, LLC
Technical Indicators
579
[New] button...
Value: +0.0000
Color: black
Width: thin
Type: dashed
6. In the Formula tab, copy and paste the following formula:
McClOsc:= Mov(Pr,Sh,mat) - Mov(Pr,Lg,mat);
7. Click the "Save" icon to finish building the McClellan Oscillator indicator.
6.67
McClellan Summation Index
Overview
The McClellan Summation Index, developed by Sherman and Marian McClellan, is a long-term version of
their McClellan Oscillator that is better suited to help identify potential major trend reversals.
The McClellan Oscillator is a market breadth indicator that is based on the smoothed difference between
the numbers of advancing/declining statistics. In depth coverage of the McClellan Oscillator is provided in
their book “Patterns for Profit”.
© 2011 Visual Trading Systems, LLC
580
VT Trader 2.0 Help Manual
Interpretation
The Summation Index is interpreted in much the way same as the McClellan Oscillator is. Please refer
to the McClellan Oscillator's Notes for additional details.
Construction
1. Click the Ribbon>Technical Analysis menu>Indicators group>Indicator Builder command>
Indicator Builder window's [New] button
2. In the General tab, type the following text for each field:
Name: McClellan Summation Index
Function Name Alias: vt_McClellanSumIndex
Label Mask: McClellan Sum. Index (%Pr%,%Sh%,%Lg%,%mat%) = %McClSumIndex%
Placement: New Frame
Data Inspection Alias: McClellan Sum. Index
3. In the Input Variable(s) tab, create the following variables:
[New] button...
Name: pr
Display Name: Price
Type: price
Default: close
[New] button...
Name: Sh
Display Name: Short MA Periods
Type: integer
Default: 19
[New] button...
Name: Lg
Display Name: Long MA Periods
Type: integer
Default: 39
[New] button...
Name: mat
Display Name: MA Type
Type: MA Type
Default: Exponential
4. In the Output Variable(s) tab, create the following variables:
[New] button...
© 2011 Visual Trading Systems, LLC
Technical Indicators
581
Var Name: McClSumIndex
Name: (Sum Index)
Line Color: dark blue
Line Width: thin
Line Type: histogram
5. In the Horizontal Line tab, create the following lines:
[New] button...
Value: +0.0000
Color: black
Width: thin
Type: dashed
6. In the Formula tab, copy and paste the following formula:
McClSumIndex:= Cum(Mov(Pr,Sh,mat)-Mov(Pr,Lg,mat));
7. Click the "Save" icon to finish building the McClellan Summation Index indicator.
6.68
McGinley Dynamic
Overview
Developed by John McGinley in 1990 and published in the Market Technicians Association’s Journal Of
Technical Analysis 1997, the McGinley Dynamic attempts to overcome the problems of more traditional
simple and exponential moving averages by automatically adjusting itself relative to speed of the market.
This allows the McGinley Dynamic to follow prices move closely in fast and slow moving markets while
better avoiding price separation and whipsaws. The McGinley Dynamic is calculated by the formula:
Dynamic = D1 + (Price - D1) / (N * (Price/D1)^4)
Where:
D1 = previous value of Dynamic
N = smoothing factor (periods)
© 2011 Visual Trading Systems, LLC
582
VT Trader 2.0 Help Manual
Interpretation
McGinley believes that moving averages (and his Dynamic) should be used as smoothing mechanisms
rather than as trading systems or signal generators. However, the McGinley Dynamic can also be used
in place of traditional moving averages. Please refer to the "Moving Average" indicator for additional
details.
Construction
1. Click the Ribbon>Technical Analysis menu>Indicators group>Indicator Builder command>
Indicator Builder window's [New] button
2. In the General tab, type the following text for each field:
Name: McGinley Dynamic
Function Name Alias: vt_McGinleyDynamic
Label Mask: McGinley Dynamic (%prc%,%periods%) = %McGDynamic%
Placement: Price Frame
Data Inspection Alias: McGinley Dynamic
3. In the Input Variable(s) tab, create the following variables:
[New] button...
Name: prc
Display Name: Price
© 2011 Visual Trading Systems, LLC
Technical Indicators
583
Type: Price
Default: Close
[New] button...
Name: periods
Display Name: Periods
Type: integer (with bounds)
Default: 12
Min. Bounds: 1
Max. Bounds: 9999
4. In the Output Variable(s) tab, create the following variables:
[New] button...
Var Name: McGDynamic
Name: (Dynamic)
Line Color: dark blue
Line Width: slightly thicker
Line Type: solid
5. In the Horizontal Line tab, create the following variables:
This indicator requires no horizontal lines.
6. In the Formula tab, copy and paste the following formula:
McGDynamic:= Prev(prc)+(prc-Prev(prc))/(periods*Power(prc/Prev(prc),4));
7. Click the "Save" icon to finish building the McGinley Dynamic indicator.
6.69
Momentum
Overview
The momentum indicator is one of the simplest equations available in modern technical analysis.
Momentum is a measure of price change velocity calculated as the difference between the current bar's
price and the price a selected number of bars ago. Basically, it represents the rate of change of the
trading instrument's price over those specified time periods. The faster prices rise, the larger the
increase in momentum. The faster prices decline, the larger the decrease in momentum. As the price
movement begins to slow the momentum will also slow and return to a more median level.
© 2011 Visual Trading Systems, LLC
584
VT Trader 2.0 Help Manual
Interpretation
The Momentum indicator is a versatile indicator capable of producing a wide array of buy and sell
signals. However, there are three basic methods of interpreting the Momentum indicator:
Zero-Level Crossovers: A buy signal occurs when Momentum crosses above zero and a sell signal
occurs when momentum crosses below zero.
Extreme Overbought/Oversold Levels: To use Momentum as an overbought/oversold indicator, the user
must identify potential overbought and oversold levels based on previous indicator readings; When
choosing the overbought and oversold levels the user should ensure that at least two-thirds of previous
Momentum values fall between the overbought and oversold levels. Readings above the overbought level
imply an overbought condition (and a pending price correction) while readings below the oversold level
imply an oversold condition (and a pending rally).
Trend Line Breakouts: Trend lines can be drawn connecting the peaks and troughs of the Momentum
indicator. Often momentum begins to turn before price thereby making it a leading indicator. Momentum
readings breaking above a declining trend line warns of a possible bullish reversal while momentum
readings breaking below a rising trend line warns of a possible bearish reversal.
Construction
1. Click the Ribbon>Technical Analysis menu>Indicators group>Indicator Builder command>
Indicator Builder window's [New] button
© 2011 Visual Trading Systems, LLC
Technical Indicators
2. In the General tab, type the following text for each field:
Name: Momentum
Function Name Alias: vt_MOM
Label Mask: Momentum (%Pr%,%tPr%) = %Mom%
Placement: New Frame
Data Inspection Alias: Momentum
3. In the Input Variable(s) tab, create the following variables:
[New] button...
Name: Pr
Display Name: Price
Type: price
Default: close
[New] button...
Name: tPr
Display Name: Periods
Type: integer
Default: 10
4. In the Output Variable(s) tab, create the following variables:
[New] button...
Var Name: Mom
Name: (Momentum)
Line Color: blue
Line Width: thin
Line Type: solid
5. In the Horizontal Line tab, create the following lines:
[New] button...
Value: +0.0000
Color: black
Width: thin
Type: dashed
6. In the Formula tab, copy and paste the following formula:
Mom:= Pr - Ref(Pr,-tPr);
7. Click the "Save" icon to finish building the Momentum indicator.
6.70
Moving Average
Overview
© 2011 Visual Trading Systems, LLC
585
586
VT Trader 2.0 Help Manual
A Moving Average is an indicator that calculates the average value of prices (or any specified data
series) over a period of predetermined period of time.
VT Trader supports seven popular types of moving averages: simple, weighted, exponential, sine
weighted, triangular, end point, and volume-adjusted. Moving averages can be calculated on any data
series including a trading instrument's open, high, low, close, volume, or even another indicator.
The only significant difference between the various types of moving averages is the weight assigned to
the most recent data. Simple moving averages apply equal weight to the prices. Exponential and
weighted averages apply more weight to recent prices. Triangular averages apply more weight to prices
in the middle of the time period.
Interpretation
The most popular method of interpreting a moving average is to compare the relationship between a
moving average of the price with the price itself. A buy signal is generated when the price rises above its
moving average and a sell signal is generated when the price falls below its moving average.
Also popular are various types of moving average crossover systems. Such systems often include two or
more moving averages crossing above/below each other and perhaps even utilizing other indicators as
additional entry and exit confirmation signals. The combinations of conditions for these types of systems
are almost limitless!
Moving averages can also be calculated and plotted on indicators. The interpretation of an indicator's
moving average is similar to the interpretation of the price’s moving average: when the indicator rises
© 2011 Visual Trading Systems, LLC
Technical Indicators
587
above its moving average, it signifies a continued upward movement by the indicator; when the indicator
falls below its moving average, it signifies a continued downward movement by the indicator.
Construction
1. Click the Ribbon>Technical Analysis menu>Indicators group>Indicator Builder command>
Indicator Builder window's [New] button
2. In the General tab, type the following text for each field:
Name: Moving Average
Function Name Alias: vt_MOV
Label Mask: Moving Average (%Pr%,%tPr%,%mt%,%VShift%,%HShift%) = %MA%
Placement: Price Frame
Data Inspection Alias: Moving Average
3. In the Input Variable(s) tab, create the following variables:
[New] button...
Name: Pr
Display Name: Price
Type: price
Default: close
[New] button...
Name: tPr
Display Name: Periods
Type: integer
Default: 13
[New] button...
Name: mt
Display Name: MA Type
Type: MA Type
Default: Simple
[New] button...
Name: VShift
Display Name: Vertical Shift %
Type: float (with bounds)
Default: 0.0000
Min Bounds: -9999.0000
Max Bounds:= 9999.0000
[New] button...
Name: HShift
Display Name: Horizontal Shift
Type: Bars Forward
Default: 0
Min Bounds: 0
Max Bounds:= 9999
© 2011 Visual Trading Systems, LLC
588
VT Trader 2.0 Help Manual
4. In the Output Variable(s) tab, create the following variables:
[New] button...
Var Name: MA
Name: (MA)
Line Color: red
Line Width: thin
Line Type: solid
5. In the Horizontal Line tab, create the following lines:
This indicator requires no horizontal lines.
6. In the Formula tab, copy and paste the following formula:
DataBars:= Ref(Pr,-HShift);
tmpMV:= Mov(DataBars,tPr,mt);
MA:= tmpMV+((tmpMV*VShift)/100);
7. Click the "Save" icon to finish building the Moving Average indicator.
6.71
Moving Average Envelope
Overview
The Moving Average Envelope indicator creates upper and lower channel lines plotted an equidistant %
(or number of pips) above and below the moving average.
© 2011 Visual Trading Systems, LLC
Technical Indicators
589
Interpretation
While several different trading rules are available, the simplest approach uses price penetrating the upper
channel to initiate long positions and price penetrating the lower channel initiate short positions.
An alternative to the above methods when the market is more range bound is to use price touching the
upper channel to go short price touching the lower channel to go long.
Construction
1. Click the Ribbon>Technical Analysis menu>Indicators group>Indicator Builder command>
Indicator Builder window's [New] button
2. In the General tab, type the following text for each field:
Name: Moving Average Envelope
Function Name Alias: vt_MaEnv
Label Mask:
Moving Average Envelope (%Pr%,%tPr%,%mt%,%VShift%,%HShift%,%prcnt%,%
pips%)
Upper = %UC%, Lower = %LC%, MA = %DisplayMA%
Placement: Price Frame
Data Inspection Alias: MA Envelope
3. In the Input Variable(s) tab, create the following variables:
© 2011 Visual Trading Systems, LLC
590
VT Trader 2.0 Help Manual
[New] button...
Name: Pr
Display Name: MA Price
Type: price
Default: close
[New] button...
Name: tPr
Display Name: MA Periods
Type: integer
Default: 13
[New] button...
Name: mt
Display Name: MA Type
Type: MA Type
Default: Simple
[New] button...
Name: VShift
Display Name: MA Vertical Shift %
Type: float (with bounds)
Default: 0.0000
Min Bounds: -9999.0000
Max Bounds:= 9999.0000
[New] button...
Name: HShift
Display Name: MA Horizontal Shift
Type: Bars Forward
Default: 0
Min Bounds: 0
Max Bounds:= 9999
[New] button...
Name: HShift
Display Name: MA Horizontal Shift
Type: Bars Forward
Default: 0
Min Bounds: 0
Max Bounds:= 9999
[New] button...
Name: EType
Display Name: Type of MA Envelope
Type: Enumeration
Default: click [...] button, [New] button, then create the following
entries:
Percentage_Based
Pip_Based
... then, click [OK] button
Default: Percentage_Based
© 2011 Visual Trading Systems, LLC
Technical Indicators
591
[New] button...
Name: prcnt
Display Name: MA Envelope % (if % Based)
Type: float
Default: 0.1000
[New] button...
Name: pips
Display Name: MA Envelope Pips (if Pip Based)
Type: integer
Default: 20
[New] button...
Name: ShowMA
Display Name: Display Center MA?
Type: Enumeration
Default: click [...] button, [New] button, then create the following
entries:
No
Yes
... then, click [OK] button
Default: Yes
4. In the Output Variable(s) tab, create the following variables:
[New] button...
Var Name: UC
Name: (Upper Channel)
Line Color: dark blue
Line Width: thin
Line Type: solid
[New] button...
Var Name: DisplayMA
Name: (Moving Average)
Line Color: dark green
Line Width: thin
Line Type: dashed
[New] button...
Var Name: LC
Name: (Lower Channel)
Line Color: dark blue
Line Width: thin
Line Type: solid
5. In the Horizontal Line tab, create the following lines:
This indicator requires no horizontal lines.
6. In the Formula tab, copy and paste the following formula:
© 2011 Visual Trading Systems, LLC
592
VT Trader 2.0 Help Manual
DataBars:= Ref(Pr,-HShift);
tmpMV:= Mov(DataBars,tPr,mt);
MA:= tmpMV+((tmpMV*VShift)/100);
UC:= if(EType=0, MA + (MA * (prcnt/100)), MA + (Pips*SymbolPoint()));
LC:= if(EType=0, MA - (MA * (prcnt/100)), MA - (Pips*SymbolPoint()));
DisplayMA:= if(ShowMA=1, MA, null);
7. Click the "Save" icon to finish building the Moving Average Envelope indicator.
6.72
Moving Averages of RSI
Overview
The Moving Averages (MA’s) of RSI indicator consists of a Relative Strength Index (RSI) indicator and
two moving averages or the RSI (fast and slow). The Fast MA of RSI and Slow MA of RSI are
constructed by calculating different n-periods moving averages of RSI.
Interpretation
There are several different methods in which the MA’s of RSI indicator can be used to generate trading
signals. Here are few of the more common techniques:
© 2011 Visual Trading Systems, LLC
Technical Indicators
593
Crossovers: 1) RSI / Fast MA or Slow MA Crossover: A buy signal occurs when the RSI crosses above
the Fast MA or Slow MA and a sell signal occurs when RSI crosses below the Fast MA or Slow MA. 2)
RSI / 50-level Crossover: When the RSI crosses above 50 a buy signal is given. Alternatively, when the
RSI crosses below 50 a sell signal is given. 3) Fast MA / Slow MA Crossover: A buy signal occurs when
the Fast MA crosses above the Slow MA and a sell signal occurs when Fast MA crosses below the
Slow MA.
Divergence: Looking for divergences between the MA’s of RSI indicator and price can prove to be very
effective in identifying potential reversal points in price movement. Trade long on Classic Bullish
Divergence: Lower lows in price and higher lows in the RSI or the MA’s of RSI; Trade short on Classic
Bearish Divergence: Higher highs in price and lower highs in the RSI or the MA’s of RSI.
Overbought/Oversold Conditions: Much like the original RSI (and other oscillators), the MA’s of RSI
indicator can be used to identify potential overbought and oversold conditions in price movements. An
Overbought condition is generally described as the RSI or the MA’s of RSI being greater than or equal to
the 70% level while an oversold condition is generally described as the RSI or MA’s of RSI being less
than or equal to the 30% level. Trades can be generated when any of the MA’s of RSI outputs (RSI, Fast
MA or Slow MA) crosses these levels. When the RSI, Fast MA or Slow MA crosses above 30 a buy
signal is given. Alternatively, when the RSI, Fast MA or Slow MA crosses below 70 a sell signal is given.
Construction
1. Click the Ribbon>Technical Analysis menu>Indicators group>Indicator Builder command>
Indicator Builder window's [New] button
2. In the General tab, type the following text for each field:
Name: Moving Averages of Relative Strength Index (MA's of RSI)
Function Name Alias: vt_MARSIndex
Label Mask:
MA's of RSI (%pr%,%tpr%,%MA1pr%,%MA1type%,%MA2pr%,%MA2type%)
RSI = %RS%, Fast MA = %FastMA%, Slow MA = %SlowMA%
Placement: New Frame
Data Inspection Alias: MA's of RSI
3. In the Input Variable(s) tab, create the following variables:
[New] button...
Name: pr
Display Name: RSI Price
Type: price
Default: close
[New] button...
Name: tpr
Display Name: RSI Periods
Type: integer
Default: 14
[New] button...
© 2011 Visual Trading Systems, LLC
594
VT Trader 2.0 Help Manual
Name: MA1pr
Display Name: Fast MA Periods
Type: integer
Default: 10
[New] button...
Name: MA1type
Display Name: Fast MA Type
Type: MA Type
Default: Exponential
[New] button...
Name: MA2pr
Display Name: Slow MA Periods
Type: integer
Default: 30
[New] button...
Name: MA2type
Display Name: Slow MA Type
Type: MA Type
Default: Exponential
4. In the Output Variable(s) tab, create the following variables:
[New] button...
Var Name: RS
Name: (RSI)
Line Color: dark green
Line Width: slightly thicker
Line Type: solid
[New] button...
Var Name: FastMA
Name: (Fast MA)
Line Color: blue
Line Width: thin
Line Type: solid
[New] button...
Var Name: SlowMA
Name: (Slow MA)
Line Color: red
Line Width: thin
Line Type: solid
5. In the Horizontal Line tab, create the following lines:
[New] button...
Value: +70.0000
Color: red
Width: thin
Type: dashed
© 2011 Visual Trading Systems, LLC
Technical Indicators
595
[New] button...
Value: +50.0000
Color: gray
Width: thin
Type: dashed
[New] button...
Value: +30.0000
Color: red
Width: thin
Type: dashed
6. In the Formula tab, copy and paste the following formula:
{Relative Strength Index}
rsi_r:= (pr - ref(pr,-1));
rsi_rs:= Wilders(if(rsi_r>0,rsi_r,0),tpr) / Wilders(if(rsi_r<0,Abs
(rsi_r),0),tpr);
RS:= 100-(100/(1+rsi_rs));
{Moving Averages of Relative Strength Index}
FastMA:= mov(RS,MA1pr,MA1type);
SlowMA:= mov(RS,MA2pr,MA2type);
7. Click the "Save" icon to finish building the MA's of RSI indicator.
6.73
Moving Slope Rate of Change
Overview
The Moving Slope Rate of Change (MSROC) Indicator is discussed in the Two Moving Function Hybrids
article written by William Rafter in the September 2005 issue of Technical Analysis of Stocks and
Commodities magazine.
The MSROC is created by first calculating the linear regression slope over n-periods using the least
squares fit method and then calculating the ROC of that regression line. Because of the use of the linear
regression slope rather than raw price, it is smoother and more responsive than the Rate of Change
(ROC) indicator.
© 2011 Visual Trading Systems, LLC
596
VT Trader 2.0 Help Manual
Interpretation
Trading opportunities can be derived from the MSROC crossing above and below the zero line.
Construction
1. Click the Ribbon>Technical Analysis menu>Indicators group>Indicator Builder command>
Indicator Builder window's [New] button
2. In the General tab, type the following text for each field:
Name: Moving Slope Rate of Change
Function Name Alias: vt_MSROC
Label Mask: Moving Slope ROC (%prc%,%periods%) = %MSROC%
Placement: New Frame
Data Inspection Alias: Moving Slope ROC
3. In the Input Variable(s) tab, create the following variables:
[New] button...
Name: Prc
Display Name: Price
Type: price
Default: close
© 2011 Visual Trading Systems, LLC
Technical Indicators
597
[New] button...
Name: periods
Display Name: Periods
Type: integer
Default: 25
4. In the Output Variable(s) tab, create the following variables:
[New] button...
Var Name: MSROC
Name: (MSROC)
Line Color: purple
Line Width: slightly thicker
Line Type: solid
5. In the Horizontal Line tab, create the following lines:
[New] button...
Value: +0.0000
Color: black
Width: thin
Type: dashed
6. In the Formula tab, copy and paste the following formula:
LinRegLine:= LinRegSlope(Prc,periods);
MSROC:= ROC(LinRegLine,periods,Points);
7. Click the "Save" icon to finish building the Moving Slope Rate of Change indicator.
6.74
Parabolic SAR
Overview
The Parabolic Time/Price System, developed by Welles Wilder, is used to set trailing price stops and is
usually referred to as the "SAR" (stop-and-reversal). This indicator is explained thoroughly in Wilder's
book, "New Concepts in Technical Trading Systems".
© 2011 Visual Trading Systems, LLC
598
VT Trader 2.0 Help Manual
Interpretation
The Parabolic SAR provides excellent exit points. It is suggested to close long positions when the price
falls below the SAR and close short positions when the price rises above the SAR.
If the price is above the SAR, the SAR will move up every day, regardless of the direction the price is
moving. The amount the SAR moves up depends on the amount that prices move. If the price is below
the SAR, the SAR will move down every day, regardless of the direction the price is moving. The
amount the SAR moves up or down depends on the amount that prices move.
Construction
1. Click the Ribbon>Technical Analysis menu>Indicators group>Indicator Builder command>
Indicator Builder window's [New] button
2. In the General tab, type the following text for each field:
Name: Parabolic SAR
Function Name Alias: vt_SAR
Label Mask: Parabolic SAR (%Step%,%Maximum%) = %SR%
Placement: Price Frame
Data Inspection Alias: Parabolic SAR
3. In the Input Variable(s) tab, create the following variables:
© 2011 Visual Trading Systems, LLC
Technical Indicators
599
[New] button...
Name: Step
Display Name: Step
Type: float (with bounds)
Default: 0.0200
Min Bounds: 0.0010
Max Bounds: 0.1000
[New] button...
Name: Maximum
Display Name: Maximum
Type: float (with bounds)
Default: 0.2000
Min Bounds: 0.0100
Max Bounds: 1.0000
4. In the Output Variable(s) tab, create the following variables:
[New] button...
Var Name: SR
Name: (PSAR)
Line Color: dark blue
Line Width: thin
Line Type: dots
5. In the Horizontal Line tab, create the following lines:
This indicator requires no horizontal lines.
6. In the Formula tab, copy and paste the following formula:
SR:= SAR(Step,Maximum);
7. Click the "Save" icon to finish building the Parabolic SAR indicator.
6.75
Percentage Price Oscillator
Overview
The Percentage Price Oscillator (PPO) is a momentum oscillator with some trend-following
characteristics. It expresses the difference between two moving averages as a percentage value that
quantifies where the fast moving average is in relation to the slow moving average. The Percentage Price
Oscillator is very similar to the Moving Average Convergence/Divergence (MACD), except the MACD
expresses the difference of two moving averages as an absolute value. Expressing the difference as a
percentage value makes it easier to compare trading instruments with difference prices.
The PPO is calculated by the formula:
© 2011 Visual Trading Systems, LLC
600
VT Trader 2.0 Help Manual
PPO = (fast moving average – slow moving average) / slow moving average
Sometimes an additional “signal” (trigger) line is then calculated from the PPO. The signal line is a
moving average of the PPO. An additional histogram may also be calculated. The histogram is
calculated as the difference between the PPO and its signal line.
Interpretation
The Percentage Price Oscillator is widely used as a trend-following indicator and tends to work most
effectively when measuring wide-swinging market movements. There are three basic techniques for using
the PPO to generate trading signals.
PPO / Zero-Level Crossover: When the PPO crosses above zero a buy signal is given. Alternatively,
when the PPO crosses below zero a sell signal is given.
PPO / Signal line Crossover: A buy signal occurs when the PPO crosses above its Signal line and a sell
signal occurs when the PP crosses below its Signal line.
Divergence: Looking for divergences between the PPO and price can prove to be very effective in
identifying potential reversal and/or trend continuation points in price movement. There are several types
of divergences:
Classic Divergence (aka: Regular Divergence)
Bullish Divergence = Lower lows in price and higher lows in the PPO
Bearish Divergence = Higher highs in price and lower highs in the PPO
© 2011 Visual Trading Systems, LLC
Technical Indicators
601
Hidden Divergence (aka: Reverse, Continuation, or Trend Divergence)
Bullish Divergence = Lower lows in PPO and higher lows in price
Bearish Divergence = Higher highs in PPO and lower highs in price
Construction
1. Click the Ribbon>Technical Analysis menu>Indicators group>Indicator Builder command>
Indicator Builder window's [New] button
2. In the General tab, type the following text for each field:
Name: Percentage Price Oscillator (PPO)
Function Name Alias: vt_PPO
Label Mask:
%% Price Osc. (%FmaPeriods%,%SmaPeriods%,%SigMaPeriods%)
PPO = %PPO%
Signal = %PPO_Signal%
Placement: New Frame
Data Inspection Alias: % Price Osc.
3. In the Input Variable(s) tab, create the following variables:
[New] button...
Name: FmaPrice
Display Name: Fast MA Price
Type: price
Default: close
[New] button...
Name: FmaPeriods
Display Name: Fast MA Periods
Default: 9
Min. Bounds: 1
Max. Bounds: 9999
[New] button...
Name: FmaType
Display Name: Fast MA Type
Type: MA Type
Default: Exponential
[New] button...
Name: SmaPrice
Display Name: Slow MA Price
Type: price
Default: close
[New] button...
Name: SmaPeriods
© 2011 Visual Trading Systems, LLC
602
VT Trader 2.0 Help Manual
Display Name: Slow MA Periods
Default: 26
Min. Bounds: 1
Max. Bounds: 9999
[New] button...
Name: SmaType
Display Name: Slow MA Type
Type: MA Type
Default: Exponential
[New] button...
Name: SigMaPeriods
Display Name: Signal MA Periods
Type: integer (with bounds)
Default: 9
Min. Bounds: 1
Max. Bounds: 9999
[New] button...
Name: SigMaType
Display Name: Signal MA Type
Type: MA Type
Default: Exponential
4. In the Output Variable(s) tab, create the following variables:
[New] button...
Var Name: PPO
Name: (PPO)
Line Color: dark blue
Line Width: thin
Line Type: solid
[New] button...
Var Name: PPO_Signal
Name: (Signal)
Line Color: dark red
Line Width: thin
Line Type: solid
[New] button...
Var Name: PPO_Histogram
Name: (Histogram)
Line Color: dark green
Line Width: thin
Line Type: histogram
5. In the Horizontal Line tab, create the following lines:
[New] button...
Value: +0.0000
Color: black
© 2011 Visual Trading Systems, LLC
Technical Indicators
603
Width: thin
Type: dashed
6. In the Formula tab, copy and paste the following formula:
FastMa:= Mov(FmaPrice,FmaPeriods,FmaType);
SlowMa:= Mov(SmaPrice,SmaPeriods,SmaType);
PPO:= (FastMa-SlowMa)/SlowMa;
PPO_Signal:= Mov(PPO,SigMaPeriods,SigMaType);
PPO_Histogram:= PPO - PPO_Signal;
7. Click the "Save" icon to finish building the Percentage Price Oscillator indicator.
6.76
Pivot Points - 24-Hour Cycle
Overview
Pivot points consist of a central pivot level surrounded by three support levels below it and three
resistance levels above it. Pivot points were originally used by floor traders on equity and futures
exchanges because they provided a quick way for those traders to get a general idea of how the market
was moving during the course of the day using only a few simple calculations. However, over time pivot
points have also proved exceptionally useful in other markets as well.
One of the reasons that pivot points are now so popular is because they are considered a "leading" (or
predictive) indicator rather than a lagging indicator. All that is required to calculate the pivot points for the
upcoming (current) trading day is the previous day's high, low, and close prices. For 24-hour markets
like Forex, each broker determines when the trading day closes for their clients; however, 4:00PM ET or
5:00PM ET are common as a daily closing time (except on Friday when some brok ers may end trading
earlier).
The 24-hour cycle pivot points in this indicator are calculated according to the following formulas:
Pivot Point for Current 24-Hour Cycle = (High(Previous 24-Hour Cycle) + Low(Previous 24-Hour Cycle) +
Close(Previous 24-Hour Cycle)) / 3
The central pivot point can then be used to calculate the support and resistance levels as follows:
Resistance 1 = (2 * Pivot Point) - Low(Previous 24-Hour Cycle)
Support 1 = (2 * Pivot Point) - High(Previous 24-Hour Cycle)
Resistance 2 = (Pivot Point - Support 1) + Resistance 1
Support 2 = Pivot Point - (Resistance 1 - Support 1)
Resistance 3 = (Pivot Point - Support 2) + Resistance 2
Support 3 = Pivot Point - (Resistance 2 - Support 2)
VT Trader also includes support and resistance mid-levels that are calculated as follows:
© 2011 Visual Trading Systems, LLC
604
VT Trader 2.0 Help Manual
Resistance Mid-Level 1 = (Pivot Point + Resistance 1) / 2
Support Mid-Level 1 = (Pivot Point + Support 1) / 2
Resistance Mid-Level 2 = (Resistance 1 + Resistance 2) / 2
Support Mid-Level 2 = (Support 1 + Support 2) / 2
Resistance Mid-Level 3 = (Resistance 2 + Resistance 3) / 2
Support Mid-Level 3 = (Support 2 + Support 3) / 2
Interpretation
Pivot point levels can be used in many different ways. Here are a few of the most common methods for
utilizing them.
Trend Direction Determined by Pivot Point: Combined with other technical analysis techniques such as
overbought/oversold oscillators, volatility measurements, etc., the central pivot point may be useful in
determining the general trending direction of the market. Trades are only taken in the direction of the
trend. Buy trades occur only when the price is above the central pivot point and sell trades occur only
when the price is below the central pivot point.
Price Breakouts: When trading price breakouts, a buy signal occurs when the price breaks up through
the central pivot point or one of the resistance levels (typically Resistance 1). A sell signal occurs when
price breaks down through the central pivot point or one of the support levels (typically Support 1).
Price Reversals: When trading price reversals, a buy signal occurs when the price moves towards a
support level, gets very close to it, touches it, or moves only slightly through it, and then reverses and
moves back in the opposite direction. A sell signal occurs when the price moves towards a resistance
© 2011 Visual Trading Systems, LLC
Technical Indicators
605
level, gets very close to it, touches it, or moves only slightly through it, and then reverses and moves
back in the opposite direction.
Stop loss and/or Limit Profit Values Determined by Support/Resistance Levels: The central pivot point
and its support and resistance levels may be potentially helpful in determining suitable stop loss and/or
limit profit placements. For example, if trading a long breakout above the Resistance 1 level it may be
reasonable to position a stop loss order just below the central pivot point and one or more limit profit(s)
orders at the Resistance 2 and/or Resistance 3 levels.
Implementation
This Pivot Points indicator calculates the pivot points using a 24-hour cycle that resets at the specified
predetermined time each day. The Calculation Time (Hour/Minute) is defined using a 24-hour clock (AM/
PM is not used). For example, setting the Calculation Hour equal to 9 and the Calculation Minute to 00
recalculates the pivot points each day at 9:00 AM while setting the Calculation Hour equal to 17 and the
Calculation Minute to 30 recalculates the pivot points each day at 5:30PM.
Please Note: This indicator will not function properly on the following chart intervals: Tick , Daily, Week ly,
or Monthly. It is not possible for VT Trader to load enough tick data into a Tick chart interval for the
indicator to properly calculate the pivot points and the calculations performed are not designed (nor can
they be reprogrammed) to function in the Daily, Week ly, or Monthly chart intervals.
If the pivot points are not shown in the chart window once the indicator is attached, you may need to
increase the number of bars that VT Trader loads into its charts. As minimum amounts, VT Trader
should load 3,000+ bars into its charts if you intend to attach this Pivot Points indicator to any 1-Minute
interval charts or 750+ bars if you intend to attach it to any 5-Minute or higher intraday interval charts.
Construction
1. Click the Ribbon>Technical Analysis menu>Indicators group>Indicator Builder command>
Indicator Builder window's [New] button
2. In the General tab, type the following text for each field:
Name: Pivot Points - 24-Hour Cycle
Function Name Alias: vt_PPI
Label Mask:
Pivot Points - 24-Hour Cycle (Calculation Time: %CalculationHour%:%
CalculationMinute%)
PP = %PivotPoint%, R1 = %Resistance1%, R2 = %Resistance2%, R3 = %
Resistance3%
S1 = %Support1%, S2 = %Support2%, S3 = %Support3%
Placement: Price Frame
Data Inspection Alias: Pivot Points - 24-Hour Cycle
3. In the Input Variable(s) tab, create the following variables:
[New] button...
Name: CalculationHour
© 2011 Visual Trading Systems, LLC
606
VT Trader 2.0 Help Manual
Display Name: Calculation Hour
Type: integer
Default: 17
[New] button...
Name: CalculationMinute
Display Name: Calculation Minute
Type: integer
Default: 0
[New] button...
Name: ShowMidLevels
Display Name: Show Mid-Levels?
Type: Enumeration
Default: click [...] button, [New] button, then create the following
entries:
No
Yes
... then, click [OK] button
Default: No
4. In the Output Variable(s) tab, create the following variables:
[New] button...
Var Name: Resistance3
Name: (R3)
Line Color: light blue
Line Width: slightly thicker
Line Type: solid
[New] button...
Var Name: ResistanceMidLevel3
Name: (R3 ML)
Line Color: light blue
Line Width: thin
Line Type: dashed
[New] button...
Var Name: Resistance2
Name: (R2)
Line Color: blue
Line Width: slightly thicker
Line Type: solid
[New] button...
Var Name: ResistanceMidLevel2
Name: (R2 ML)
Line Color: blue
Line Width: thin
Line Type: dashed
[New] button...
Var Name: Resistance1
© 2011 Visual Trading Systems, LLC
Technical Indicators
Name: (R1)
Line Color: dark blue
Line Width: slightly thicker
Line Type: solid
[New] button...
Var Name: ResistanceMidLevel1
Name: (R1 ML)
Line Color: dark blue
Line Width: thin
Line Type: dashed
[New] button...
Var Name: PivotPoint
Name: (Pivot Point)
Line Color: black
Line Width: very thick
Line Type: solid
[New] button...
Var Name: SupportMidLevel1
Name: (S1 ML)
Line Color: dark red
Line Width: thin
Line Type: dashed
[New] button...
Var Name: Support1
Name: (S1)
Line Color: dark red
Line Width: slightly thicker
Line Type: solid
[New] button...
Var Name: SupportMidLevel2
Name: (S2 ML)
Line Color: red
Line Width: thin
Line Type: dashed
[New] button...
Var Name: Support2
Name: (S2)
Line Color: red
Line Width: slightly thicker
Line Type: solid
[New] button...
Var Name: SupportMidLevel3
Name: (S3 ML)
Line Color: light red
Line Width: thin
Line Type: dashed
© 2011 Visual Trading Systems, LLC
607
608
VT Trader 2.0 Help Manual
[New] button...
Var Name: Support3
Name: (S3)
Line Color: light red
Line Width: slightly thicker
Line Type: solid
5. In the Horizontal Line tab, create the following lines:
This indicator requires no horizontal lines.
6. In the Formula tab, copy and paste the following formula:
_Hour:= Hour();
_Minute:= Minute();
CalculationTime:= Cross((_Hour=CalculationHour AND
_Minute>=CalculationMinute),0.5);
CalculateLookBackPeriods:= Barssince(CalculationTime=1);
LookBackPeriods:= valuewhen(1, Cross(0.5,CalculateLookBackperiods), ref
(CalculateLookBackPeriods,-1));
_H:= valuewhen(1,CalculationTime=1,ref(HHV(H,LookBackPeriods),-1));
_L:= valuewhen(1,CalculationTime=1,ref(LLV(L,LookBackPeriods),-1));
_C:= valuewhen(1,CalculationTime=1,C);
PivotPoint:= (_H+_L+_C)/3;
Resistance1:= 2 * PivotPoint - _L;
Resistance2:= PivotPoint + (_H-_L);
Resistance3:= 2 * PivotPoint + (_H-2*_L);
Support1:= 2 * PivotPoint - _H;
Support2:= PivotPoint - (_H-_L);
Support3:= 2 * PivotPoint - (2*_H-_L);
ResistanceMidLevel1:= if(ShowMidLevels=1, (PivotPoint+Resistance1)/2,
null);
ResistanceMidLevel2:= if(ShowMidLevels=1, (Resistance1+Resistance2)/2,
null);
ResistanceMidLevel3:= if(ShowMidLevels=1, (Resistance2+Resistance3)/2,
null);
SupportMidLevel1:= if(ShowMidLevels=1, (PivotPoint+Support1)/2, null);
SupportMidLevel2:= if(ShowMidLevels=1, (Support1+Support2)/2, null);
SupportMidLevel3:= if(ShowMidLevels=1, (Support2+Support3)/2, null);
7. Click the "Save" icon to finish building the Pivot Points - 24-Hour Cycle indicator.
© 2011 Visual Trading Systems, LLC
Technical Indicators
6.77
609
Pivot Points - 24-Hour Cycle - Fibonacci Ratios
Overview
Pivot points consist of a central pivot level surrounded by three support levels below it and three
resistance levels above it. This pivot points indicator replaces the traditional formulas used to calculate
the support and resistance levels with Fibonacci-based formulas. Pivot points (calculated using the
traditional formulas) were originally used by floor traders on equity and futures exchanges because they
provided a quick way for those traders to get a general idea of how the market was moving during the
course of the day using only a few simple calculations. However, over time pivot points have also proved
exceptionally useful in other markets as well.
One of the reasons that pivot points are now so popular is because they are considered a "leading" (or
predictive) indicator rather than a lagging indicator. All that is required to calculate the pivot points for the
upcoming (current) trading day is the previous day's high, low, and close prices. For 24-hour markets
like Forex, each broker determines when the trading day closes for their clients; however, 4:00PM ET or
5:00PM ET are common as a daily closing time (except on Friday when some brok ers may end trading
earlier).
The 24-hour cycle pivot points in this indicator are calculated according to the following formulas:
Pivot Point for Current 24-Hour Cycle = (High(Previous 24-Hour Cycle) + Low(Previous 24-Hour Cycle) +
Close(Previous 24-Hour Cycle)) / 3
With the central pivot point level already calculated, the support and resistance levels are determined by
calculating the previous cycle's high/low price range along with several Fibonacci-based percentages of
that price range and then adding those % values to (for resistance levels) or subtracting those % values
from (for support levels) the central pivot point. The support levels' and resistance levels' formulas are as
follows:
Resistance 1 = Pivot Point + ((High(Previous 24-Hour Cycle) - Low(Previous 24-Hour Cycle)) * 0.382)
Support 1 = Pivot Point - ((High(Previous 24-Hour Cycle) - Low(Previous 24-Hour Cycle)) * 0.382)
Resistance 2 = Pivot Point + ((High(Previous 24-Hour Cycle) - Low(Previous 24-Hour Cycle)) * 0.618)
Support 2 = Pivot Point - ((High(Previous 24-Hour Cycle) - Low(Previous 24-Hour Cycle)) * 0.618)
Resistance 3 = Pivot Point + ((High(Previous 24-Hour Cycle) - Low(Previous 24-Hour Cycle)) * 1.000)
Support 3 = Pivot Point - ((High(Previous 24-Hour Cycle) - Low(Previous 24-Hour Cycle)) * 1.000)
© 2011 Visual Trading Systems, LLC
610
VT Trader 2.0 Help Manual
Interpretation
Pivot point levels can be used in many different ways. Here are a few of the most common methods for
utilizing them.
Trend Direction Determined by Pivot Point: Combined with other technical analysis techniques such as
overbought/oversold oscillators, volatility measurements, etc., the central pivot point may be useful in
determining the general trending direction of the market. Trades are only taken in the direction of the
trend. Buy trades occur only when the price is above the central pivot point and sell trades occur only
when the price is below the central pivot point.
Price Breakouts: When trading price breakouts, a buy signal occurs when the price breaks up through
the central pivot point or one of the resistance levels (typically Resistance 1). A sell signal occurs when
price breaks down through the central pivot point or one of the support levels (typically Support 1).
Price Reversals: When trading price reversals, a buy signal occurs when the price moves towards a
support level, gets very close to it, touches it, or moves only slightly through it, and then reverses and
moves back in the opposite direction. A sell signal occurs when the price moves towards a resistance
level, gets very close to it, touches it, or moves only slightly through it, and then reverses and moves
back in the opposite direction.
Stop loss and/or Limit Profit Values Determined by Support/Resistance Levels: The central pivot point
and its support and resistance levels may be potentially helpful in determining suitable stop loss and/or
limit profit placements. For example, if trading a long breakout above the Resistance 1 level it may be
reasonable to position a stop loss order just below the central pivot point and one or more limit profit(s)
orders at the Resistance 2 and/or Resistance 3 levels.
© 2011 Visual Trading Systems, LLC
Technical Indicators
611
Implementation
This Pivot Points indicator calculates the pivot points using a 24-hour cycle that resets at the specified
predetermined time each day. The Calculation Time (Hour/Minute) is defined using a 24-hour clock (AM/
PM is not used). For example, setting the Calculation Hour equal to 9 and the Calculation Minute to 00
recalculates the pivot points each day at 9:00 AM while setting the Calculation Hour equal to 17 and the
Calculation Minute to 30 recalculates the pivot points each day at 5:30PM.
Please Note: This indicator will not function properly on the following chart intervals: Tick , Daily, Week ly,
or Monthly. It is not possible for VT Trader to load enough tick data into a Tick chart interval for the
indicator to properly calculate the pivot points and the calculations performed are not designed (nor can
they be reprogrammed) to function in the Daily, Week ly, or Monthly chart intervals.
If the pivot points are not shown in the chart window once the indicator is attached, you may need to
increase the number of bars that VT Trader loads into its charts. As minimum amounts, VT Trader
should load 3,000+ bars into its charts if you intend to attach this Pivot Points indicator to any 1-Minute
interval charts or 750+ bars if you intend to attach it to any 5-Minute or higher intraday interval charts.
Construction
1. Click the Ribbon>Technical Analysis menu>Indicators group>Indicator Builder command>
Indicator Builder window's [New] button
2. In the General tab, type the following text for each field:
Name: Pivot Points - 24-Hour Cycle - Fibonacci Ratios
Function Name Alias: vt_PPIFibs
Label Mask:
Pivot Points - 24-Hour Cycle - Fibonacci Ratios (Calculation Time: %
CalculationHour%:%CalculationMinute%)
PP = %PivotPoint%, R1 = %Resistance1%, R2 = %Resistance2%, R3 = %
Resistance3%
S1 = %Support1%, S2 = %Support2%, S3 = %Support3%
Placement: Price Frame
Data Inspection Alias: Pivot Points - 24-Hour Cycle - Fibonacci
3. In the Input Variable(s) tab, create the following variables:
[New] button...
Name: CalculationHour
Display Name: Calculation Hour
Type: integer
Default: 17
[New] button...
Name: CalculationMinute
Display Name: Calculation Minute
Type: integer
Default: 0
© 2011 Visual Trading Systems, LLC
612
VT Trader 2.0 Help Manual
4. In the Output Variable(s) tab, create the following variables:
[New] button...
Var Name: Resistance3
Name: (R3)
Line Color: light blue
Line Width: slightly thicker
Line Type: solid
[New] button...
Var Name: Resistance2
Name: (R2)
Line Color: blue
Line Width: slightly thicker
Line Type: solid
[New] button...
Var Name: Resistance1
Name: (R1)
Line Color: dark blue
Line Width: slightly thicker
Line Type: solid
[New] button...
Var Name: PivotPoint
Name: (Pivot Point)
Line Color: black
Line Width: very thick
Line Type: solid
[New] button...
Var Name: Support1
Name: (S1)
Line Color: dark red
Line Width: slightly thicker
Line Type: solid
[New] button...
Var Name: Support2
Name: (S2)
Line Color: red
Line Width: slightly thicker
Line Type: solid
[New] button...
Var Name: Support3
Name: (S3)
Line Color: light red
Line Width: slightly thicker
Line Type: solid
5. In the Horizontal Line tab, create the following lines:
© 2011 Visual Trading Systems, LLC
Technical Indicators
613
This indicator requires no horizontal lines.
6. In the Formula tab, copy and paste the following formula:
_Hour:= Hour();
_Minute:= Minute();
CalculationTime:= Cross((_Hour=CalculationHour AND
_Minute>=CalculationMinute),0.5);
CalculateLookBackPeriods:= Barssince(CalculationTime=1);
LookBackPeriods:= valuewhen(1, Cross(0.5,CalculateLookBackperiods), ref
(CalculateLookBackPeriods,-1));
_H:= valuewhen(1,CalculationTime=1,ref(HHV(H,LookBackPeriods),-1));
_L:= valuewhen(1,CalculationTime=1,ref(LLV(L,LookBackPeriods),-1));
_C:= valuewhen(1,CalculationTime=1,C);
PivotPoint:= (_H+_L+_C)/3;
Resistance1:= PivotPoint + ((_H-_L) * 0.382);
Resistance2:= PivotPoint + ((_H-_L) * 0.618);
Resistance3:= PivotPoint + ((_H-_L) * 1.000);
Support1:= PivotPoint - ((_H-_L) * 0.382);
Support2:= PivotPoint - ((_H-_L) * 0.618);
Support3:= PivotPoint - ((_H-_L) * 1.000);
7. Click the "Save" icon to finish building the Pivot Points - 24-Hour Cycle - Fibonacci Ratios indicator.
6.78
Pivot Points - Monthly Cycle
Overview
Pivot points consist of a central pivot level surrounded by three support levels below it and three
resistance levels above it. Pivot points were originally used by floor traders on equity and futures
exchanges because they provided a quick way for those traders to get a general idea of how the market
was moving during the course of the day using only a few simple calculations. However, over time pivot
points have also proved exceptionally useful in other markets as well.
One of the reasons that pivot points are now so popular is because they are considered a "leading" (or
predictive) indicator rather than a lagging indicator. All that is required to calculate the pivot points for the
upcoming (current) trading month is the previous month's high, low, and close prices.
The monthly cycle pivot points in this indicator are calculated according to the following formulas:
© 2011 Visual Trading Systems, LLC
614
VT Trader 2.0 Help Manual
Pivot Point for Current Monthly Cycle = (High(Previous Monthly Cycle) + Low(Previous Monthly Cycle) +
Close(Previous Monthly Cycle)) / 3
The central pivot point can then be used to calculate the support and resistance levels as follows:
Resistance 1 = (2 * Pivot Point) - Low(Previous Monthly Cycle)
Support 1 = (2 * Pivot Point) - High(Previous Monthly Cycle)
Resistance 2 = (Pivot Point - Support 1) + Resistance 1
Support 2 = Pivot Point - (Resistance 1 - Support 1)
Resistance 3 = (Pivot Point - Support 2) + Resistance 2
Support 3 = Pivot Point - (Resistance 2 - Support 2)
VT Trader also includes support and resistance mid-levels that are calculated as follows:
Resistance Mid-Level 1 = (Pivot Point + Resistance 1) / 2
Support Mid-Level 1 = (Pivot Point + Support 1) / 2
Resistance Mid-Level 2 = (Resistance 1 + Resistance 2) / 2
Support Mid-Level 2 = (Support 1 + Support 2) / 2
Resistance Mid-Level 3 = (Resistance 2 + Resistance 3) / 2
Support Mid-Level 3 = (Support 2 + Support 3) / 2
Interpretation
© 2011 Visual Trading Systems, LLC
Technical Indicators
615
Pivot point levels can be used in many different ways. Here are a few of the most common methods for
utilizing them.
Trend Direction Determined by Pivot Point: Combined with other technical analysis techniques such as
overbought/oversold oscillators, volatility measurements, etc., the central pivot point may be useful in
determining the general trending direction of the market. Trades are only taken in the direction of the
trend. Buy trades occur only when the price is above the central pivot point and sell trades occur only
when the price is below the central pivot point.
Price Breakouts: When trading price breakouts, a buy signal occurs when the price breaks up through
the central pivot point or one of the resistance levels (typically Resistance 1). A sell signal occurs when
price breaks down through the central pivot point or one of the support levels (typically Support 1).
Price Reversals: When trading price reversals, a buy signal occurs when the price moves towards a
support level, gets very close to it, touches it, or moves only slightly through it, and then reverses and
moves back in the opposite direction. A sell signal occurs when the price moves towards a resistance
level, gets very close to it, touches it, or moves only slightly through it, and then reverses and moves
back in the opposite direction.
Stop loss and/or Limit Profit Values Determined by Support/Resistance Levels: The central pivot point
and its support and resistance levels may be potentially helpful in determining suitable stop loss and/or
limit profit placements. For example, if trading a long breakout above the Resistance 1 level it may be
reasonable to position a stop loss order just below the central pivot point and one or more limit profit(s)
orders at the Resistance 2 and/or Resistance 3 levels.
Implementation
This Pivot Points indicator calculates the pivot points using a monthly cycle that resets at 12:00 AM on
the first day of each month.
Please Note: This indicator will not function properly on any chart interval lower than the 30-Minute chart
interval. It is not possible for VT Trader to load enough data into those lower chart intervals for the
indicator to properly calculate the pivot points. This indicator will also not function properly on a Monthly
chart interval. The calculations performed are not designed (nor can they be reprogrammed) to function in
the Monthly chart interval.
If the pivot points are not shown in the chart window once the indicator is attached, you may need to
increase the number of bars that VT Trader loads into its charts. As minimum amounts, VT Trader
should load 5,000+ bars into its charts if you intend to attach this Pivot Points indicator to any 30-Minute
or higher interval charts.
Construction
1. Click the Ribbon>Technical Analysis menu>Indicators group>Indicator Builder command>
Indicator Builder window's [New] button
2. In the General tab, type the following text for each field:
Name: Pivot Points - Monthly Cycle
© 2011 Visual Trading Systems, LLC
616
VT Trader 2.0 Help Manual
Function Name Alias: vt_PPIMonthly
Label Mask:
Pivot Points - Monthly Cycle (Calculation Time: 12:00AM, 1st of
month)
PP = %PivotPoint%, R1 = %Resistance1%, R2 = %Resistance2%, R3 = %
Resistance3%
S1 = %Support1%, S2 = %Support2%, S3 = %Support3%
Placement: Price Frame
Data Inspection Alias: Pivot Points - Monthly Cycle
3. In the Input Variable(s) tab, create the following variables:
[New] button...
Name: ShowMidLevels
Display Name: Show Mid-Levels?
Type: Enumeration
Default: click [...] button, [New] button, then create the following
entries:
No
Yes
... then, click [OK] button
Default: No
4. In the Output Variable(s) tab, create the following variables:
[New] button...
Var Name: Resistance3
Name: (R3)
Line Color: light blue
Line Width: slightly thicker
Line Type: solid
[New] button...
Var Name: ResistanceMidLevel3
Name: (R3 ML)
Line Color: light blue
Line Width: thin
Line Type: dashed
[New] button...
Var Name: Resistance2
Name: (R2)
Line Color: blue
Line Width: slightly thicker
Line Type: solid
[New] button...
Var Name: ResistanceMidLevel2
Name: (R2 ML)
Line Color: blue
Line Width: thin
Line Type: dashed
© 2011 Visual Trading Systems, LLC
Technical Indicators
[New] button...
Var Name: Resistance1
Name: (R1)
Line Color: dark blue
Line Width: slightly thicker
Line Type: solid
[New] button...
Var Name: ResistanceMidLevel1
Name: (R1 ML)
Line Color: dark blue
Line Width: thin
Line Type: dashed
[New] button...
Var Name: PivotPoint
Name: (Pivot Point)
Line Color: black
Line Width: very thick
Line Type: solid
[New] button...
Var Name: SupportMidLevel1
Name: (S1 ML)
Line Color: dark red
Line Width: thin
Line Type: dashed
[New] button...
Var Name: Support1
Name: (S1)
Line Color: dark red
Line Width: slightly thicker
Line Type: solid
[New] button...
Var Name: SupportMidLevel2
Name: (S2 ML)
Line Color: red
Line Width: thin
Line Type: dashed
[New] button...
Var Name: Support2
Name: (S2)
Line Color: red
Line Width: slightly thicker
Line Type: solid
[New] button...
Var Name: SupportMidLevel3
Name: (S3 ML)
Line Color: light red
© 2011 Visual Trading Systems, LLC
617
618
VT Trader 2.0 Help Manual
Line Width: thin
Line Type: dashed
[New] button...
Var Name: Support3
Name: (S3)
Line Color: light red
Line Width: slightly thicker
Line Type: solid
5. In the Horizontal Line tab, create the following lines:
This indicator requires no horizontal lines.
6. In the Formula tab, copy and paste the following formula:
_Hour:= Hour();
_Minute:= Minute();
CalculationTime:= Cross(Month()<>ref(Month,-1),0.5);
CalculateLookBackPeriods:= Barssince(CalculationTime=1);
LookBackPeriods:= valuewhen(1, Cross(0.5,CalculateLookBackperiods), ref
(CalculateLookBackPeriods,-1));
_H:= valuewhen(1,CalculationTime=1,ref(HHV(H,LookBackPeriods),-1));
_L:= valuewhen(1,CalculationTime=1,ref(LLV(L,LookBackPeriods),-1));
_C:= valuewhen(1,CalculationTime=1,C);
PivotPoint:= (_H+_L+_C)/3;
Resistance1:= 2 * PivotPoint - _L;
Resistance2:= PivotPoint + (_H-_L);
Resistance3:= 2 * PivotPoint + (_H-2*_L);
Support1:= 2 * PivotPoint - _H;
Support2:= PivotPoint - (_H-_L);
Support3:= 2 * PivotPoint - (2*_H-_L);
ResistanceMidLevel1:= if(ShowMidLevels=1, (PivotPoint+Resistance1)/2,
null);
ResistanceMidLevel2:= if(ShowMidLevels=1, (Resistance1+Resistance2)/2,
null);
ResistanceMidLevel3:= if(ShowMidLevels=1, (Resistance2+Resistance3)/2,
null);
SupportMidLevel1:= if(ShowMidLevels=1, (PivotPoint+Support1)/2, null);
SupportMidLevel2:= if(ShowMidLevels=1, (Support1+Support2)/2, null);
SupportMidLevel3:= if(ShowMidLevels=1, (Support2+Support3)/2, null);
7. Click the "Save" icon to finish building the Pivot Points - Monthly Cycle indicator.
© 2011 Visual Trading Systems, LLC
Technical Indicators
6.79
619
Pivot Points - Monthly Cycle - Fibonacci Ratios
Overview
Pivot points consist of a central pivot level surrounded by three support levels below it and three
resistance levels above it. This pivot points indicator replaces the traditional formulas used to calculate
the support and resistance levels with Fibonacci-based formulas. Pivot points (calculated using the
traditional formulas) were originally used by floor traders on equity and futures exchanges because they
provided a quick way for those traders to get a general idea of how the market was moving during the
course of the day using only a few simple calculations. However, over time pivot points have also proved
exceptionally useful in other markets as well.
One of the reasons that pivot points are now so popular is because they are considered a "leading" (or
predictive) indicator rather than a lagging indicator. All that is required to calculate the pivot points for the
upcoming (current) trading month is the previous month's high, low, and close prices.
The monthly cycle pivot points in this indicator are calculated according to the following formulas:
Pivot Point for Current Monthly Cycle = (High(Previous Monthly Cycle) + Low(Previous Monthly Cycle) +
Close(Previous Monthly Cycle)) / 3
With the central pivot point level already calculated, the support and resistance levels are determined by
calculating the previous cycle's high/low price range along with several Fibonacci-based percentages of
that price range and then adding those % values to (for resistance levels) or subtracting those % values
from (for support levels) the central pivot point. The support levels' and resistance levels' formulas are as
follows:
Resistance 1 = Pivot Point + ((High(Previous Monthly Cycle) - Low(Previous Monthly Cycle)) * 0.382)
Support 1 = Pivot Point - ((High(Previous Monthly Cycle) - Low(Previous Monthly Cycle)) * 0.382)
Resistance 2 = Pivot Point + ((High(Previous Monthly Cycle) - Low(Previous Monthly Cycle)) * 0.618)
Support 2 = Pivot Point - ((High(Previous Monthly Cycle) - Low(Previous Monthly Cycle)) * 0.618)
Resistance 3 = Pivot Point + ((High(Previous Monthly Cycle) - Low(Previous Monthly Cycle)) * 1.000)
Support 3 = Pivot Point - ((High(Previous Monthly Cycle) - Low(Previous Monthly Cycle)) * 1.000)
© 2011 Visual Trading Systems, LLC
620
VT Trader 2.0 Help Manual
Interpretation
Pivot point levels can be used in many different ways. Here are a few of the most common methods for
utilizing them.
Trend Direction Determined by Pivot Point: Combined with other technical analysis techniques such as
overbought/oversold oscillators, volatility measurements, etc., the central pivot point may be useful in
determining the general trending direction of the market. Trades are only taken in the direction of the
trend. Buy trades occur only when the price is above the central pivot point and sell trades occur only
when the price is below the central pivot point.
Price Breakouts: When trading price breakouts, a buy signal occurs when the price breaks up through
the central pivot point or one of the resistance levels (typically Resistance 1). A sell signal occurs when
price breaks down through the central pivot point or one of the support levels (typically Support 1).
Price Reversals: When trading price reversals, a buy signal occurs when the price moves towards a
support level, gets very close to it, touches it, or moves only slightly through it, and then reverses and
moves back in the opposite direction. A sell signal occurs when the price moves towards a resistance
level, gets very close to it, touches it, or moves only slightly through it, and then reverses and moves
back in the opposite direction.
Stop loss and/or Limit Profit Values Determined by Support/Resistance Levels: The central pivot point
and its support and resistance levels may be potentially helpful in determining suitable stop loss and/or
limit profit placements. For example, if trading a long breakout above the Resistance 1 level it may be
reasonable to position a stop loss order just below the central pivot point and one or more limit profit(s)
orders at the Resistance 2 and/or Resistance 3 levels.
© 2011 Visual Trading Systems, LLC
Technical Indicators
621
Implementation
This Pivot Points indicator calculates the pivot points using a monthly cycle that resets at 12:00 AM on
the first day of each month.
Please Note: This indicator will not function properly on any chart interval lower than the 30-Minute chart
interval. It is not possible for VT Trader to load enough data into those lower chart intervals for the
indicator to properly calculate the pivot points. This indicator will also not function properly on a Monthly
chart interval. The calculations performed are not designed (nor can they be reprogrammed) to function in
the Monthly chart interval.
If the pivot points are not shown in the chart window once the indicator is attached, you may need to
increase the number of bars that VT Trader loads into its charts. As minimum amounts, VT Trader
should load 5,000+ bars into its charts if you intend to attach this Pivot Points indicator to any 30-Minute
or higher interval charts.
Construction
1. Click the Ribbon>Technical Analysis menu>Indicators group>Indicator Builder command>
Indicator Builder window's [New] button
2. In the General tab, type the following text for each field:
Name: Pivot Points - Monthly Cycle - Fibonacci Ratios
Function Name Alias: vt_PPIMonthlyFibs
Label Mask:
Pivot Points - Monthly Cycle - Fibonacci Ratios (Calculation Time:
12:00AM, 1st of month)
PP = %PivotPoint%, R1 = %Resistance1%, R2 = %Resistance2%, R3 = %
Resistance3%
S1 = %Support1%, S2 = %Support2%, S3 = %Support3%
Placement: Price Frame
Data Inspection Alias: Pivot Points - Monthly Cycle - Fibonacci
3. In the Input Variable(s) tab, create the following variables:
This indicator requires no input variables.
4. In the Output Variable(s) tab, create the following variables:
[New] button...
Var Name: Resistance3
Name: (R3)
Line Color: light blue
Line Width: slightly thicker
Line Type: solid
[New] button...
Var Name: Resistance2
© 2011 Visual Trading Systems, LLC
622
VT Trader 2.0 Help Manual
Name: (R2)
Line Color: blue
Line Width: slightly thicker
Line Type: solid
[New] button...
Var Name: Resistance1
Name: (R1)
Line Color: dark blue
Line Width: slightly thicker
Line Type: solid
[New] button...
Var Name: PivotPoint
Name: (Pivot Point)
Line Color: black
Line Width: very thick
Line Type: solid
[New] button...
Var Name: Support1
Name: (S1)
Line Color: dark red
Line Width: slightly thicker
Line Type: solid
[New] button...
Var Name: Support2
Name: (S2)
Line Color: red
Line Width: slightly thicker
Line Type: solid
[New] button...
Var Name: Support3
Name: (S3)
Line Color: light red
Line Width: slightly thicker
Line Type: solid
5. In the Horizontal Line tab, create the following lines:
This indicator requires no horizontal lines.
6. In the Formula tab, copy and paste the following formula:
_Hour:= Hour();
_Minute:= Minute();
CalculationTime:= Cross(Month()<>ref(Month,-1),0.5);
CalculateLookBackPeriods:= Barssince(CalculationTime=1);
LookBackPeriods:= valuewhen(1, Cross(0.5,CalculateLookBackperiods), ref
© 2011 Visual Trading Systems, LLC
Technical Indicators
623
(CalculateLookBackPeriods,-1));
_H:= valuewhen(1,CalculationTime=1,ref(HHV(H,LookBackPeriods),-1));
_L:= valuewhen(1,CalculationTime=1,ref(LLV(L,LookBackPeriods),-1));
_C:= valuewhen(1,CalculationTime=1,C);
PivotPoint:= (_H+_L+_C)/3;
Resistance1:= PivotPoint + ((_H-_L) * 0.382);
Resistance2:= PivotPoint + ((_H-_L) * 0.618);
Resistance3:= PivotPoint + ((_H-_L) * 1.000);
Support1:= PivotPoint - ((_H-_L) * 0.382);
Support2:= PivotPoint - ((_H-_L) * 0.618);
Support3:= PivotPoint - ((_H-_L) * 1.000);
7. Click the "Save" icon to finish building the Pivot Points - Monthly Cycle - Fibonacci Ratios indicator.
6.80
Pivot Points - Weekly Cycle
Overview
Pivot points consist of a central pivot level surrounded by three support levels below it and three
resistance levels above it. Pivot points were originally used by floor traders on equity and futures
exchanges because they provided a quick way for those traders to get a general idea of how the market
was moving during the course of the day using only a few simple calculations. However, over time pivot
points have also proved exceptionally useful in other markets as well.
One of the reasons that pivot points are now so popular is because they are considered a "leading" (or
predictive) indicator rather than a lagging indicator. All that is required to calculate the pivot points for the
upcoming (current) trading week is the previous week's high, low, and close prices. For 24-hour markets
like Forex, each broker determines when the trading week closes for their clients; however, Friday at
4:00PM ET or 5:00PM ET is common as a weekly closing day/time. 12:00AM ET on Monday is also a
common weekly closing day/time.
The weekly cycle pivot points in this indicator are calculated according to the following formulas:
Pivot Point for Current Weekly Cycle = (High(Previous Weekly Cycle) + Low(Previous Weekly Cycle) +
Close(Previous Weekly Cycle)) / 3
The central pivot point can then be used to calculate the support and resistance levels as follows:
Resistance 1 = (2 * Pivot Point) - Low(Previous Weekly Cycle)
Support 1 = (2 * Pivot Point) - High(Previous Weekly Cycle)
Resistance 2 = (Pivot Point - Support 1) + Resistance 1
Support 2 = Pivot Point - (Resistance 1 - Support 1)
© 2011 Visual Trading Systems, LLC
624
VT Trader 2.0 Help Manual
Resistance 3 = (Pivot Point - Support 2) + Resistance 2
Support 3 = Pivot Point - (Resistance 2 - Support 2)
VT Trader also includes support and resistance mid-levels that are calculated as follows:
Resistance Mid-Level 1 = (Pivot Point + Resistance 1) / 2
Support Mid-Level 1 = (Pivot Point + Support 1) / 2
Resistance Mid-Level 2 = (Resistance 1 + Resistance 2) / 2
Support Mid-Level 2 = (Support 1 + Support 2) / 2
Resistance Mid-Level 3 = (Resistance 2 + Resistance 3) / 2
Support Mid-Level 3 = (Support 2 + Support 3) / 2
Interpretation
Pivot point levels can be used in many different ways. Here are a few of the most common methods for
utilizing them.
Trend Direction Determined by Pivot Point: Combined with other technical analysis techniques such as
overbought/oversold oscillators, volatility measurements, etc., the central pivot point may be useful in
determining the general trending direction of the market. Trades are only taken in the direction of the
trend. Buy trades occur only when the price is above the central pivot point and sell trades occur only
when the price is below the central pivot point.
Price Breakouts: When trading price breakouts, a buy signal occurs when the price breaks up through
© 2011 Visual Trading Systems, LLC
Technical Indicators
625
the central pivot point or one of the resistance levels (typically Resistance 1). A sell signal occurs when
price breaks down through the central pivot point or one of the support levels (typically Support 1).
Price Reversals: When trading price reversals, a buy signal occurs when the price moves towards a
support level, gets very close to it, touches it, or moves only slightly through it, and then reverses and
moves back in the opposite direction. A sell signal occurs when the price moves towards a resistance
level, gets very close to it, touches it, or moves only slightly through it, and then reverses and moves
back in the opposite direction.
Stop loss and/or Limit Profit Values Determined by Support/Resistance Levels: The central pivot point
and its support and resistance levels may be potentially helpful in determining suitable stop loss and/or
limit profit placements. For example, if trading a long breakout above the Resistance 1 level it may be
reasonable to position a stop loss order just below the central pivot point and one or more limit profit(s)
orders at the Resistance 2 and/or Resistance 3 levels.
Implementation
This Pivot Points indicator calculates the pivot points using a weekly cycle that resets at the specified
predetermined day of the week and time of that day. The Calculation Time (Hour/Minute) is defined using
a 24-hour clock (AM/PM is not used). For example, setting the Calculation Hour equal to 9 and the
Calculation Minute to 00 recalculates the pivot points each day at 9:00 AM while setting the Calculation
Hour equal to 17 and the Calculation Minute to 30 recalculates the pivot points on the specified day at
5:30PM.
Please Note: This indicator will not function properly on the following chart intervals: Tick , 1-Minute,
Week ly, or Monthly. It is not possible for VT Trader to load enough data into a Tick or 1-Minute chart
interval for the indicator to properly calculate the pivot points and the calculations performed are not
designed (nor can they be reprogrammed) to function in the Week ly or Monthly chart intervals.
If the pivot points are not shown in the chart window once the indicator is attached, you may need to
increase the number of bars that VT Trader loads into its charts. As minimum amounts, VT Trader
should load 3,500+ bars into its charts if you intend to attach this Pivot Points indicator to any 5-Minute
interval charts or 2,000+ bars if you intend to attach it to any 10-Minute or higher interval charts.
Construction
1. Click the Ribbon>Technical Analysis menu>Indicators group>Indicator Builder command>
Indicator Builder window's [New] button
2. In the General tab, type the following text for each field:
Name: Pivot Points - Weekly Cycle
Function Name Alias: vt_PPIWeekly
Label Mask:
Pivot Points - Weekly Cycle (Calculation Time: %CalculationDay%, %
CalculationHour%:%CalculationMinute%)
PP = %PivotPoint%, R1 = %Resistance1%, R2 = %Resistance2%, R3 = %
Resistance3%
S1 = %Support1%, S2 = %Support2%, S3 = %Support3%
© 2011 Visual Trading Systems, LLC
626
VT Trader 2.0 Help Manual
Placement: Price Frame
Data Inspection Alias: Pivot Points - Weekly Cycle
3. In the Input Variable(s) tab, create the following variables:
[New] button...
Name: CalculationDay
Display Name: Calculation Day
Type: Enumeration
Default: click [...] button, [New] button, then create the following
entries:
Sunday
Monday
Tuesday
Wednesday
Thursday
Friday
... then, click [OK] button
Default: Monday
[New] button...
Name: CalculationHour
Display Name: Calculation Hour
Type: integer
Default: 0
[New] button...
Name: CalculationMinute
Display Name: Calculation Minute
Type: integer
Default: 0
[New] button...
Name: ShowMidLevels
Display Name: Show Mid-Levels?
Type: Enumeration
Default: click [...] button, [New] button, then create the following
entries:
No
Yes
... then, click [OK] button
Default: No
4. In the Output Variable(s) tab, create the following variables:
[New] button...
Var Name: Resistance3
Name: (R3)
Line Color: light blue
Line Width: slightly thicker
Line Type: solid
[New] button...
© 2011 Visual Trading Systems, LLC
Technical Indicators
Var Name: ResistanceMidLevel3
Name: (R3 ML)
Line Color: light blue
Line Width: thin
Line Type: dashed
[New] button...
Var Name: Resistance2
Name: (R2)
Line Color: blue
Line Width: slightly thicker
Line Type: solid
[New] button...
Var Name: ResistanceMidLevel2
Name: (R2 ML)
Line Color: blue
Line Width: thin
Line Type: dashed
[New] button...
Var Name: Resistance1
Name: (R1)
Line Color: dark blue
Line Width: slightly thicker
Line Type: solid
[New] button...
Var Name: ResistanceMidLevel1
Name: (R1 ML)
Line Color: dark blue
Line Width: thin
Line Type: dashed
[New] button...
Var Name: PivotPoint
Name: (Pivot Point)
Line Color: black
Line Width: very thick
Line Type: solid
[New] button...
Var Name: SupportMidLevel1
Name: (S1 ML)
Line Color: dark red
Line Width: thin
Line Type: dashed
[New] button...
Var Name: Support1
Name: (S1)
Line Color: dark red
Line Width: slightly thicker
© 2011 Visual Trading Systems, LLC
627
628
VT Trader 2.0 Help Manual
Line Type: solid
[New] button...
Var Name: SupportMidLevel2
Name: (S2 ML)
Line Color: red
Line Width: thin
Line Type: dashed
[New] button...
Var Name: Support2
Name: (S2)
Line Color: red
Line Width: slightly thicker
Line Type: solid
[New] button...
Var Name: SupportMidLevel3
Name: (S3 ML)
Line Color: light red
Line Width: thin
Line Type: dashed
[New] button...
Var Name: Support3
Name: (S3)
Line Color: light red
Line Width: slightly thicker
Line Type: solid
5. In the Horizontal Line tab, create the following lines:
This indicator requires no horizontal lines.
6. In the Formula tab, copy and paste the following formula:
_DayOfWeek:= DayOfWeek();
_Hour:= Hour();
_Minute:= Minute();
CalculationTime:= Cross((_DayOfWeek=CalculationDay AND
_Hour>=CalculationHour AND _Minute>=CalculationMinute),0.5);
CalculateLookBackPeriods:= Barssince(CalculationTime=1);
LookBackPeriods:= valuewhen(1, Cross(0.5,CalculateLookBackperiods), ref
(CalculateLookBackPeriods,-1));
_H:= valuewhen(1,CalculationTime=1,ref(HHV(H,LookBackPeriods),-1));
_L:= valuewhen(1,CalculationTime=1,ref(LLV(L,LookBackPeriods),-1));
_C:= valuewhen(1,CalculationTime=1,C);
PivotPoint:= (_H+_L+_C)/3;
© 2011 Visual Trading Systems, LLC
Technical Indicators
629
Resistance1:= 2 * PivotPoint - _L;
Resistance2:= PivotPoint + (_H-_L);
Resistance3:= 2 * PivotPoint + (_H-2*_L);
Support1:= 2 * PivotPoint - _H;
Support2:= PivotPoint - (_H-_L);
Support3:= 2 * PivotPoint - (2*_H-_L);
ResistanceMidLevel1:= if(ShowMidLevels=1, (PivotPoint+Resistance1)/2,
null);
ResistanceMidLevel2:= if(ShowMidLevels=1, (Resistance1+Resistance2)/2,
null);
ResistanceMidLevel3:= if(ShowMidLevels=1, (Resistance2+Resistance3)/2,
null);
SupportMidLevel1:= if(ShowMidLevels=1, (PivotPoint+Support1)/2, null);
SupportMidLevel2:= if(ShowMidLevels=1, (Support1+Support2)/2, null);
SupportMidLevel3:= if(ShowMidLevels=1, (Support2+Support3)/2, null);
7. Click the "Save" icon to finish building the Pivot Points - Weekly Cycle indicator.
6.81
Pivot Points - Weekly Cycle - Fibonacci Ratios
Overview
Pivot points consist of a central pivot level surrounded by three support levels below it and three
resistance levels above it. Pivot points were originally used by floor traders on equity and futures
exchanges because they provided a quick way for those traders to get a general idea of how the market
was moving during the course of the day using only a few simple calculations. However, over time pivot
points have also proved exceptionally useful in other markets as well.
One of the reasons that pivot points are now so popular is because they are considered a "leading" (or
predictive) indicator rather than a lagging indicator. All that is required to calculate the pivot points for the
upcoming (current) trading week is the previous week's high, low, and close prices. For 24-hour markets
like Forex, each broker determines when the trading week closes for their clients; however, Friday at
4:00PM ET or 5:00PM ET is common as a weekly closing day/time. 12:00AM ET on Monday is also a
common weekly closing day/time.
The weekly cycle pivot points in this indicator are calculated according to the following formulas:
Pivot Point for Current Weekly Cycle = (High(Previous Weekly Cycle) + Low(Previous Weekly Cycle) +
Close(Previous Weekly Cycle)) / 3
With the central pivot point level already calculated, the support and resistance levels are determined by
calculating the previous cycle's high/low price range along with several Fibonacci-based percentages of
that price range and then adding those % values to (for resistance levels) or subtracting those % values
from (for support levels) the central pivot point. The support levels' and resistance levels' formulas are as
© 2011 Visual Trading Systems, LLC
630
VT Trader 2.0 Help Manual
follows:
Resistance 1 = Pivot Point + ((High(Previous Weekly Cycle) - Low(Previous Weekly Cycle)) * 0.382)
Support 1 = Pivot Point - ((High(Previous Weekly Cycle) - Low(Previous Weekly Cycle)) * 0.382)
Resistance 2 = Pivot Point + ((High(Previous Weekly Cycle) - Low(Previous Weekly Cycle)) * 0.618)
Support 2 = Pivot Point - ((High(Previous Weekly Cycle) - Low(Previous Weekly Cycle)) * 0.618)
Resistance 3 = Pivot Point + ((High(Previous Weekly Cycle) - Low(Previous Weekly Cycle)) * 1.000)
Support 3 = Pivot Point - ((High(Previous Weekly Cycle) - Low(Previous Weekly Cycle)) * 1.000)
Interpretation
Pivot point levels can be used in many different ways. Here are a few of the most common methods for
utilizing them.
Trend Direction Determined by Pivot Point: Combined with other technical analysis techniques such as
overbought/oversold oscillators, volatility measurements, etc., the central pivot point may be useful in
determining the general trending direction of the market. Trades are only taken in the direction of the
trend. Buy trades occur only when the price is above the central pivot point and sell trades occur only
when the price is below the central pivot point.
Price Breakouts: When trading price breakouts, a buy signal occurs when the price breaks up through
the central pivot point or one of the resistance levels (typically Resistance 1). A sell signal occurs when
price breaks down through the central pivot point or one of the support levels (typically Support 1).
Price Reversals: When trading price reversals, a buy signal occurs when the price moves towards a
© 2011 Visual Trading Systems, LLC
Technical Indicators
631
support level, gets very close to it, touches it, or moves only slightly through it, and then reverses and
moves back in the opposite direction. A sell signal occurs when the price moves towards a resistance
level, gets very close to it, touches it, or moves only slightly through it, and then reverses and moves
back in the opposite direction.
Stop loss and/or Limit Profit Values Determined by Support/Resistance Levels: The central pivot point
and its support and resistance levels may be potentially helpful in determining suitable stop loss and/or
limit profit placements. For example, if trading a long breakout above the Resistance 1 level it may be
reasonable to position a stop loss order just below the central pivot point and one or more limit profit(s)
orders at the Resistance 2 and/or Resistance 3 levels.
Implementation
This Pivot Points indicator calculates the pivot points using a weekly cycle that resets at the specified
predetermined day of the week and time of that day. The Calculation Time (Hour/Minute) is defined using
a 24-hour clock (AM/PM is not used). For example, setting the Calculation Hour equal to 9 and the
Calculation Minute to 00 recalculates the pivot points each day at 9:00 AM while setting the Calculation
Hour equal to 17 and the Calculation Minute to 30 recalculates the pivot points on the specified day at
5:30PM.
Please Note: This indicator will not function properly on the following chart intervals: Tick , 1-Minute,
Week ly, or Monthly. It is not possible for VT Trader to load enough data into a Tick or 1-Minute chart
interval for the indicator to properly calculate the pivot points and the calculations performed are not
designed (nor can they be reprogrammed) to function in the Week ly or Monthly chart intervals.
If the pivot points are not shown in the chart window once the indicator is attached, you may need to
increase the number of bars that VT Trader loads into its charts. As minimum amounts, VT Trader
should load 3,500+ bars into its charts if you intend to attach this Pivot Points indicator to any 5-Minute
interval charts or 2,000+ bars if you intend to attach it to any 10-Minute or higher interval charts.
Construction
1. Click the Ribbon>Technical Analysis menu>Indicators group>Indicator Builder command>
Indicator Builder window's [New] button
2. In the General tab, type the following text for each field:
Name: Pivot Points - Weekly Cycle - Fibonacci Ratios
Function Name Alias: vt_PPIWeeklyFibs
Label Mask:
Pivot Points - Weekly Cycle - Fibonacci Ratios (Calculation Time: %
CalculationDay%, %CalculationHour%:%CalculationMinute%)
PP = %PivotPoint%, R1 = %Resistance1%, R2 = %Resistance2%, R3 = %
Resistance3%
S1 = %Support1%, S2 = %Support2%, S3 = %Support3%
Placement: Price Frame
Data Inspection Alias: Pivot Points - Weekly Cycle - Fibonacci
3. In the Input Variable(s) tab, create the following variables:
© 2011 Visual Trading Systems, LLC
632
VT Trader 2.0 Help Manual
[New] button...
Name: CalculationDay
Display Name: Calculation Day
Type: Enumeration
Default: click [...] button, [New] button, then create the following
entries:
Sunday
Monday
Tuesday
Wednesday
Thursday
Friday
... then, click [OK] button
Default: Monday
[New] button...
Name: CalculationHour
Display Name: Calculation Hour
Type: integer
Default: 0
[New] button...
Name: CalculationMinute
Display Name: Calculation Minute
Type: integer
Default: 0
4. In the Output Variable(s) tab, create the following variables:
[New] button...
Var Name: Resistance3
Name: (R3)
Line Color: light blue
Line Width: slightly thicker
Line Type: solid
[New] button...
Var Name: Resistance2
Name: (R2)
Line Color: blue
Line Width: slightly thicker
Line Type: solid
[New] button...
Var Name: Resistance1
Name: (R1)
Line Color: dark blue
Line Width: slightly thicker
Line Type: solid
[New] button...
Var Name: PivotPoint
© 2011 Visual Trading Systems, LLC
Technical Indicators
633
Name: (Pivot Point)
Line Color: black
Line Width: very thick
Line Type: solid
[New] button...
Var Name: Support1
Name: (S1)
Line Color: dark red
Line Width: slightly thicker
Line Type: solid
[New] button...
Var Name: Support2
Name: (S2)
Line Color: red
Line Width: slightly thicker
Line Type: solid
[New] button...
Var Name: Support3
Name: (S3)
Line Color: light red
Line Width: slightly thicker
Line Type: solid
5. In the Horizontal Line tab, create the following lines:
This indicator requires no horizontal lines.
6. In the Formula tab, copy and paste the following formula:
_DayOfWeek:= DayOfWeek();
_Hour:= Hour();
_Minute:= Minute();
CalculationTime:= Cross((_DayOfWeek=CalculationDay AND
_Hour>=CalculationHour AND _Minute>=CalculationMinute),0.5);
CalculateLookBackPeriods:= Barssince(CalculationTime=1);
LookBackPeriods:= valuewhen(1, Cross(0.5,CalculateLookBackperiods), ref
(CalculateLookBackPeriods,-1));
_H:= valuewhen(1,CalculationTime=1,ref(HHV(H,LookBackPeriods),-1));
_L:= valuewhen(1,CalculationTime=1,ref(LLV(L,LookBackPeriods),-1));
_C:= valuewhen(1,CalculationTime=1,C);
PivotPoint:= (_H+_L+_C)/3;
Resistance1:= PivotPoint + ((_H-_L) * 0.382);
Resistance2:= PivotPoint + ((_H-_L) * 0.618);
Resistance3:= PivotPoint + ((_H-_L) * 1.000);
© 2011 Visual Trading Systems, LLC
634
VT Trader 2.0 Help Manual
Support1:= PivotPoint - ((_H-_L) * 0.382);
Support2:= PivotPoint - ((_H-_L) * 0.618);
Support3:= PivotPoint - ((_H-_L) * 1.000);
7. Click the "Save" icon to finish building the Pivot Points - Weekly Cycle - Fibonacci Ratios indicator.
6.82
Polarized Fractal Efficiency
Overview
The Polarized Fractal Efficiency indicator (PFE) was developed by Hans Hannula. It was introduced in
the January 1994 issue of Technical Analysis of Stocks and Commodities magazine. The PFE is used
to gauge how trendy or congested price action is.
Interpretation
PFE readings above zero mean that the trend is up; the higher the value the more efficient (trendy) the
upward movement is. PFE readings below zero mean that the trend is down; the lower the value the
more efficient (trendy) the downward movement is. Readings around zero indicate choppy, less efficient
movement.
© 2011 Visual Trading Systems, LLC
Technical Indicators
635
Construction
1. Click the Ribbon>Technical Analysis menu>Indicators group>Indicator Builder command>
Indicator Builder window's [New] button
2. In the General tab, type the following text for each field:
Name: Polarized Fractal Efficiency
Function Name Alias: vt_PFE
Label Mask: Polarized Fractal Efficiency (%pr%,%length%,%smooth%) = %
_pfe%
Placement: New Frame
Data Inspection Alias: Polarized Fractal Efficiency
3. In the Input Variable(s) tab, create the following variables:
[New] button...
Name: pr
Display Name: Price
Type: price
Default: close
[New] button...
Name: length
Display Name: Periods
Type: integer
Default: 10
[New] button...
Name: smooth
Display Name: Smoothing Periods
Type: integer
Default: 5
4. In the Output Variable(s) tab, create the following variables:
[New] button...
Var Name: _pfe
Name: (PFE)
Line Color: dark blue
Line Width: thin
Line Type: solid
5. In the Horizontal Line tab, create the following lines:
[New] button...
Value: +0.0000
Color: black
Width: thin
Type: dashed
© 2011 Visual Trading Systems, LLC
636
VT Trader 2.0 Help Manual
6. In the Formula tab, copy and paste the following formula:
_pfe:= Mov(If(pr>Ref(pr,-length),sqrt(Power(Roc(pr,length,Points),2) +
Power(10,2)) /
Sum(Sqrt(Power(Roc(pr,1,Points),2)+1),length),Sqrt(Power(Roc(pr,length,Points),2) + Power(10,2)) /
Sum(Sqrt(Power(Roc(pr,1,Points),2)+1),length))*100,smooth,E);
7. Click the "Save" icon to finish building the Polarized Fractal Efficiency indicator.
6.83
Quantitative Qualitative Estimation
Overview
The origin of the Quantitative Qualitative Estimation (QQE) indicator is currently unknown.
The QQE indicator consists of a smoothed Relative Strength Index (RSI) indicator and two volatilitybased trailing levels (fast and slow). The Fast Trailing Level (TL) and Slow TL are constructed by
calculating the ATR of the smoothed RSI over n-periods and then further smoothing the ATR using an
additional n-periods Wilders smoothing function. This smoothed ATR of RSI is then multiplied by the
Fast and Slow ATR Multipliers to calculate the final Fast and Slow Trailing Levels.
© 2011 Visual Trading Systems, LLC
Technical Indicators
637
Interpretation
There are several different methods in which the QQE can be used to generate trading signals. Here are
few of the more common techniques:
Crossovers: 1) RSI / Fast ATR TL or Slow ATR TL Crossover: A buy signal occurs when the RSI crosses
above the Fast ATR TL or Slow ATR TL and a sell signal occurs when RSI crosses below the Fast ATR
TL or Slow ATR TL. 2) RSI / 50-level Crossover: When the RSI crosses above 50 a buy signal is given.
Alternatively, when the RSI crosses below 50 a sell signal is given. 3) Fast ATR TL / Slow ATR TL
Crossover: A buy signal occurs when the Fast ATR TL crosses above the Slow ATR TL and a sell signal
occurs when Fast ATR TL crosses below the Slow ATR TL.
Divergence: Looking for divergences between the QQE indicator and price can prove to be very effective
in identifying potential reversal points in price movement. Trade long on Classic Bullish Divergence:
Lower lows in price and higher lows in the QQE; Trade short on Classic Bearish Divergence: Higher
highs in price and lower highs in the QQE.
Overbought/Oversold Conditions: Much like the original RSI (and other oscillators), the QQE indicator
can be used to identify potential overbought and oversold conditions in price movements. An Overbought
condition is generally described as the QQE being greater than or equal to the 70% level while an
oversold condition is generally described as the QQE being less than or equal to the 30% level. Trades
can be generated when any of the QQE outputs (RSI, Fast ATR TL or Slow ATR TL) crosses these
levels. When the RSI, Fast ATR TL or Slow ATR TL crosses above 30 a buy signal is given.
Alternatively, when the RSI, Fast ATR TL or Slow ATR TL crosses below 70 a sell signal is given.
Construction
1. Click the Ribbon>Technical Analysis menu>Indicators group>Indicator Builder command>
Indicator Builder window's [New] button
2. In the General tab, type the following text for each field:
Name: Quantitative Qualitative Estimation
Function Name Alias: vt_QQE
Label Mask:
QQE (%rsiprice%,%rsiperiods%,%SF%,%ST%,%atrperiods%,%atrsmperiods%,%
fastatrmult%,%slowatrmult%)
RSI = %RSIndex%, ATR FTL = %FastAtrRsiTL%, ATR STL = %SlowAtrRsiTL%
Placement: New Frame
Data Inspection Alias: QQE
3. In the Input Variable(s) tab, create the following variables:
[New] button...
Name: rsiprice
Display Name: RSI Price
Type: price
Default: close
© 2011 Visual Trading Systems, LLC
638
VT Trader 2.0 Help Manual
[New] button...
Name: rsiperiods
Display Name: RSI Periods
Type: integer
Default: 14
[New] button...
Name: SF
Display Name: RSI Smoothing Periods
Type: integer
Default: 2
[New] button...
Name: ST
Display Name: RSI Smoothing Type
Type: MA Type
Default: Exponential
[New] button...
Name: atrperiods
Display Name: ATR Periods
Type: integer
Default: 14
[New] button...
Name: atrsmperiods
Display Name: Wilders ATR Smoothing Periods
Type: integer
Default: 14
[New] button...
Name: fastatrmult
Display Name: Fast ATR TL Multiplier
Type: float
Default: 2.6180
[New] button...
Name: slowatrmult
Display Name: Slow ATR TL Multiplier
Type: float
Default: 4.2360
4. In the Output Variable(s) tab, create the following variables:
[New] button...
Var Name: RSIndex
Name: (RSI)
Line Color: blue
Line Width: slightly thicker
Line Type: solid
[New] button...
Var Name: FastAtrRsiTL
© 2011 Visual Trading Systems, LLC
Technical Indicators
639
Name: (ATR Fast TL)
Line Color: dark blue
Line Width: thin
Line Type: dashed
[New] button...
Var Name: SlowAtrRsiTL
Name: (ATR Slow TL)
Line Color: dark red
Line Width: thin
Line Type: dashed
5. In the Horizontal Line tab, create the following lines:
[New] button...
Value: +70.0000
Color: red
Width: thin
Type: dashed
[New] button...
Value: +30.0000
Color: red
Width: thin
Type: dashed
6. In the Formula tab, copy and paste the following formula:
{Smoothed RSI}
rsi_r:= (rsiprice - ref(rsiprice,-1));
rsi_rs:= Wilders(if(rsi_r>0,rsi_r,0),rsiperiods) / Wilders(if(rsi_r<0,
Abs(rsi_r),0),rsiperiods);
RSIndex:= Mov((100-(100/(1+rsi_rs))),SF,ST);
{Smoothed ATR of Smoothed RSI}
TH:= if(Ref(RSIndex,-1)>RSIndex,Ref(RSIndex,-1),RSIndex);
TL:= if(Ref(RSIndex,-1)<RSIndex,Ref(RSIndex,-1),RSIndex);
TR:= TH-TL;
AtrRsi:= Wilders(TR,atrperiods);
SmoothedAtrRsi:= Wilders(AtrRsi,atrsmperiods);
{Fast and Slow ATR Trailing Levels}
DeltaFastAtrRsi:= SmoothedAtrRsi*fastatrmult;
FastAtrRsiTL:= if(BarCount()<=(rsiperiods*2),null,
if(ref(RSIndex,-1)>PREV(0) AND RSIndex>PREV(0),max(PREV
(0),RSIndex-DeltaFastAtrRsi),
if(ref(RSIndex,-1)<PREV(0) AND RSIndex<PREV(0),min(PREV
(0),RSIndex+DeltaFastAtrRsi),
if(Cross(RSIndex,PREV(0)),RSIndex-DeltaFastAtrRsi,
© 2011 Visual Trading Systems, LLC
640
VT Trader 2.0 Help Manual
if(Cross(PREV(0),RSIndex),RSIndex+DeltaFastAtrRsi,
if(RSIndex=PREV(0),PREV(0),PREV(0)))))));
DeltaSlowAtrRsi:= SmoothedAtrRsi*slowatrmult;
SlowAtrRsiTL:= if(BarCount()<=(rsiperiods*2),null,
if(ref(RSIndex,-1)>PREV(0) AND RSIndex>PREV(0),max(PREV
(0),RSIndex-DeltaSlowAtrRsi),
if(ref(RSIndex,-1)<PREV(0) AND RSIndex<PREV(0),min(PREV
(0),RSIndex+DeltaSlowAtrRsi),
if(Cross(RSIndex,PREV(0)),RSIndex-DeltaSlowAtrRsi,
if(Cross(PREV(0),RSIndex),RSIndex+DeltaSlowAtrRsi,
if(RSIndex=PREV(0),PREV(0),PREV(0)))))));
7. Click the "Save" icon to finish building the QQE indicator.
6.84
Rainbow Charts
Overview
The Rainbow Charts and Rainbow Oscillator indicators were created by Mel Widner, Ph.D. and originally
introduced in the July 1997 issue of Technical Analysis of Stocks and Commodities magazine.
The Rainbow Charts indicator is trend-following indicator. The basis of the Rainbow Charts indicator is a
2-period simple moving average. Recursive smoothing is then applied to the original moving average
thereby creating 9 additional moving averages; each new moving average is based on the previous
moving average. Through this use of recursive smoothing a full spectrum of trends is created that, when
plotted using continuous colors, have the appearance of a rainbow.
The Rainbow Oscillator is also a trend-following indicator that is based on the same calculations used to
create the Rainbow Charts. The Rainbow Oscillator is derived from a consensus of the Rainbow Charts
trends. It defines the highest high and lowest low of those moving averages to create an oscillator and
bandwidth lines based on those calculations.
© 2011 Visual Trading Systems, LLC
Technical Indicators
641
Interpretation
One simple interpretation of the Rainbow Charts indicator is:
When the market is rising and the trend is up, the least smoothed line is at the top of the Rainbow (the
red line) and the most smoothed line is at the bottom of the Rainbow (the violet line). When the market
is declining and the trend is down the order of the Rainbow is reversed; the most smoothed line is at the
bottom and the least smoothed line is at the top.
As the underlying market price moves up or down, the moving averages follow and cross in sequence as
the move continues. Price moves away from the Rainbow are seen as potential trend continuations
leading to a greater Rainbow width, while price moves towards (or into) the Rainbow are seen as
potential reversals leading to a contraction of the Rainbow width. The depth that price penetrates into the
Rainbow can be used to judge the strength of the move.
Construction
1. Click the Ribbon>Technical Analysis menu>Indicators group>Indicator Builder command>
Indicator Builder window's [New] button
2. In the General tab, type the following text for each field:
Name: Rainbow Charts
Function Name Alias: vt_RBCharts
Label Mask:
© 2011 Visual Trading Systems, LLC
642
VT Trader 2.0 Help Manual
Rainbow Charts (%prc%,%periods%,%mat%,%recperiods%,%recmat%)
Least Smooth MA = %MA%, Smoothest MA = %R9%
Placement: Price Frame
Data Inspection Alias: Rainbow Charts
3. In the Input Variable(s) tab, create the following variables:
[New] button...
Name: prc
Display Name: Price
Type: price
Default: close
[New] button...
Name: periods
Display Name: Periods
Type: integer
Default: 2
[New] button...
Name: mat
Display Name: MA Type
Type: MA Type
Default: Simple
[New] button...
Name: recperiods
Display Name: Recursive Smoothing Periods
Type: integer
Default: 2
[New] button...
Name: recmat
Display Name: Recursive Smoothing MA Type
Type: MA Type
Default: Simple
4. In the Output Variable(s) tab, create the following variables:
[New] button...
Var Name: MA
Name: (MA - Least Smooth)
Line Color: red
Line Width: thin
Line Type: solid
[New] button...
Var Name: R1
Name: (R1)
Line Color: orange
Line Width: thin
Line Type: solid
© 2011 Visual Trading Systems, LLC
Technical Indicators
[New] button...
Var Name: R2
Name: (R2)
Line Color: yellow
Line Width: thin
Line Type: solid
[New] button...
Var Name: R3
Name: (R3)
Line Color: light green
Line Width: thin
Line Type: solid
[New] button...
Var Name: R4
Name: (R4)
Line Color: green
Line Width: thin
Line Type: solid
[New] button...
Var Name: R5
Name: (R5)
Line Color: blue-green
Line Width: thin
Line Type: solid
[New] button...
Var Name: R6
Name: (R6)
Line Color: light blue
Line Width: thin
Line Type: solid
[New] button...
Var Name: R7
Name: (R7)
Line Color: medium-light blue
Line Width: thin
Line Type: solid
[New] button...
Var Name: R8
Name: (R8)
Line Color: blue
Line Width: thin
Line Type: solid
[New] button...
Var Name: R9
Name: (R9 - Smoothest)
Line Color: purple
© 2011 Visual Trading Systems, LLC
643
644
VT Trader 2.0 Help Manual
Line Width: thin
Line Type: solid
5. In the Horizontal Line tab, create the following lines:
This indicator requires no horizontal lines.
6. In the Formula tab, copy and paste the following formula:
MA:=
r1:=
r2:=
r3:=
r4:=
r5:=
r6:=
r7:=
r8:=
r9:=
Mov(prc,periods,mat);
Mov(MA,recperiods,recmat);
Mov(r1,recperiods,recmat);
Mov(r2,recperiods,recmat);
Mov(r3,recperiods,recmat);
Mov(r4,recperiods,recmat);
Mov(r5,recperiods,recmat);
Mov(r6,recperiods,recmat);
Mov(r7,recperiods,recmat);
Mov(r8,recperiods,recmat);
7. Click the "Save" icon to finish building the Rainbow Charts indicator.
6.85
Rainbow Oscillator
Overview
The Rainbow Charts and Rainbow Oscillator indicators were created by Mel Widner, Ph.D. and originally
introduced in the July 1997 issue of Stocks and Commodities magazine.
The Rainbow Charts indicator is trend-following indicator. The basis of the Rainbow Charts indicator is a
2-period simple moving average. Recursive smoothing is then applied to the original moving average
thereby creating 9 additional moving averages; each new moving average is based on the previous
moving average. Through this use of recursive smoothing a full spectrum of trends is created that, when
plotted using continuous colors, have the appearance of a rainbow.
The Rainbow Oscillator is also a trend-following indicator that is based on the same calculations used to
create the Rainbow Charts. The Rainbow Oscillator is derived from a consensus of the Rainbow Charts
trends. It defines the highest high and lowest low of those moving averages to create an oscillator and
bandwidth lines based on those calculations.
© 2011 Visual Trading Systems, LLC
Technical Indicators
645
Interpretation
One simple interpretation of the Rainbow Charts indicator is:
When the market is rising and the trend is up, the least smoothed line is at the top of the Rainbow (the
red line) and the most smoothed line is at the bottom of the Rainbow (the violet line). When the market
is declining and the trend is down the order of the Rainbow is reversed; the most smoothed line is at the
bottom and the least smoothed line is at the top.
As the underlying market price moves up or down, the moving averages follow and cross in sequence as
the move continues. Price moves away from the Rainbow are seen as potential trend continuations
leading to a greater Rainbow width, while price moves towards (or into) the Rainbow are seen as
potential reversals leading to a contraction of the Rainbow width. The depth that price penetrates into the
Rainbow can be used to judge the strength of the move.
Construction
1. Click the Ribbon>Technical Analysis menu>Indicators group>Indicator Builder command>
Indicator Builder window's [New] button
2. In the General tab, type the following text for each field:
Name: Rainbow Oscillator
Function Name Alias: vt_RBOscillator
Label Mask:
© 2011 Visual Trading Systems, LLC
646
VT Trader 2.0 Help Manual
Rainbow Osc. (%prc%,%periods%,%mat%,%recperiods%,%recmat%,%rbop%)
Osc. = %RBOsc%, Upper = %RBUpperBand%, Lower = %RBLowerBand%
Placement: New Frame
Data Inspection Alias: Rainbow Oscillator
3. In the Input Variable(s) tab, create the following variables:
[New] button...
Name: prc
Display Name: Rainbow Charts Price
Type: price
Default: close
[New] button...
Name: periods
Display Name: Rainbow Charts Periods
Type: integer
Default: 2
[New] button...
Name: mat
Display Name: Rainbow Charts MA Type
Type: MA Type
Default: Simple
[New] button...
Name: recperiods
Display Name: Rainbow Charts Recursive Smoothing Periods
Type: integer
Default: 3
[New] button...
Name: recmat
Display Name: Rainbow Charts Recursive Smoothing MA Type
Type: MA Type
Default: Simple
[New] button...
Name: rbop
Display Name: Rainbow Oscillator Periods
Type: integer
Default: 10
4. In the Output Variable(s) tab, create the following variables:
[New] button...
Var Name: RBOsc
Name: (RB Oscillator)
Line Color: light blue
Line Width: slightly thicker
Line Type: histogram
[New] button...
© 2011 Visual Trading Systems, LLC
Technical Indicators
Var Name: RBLowerBand
Name: (RB Lower Band)
Line Color: dark green
Line Width: thin
Line Type: solid
[New] button...
Var Name: RBUpperBand
Name: (RB Upper Band)
Line Color: dark green
Line Width: thin
Line Type: solid
5. In the Horizontal Line tab, create the following lines:
[New] button...
Value: +30.0000
Color: red
Width: thin
Type: dashed
[New] button...
Value: +0.0000
Color: black
Width: thin
Type: dashed
[New] button...
Value: -30.0000
Color: red
Width: thin
Type: dashed
6. In the Formula tab, copy and paste the following formula:
MA:=
r1:=
r2:=
r3:=
r4:=
r5:=
r6:=
r7:=
r8:=
r9:=
Mov(prc,periods,mat);
Mov(MA,recperiods,recmat);
Mov(r1,recperiods,recmat);
Mov(r2,recperiods,recmat);
Mov(r3,recperiods,recmat);
Mov(r4,recperiods,recmat);
Mov(r5,recperiods,recmat);
Mov(r6,recperiods,recmat);
Mov(r7,recperiods,recmat);
Mov(r8,recperiods,recmat);
RMin:= Min(MA,Min((r1),Min((r2),Min((r3),Min((r4),Min((r5),
Min((r6),Min((r7),Min((r8),r9)))))))));
RMax:= Max(MA,Max((r1),Max((r2),Max((r3),Max((r4),Max((r5),
Max((r6),Max((r7),Max((r8),r9)))))))));
RBLowerBand:= -100 * (RMin-RMax) / (HHV(prc,rbop)-LLV(prc,rbop));
© 2011 Visual Trading Systems, LLC
647
648
VT Trader 2.0 Help Manual
RBUpperBand:= 100 * (RMin-RMax) / (HHV(prc,rbop)-LLV(prc,rbop));
RBOsc:= 100 * (prc-((MA+r1+r2+r3+r4+r5+r6+r7+r8+r9)/rbop)) / (HHV(Prc,
rbop) - LLV(Prc,rbop));
7. Click the "Save" icon to finish building the Rainbow Oscillator indicator.
6.86
Rate of Change (ROC)
Overview
The Rate of Change (ROC) indicator calculates how price has changed within a specified number of time
periods by calculating the difference between the current bar's price and the price a selected number of
bars ago. The difference is calculated in "Points" or as a "Percentage". The ROC moves in a wave-like
fashion (similar to that of price), but it oscillates above and below an equilibrium level set at zero. The
ROC rises as prices rise; the ROC declines as prices decline. The greater the change in prices, the
greater the change in the ROC indicator.
To calculate the ROC in Points:
ROCPoints = Today's Price - Price n-Periods Ago
To calculate the ROC as a Percentage:
ROCPercentage = ((Today's Price - Price n-Periods Ago) / Price n-Periods Ago) * 100
© 2011 Visual Trading Systems, LLC
Technical Indicators
649
Interpretation
The ROC indicator is a simple indicator capable of producing a myriad of buy and sell signals. However,
there are four basic methods of interpreting the ROC indicator:
Zero-Level Crossovers: A buy signal occurs when the ROC crosses above zero and a sell signal occurs
when the ROC crosses below zero.
Overbought/Oversold Levels: To use ROC as an overbought/oversold indicator, generally a few
assumptions are made: The higher the ROC readings the more overbought a trading instrument is and
the lower the ROC readings the more oversold a trading instrument is. Readings above the overbought
level imply an overbought condition (and a pending price correction) while readings below the oversold
level imply an oversold condition (and a pending rally). However, it is worth remembering that prices may
remain overbought or oversold for extended periods of time. When this happens, it may actually suggest
that the trend will continue rather than reverse.
Trend Line Breakouts: Trend lines can be drawn connecting the peaks and troughs of the ROC indicator.
Often ROC begins to turn before price thereby making it a leading indicator. ROC readings breaking
above a declining trend line warns of a possible bullish reversal while momentum readings breaking
below a rising trend line warns of a possible bearish reversal.
Divergence: Looking for divergences between the ROC indicator and price can prove to be very effective
in identifying potential reversal points in price movement. Trade long on Classic Bullish Divergence:
Lower lows in price and higher lows in the ROC; Trade short on Classic Bearish Divergence: Higher
highs in price and lower highs in the ROC.
© 2011 Visual Trading Systems, LLC
650
VT Trader 2.0 Help Manual
Construction
1. Click the Ribbon>Technical Analysis menu>Indicators group>Indicator Builder command>
Indicator Builder window's [New] button
2. In the General tab, type the following text for each field:
Name: Rate of Change (ROC)
Function Name Alias: vt_ROC
Label Mask: ROC (%Pr%,%tPr%,%CalcMethod%) = %_ROC%
Placement: New Frame
Data Inspection Alias: Rate of Change
3. In the Input Variable(s) tab, create the following variables:
[New] button...
Name: Price
Display Name: Price
Type: price
Default: close
[New] button...
Name: tPr
Display Name: Periods
Type: integer
Default: 12
[New] button...
Name: CalcMethod
Display Name: Calculation Method
Type: Enumeration
Default: click [...] button, [New] button, then create the following
entries:
Points
Percent
... then, click [OK] button
Default: Points
4. In the Output Variable(s) tab, create the following variables:
[New] button...
Var Name: _ROC
Name: (ROC)
Line Color: purple
Line Width: thin
Line Type: solid
5. In the Horizontal Line tab, create the following lines:
[New] button...
Value: +0.0000
Color: black
© 2011 Visual Trading Systems, LLC
Technical Indicators
651
Width: thin
Type: dashed
6. In the Formula tab, copy and paste the following formula:
_ROC:= if(CalcMethod=0,Pr-Ref(Pr,-tPr),((Pr-Ref(Pr,-tPr))/ref(Pr,-tPr))
*100);
7. Click the "Save" icon to finish building the Rate of Change indicator.
6.87
Recursive Moving Trend Average
Overview
Developed by Dennis Meyers and described in his article entitled “The Japanese Yen, Recursed”
published in the December 1998 issue of Technical Analysis of Stocks and Commodities magazine, the
Recursive Moving Trend Average is in mathematical terms a "Recursive Moving Polynomial Fit”.
Meyers describes this technique as requiring only a small number of past values of the estimated price
and the current (today’s) price to predict the next (tomorrow’s) price whereas the Least Squares
Polynomial Fit (which is very computationally intensive) requires large numbers of past price points.
© 2011 Visual Trading Systems, LLC
652
VT Trader 2.0 Help Manual
Interpretation
Meyers suggests creating a simple “trend oscillator” which he refers to as the “tocs” which is the
difference between the Recursive Moving Trend Average and an Exponential Moving Average of the same
n-periods.
He mentions looking for changes in the price series that are above the normal noise fluctuations
indicating that a potential uptrend or downtrend has started. This is accomplished by examining the plot
of the tosc.
A potential buy signal is generated when the tosc’s value crosses above the “dup” level and a potential
sell signal is generated when the tosc’s value crosses below the “-ddn” level.
During Meyer’s testing, the optimum “dup” and “-ddn” levels were calculated using optimization, walkforward testing, out-of-sample testing, and averaging of all testing results.
For additional information, including the mathematical formulas for the Recursive Moving Trend Average
and TOSC, please review Dennis Meyer’s whitepaper entitled “The Japanese Yen, Recursed” published
in 1998, which is available from his website.
Construction
1. Click the Ribbon>Technical Analysis menu>Indicators group>Indicator Builder command>
Indicator Builder window's [New] button
2. In the General tab, type the following text for each field:
Name: Recursive Moving Trend Average
Function Name Alias: vt_RMTA
Label Mask: Recursive Mov. Trend Avg. (%Price%,%Periods%) = %RMTA%
Placement: Price Frame
Data Inspection Alias: Recursive Mov. Trend Avg.
3. In the Input Variable(s) tab, create the following variables:
[New] button...
Name: Price
Display Name: Price
Type: Price
Default: Close
[New] button...
Name: Periods
Display Name: Periods
Type: integer (with bounds)
Default: 21
Min. Bounds: 1
Max. Bounds: 9999
© 2011 Visual Trading Systems, LLC
Technical Indicators
653
4. In the Output Variable(s) tab, create the following variables:
[New] button...
Var Name: RMTA
Name: (RMTA)
Line Color: dark blue
Line Width: thin
Line Type: solid
5. In the Horizontal Line tab, create the following variables:
This indicator requires no horizontal lines.
6. In the Formula tab, copy and paste the following formula:
Alpha:= 2/(Periods+1);
Bot:= (1-Alpha)*(If(BarCount()<Periods,Price,PREV(Price)))+Price;
RMTA:= (1-Alpha)*(If(BarCount()<Periods,Price,PREV(Price)))+(Alpha*Abs
(Price+Bot-Ref(Bot,-1)));
7. Click the "Save" icon to finish building the Recursive Moving Trend Average indicator.
6.88
Relative Momentum Index
Overview
The Relative Momentum Index was developed by Roger Altman. It was first introduced in the February
1993 issue of Technical Analysis of Stocks & Commodities magazine. The RMI is a variation of the RSI
indicator. The RMI counts up and down days from the close relative to the close x-days ago (where x is
not limited to 1 as is required by the RSI) instead of counting up and down days from close to close as
the RSI does.
Note that an RMI with parameters of C, 14, 1 is equivalent to a 14 period RSI of the Close price. This is
because the momentum parameter is calculating only a 1-day price change (which the RSI does by
default). As the momentum periods are increased the RMI fluctuations become smoother.
© 2011 Visual Trading Systems, LLC
654
VT Trader 2.0 Help Manual
Interpretation
Since the RMI is an oscillator it exhibits the same strengths and weaknesses of other overbought /
oversold indicators. During strong trending markets it is likely that the RMI will remain at overbought or
oversold levels for an extended period of time. However, during non-trending markets the RMI tends to
oscillate more predictably between an overbought level of 70 to 90 and an oversold level of 10 to 30.
Construction
1. Click the Ribbon>Technical Analysis menu>Indicators group>Indicator Builder command>
Indicator Builder window's [New] button
2. In the General tab, type the following text for each field::
Name: Relative Momentum Index
Function Name Alias: vt_RMI
Label Mask: Relative Momentum Index (%price%,%rmiper%,%momper%) = %_RMI%
Placement: New Frame
Data Inspection Alias: Relative Momentum Index
3. In the Input Variable(s) tab, create the following variables:
[New] button...
Name: Price
© 2011 Visual Trading Systems, LLC
Technical Indicators
655
Display Name: Price
Type: price
Default: close
[New] button...
Name: rmiper
Display Name: RMI Periods
Type: integer
Default: 14
[New] button...
Name: momper
Display Name: Momentum Periods
Type: integer
Default: 5
4. In the Output Variable(s) tab, create the following variables:
[New] button...
Var Name: _RMI
Name: (RMI)
Line Color: dark green
Line Width: slightly thicker
Line Type: solid
5. In the Horizontal Line tab, create the following lines:
[New] button...
Value: +70.0000
Color: red
Width: thin
Type: dashed
[New] button...
Value: +30.0000
Color: red
Width: thin
Type: dashed
6. In the Formula tab, copy and paste the following formula:
Mom:= price - ref(price,-momper);
Rms:= Wilders(If(Mom>0,Mom,0),rmiper) / Wilders(If(Mom<0,Abs(Mom),0),
rmiper);
_RMI:= 100-(100/(1+RMS));
7. Click the "Save" icon to finish building the Relative Momentum Index indicator.
© 2011 Visual Trading Systems, LLC
656
6.89
VT Trader 2.0 Help Manual
Relative Strength Index (RSI)
Overview
Developed by J. Wells Wilder and introduced in his 1978 book, “New Concepts in Technical Trading
Systems”, the Relative Strength Index (RSI) has become a very popular oscillator and useful momentum
oscillator. The RSI compares a trading instrument’s magnitude of recent gains against its magnitude of
recent losses and quantifies this information into a value that ranges between 0 and 100.
Often times the name "Relative Strength Index" is slightly confusing or misleading because the RSI does
not compare the relative strength of two trading instruments, but rather the internal strength of a single
trading instrument. A more appropriate name might have been "Internal Strength Index”, but most traders
simply refer to it as “the RSI” in an effort not to confuse it with John Murphy’s “Relative Strength” charts
and IBD’s “Relative Strength” rankings.
Interpretation
There are several popular methods of analyzing the RSI, some of which include:
Divergence: Looking for divergences between the RSI and price can prove to be very effective in
identifying potential reversal points in price movement. Trade long on Classic Bullish Divergence: Lower
lows in price and higher lows in the RSI; Trade short on Classic Bearish Divergence: Higher highs in
© 2011 Visual Trading Systems, LLC
Technical Indicators
657
price and lower highs in the RSI. These types of divergence are often indications of an impending
reversal.
Overbought/Oversold Conditions: The RSI can be used to identify potential overbought and oversold
conditions in price movements. An Overbought condition is generally described as the RSI being greater
than or equal to the 70% level while an oversold condition is generally described as the RSI being less
than or equal to the 30% level. Trades can be generated when the RSI crosses these levels. When the
RSI crosses above 30 a buy signal is given. Alternatively, when the RSI crosses below 70 a sell signal is
given.
Support/Resistance and “Failure Swings”: The RSI shows, sometimes more clearly than price itself,
levels of support and resistance. Failure swings (a.k.a. support/resistance breakouts) occur when the
RSI surpasses a previous high (peak) or falls below a recent low (trough).
RSI / 50-level Crossover: When the RSI crosses above 50 a buy signal is given. Alternatively, when the
RSI crosses below 50 a sell signal is given.
Chart Formations: The RSI often forms chart patterns such as head and shoulders or triangles that may
or may not be visible on the price chart.
Construction
1. Click the Ribbon>Technical Analysis menu>Indicators group>Indicator Builder command>
Indicator Builder window's [New] button
2. In the General tab, type the following text for each field:
Name: Relative Strength Index (RSI)
Function Name Alias: vt_RSI
Label Mask: RSI (%pr%,%tpr%) = %RSIndex%
Placement: New Frame
Data Inspection Alias: RSI
3. In the Input Variable(s) tab, create the following variables:
[New] button...
Name: Pr
Display Name: Price
Type: price
Default: close
[New] button...
Name: tpr
Display Name: Periods
Type: integer
Default: 14
4. In the Output Variable(s) tab, create the following variables:
[New] button...
Var Name: RSIndex
© 2011 Visual Trading Systems, LLC
658
VT Trader 2.0 Help Manual
Name: (RSI)
Line Color: dark green
Line Width: slightly thicker
Line Type: solid
5. In the Horizontal Line tab, create the following lines:
[New] button...
Value: +70.0000
Color: red
Width: thin
Type: dashed
[New] button...
Value: +50.0000
Color: gray
Width: thin
Type: dashed
[New] button...
Value: +30.0000
Color: red
Width: thin
Type: dashed
6. In the Formula tab, copy and paste the following formula:
rsi_r:= (pr - ref(pr,-1));
rsi_rs:= Wilders(if(rsi_r>0,rsi_r,0),tpr) / Wilders(if(rsi_r<0,Abs
(rsi_r),0),tpr);
RSIndex:= 100-(100/(1+rsi_rs));
7. Click the "Save" icon to finish building the Relative Strength Index indicator.
6.90
Relative Volatility Index (RVI)
Overview
The Relative Volatility Index (RVI) was developed by Donald Dorsey. It was originally introduced in the
June 1993 issue of Technical Analysis of Stocks and Commodities magazine (TASC). A revision to the
indicator was discussed in the September 1995 issue.
The RVI is very similar to the Relative Strength Index (RSI) index except that the RVI measures the
direction of volatility using the standard deviation of price changes in its calculations rather than absolute
price changes like the RSI does.
© 2011 Visual Trading Systems, LLC
Technical Indicators
659
Interpretation
The RVI is best used as a confirmation indicator to other momentum and/or trend-following indicators.
Dorsey recommended the following rules for using the RVI:
Only act on buy signals when RVI > 50.
Only act on sell signals when RVI < 50.
If a buy signal is ignored, enter long if RVI > 60.
If a sell signal is ignored, enter short if RVI < 40.
Close a long position if RVI falls below 40.
Close a short position if RVI rises above 60.
Construction
1. Click the Ribbon>Technical Analysis menu>Indicators group>Indicator Builder command>
Indicator Builder window's [New] button
2. In the General tab, type the following text for each field:
Name: Relative Volatility Index (RVI)
Function Name Alias: vt_RelVolIndex
Label Mask: Relative Volatility Index (RVI) (%pr%,%stdevper%,%tpr%) = %
RVIndex%
© 2011 Visual Trading Systems, LLC
660
VT Trader 2.0 Help Manual
Placement: New Frame
Data Inspection Alias: Relative Volatility Index
3. In the Input Variable(s) tab, create the following variables:
[New] button...
Name: pr
Display Name: Price
Type: price
Default: close
[New] button...
Name: stdevper
Display Name: Std. Deviation Periods
Type: integer (with bounds)
Default: 10
Min. Bounds: 1
Max. Bounds: 9999
[New] button...
Name: tpr
Display Name: RVI Periods
Type: integer (with bounds)
Default: 14
Min. Bounds: 1
Max. Bounds: 9999
4. In the Output Variable(s) tab, create the following variables:
[New] button...
Var Name: RVIndex
Name: (RVI)
Line Color: purple
Line Width: slightly thicker
Line Type: solid
5. In the Horizontal Line tab, create the following lines:
[New] button...
Value: +60.0000
Color: red
Width: thin
Type: dashed
[New] button...
Value: +50.5000
Color: gray
Width: thin
Type: dashed
[New] button...
Value: +40.0000
Color: red
© 2011 Visual Trading Systems, LLC
Technical Indicators
661
Width: thin
Type: dashed
6. In the Formula tab, copy and paste the following formula:
rvi_r:= pr - ref(pr,-1);
rvi_rs:= wilders(if(rvi_r>0,stdev(pr,stdevper),0),tpr) / wilders(if
(rvi_r<0,abs(stdev(pr,stdevper)),0),tpr);
RVIndex:= 100-(100/(1+rvi_rs));
7. Click the "Save" icon to finish building the Relative Volatility Index indicator.
6.91
R-Squared
Overview
R-Squared is a linear regression method that helps quantify the strength of market trends (i.e.
“trendiness of prices). The more closely prices move in a straight line over n-periods (forming a linear
relationship), the stronger the trend. R-Squared values represent the percentage of price movement that
can be explained by linear regression. For example, if the R-Squared value over 14 periods is at 50%
then that means that 50% of the price movement can be explained by linear regression and the
remaining 50% is random noise.
© 2011 Visual Trading Systems, LLC
662
VT Trader 2.0 Help Manual
Interpretation
To determine if a trend is statistically significant for an n-periods linear regression line a 95% confidence
level is required. The 95% confidence level varies based on the number of periods being evaluated. If the
R-Squared value is less than its corresponding 95% confidence level for a given n-periods it is generally
assumed that no statistically significant trend exists. The table below outlines the recommended number
of R-Squared periods and their corresponding 95% confidence levels.
# of Periods / R2 Critical Value (95% Confidence)
5 / 77
10 / 40
14 / 27
20 / 20
25 / 16
30 / 13
50 / 8
60 / 6
120 / 3
There are many ways to use linear regression and R-Squared to generate potential trading
opportunities.
One such method recommends using R-Squared in conjunction with the Linear Regression Slope. RSquared defines the strength of the trend and the Linear Regression Slope defines the general direction
of the trend (positive or negative). Potential trading signals would be generated with respect to the
direction of the Linear Regression Slope while the R-Squared remained above its 95% confidence level.
Another method recommends using R-Squared in conjunction with oscillators. Potential trading signals
would be generated with respect to the oscillator’s overbought and oversold levels while R-Squared
remains low (i.e. well below its 95% confidence level) indicating that prices are less “trendy”.
For additional information you may wish to refer to Tushar Chande’s and Stanley Kroll’s book entitled,
“The New Technical Trader”.
Construction
1. Click the Ribbon>Technical Analysis menu>Indicators group>Indicator Builder command>
Indicator Builder window's [New] button
2. In the General tab, type the following text for each field:
Name: R-Squared (R2)
Function Name Alias: vt_R2
Label Mask: R-Squared (%price%,%periods%) = %R2%
Placement: New Frame
Data Inspection Alias: R-Squared
3. In the Input Variable(s) tab, create the following variables:
[New] button...
© 2011 Visual Trading Systems, LLC
Technical Indicators
663
Name: Price
Display Name: Price
Type: price
Default: close
[New] button...
Name: Periods
Display Name: Periods
Type: integer (with bounds)
Default: 14
Min. Bounds: 1
Max. Bounds: 9999
4. In the Output Variable(s) tab, create the following variables:
[New] button...
Var Name: R2
Name: (R2)
Line Color: black
Line Width: slightly thicker
Line Type: solid
5. In the Horizontal Line tab, create the following lines:
This indicator requires no horizontal lines.
6. In the Formula tab, copy and paste the following formula:
t1:= BarCount();
t2:= Price;
N:= Periods;
A:= (N * Sum(Power(t1,2),N) - Power(Sum(t1,N),2));
B:= (N * Sum(Power(t2,2),N) - Power(Sum(t2,N),2));
R1:= (N * Sum(t1*t2,N) - Sum(t1,N) * Sum(t2,N)) / (sqrt(A) * sqrt(B));
R2:= (Power(R1,2)) * 100;
CV:= If(N=5,77,
If(N=10,40,
If(N=14,27,
If(N=20,20,
If(N=25,16,
If(N=30,13,
If(N=50,8,
If(N=60,120,
If(N=120,3,Null)))))))));
7. Click the "Save" icon to finish building the R-Squared indicator.
© 2011 Visual Trading Systems, LLC
664
6.92
VT Trader 2.0 Help Manual
Schaff Trend Cycle
Overview
Developed by Doug Schaff in the 1990's, the Schaff Trend Cycle bases its method on the fact that
trends, like price, exhibit repeating high and low patterns (cycles). This indicator is a modified MACD
line run through a modified stochastic algorithm smoothed with Wilders' smoothing to calculate the final
STC indicator.
Interpretation
The Schaff Trend Cycle uses three inputs:
Sh: Shorter-term Exponential Moving Average. Default: 23
Lg: Longer-term Exponential Moving Average. Default: 50
Cycle: Set at half the cycle length. Default: 10
The Schaff Trend Cycle helps to identify:
1. Direction a Trend Cycle is moving.
2. Tops and Bottoms within a Trend Cycle.
When the Schaff Trend Cycle Indicator is declining, the trend cycle is falling and prices tend to stabilize
or follow the cycle down. When the STC is rising, the trend cycle is rising and prices tend to stabilize or
follow the cycle higher.
© 2011 Visual Trading Systems, LLC
Technical Indicators
665
Construction
1. Click the Ribbon>Technical Analysis menu>Indicators group>Indicator Builder command>
Indicator Builder window's [New] button
2. In the General tab, type the following text for each field:
Name: Schaff Trend Cycle
Function Name Alias: vt_SchaffTC
Label Mask: Schaff Trend Cycle (%price%,%Sh%,%Lg%,%Cycle%) = %STCycle%
Placement: New Frame
Data Inspection Alias: Schaff Trend Cycle
3. In the Input Variable(s) tab, create the following variables:
[New] button...
Name: Price
Display Name: Price
Type: price
Default: Typical Price
[New] button...
Name: Sh
Display Name: Short-Term Periods
Type: integer
Default: 23
[New] button...
Name: Lg
Display Name: Long-Term Periods
Type: integer
Default: 50
[New] button...
Name: Cycle
Display Name: Schaff Cycle Periods
Type: integer
Default: 10
4. In the Output Variable(s) tab, create the following variables:
[New] button...
Var Name: STCycle
Name: (STC)
Line Color: dark red
Line Width: thin
Line Type: solid
5. In the Horizontal Line tab, create the following lines:
© 2011 Visual Trading Systems, LLC
666
VT Trader 2.0 Help Manual
[New] button...
Value: +80.0000
Color: blue
Width: thin
Type: dashed
[New] button...
Value: +70.0000
Color: blue
Width: thin
Type: dashed
[New] button...
Value: +30.0000
Color: blue
Width: thin
Type: dashed
[New] button...
Value: +20.0000
Color: blue
Width: thin
Type: dashed
6. In the Formula tab, copy and paste the following formula:
MCD:= Wilders(price,Sh) - Wilders(price,Lg);
ST:= ((MCD-LLV(MCD,Cycle)) / (HHV(MCD,Cycle)-LLV(MCD,Cycle))) * 100;
STCycle:= Wilders(ST,Cycle/2);
7. Click the "Save" icon to finish building the Schaff Trend Cycle indicator.
6.93
Stochastic Momentum Index
Overview
Created by William Blau, the Stochastic Momentum Index was described in the January 1993 issue of
Technical Analysis of Stocks and Commodities magazine.
The SMI is a smoother version of the classic Stochastic Oscillator with an interesting twist. Instead of
calculating the distance the current price relative to the recent n-period high/low range, the SMI is
calculated by comparing the price to the midpoint average of the n-period high/low range. The raw price
differences are then smoothed by a double EMA (an EMA of an EMA of the raw price differences). When
the close is greater than the midpoint of the range, the SMI is positive. When the close is less than the
midpoint of the range, it is negative.
The result is an oscillator that ranges between +/- 100 and is less erratic than an equal period
© 2011 Visual Trading Systems, LLC
Technical Indicators
667
Stochastic Oscillator.
Interpretation
Popular methods for interpreting the Stochastic Momentum Index include:
1. Overbought/Oversold Level Crossovers: +/- 40 are popular levels. Buy when the SMI falls below the
oversold level and then rises above that level; Sell when the SMI rises above the overbought level and
then falls below that level.
2. Signal Line Crossovers: Buy when the SMI rises above its signal line and sell when the SMI falls
below the signal line.
3. Divergences: For example, where prices are making a series of new highs and the SMI is failing to
surpass its previous highs.
Construction
1. Click the Ribbon>Technical Analysis menu>Indicators group>Indicator Builder command>
Indicator Builder window's [New] button
2. In the General tab, type the following text for each field:
Name: Stochastic Momentum Index
Function Name Alias: vt_SMI
© 2011 Visual Trading Systems, LLC
668
VT Trader 2.0 Help Manual
Label Mask:
SMI (%lp%,%sm%,%dsmp%,%sig%) = %SMI%
SMI Signal = %SMI_Sig%
Placement: New Frame
Data Inspection Alias: Stochastic Momentum Index
3. In the Input Variable(s) tab, create the following variables:
[New] button...
Name: lp
Display Name: Lookback Periods
Type: integer
Default: 13
[New] button...
Name: sm
Display Name: Smoothing Periods
Type: integer
Default: 25
[New] button...
Name: dsmp
Display Name: Double Smoothing Periods
Type: integer
Default: 2
[New] button...
Name: sig
Display Name: Signal Line Periods
Type: integer
Default: 3
4. In the Output Variable(s) tab, create the following variables:
[New] button...
Var Name: SMI
Name: (SMI)
Line Color: light blue
Line Width: slightly thicker
Line Type: solid
[New] button...
Var Name: SMI_Sig
Name: (SMI Signal Line)
Line Color: blue
Line Width: thin
Line Type: dashed
5. In the Horizontal Line tab, create the following lines:
[New] button...
Value: +40.0000
Color: red
© 2011 Visual Trading Systems, LLC
Technical Indicators
669
Width: thin
Type: dashed
[New] button...
Value: +0.0000
Color: black
Width: thin
Type: dashed
[New] button...
Value: -40.0000
Color: red
Width: thin
Type: dashed
6. In the Formula tab, copy and paste the following formula:
SMI:= 100 * (Mov(Mov(C-(0.5*(HHV(H,lp)+LLV(L,lp))),sm,E),dsmp,E) /
(0.5*Mov(Mov(HHV(H,lp)-LLV(L,lp),sm,E),dsmp,E)));
SMI_Sig:= mov(SMI,sig,E);
7. Click the "Save" icon to finish building the Stochastic Momentum Index indicator.
6.94
Stochastic Oscillator (Fast)
Overview
Developed by George C. Lane in the 1950's, the Stochastic Oscillator comes in 3 flavors: Fast, Slow,
and Full. The Stochastic Oscillator is a momentum indicator designed to show the relation of the current
close price relative to the high/low range over a given number of periods using a scale of 0-100. It is
based on the assumption that in a rising market the price(s) will close near the high of the range and in a
declining market the price(s) will close near the low of the range.
The Stochastic Oscillators are typically plotted as 2 lines: %K and %D. %K is the main (fast) line and
%D is the signal (slow) line.
The Fast Stochastic Oscillator is calculated by the formula:
Fast %K = ((Today's Close - Lowest Low in %K Periods) / (Highest High in %K Periods - Lowest Low in
%K Periods)) * 100
%D = 3-period simple moving average of Fast %K
© 2011 Visual Trading Systems, LLC
670
VT Trader 2.0 Help Manual
Interpretation
There are three basic techniques for using the various Stochastic Oscillators to generate trading signals.
Crossovers: 1) %K line / %D line Crossover: A buy signal occurs When the %K line crosses above the
%D line and a sell signal occurs when the %K line crosses below the %D line. 2) %K line / 50-level
Crossover: When the %K line crosses above 50 a buy signal is given. Alternatively, when the %K line
crosses below 50 a sell signal is given.
Divergence: Looking for divergences between the Stochastic Oscillator and price can prove to be very
effective in identifying potential reversal points in price movement. Trade long on Classic Bullish
Divergence: Lower lows in price and higher lows in the Stochastic Oscillator; Trade short on Classic
Bearish Divergence: Higher highs in price and lower highs in the Stochastic Oscillator.
Overbought/Oversold Conditions: The Stochastic Oscillator can be used to identify potential overbought
and oversold conditions in price movements. An Overbought condition is generally described as the
Stochastic Oscillator being greater than or equal to the 80% level while an oversold condition is generally
described as the Stochastic Oscillator being less than or equal to the 20% level. Trades can be
generated when the Stochastic Oscillator crosses these levels. A buy signal occurs when the
Stochastic Oscillator declines below 20% and then rises above that level. A sell signal occurs when the
Stochastic Oscillator rises above 80% and then declines below that level.
Construction
1. Click the Ribbon>Technical Analysis menu>Indicators group>Indicator Builder command>
© 2011 Visual Trading Systems, LLC
Technical Indicators
Indicator Builder window's [New] button
2. In the General tab, type the following text for each field:
Name: Stochastic Oscillator (Fast)
Function Name Alias: vt_StochOscFast
Label Mask:
Fast Stochastic Osc. (%K%,%D%,%Mt%)
K = %StK%, D = %StD%
Placement: New Frame
Data Inspection Alias: Fast Stochastic Osc.
3. In the Input Variable(s) tab, create the following variables:
[New] button...
Name: K
Display Name: %K Periods
Type: integer (with bounds)
Default: 14
Min Bounds: 1
Max Bounds: 9999
[New] button...
Name: D
Display Name: %D Periods
Type: integer (with bounds)
Default: 3
Min Bounds: 1
Max Bounds: 9999
[New] button...
Name: Mt
Display Name: %D Method
Type: MA Type
Default: Simple
4. In the Output Variable(s) tab, create the following variables:
[New] button...
Var Name: StK
Name: (%K)
Line Color: dark green
Line Width: thin
Line Type: solid
[New] button...
Var Name: StD
Name: (%D)
Line Color: dark green
Line Width: thin
Line Type: dashed
5. In the Horizontal Line tab, create the following lines:
© 2011 Visual Trading Systems, LLC
671
672
VT Trader 2.0 Help Manual
[New] button...
Value: +80.0000
Color: red
Width: thin
Type: dashed
[New] button...
Value: +20.0000
Color: red
Width: thin
Type: dashed
6. In the Formula tab, copy and paste the following formula:
StK:= ((C-LLV(L,K))/(HHV(H,K)-LLV(L,K)))*100;
StD:= Mov(StK,D,Mt);
7. Click the "Save" icon to finish building the Fast Stochastic Oscillator indicator.
6.95
Stochastic Oscillator (Full)
Overview
Developed by George C. Lane in the 1950's, the Stochastic Oscillator comes in 3 flavors: Fast, Slow,
and Full. The Stochastic Oscillator is a momentum indicator designed to show the relation of the current
close price relative to the high/low range over a given number of periods using a scale of 0-100. It is
based on the assumption that in a rising market the price(s) will close near the high of the range and in a
declining market the price(s) will close near the low of the range.
The Stochastic Oscillators are typically plotted as 2 lines: %K and %D. %K is the main (fast) line and
%D is the signal (slow) line.
The Full Stochastic Oscillator is calculated by the formula:
Fast %K = ((Today's Close - Lowest Low in %K Periods) / (Highest High in %K Periods - Lowest Low in
%K Periods)) * 100
Slowing %K = N-period moving average of Fast %K
%D = N-period simple moving average of Slowing %K
© 2011 Visual Trading Systems, LLC
Technical Indicators
673
Interpretation
There are three basic techniques for using the various Stochastic Oscillators to generate trading signals.
Crossovers: 1) %K line / %D line Crossover: A buy signal occurs When the %K line crosses above the
%D line and a sell signal occurs when the %K line crosses below the %D line. 2) %K line / 50-level
Crossover: When the %K line crosses above 50 a buy signal is given. Alternatively, when the %K line
crosses below 50 a sell signal is given.
Divergence: Looking for divergences between the Stochastic Oscillator and price can prove to be very
effective in identifying potential reversal points in price movement. Trade long on Classic Bullish
Divergence: Lower lows in price and higher lows in the Stochastic Oscillator; Trade short on Classic
Bearish Divergence: Higher highs in price and lower highs in the Stochastic Oscillator.
Overbought/Oversold Conditions: The Stochastic Oscillator can be used to identify potential overbought
and oversold conditions in price movements. An Overbought condition is generally described as the
Stochastic Oscillator being greater than or equal to the 80% level while an oversold condition is generally
described as the Stochastic Oscillator being less than or equal to the 20% level. Trades can be
generated when the Stochastic Oscillator crosses these levels. A buy signal occurs when the
Stochastic Oscillator declines below 20% and then rises above that level. A sell signal occurs when the
Stochastic Oscillator rises above 80% and then declines below that level.
Construction
1. Click the Ribbon>Technical Analysis menu>Indicators group>Indicator Builder command>
© 2011 Visual Trading Systems, LLC
674
VT Trader 2.0 Help Manual
Indicator Builder window's [New] button
2. In the General tab, type the following text for each field:
Name: Stochastic Oscillator (Full)
Function Name Alias: vt_StochOscFull
Label Mask:
Full Stochastic Osc. (%K%,%Sl%,%MtK%,%D%,%Mt%)
K = %StDK%, D = %StDD%
Placement: New Frame
Data Inspection Alias: Full Stochastic Osc.
3. In the Input Variable(s) tab, create the following variables:
[New] button...
Name: K
Display Name: %K Periods
Type: integer (with bounds)
Default: 14
Min Bounds: 1
Max Bounds: 9999
[New] button...
Name: Sl
Display Name: %K Slowing Periods
Type: integer (with bounds)
Default: 3
Min Bounds: 1
Max Bounds: 9999
[New] button...
Name: MtK
Display Name: %K Slowing Method
Type: MA Type
Default: Simple
[New] button...
Name: D
Display Name: %D Periods
Type: integer (with bounds)
Default: 3
Min Bounds: 1
Max Bounds: 9999
[New] button...
Name: Mt
Display Name: %D Method
Type: MA Type
Default: Simple
4. In the Output Variable(s) tab, create the following variables:
[New] button...
© 2011 Visual Trading Systems, LLC
Technical Indicators
675
Var Name: StDK
Name: (%K)
Line Color: dark blue
Line Width: thin
Line Type: solid
[New] button...
Var Name: StDD
Name: (%D)
Line Color: dark blue
Line Width: thin
Line Type: dashed
5. In the Horizontal Line tab, create the following lines:
[New] button...
Value: +80.0000
Color: red
Width: thin
Type: dashed
[New] button...
Value: +20.0000
Color: red
Width: thin
Type: dashed
6. In the Formula tab, copy and paste the following formula:
StK:= ((C-LLV(L,K))/(HHV(H,K)-LLV(L,K)))*100;
StDK:= Mov(StK,Sl,MtK);
StDD:= Mov(StDK,D,Mt);
7. Click the "Save" icon to finish building the Full Stochastic Oscillator indicator.
6.96
Stochastic Oscillator (Slow)
Overview
Developed by George C. Lane in the 1950's, the Stochastic Oscillator comes in 3 flavors: Fast, Slow,
and Full. The Stochastic Oscillator is a momentum indicator designed to show the relation of the current
close price relative to the high/low range over a given number of periods using a scale of 0-100. It is
based on the assumption that in a rising market the price(s) will close near the high of the range and in a
declining market the price(s) will close near the low of the range.
The Stochastic Oscillators are typically plotted as 2 lines: %K and %D. %K is the main (fast) line and
%D is the signal (slow) line.
© 2011 Visual Trading Systems, LLC
676
VT Trader 2.0 Help Manual
The Slow Stochastic Oscillator is calculated by the formula:
Fast %K = ((Today's Close - Lowest Low in %K Periods) / (Highest High in %K Periods - Lowest Low in
%K Periods)) * 100
Slowing %K = 3-period simple moving average of Fast %K
%D = 3-period simple moving average of Slowing %K
Interpretation
There are three basic techniques for using the various Stochastic Oscillators to generate trading signals.
Crossovers: 1) %K line / %D line Crossover: A buy signal occurs When the %K line crosses above the
%D line and a sell signal occurs when the %K line crosses below the %D line. 2) %K line / 50-level
Crossover: When the %K line crosses above 50 a buy signal is given. Alternatively, when the %K line
crosses below 50 a sell signal is given.
Divergence: Looking for divergences between the Stochastic Oscillator and price can prove to be very
effective in identifying potential reversal points in price movement. Trade long on Classic Bullish
Divergence: Lower lows in price and higher lows in the Stochastic Oscillator; Trade short on Classic
Bearish Divergence: Higher highs in price and lower highs in the Stochastic Oscillator.
Overbought/Oversold Conditions: The Stochastic Oscillator can be used to identify potential overbought
and oversold conditions in price movements. An Overbought condition is generally described as the
Stochastic Oscillator being greater than or equal to the 80% level while an oversold condition is generally
described as the Stochastic Oscillator being less than or equal to the 20% level. Trades can be
generated when the Stochastic Oscillator crosses these levels. A buy signal occurs when the
© 2011 Visual Trading Systems, LLC
Technical Indicators
677
Stochastic Oscillator declines below 20% and then rises above that level. A sell signal occurs when the
Stochastic Oscillator rises above 80% and then declines below that level.
Construction
1. Click the Ribbon>Technical Analysis menu>Indicators group>Indicator Builder command>
Indicator Builder window's [New] button
2. In the General tab, type the following text for each field:
Name: Stochastic Oscillator (Slow)
Function Name Alias: vt_StochOscSlow
Label Mask:
Slow Stochastic Osc. (%K%,%Sl%,%MtK%,%D%,%Mt%)
K = %StDK%, D = %StDD%
Placement: New Frame
Data Inspection Alias: Slow Stochastic Osc.
3. In the Input Variable(s) tab, create the following variables:
[New] button...
Name: K
Display Name: %K Periods
Type: integer (with bounds)
Default: 14
Min Bounds: 1
Max Bounds: 9999
[New] button...
Name: Sl
Display Name: %K Slowing Periods
Type: integer (with bounds)
Default: 3
Min Bounds: 1
Max Bounds: 9999
[New] button...
Name: MtK
Display Name: %K Slowing Method
Type: MA Type
Default: Simple
[New] button...
Name: D
Display Name: %D Periods
Type: integer (with bounds)
Default: 3
Min Bounds: 1
Max Bounds: 9999
[New] button...
© 2011 Visual Trading Systems, LLC
678
VT Trader 2.0 Help Manual
Name: Mt
Display Name: %D Method
Type: MA Type
Default: Simple
4. In the Output Variable(s) tab, create the following variables:
[New] button...
Var Name: StDK
Name: (%K)
Line Color: dark blue
Line Width: thin
Line Type: solid
[New] button...
Var Name: StDD
Name: (%D)
Line Color: dark blue
Line Width: thin
Line Type: dashed
5. In the Horizontal Line tab, create the following lines:
[New] button...
Value: +80.0000
Color: red
Width: thin
Type: dashed
[New] button...
Value: +20.0000
Color: red
Width: thin
Type: dashed
6. In the Formula tab, copy and paste the following formula:
StK:= ((C-LLV(L,K))/(HHV(H,K)-LLV(L,K)))*100;
StDK:= Mov(StK,Sl,MtK);
StDD:= Mov(StDK,D,Mt);
7. Click the "Save" icon to finish building the Slow Stochastic Oscillator.
6.97
Stochastic RSI Oscillator
Overview
© 2011 Visual Trading Systems, LLC
Technical Indicators
679
Introduced by Tuschar Chande and Stanley Kroll in their December, 1992 Stocks and Commodities
article entitled, “Stochastic RSI and Dynamic Momentum Index”, the Stochastic RSI Oscillator attempts
to combine ideas from two indicators - the Relative Strength Index (RSI) and the Stochastic Oscillator.
As its name implies, the Stochastic RSI Oscillator is the RSI run through the stochastic algorithm. The
Stochastic RSI Oscillator is a momentum indicator designed to show the relation of the current RSI
value relative to its high/low range over a given number of periods using a scale of 0-100.
The Stochastic RSI Oscillator, much like the other stochastic oscillators, is typically plotted as 2 lines:
the StochRSI line and %D. The StochRSI is the main (fast) line and %D is the signal (slow) line.
The Stochastic RSI Oscillator is calculated by the formula:
StochRSI = ((Today's RSI - Lowest RSI Low in %K Periods) / (Highest RSI High in %K Periods - Lowest
RSI Low in %K Periods)) * 100
Slowing StochRSI = 3-period moving average of StochRSI; using a 1-period moving average of StochRSI
eliminates this slowing (or smoothing) of the StochRSI
%D = 3-period moving average of Slowing StochRSI
Interpretation
There are three basic techniques for using the Stochastic RSI Oscillator to generate trading signals.
Crossovers: 1) StochRSI / %D line Crossover: A buy signal occurs When the StochRSI crosses above
the %D line and a sell signal occurs when the StochRSI crosses below the %D line. 2) StochRSI / 50level Crossover: When the StochRSI crosses above 50 a buy signal is given. Alternatively, when the
© 2011 Visual Trading Systems, LLC
680
VT Trader 2.0 Help Manual
StochRSI crosses below 50 a sell signal is given.
Divergence: Looking for divergences between the Stochastic RSI Oscillator and price can prove to be
very effective in identifying potential reversal points in price movement. Trade long on Classic Bullish
Divergence: Lower lows in price and higher lows in the Stochastic RSI Oscillator; Trade short on Classic
Bearish Divergence: Higher highs in price and lower highs in the Stochastic RSI Oscillator.
Overbought/Oversold Conditions: The Stochastic RSI Oscillator can be used to identify potential
overbought and oversold conditions in price movements. An Overbought condition is generally described
as the Stochastic RSI Oscillator being greater than or equal to the 80% level while an oversold condition
is generally described as the Stochastic Oscillator being less than or equal to the 20% level. Trades can
be generated when the Stochastic RSI Oscillator crosses these levels. A buy signal occurs when the
Stochastic RSI Oscillator declines below 20% and then rises above that level. A sell signal occurs when
the Stochastic RSI Oscillator rises above 80% and then declines below that level.
Construction
1. Click the Ribbon>Technical Analysis menu>Indicators group>Indicator Builder command>
Indicator Builder window's [New] button
2. In the General tab, type the following text for each field:
Name: Stochastic RSI Oscillator
Function Name Alias: vt_StochRSI
Label Mask: Stochastic RSI Osc. (%rsiprice%,%rsiperiods%,%PerK%,%Sl%,%
mtK%,%PerD%,%mtD%) = %StochRSI%
Placement: New Frame
Data Inspection Alias: Stochastic RSI Osc.
3. In the Input Variable(s) tab, create the following variables:
[New] button...
Name: rsiprice
Display Name: RSI Price
Type: price
Default: close
[New] button...
Name: rsiperiods
Display Name: RSI Periods
Type: integer
Default: 14
[New] button...
Name: PerK
Display Name: Stochastic RSI %K Periods
Type: integer
Default: 14
[New] button...
Name: Sl
© 2011 Visual Trading Systems, LLC
Technical Indicators
Display Name: Stochastic RSI %K Slowing Periods
Type: integer
Default: 1
[New] button...
Name: mtK
Display Name: Stochastic RSI %K Method
Type: MA Type
Default: Simple
[New] button...
Name: PerD
Display Name: Stochastic RSI %D Periods
Type: integer
Default: 3
[New] button...
Name: mtD
Display Name: Stochastic RSI %D Method
Type: MA Type
Default: Simple
4. In the Output Variable(s) tab, create the following variables:
[New] button...
Var Name: StochRSI
Name: (StochRSI)
Line Color: purple
Line Width: thin
Line Type: solid
[New] button...
Var Name: StochRsiD
Name: (StochRSI %D)
Line Color: purple
Line Width: thin
Line Type: dashed
5. In the Horizontal Line tab, create the following lines:
[New] button...
Value: +80.0000
Color: red
Width: thin
Type: dashed
[New] button...
Value: +50.0000
Color: gray
Width: thin
Type: dashed
[New] button...
© 2011 Visual Trading Systems, LLC
681
682
VT Trader 2.0 Help Manual
Value: +20.0000
Color: red
Width: thin
Type: dashed
6. In the Formula tab, copy and paste the following formula:
{Relative Strength Index}
rsi_r:= (rsiprice - ref(rsiprice,-1));
rsi_rs:= Wilders(if(rsi_r>0,rsi_r,0),rsiperiods) / Wilders(if(rsi_r<0,
abs(rsi_r),0),rsiperiods);
RS:= 100-(100/(1+rsi_rs));
{Stochastic RSI Oscillator}
StochRSI:= Mov((((RS-LLV(RS,PerK)) / (HHV(RS,PerK)-LLV(RS,PerK)))*100),
Sl,mtK);
StochRsiD:= mov(StochRSI,PerD,mtD);
7. Click the "Save" icon to finish building the Stochastic RSI Oscillator indicator.
6.98
Stoller Average Range Channels (STARC Bands)
Overview
The Stoller Average Range Channels (a.k.a. STARC Bands) indicator was developed by Manning Stoller
in the 1980's. Similar to Bollinger Bands, the STARC bands are designed to interpret market volatility
using a measure of the Average True Range (ATR). The STARC Bands create a channel above and
below a moving average of the instrument's underlying price; the width of the channel expands and
contracts depending on the fluctuation in the ATR.
The upper STARC band is calculated by adding a value of the (ATR * ATRMultiplier) to the moving
average. The lower STARC band is calculated by subtracting a value of the (ATR * ATR Multiplier) to the
moving average.
© 2011 Visual Trading Systems, LLC
Technical Indicators
683
Interpretation
The STARC Bands are considered to encapsulate the majority of the instrument's price action between
the bands allowing the bands to define the normal upper and lower limits of price action. This helps the
trader determine higher probability, lower risk trading opportunities using the general assumption that
price often returns to its median (the moving average).
Price action that rises to the upper band offers a lower risk selling opportunity (and a high risk
buying opportunity).
Price action that declines to the lower band offers a lower risk buying opportunity (and a high risk
selling opportunity).
These assumptions are not to say that the price action will not go against these rules. In fact, some
traders believe that a penetration of the upper or lower STARC band indicates an increased momentum
in the direction of the band penetration.
Construction
1. Click the Ribbon>Technical Analysis menu>Indicators group>Indicator Builder command>
Indicator Builder window's [New] button
2. In the General tab, type the following text for each field:
Name: Stoller Average Range Channels (STARC Bands)
Function Name Alias: vt_STARC
© 2011 Visual Trading Systems, LLC
684
VT Trader 2.0 Help Manual
Label Mask:
STARC Bands (%atrperiods%,%atrdev%,%mapr%,%maper%,%mtp%)
Middle = %MiddleBand%, Upper = %UpperBand%, Lower = %LowerBand%
Placement: New Frame
Data Inspection Alias: STARC Bands
3. In the Input Variable(s) tab, create the following variables:
[New] button...
Name: atrperiods
Display Name: ATR Periods
Type: integer
Default: 15
[New] button...
Name: atrdev
Display Name: ATR Multiplier
Type: float (with bounds)
Default: 2.0000
Max Bounds: 0.1000
Min Bounds: 10.0000
[New] button...
Name: mapr
Display Name: STARC Bands Price
Type: price
Default: Typical Price
[New] button...
Name: maper
Display Name: STARC Bands Periods
Type: integer
Default: 6
[New] button...
Name: mtp
Display Name: STARC Bands Type
Type: MA Type
Default: Simple
4. In the Output Variable(s) tab, create the following variables:
[New] button...
Var Name: UpperBand
Name: (Upper Band)
Line Color: purple
Line Width: thin
Line Type: solid
[New] button...
Var Name: MiddleBand
Name: (Middle Band)
Line Color: dark blue
© 2011 Visual Trading Systems, LLC
Technical Indicators
685
Line Width: thin
Line Type: dashed
[New] button...
Var Name: LowerBand
Name: (Lower Band)
Line Color: purple
Line Width: thin
Line Type: solid
5. In the Horizontal Line tab, create the following lines:
This indicator requires no horizontal lines.
6. In the Formula tab, copy and paste the following formula:
ATRange:= ATR(atrperiods);
UpperBand:= Mov(mapr,maper,mtp) + (atrdev * ATRange);
MiddleBand:= Mov(mapr,maper,mtp);
LowerBand:= Mov(mapr,maper,mtp) - (atrdev * ATRange);
7. Click the "Save" icon to finish building the Stoller Average Range Channels indicator.
6.99
Support and Resistance
Overview
Support levels indicate the price where the majority of investors believe that prices will move higher, while
resistance levels indicate the price at which a majority of investors feel prices will move lower. Prices
often tend to “bounce” off of these levels rather than break through them. However, once price has broken
through a support or resistance level it is likely to continue moving in that direction until it encounters the
next support or resistance level.
An interesting phenomenon of support and resistance levels is that once a support level has been broken
it often becomes a new resistance level and, alternatively, when a resistance level is broken it often
becomes a new support level.
Another point of interest is that the more often a support or resistance level is “tested” (that is touched
and bounced off of by price), the more significance that particular support or resistance level gains.
© 2011 Visual Trading Systems, LLC
686
VT Trader 2.0 Help Manual
Interpretation
Support and resistance levels can be calculated using several different methods: trend lines, Fibonacci
ratios, pivot point calculations are just a few. VT Trader uses a different method to construct this
“Support and Resistance” indicator. Resistance levels are calculated by finding the highest high value
over the previous n-periods at each occurrence of the price crossing below an n-periods simple moving
average of price. Support levels are calculated by finding the lowest low value over the previous n-periods
at each occurrence of the price crossing above an n-periods simple moving average of price.
There are two basic techniques for using the support and resistance levels to generate trading signals.
Price Breakouts: When trading price breakouts, a buy signal occurs when the price breaks up through a
resistance level. A sell signal occurs when price breaks down through a support level. When a previous
resistance level is broken it has the potential to become a new support level and vice versa. When a
previous support level is broken it has the potential to become a new resistance level.
Price Reversals: When trading price reversals, a buy signal occurs when the price moves towards a
support level, gets very close to it, touches it, or moves only slightly through it, and then reverses and
moves back in the opposite direction. A sell signal occurs when the price moves towards a resistance
level, gets very close to it, touches it, or moves only slightly through it, and then reverses and moves
back in the opposite direction.
Construction
1. Click the Ribbon>Technical Analysis menu>Indicators group>Indicator Builder command>
© 2011 Visual Trading Systems, LLC
Technical Indicators
Indicator Builder window's [New] button
2. In the General tab, type the following text for each field:
Name: Support and Resistance
Function Name Alias: vt_SupRes
Label Mask:
Support (%LBP%) = %Sup%
Resistance (%LBP%) = %Res%
Placement: Price Frame
Data Inspection Alias: Support and Resistance
3. In the Input Variable(s) tab, create the following variables:
[New] button...
Name: LBP
Display Name: Lookback Periods
Type: integer (with bounds)
Default: 10
Min Bounds: 1
Max Bounds: 9999
4. In the Output Variable(s) tab, create the following variables:
[New] button...
Var Name: Res
Name: (Resistance)
Line Color: red
Line Width: slightly thicker
Line Type: dots
[New] button...
Var Name: Sup
Name: (Support)
Line Color: blue
Line Width: slightly thicker
Line Type: dots
5. In the Horizontal Line tab, create the following lines:
This indicator requires no horizontal lines.
6. In the Formula tab, copy and paste the following formula:
Res:= valuewhen(1,Cross(Mov(C,LBP,S),C),HHV(H,LBP));
Sup:= valuewhen(1,Cross(C,Mov(C,LBP,S)),LLV(L,LBP));
7. Click the "Save" icon to finish building the Support and Resistance indicator.
© 2011 Visual Trading Systems, LLC
687
688
VT Trader 2.0 Help Manual
6.100 T3 Moving Average
Overview
The T3 Moving Average was described by Tim Tillson in the January 1998 issue of Technical Analysis of
Stocks & Commodities article "Smoothing Techniques for More Accurate Signals". The T3 is a
significant improvement over traditional moving averages; it's smoother with much less lag. However, it
can "overshoot" price as it attempts to re-align itself with current market prices.
Interpretation
The T3 Moving Average can be used in place of traditional moving averages. Please refer to the "Moving
Average" indicator for additional details.
Construction
1. Click the Ribbon>Technical Analysis menu>Indicators group>Indicator Builder command>
Indicator Builder window's [New] button
2. In the General tab, type the following text for each field:
Name: T3 Moving Average
Function Name Alias: vt_T3MA
© 2011 Visual Trading Systems, LLC
Technical Indicators
Label Mask: T3 MA (%Pr%,%tPr%,%mt%,%b%) = %T3MA%
Placement: Price Frame
Data Inspection Alias: T3 Moving Average
3. In the Input Variable(s) tab, create the following variables:
[New] button...
Name: Pr
Display Name: Price
Type: price
Default: close
[New] button...
Name: tPr
Display Name: Periods
Type: integer
Default: 8
[New] button...
Name: mt
Display Name: MA Type
Type: MA Type
Default: Exponential
[New] button...
Name: b
Display Name: Volume Factor
Type: float (with bounds)
Default: 0.7
Min Bounds: 0.0000
Max Bounds: 5.0000
4. In the Output Variable(s) tab, create the following variables:
[New] button...
Var Name: T3MA
Name: (T3)
Line Color: light blue
Line Width: thin
Line Type: solid
5. In the Horizontal Line tab, create the following lines:
This indicator requires no horizontal lines.
6. In the Formula tab, copy and paste the following formula:
e1:=
e2:=
e3:=
e4:=
e5:=
e6:=
Mov(Pr,tPr,mt);
Mov(e1,tPr,mt);
Mov(e2,tPr,mt);
Mov(e3,tPr,mt);
Mov(e4,tPr,mt);
Mov(e5,tPr,mt);
© 2011 Visual Trading Systems, LLC
689
690
VT Trader 2.0 Help Manual
c1:= -b*b*b;
c2:= 3*b*b+3*b*b*b;
c3:= -6*b*b-3*b-3*b*b*b;
c4:= 1+3*b+b*b*b+3*b*b;
T3MA:= c1*e6+c2*e5+c3*e4+c4*e3;
7. Click the "Save" icon to finish building Tim Tillson's T3 Moving Average.
6.101 Trailing Stoploss Levels (Volatility-Based)
Overview
The Trailing Stoploss Levels (Volatility-Based) indicator is based from Chande & Kroll's "The New
Technical Trader", p.167, 'Volatility-Based Trailing Stops'.
The Trailing Stoploss Levels (Volatility-Based) indicator "trails" (or follows) above and below price based
on its position respective to the price. It can be set to trail above or below prices based on volatility.
Volatility-related settings are available to allow fine-tuning of the indicator.
Interpretation
© 2011 Visual Trading Systems, LLC
Technical Indicators
691
Trailing Stoploss levels, either volatility-based or pip-based, have become very popular with traders as a
non-emotional exit strategy for their trading methodology. Trailing Stoplosses help to remove the emotion
usually involved with exiting trades thereby helping to control risk.
In a long position, the trailing stoploss level trails (or follows) below price and ratchets itself higher as
prices rise. Conversely, in a short position, the trailing stoploss level trails (or follows) above price and
ratchets itself lower as prices fall. However, if price retreats back towards the trailing stoploss level the
trailing stoploss level will remain at its previous level never "backing away" from price thus helping to
protect potential profits or limit loss. A long trade exit is signaled when price crosses back below the
trailing stoploss level. A short trade exit is signaled when price crosses back above the trailing stoploss
level.
Construction
1. Click the Ribbon>Technical Analysis menu>Indicators group>Indicator Builder command>
Indicator Builder window's [New] button
2. In the General tab, type the following text for each field:
Name: Trailing Stoploss Levels (Volatility-Based)
Function Name Alias: vt_TSLATR
Label Mask:
Trailing Stoploss Levels (Volatility) (%Pds1%,%Mult%,%Pds2%)
Long Stop = %ActualStopLong%, Short Stop = %ActualStopShort%
Placement: Price Frame
Data Inspection Alias: Trailing Stoploss Levels (Volatility)
3. In the Input Variable(s) tab, create the following variables:
[New] button...
Name: Pds1
Display Name: ATR Lookback
Type: integer (with bounds)
Default: 10
Min Bounds: 2
Max Bounds: 9999
[New] button...
Name: Mult
Display Name: ATR Multiplier
Type: float (with bounds)
Default: 3.0000
Min Bounds: 1.0000
Max Bounds: 20.0000
[New] button...
Name: Pds2
Display Name: Period Lookback
Type: integer (with bounds)
Default: 20
Min Bounds: 2
© 2011 Visual Trading Systems, LLC
692
VT Trader 2.0 Help Manual
Max Bounds: 9999
4. In the Output Variable(s) tab, create the following variables:
[New] button...
Var Name: ActualStopLong
Name: (Long Stoploss)
Line Color: blue
Line Width: thin
Line Type: dashed
[New] button...
Var Name: ActualStopShort
Name: (Short Stoploss)
Line Color: red
Line Width: thin
Line Type: dashed
5. In the Horizontal Line tab, create the following lines:
This indicator requires no horizontal lines.
6. In the Formula tab, copy and paste the following formula:
{Volatility Stop (Long)}
PrelimStopLong:= HHV(H,Pds1) - ATR(Pds1)*Mult;
ActualStopLong:= HHV(PrelimStopLong,Pds2);
{Volatility Stop (Short)}
PrelimStopShort:= LLV(L,Pds1) + ATR(Pds1)*Mult;
ActualStopShort:= LLV(PrelimStopShort,Pds2);
7. Click the "Save" icon to finish building the Volatility-Based Trailing Stoploss Levels indicator.
6.102 Trailing Stoploss Reversal Level
Overview
The Trailing Stoploss Reversal Level indicator "trails" (or follows) above or below price depending on its
position respective to the price. It can be set to trail above or below prices based on volatility or a userdefined number of pips. Volatility-related settings and Pip-based settings are available to allow the user
fine-tuning of the indicator.
© 2011 Visual Trading Systems, LLC
Technical Indicators
693
Interpretation
Trailing Stoploss levels, either volatility-based or pip-based, have become very popular with traders as a
non-emotional exit strategy for their trading methodology. Trailing Stoplosses help to remove the emotion
usually involved with exiting trades thereby helping to control risk.
In a long position, the trailing stoploss level trails (or follows) below price and ratchets itself higher as
prices rise. Conversely, in a short position, the trailing stoploss level trails (or follows) above price and
ratchets itself lower as prices fall. However, if price retreats back towards the trailing stoploss level the
trailing stoploss level will remain at its previous level never "backing away" from price thus helping to
protect potential profits or limit loss. A long trade exit is signaled when price crosses back below the
trailing stoploss level. A short trade exit is signaled when price crosses back above the trailing stoploss
level.
Construction
1. Click the Ribbon>Technical Analysis menu>Indicators group>Indicator Builder command>
Indicator Builder window's [New] button
2. In the General tab, type the following text for each field:
Name: Trailing Stoploss Reversal Level
Function Name Alias: vt_TSL
Label Mask: Trailing Stoploss Reversal Level (%Mode%,%atrperiods%,%
atrsmperiods%,%atrmult%,%Pips%) = %TSL%
© 2011 Visual Trading Systems, LLC
694
VT Trader 2.0 Help Manual
Placement: Price Frame
Data Inspection Alias: Trailing Stoploss Level
3. In the Input Variable(s) tab, create the following variables:
[New] button...
Name: price
Display Name: Price
Type: price
Default: close
[New] button...
Name: Mode
Display Name: Trailing Stoploss Mode
Type: Enumeration
Default: click [...] button, [New] button, then create the following
entries:
Volatility
Pips
... then, click [OK] button
Default: Volatility
[New] button...
Name: atrperiods
Display Name: If Volatility, ATR Periods
Type: integer
Default: 14
[New] button...
Name: atrsmperiods
Display Name: If Volatility, Wilders ATR Smoothing Periods
Type: integer
Default: 14
[New] button...
Name: atrmult
Display Name: If Volatility, ATR Multiplier
Type: float
Default: 2.8240
[New] button...
Name: Pips
Display Name: If Pips, # of Pips to Trail
Type: integer
Default: 20
4. In the Output Variable(s) tab, create the following variables:
[New] button...
Var Name: TSL
Name: (TSL)
Line Color: red
Line Width: thin
© 2011 Visual Trading Systems, LLC
Technical Indicators
695
Line Type: dashed
5. In the Horizontal Line tab, create the following lines:
This indicator requires no horizontal lines.
6. In the Formula tab, copy and paste the following formula:
_Pips:= Pips*SymbolPoint();
DeltaStop:= if(Mode=0,Wilders(ATR(atrperiods),atrsmperiods)*atrmult,
_Pips);
TSL:= if(BarCount()>(atrperiods+atrsmperiods),
if(ref(price,-1)>PREV(0) AND price>PREV(0),max(PREV(0),priceDeltaStop),
if(ref(price,-1)<PREV(0) AND price<PREV(0),min(PREV(0),
price+DeltaStop),
if(Cross(price,PREV(0)),price-DeltaStop,
if(Cross(PREV(0),price),price+DeltaStop,
if(price=PREV(0),PREV(0),PREV(0)))))),
NULL);
7. Click the "Save" icon to finish building the Trailing Stoploss Reversal Level indicator.
6.103 Trend Continuation Factor
Overview
The Trend Continuation Factor (TCF) was introduced by M. H. Pee. in the article "Trend Continuation
Factor". It was designed to help identify the market trend and direction.
© 2011 Visual Trading Systems, LLC
696
VT Trader 2.0 Help Manual
Interpretation
Positive values of either the PlusTCF or MinusTCF lines indicate a strong prevailing trend. Positive values
of PlusTCF indicate a strong Uptrend, while positive values of MinusTCF indicate a strong Downtrend.
Both PlusTCF and MinusTCF cannot be positive at the same time since an uptrend and a downtrend
cannot occur simultaneously. However, PlusTCF and MinusTCF can both be negative; this signifies
market consolidation (the absence of a prevailing trend).
Typical trading strategies include entering Buy positions when PlusTCF is positive and entering Sell
positions when MinusTCF is positive. An alternative trading strategy may include entering trades based
on the crossings of PlusTCF and MinusTCF.
Construction
1. Click the Ribbon>Technical Analysis menu>Indicators group>Indicator Builder command>
Indicator Builder window's [New] button
2. In the General tab, type the following text for each field:
Name: Trend Continuation Factor
Function Name Alias: vt_TCF
Label Mask:
Trend Continuation Factor (%prc%,%periods%)
PlusTCF = %PlusTCF%, MinusTCF = %MinusTCF%
Placement: New Frame
© 2011 Visual Trading Systems, LLC
Technical Indicators
Data Inspection Alias: Trend Continuation Factor
3. In the Input Variable(s) tab, create the following variables:
[New] button...
Name: prc
Display Name: Price
Type: price
Default: close
[New] button...
Name: periods
Display Name: Periods
Type: integer
Default: 35
4. In the Output Variable(s) tab, create the following variables:
[New] button...
Var Name: PlusTCF
Name: (PlusTCF)
Line Color: blue
Line Width: thin
Line Type: solid
[New] button...
Var Name: MinusTCF
Name: (MinusTCF)
Line Color: red
Line Width: thin
Line Type: solid
5. In the Horizontal Line tab, create the following lines:
This indicator requires no horizontal lines.
6. In the Formula tab, copy and paste the following formula:
pc:= If(ROC(prc,1,Points)>0,ROC(prc,1,Points),0);
nc:= If(ROC(prc,1,Points)<0,Neg(ROC(prc,1,Points)),0);
ncf:= If(nc=0,0,PREV(0)+nc);
PlusTCF:= Sum(pc,periods)-Sum(ncf,periods);
pc:= If(ROC(prc,1,Points)>0,ROC(prc,1,Points),0);
nc:= If(ROC(prc,1,Points)<0,Neg(ROC(prc,1,Points)),0);
pcf:= If(pc=0,0,PREV(0)+pc);
MinusTCF:= Sum(nc,periods)-Sum(pcf,periods);
7. Click the "Save" icon to finish building the Trend Continuation Factor indicator.
© 2011 Visual Trading Systems, LLC
697
698
VT Trader 2.0 Help Manual
6.104 Trend Intensity Index (TII)
Overview
Developed by M.H. Pee, the trend intensity index (TII) is used to indicate the strength of a current trend
in the market. It was introduced in the June 2002 issue of Technical Analysis of Stocks and
Commodities magazine.
Interpretation
TII determines the current strength of a price trend based on deviations of previous prices from a current
moving average.The stronger the current trend, the more likely the market will continue moving in its
current direction instead of changing course. According to M.H. Pee, values >80 and <20 indicate strong
trends.
Construction
1. Click the Ribbon>Technical Analysis menu>Indicators group>Indicator Builder command>
Indicator Builder window's [New] button
2. In the General tab, type the following text for each field:
Name: Trend Intensity Index (TII)
© 2011 Visual Trading Systems, LLC
Technical Indicators
Function Name Alias: vt_TII
Label Mask: Trend Intensity Index (%Pr%,%Periods%,%mt%) = %tii%
Placement: New Frame
Data Inspection Alias: Trend Intensity Index
3. In the Input Variable(s) tab, create the following variables:
[New] button...
Name: pr
Display Name: Price
Type: price
Default: close
[New] button...
Name: periods
Display Name: Periods
Type: integer
Default: 30
[New] button...
Name: mt
Display Name: MA Type
Type: MA Type
Default: Simple
4. In the Output Variable(s) tab, create the following variables:
[New] button...
Var Name: tii
Name: (tii)
Line Color: dark green
Line Width: slightly thicker
Line Type: solid
5. In the Horizontal Line tab, create the following lines:
[New] button...
Value: +80.0000
Color: red
Width: thin
Type: dashed
[New] button...
Value: +20.0000
Color: red
Width: thin
Type: dashed
6. In the Formula tab, copy and paste the following formula:
ma:= Mov(Pr,2*periods,mt);
sdp:= Sum(If(Pr-ma>0, Pr-ma,0),periods);
sdm:= Sum(If(ma-Pr>0, ma-Pr,0),periods);
© 2011 Visual Trading Systems, LLC
699
700
VT Trader 2.0 Help Manual
tii:= (sdp/(sdp + sdm)) * 100;
7. Click the "Save" icon to finish building the Trend Intensity Index (TII) indicator.
6.105 Trend Oscillator (tosc)
Overview
Developed by Dennis Meyers and described in his article entitled “The Japanese Yen, Recursed”
published in the December 1998 issue of Technical Analysis of Stocks and Commodities magazine, the
Trend Oscillator (a.k.a. tosc) is calculated by calculating the difference between Meyer's Recursive
Moving Trend Average (also described in that same article) and an exponential moving average of the
same n-periods.
Interpretation
Meyers mentions looking for changes in the price series that are above the normal noise fluctuations
indicating that a potential uptrend or downtrend has started. This is accomplished by examining the plot
of the tosc.
A potential buy signal is generated when the tosc’s value crosses above the “dup” level and a potential
© 2011 Visual Trading Systems, LLC
Technical Indicators
701
sell signal is generated when the tosc’s value crosses below the “-ddn” level.
During Meyer’s testing, the optimum “dup” and “-ddn” levels were calculated using optimization, walkforward testing, out-of-sample testing, and averaging of all testing results.
For additional information, including the mathematical formulas for the Recursive Moving Trend Average
and TOSC, please review Dennis Meyer’s whitepaper entitled “The Japanese Yen, Recursed” published
in 1998, which is available from his website.
Construction
1. Click the Ribbon>Technical Analysis menu>Indicators group>Indicator Builder command>
Indicator Builder window's [New] button
2. In the General tab, type the following text for each field:
Name: Trend Oscillator (tosc)
Function Name Alias: vt_TOSC
Label Mask: Trend Oscillator (tosc) (%Price%,%Periods%) = %TOSC%
Placement: New Frame
Data Inspection Alias: Trend Oscillator
3. In the Input Variable(s) tab, create the following variables:
[New] button...
Name: Price
Display Name: Price
Type: price
Default: close
[New] button...
Name: Periods
Display Name: Periods
Type: integer (with bounds)
Default: 21
Min. Bounds: 1
Max. Bounds: 9999
4. In the Output Variable(s) tab, create the following variables:
[New] button...
Var Name: TOSC
Name: (TOSC)
Line Color: dark purple
Line Width: thin
Line Type: histogram
5. In the Horizontal Line tab, create the following lines:
[New] button...
Value: +0.0000
© 2011 Visual Trading Systems, LLC
702
VT Trader 2.0 Help Manual
Color: black
Width: thin
Type: dashed
6. In the Formula tab, copy and paste the following formula:
Alpha:= 2/(Periods+1);
Bot:= (1-Alpha)*(If(BarCount()<Periods,Price,PREV(Price)))+Price;
RMTA:= (1-Alpha)*(If(BarCount()<Periods,Price,PREV(Price)))+(Alpha*Abs
(Price+Bot-Ref(Bot,-1)));
TOSC:= RMTA-Mov(Price,Periods,E);
7. Click the "Save" icon to finish building the Trend Oscillator (tosc) indicator.
6.106 Trend Trigger Factor (TTF)
Overview
M.H. Pee's article "Trend Trigger Factor" in the December 2004 issue of Technical Analysis of Stocks
and Commodities magazine (TASC) presents the Trend Trigger Factor (TTF) indicator. The TTF is a
method of detecting up-trends and down-trends using buy power and sell power calculations derived over
the previous n-periods.
© 2011 Visual Trading Systems, LLC
Technical Indicators
703
Interpretation
Typical uses include creating an always-in-the-market system whereby Sell trades are generated when
the TTF crosses down through the 100 level and Buy signals are generated when the TTF crosses up
through the -100 level.
Construction
1. Click the Ribbon>Technical Analysis menu>Indicators group>Indicator Builder command>
Indicator Builder window's [New] button
2. In the General tab, type the following text for each field:
Name: Trend Trigger Factor
Function Name Alias: vt_TTF
Label Mask: Trend Trigger Factor (%periods%) = %ttf%
Placement: New Frame
Data Inspection Alias: Trend Trigger Factor
3. In the Input Variable(s) tab, create the following variables:
[New] button...
Name: periods
Display Name: Periods
Type: integer
Default: 15
4. In the Output Variable(s) tab, create the following variables:
[New] button...
Var Name: ttf
Name: (ttf)
Line Color: dark blue
Line Width: slightly thicker
Line Type: solid
5. In the Horizontal Line tab, create the following lines:
[New] button...
Value: +100.0000
Color: red
Width: thin
Type: dashed
[New] button...
Value: +0.0000
Color: black
Width: thin
Type: dashed
© 2011 Visual Trading Systems, LLC
704
VT Trader 2.0 Help Manual
[New] button...
Value: -100.0000
Color: red
Width: thin
Type: dashed
6. In the Formula tab, copy and paste the following formula:
bp:= HHV(H,periods)-Ref(LLV(L,periods),-periods);
sp:= Ref(HHV(H,periods),-periods)-LLV(L,periods);
ttf:= ((bp-sp)/(0.5*(bp+sp)))*100;
7. Click the "Save" icon to finish building the Trend Trigger Factor (TTF) indicator.
6.107 Triple Exponential Average (TRIX)
Overview
Developed by Jack Hutson, the TRIX indicator is a triple-smoothed oscillator designed to eliminate
cycles shorter than the selected indicator period. TRIX oscillates above and below a zero line like many
other oscillators. However, it can also be used as a momentum indicator. When being used as a
momentum indicator, positive values suggest that momentum may be increasing while negative values
suggest that momentum may be decreasing.
© 2011 Visual Trading Systems, LLC
Technical Indicators
705
Interpretation
Trades can be initiated when the TRIX indicator crosses the zero line. A signal line can also be used to
generate trade signals. Divergence between the TRIX and price can also be an effective method of
generating trades.
Construction
1. Click the Ribbon>Technical Analysis menu>Indicators group>Indicator Builder command>
Indicator Builder window's [New] button
2. In the General tab, type the following text for each field:
Name: Triple Exponential Average (TRIX)
Function Name Alias: vt_TRIX
Label Mask:
TRIX (%mapr%,%maper%) = %_TRIX%
TRIX Signal (%TRIXper%) = %TRIX_Signal%
Placement: New Frame
Data Inspection Alias: Triple Exponential Average
3. In the Input Variable(s) tab, create the following variables:
[New] button...
Name: mapr
Display Name: Price
Type: price
Default: close
[New] button...
Name: maper
Display Name: Periods
Type: integer
Default: 15
[New] button...
Name: TRIXper
Display Name: Signal Line Periods
Type: integer
Default: 9
4. In the Output Variable(s) tab, create the following variables:
[New] button...
Var Name: _TRIX
Name: (TRIX)
Line Color: blue
Line Width: thin
© 2011 Visual Trading Systems, LLC
706
VT Trader 2.0 Help Manual
Line Type: solid
[New] button...
Var Name: TRIX_Signal
Name: (TRIX Signal Line)
Line Color: red
Line Width: thin
Line Type: dashed
5. In the Horizontal Line tab, create the following lines:
[New] button...
Value: +0.0000
Color: black
Width: thin
Type: dashed
6. In the Formula tab, copy and paste the following formula:
MA1:= mov(mapr,maper,E);
MA2:= mov(ma1,maper,E);
MA3:= mov(ma2,maper,E);
_TRIX:= (MA3-ref(MA3,-1))/ref(MA3,-1);
TRIX_Signal:= mov(_TRIX,TRIXper,E);
7. Click the "Save" icon to finish building the TRIX indicator.
6.108 Triple Exponential Moving Average (TEMA)
Overview
Developed by Patrick Mulloy and introduced in the January 1994 issue of Technical Analysis of Stocks
& Commodities magazine, this trend indicator is an acronym standing for “Triple Exponential Moving
Average”. TEMA was designed to lessen the lag of a regular exponential moving average. It is a
composite of a single exponential MA, a double exponential MA, and a triple exponential MA that
produces less lag than any of its three components individually; it is NOT a moving average of a moving
average of a moving average.
© 2011 Visual Trading Systems, LLC
Technical Indicators
707
Interpretation
The TEMA can be used in place of traditional moving averages. Please refer to the "Moving Average"
indicator for additional details.
Construction
1. Click the Ribbon>Technical Analysis menu>Indicators group>Indicator Builder command>
Indicator Builder window's [New] button
2. In the General tab, type the following text for each field:
Name: Triple Exponential Moving Average (TEMA)
Function Name Alias: vt_TEMA
Label Mask: TEMA (%pr%,%len%,%mat%) = %_Tema%
Placement: Price Frame
Data Inspection Alias: TEMA
3. In the Input Variable(s) tab, create the following variables:
[New] button...
Name: pr
Display Name: MA Price
Type: price
Default: close
© 2011 Visual Trading Systems, LLC
708
VT Trader 2.0 Help Manual
[New] button...
Name: len
Display Name: MA Periods
Type: integer
Default: 20
[New] button...
Name: mat
Display Name: MA Type
Type: MA Type
Default: Exponential
4. In the Output Variable(s) tab, create the following variables:
[New] button...
Var Name: _Tema
Name: (Tema)
Line Color: blue
Line Width: thin
Line Type: solid
5. In the Horizontal Line tab, create the following lines:
This indicator requires no horizontal lines.
6. In the Formula tab, copy and paste the following formula:
_Tema:= 3 * mov(pr,len,mat) - 3 * mov(mov(pr,len,mat),len,mat) + mov(mov
(mov(pr,len,mat),len,mat),len,mat);
7. Click the "Save" icon to finish building the Triple Exponential Moving Average (TEMA) indicator.
6.109 True Strength Index
Overview
The True Strength Index (TSI) is a variation of the Relative Strength indicator developed by William Blau.
It is a momentum-based indicator that combines the leading characteristic of a differencing momentum
calculation with the lagging characteristic of an averaging function to create an indicator that reflects
price direction and is more in sync with market turns.
© 2011 Visual Trading Systems, LLC
Technical Indicators
709
Interpretation
The TSI can be used to determine general trend direction as well as overbought-oversold conditions.
There are three basic techniques for using the TSI to generate trading signals.
Crossovers: TSI/Signal line Crossover: A buy signal occurs when the TSI crosses above the Signal line
and a sell signal occurs when the TSI crosses below the Signal line.
Divergence: Looking for divergences between the TSI and price can prove to be very effective in
identifying potential reversal and/or trend continuation points in price movement. There are several types
of divergences:
Classic Divergence (aka: Regular Divergence)
Bullish Divergence = Lower lows in price and higher lows in the TSI
Bearish Divergence = Higher highs in price and lower highs in the TSI
Hidden Divergence (aka: Reverse, Continuation, Trend Divergence)
Bullish Divergence = Lower lows in TSI and higher lows in price
Bearish Divergence = Higher highs in TSI and lower highs in price
Overbought/Oversold Conditions: The TSI can be used to identify potential overbought and oversold
conditions in price movements. An Overbought condition is generally described as the TSI being greater
than or equal to the +25 level while an oversold condition is generally described as the TSI being less
than or equal to the -25 level. Trades can be generated when the TSI crosses these levels. When the TSI
crosses above -25 a buy signal is given. Alternatively, when the TSI crosses below +25 a sell signal is
© 2011 Visual Trading Systems, LLC
710
VT Trader 2.0 Help Manual
given.
Support/Resistance and “Failure Swings”: Failure swings (a.k.a. support/resistance breakouts) occur
when the TSI surpasses a previous high (peak) or falls below a recent low (trough).
TSI / Zero-level Crossover: When the TSI Histogram crosses above 0 a buy signal is given. Alternatively,
when the TSI crosses below 0 a sell signal is given.
Construction
1. Click the Ribbon>Technical Analysis menu>Indicators group>Indicator Builder command>
Indicator Builder window's [New] button
2. In the General tab, type the following text for each field:
Name: True Strength Index
Function Name Alias: vt_TSI
Label Mask:
TSI (%Pr%,%R%,%Sm%) = %TSI%
TSI Signal (%Sigp%) = %Sig%
TSI Histogram = %Hist%
Placement: New Frame
Data Inspection Alias: True Strength Index
3. In the Input Variable(s) tab, create the following variables:
[New] button...
Name: Pr
Display Name: Price
Type: price
Default: close
[New] button...
Name: R
Display Name: Smoothing Periods
Type: integer
Default: 20
[New] button...
Name: Sm
Display Name: Double Smoothing Periods
Type: integer
Default: 13
[New] button...
Name: Sigp
Display Name: Signal Line Periods
Type: integer
Default: 7
4. In the Output Variable(s) tab, create the following variables:
© 2011 Visual Trading Systems, LLC
Technical Indicators
[New] button...
Var Name: TSI
Name: (TSI)
Line Color: blue
Line Width: thin
Line Type: solid
[New] button...
Var Name: Sig
Name: (Signal Line)
Line Color: red
Line Width: thin
Line Type: solid
[New] button...
Var Name: Hist
Name: (Histogram)
Line Color: dark green
Line Width: thin
Line Type: histogram
5. In the Horizontal Line tab, create the following lines:
[New] button...
Value: +25.0000
Color: red
Width: thin
Type: dashed
[New] button...
Value: +0.0000
Color: black
Width: thin
Type: dashed
[New] button...
Value: -25.0000
Color: red
Width: thin
Type: dashed
6. In the Formula tab, copy and paste the following formula:
Num:= 100 * Mov(Mov((Pr-ref(Pr,-1)),R,E),Sm,E);
Den:= Mov(Mov(Abs(Pr-ref(Pr,-1)),R,E),Sm,E);
TSI:= if(Den<>0, Num/Den, 0);
Sig:= mov(tsi,Sigp,E);
Hist:= TSI - Sig;
7. Click the "Save" icon to finish building the True Strength Index indicator.
© 2011 Visual Trading Systems, LLC
711
712
VT Trader 2.0 Help Manual
6.110 Ulcer Index
Overview
Developed in 1987 by Peter G. Martin and published in 1989 in the book entitled “The Investor's Guide to
Fidelity Funds: Winning Strategies for Mutual Fund Investors” by Peter G. Martin and Byron B. McCann,
the Ulcer Index was mainly used by traders to measure short-term risk associated with trading
instruments such as stocks, indices, mutual funds, and/or commodities.
The Ulcer Index defines the riskiness (or “stress”) of a trading instrument by only considering the
downside volatility. This differs from other risk indicators such as standard deviation which consider both
upside and downside volatility in their calculations. Since the Ulcer Index is based on the notion that
only downside volatility is bad and upside volatility is good, it is calculated by measuring the depth and
duration (severity) of drawdowns from recent peaks (highs) in price. According to Martin, the Ulcer Index
“is the square root of the mean of the squared percentage drops in value”.
Interpretation
High Ulcer Index values correspond to high levels or risk associated with the trading instrument.
According to Martin, “the greater a drawdown in value, and the longer it takes to recover to earlier highs,
the higher the UI”.
© 2011 Visual Trading Systems, LLC
Technical Indicators
713
Construction
1. Click the Ribbon>Technical Analysis menu>Indicators group>Indicator Builder command>
Indicator Builder window's [New] button
2. In the General tab, type the following text for each field:
Name: Ulcer Index
Function Name Alias: vt_UlcerIndex
Label Mask: Ulcer Index (%Price%,%Periods%) = %Ulcer%
Placement: New Frame
Data Inspection Alias: Ulcer Index
3. In the Input Variable(s) tab, create the following variables:
[New] button...
Name: Price
Display Name: Price
Type: price
Default: close
[New] button...
Name: Periods
Display Name: Periods
Type: integer (with bounds)
Default: 10
Min. Bounds: 1
Max. Bounds: 9999
4. In the Output Variable(s) tab, create the following variables:
[New] button...
Var Name: Ulcer
Name: (UI)
Line Color: dark red
Line Width: slightly thicker
Line Type: solid
5. In the Horizontal Line tab, create the following lines:
This indicator requires no horizontal lines.
6. In the Formula tab, copy and paste the following formula:
Ulcer:= Sqrt(Sum(Power(100*(HHV(Price,Periods)-Price)/(HHV(Price,
Periods)),2),Periods)/Periods);
7. Click the "Save" icon to finish building the Ulcer Index indicator.
© 2011 Visual Trading Systems, LLC
714
VT Trader 2.0 Help Manual
6.111 Ultimate Oscillator
Overview
In the April, 1985 issue of Technical Analysis of Stocks & Commodities magazine Larry Williams stated,
"The trouble for most oscillator work ers was, and has continued to be, that while frequently
oscillators lead sometimes they lead far too early and, instead of buying a bottom, you are buying
falling daggers and getting sliced up. Even the best oscillators consistently give premature buy and
sell signals."
The Ultimate Oscillator combines the weighted sums of price action from three different n-periods of time
to create an oscillator that ranges from 0 to 100. Values of 70 and above are considered to be
overbought while values of 30 and below are considered to be oversold. The time frames typically used
for the Ultimate Oscillator are 7 periods (short-term), 14 periods (intermediate-term), and 28 periods
(long-term). It’s important to note that these time periods overlap each other. In other words, the 28period time frame encompasses both the 14-period time frame and the 7-period time frame.
Interpretation
Larry Williams defined very specific criteria for generating buy and sell signals using the Ultimate
Oscillator.
© 2011 Visual Trading Systems, LLC
Technical Indicators
715
According to Williams, a buy signal occurs when...
1. There is Bullish divergence between the price and Ultimate Oscillator (price makes lower lows while
oscillator makes higher lows)
2. During the divergence the oscillator has fallen below 30
3. The Ultimate Oscillator has risen above its high created during the divergence (i.e. the high between
the two lows)
The buy position is closed when the Ultimate Oscillator rises above 70, or rises above 50 and then falls
back below 45.
Conversely, a sell signal occurs when...
1. There is Bearish divergence between price and the Ultimate Oscillator (price makes higher highs while
oscillator makes lower highs)
2. During the divergence the oscillator has risen above 70
3. The Ultimate Oscillator has fallen below its low created during the divergence (i.e. the low between the
two highs)
The sell position is closed when the Ultimate Oscillator falls below 30 or rises back above 65.
Construction
1. Click the Ribbon>Technical Analysis menu>Indicators group>Indicator Builder command>
Indicator Builder window's [New] button
2. In the General tab, type the following text for each field:
Name: Ultimate Oscillator
Function Name Alias: vt_Ultimate
Label Mask: Ultimate Oscillator (%STPeriods%) = %UltimateOscillator%
Placement: New Frame
Data Inspection Alias: Ultimate Oscillator
3. In the Input Variable(s) tab, create the following variables:
[New] button...
Name: STPeriods
Display Name: Short-Term Periods
Type: integer
Default: 7
[New] button...
"Read Only" Enabled
Name: blank1
Display Name: Medium-Term = 2x Short-Term
Type: Enumeration
Default: NULL
[New] button...
"Read Only" Enabled
© 2011 Visual Trading Systems, LLC
716
VT Trader 2.0 Help Manual
Name: blank2
Display Name: Long-Term = 4x Short-Term
Type: Enumeration
Default: NULL
4. In the Output Variable(s) tab, create the following variables:
[New] button...
Var Name: UltimateOscillator
Name: (UO)
Line Color: dark blue
Line Width: thin
Line Type: solid
5. In the Horizontal Line tab, create the following lines:
[New] button...
Value: +70.0000
Color: red
Width: thin
Type: dashed
[New] button...
Value: +50.0000
Color: gray
Width: thin
Type: dashed
[New] button...
Value: +30.0000
Color: red
Width: thin
Type: dashed
6. In the Formula tab, copy and paste the following formula:
TL:= min(L,ref(C,-1));
BP:= C-TL;
TR:= max((H-L),max((H-ref(C,-1)),ref(C,-1)-L));
BPSum1:= sum(BP,STPeriods);
BPSum2:= sum(BP,(STPeriods*2));
BPSum3:= sum(BP,(STPeriods*4));
TRSum1:= sum(TR,STPeriods);
TRSum2:= sum(TR,(STPeriods*2));
TRSum3:= sum(TR,(STPeriods*4));
RawUO:= 4*(BPSum1/TRSum1)+2*(BPSum2/TRSum2)+(BPSum3/TRSum3);
UltimateOscillator:= (RawUO/(4+2+1))*100;
7. Click the "Save" icon to finish building the Ultimate Oscillator indicator.
© 2011 Visual Trading Systems, LLC
Technical Indicators
717
6.112 Volatility Quality Index
Overview
The Volatility Quality Index was described by Thomas Stridsman in the August 2002 edition of Technical
Analysis of Stocks and Commodities magazine.
Interpretation
Unknown.
Construction
1. Click the Ribbon>Technical Analysis menu>Indicators group>Indicator Builder command>
Indicator Builder window's [New] button
2. In the General tab, type the following text for each field:
Name: Volatility Quality Index
Function Name Alias: vt_VQI
Label Mask:
Volatility Quality Index = %SumVQI%
VQI Short MA (%ShMaPeriods%) = %ShortMa_SumVQI%
© 2011 Visual Trading Systems, LLC
718
VT Trader 2.0 Help Manual
VQI Long MA (%LgMaPeriods%) = %LongMa_SumVQI%
Placement: New Frame
Data Inspection Alias: Volatility Quality Index
3. In the Input Variable(s) tab, create the following variables:
[New] button...
Name: ShMaPeriods
Display Name: Short MA Periods
Type: integer (with bounds)
Default: 9
Min. Bounds: 1
Max. Bounds: 9999
[New] button...
Name: LgMaPeriods
Display Name: Long MA Periods
Type: integer (with bounds)
Default: 200
Min. Bounds: 1
Max. Bounds: 9999
4. In the Output Variable(s) tab, create the following variables:
[New] button...
Var Name: SumVQI
Name: (VQI)
Line Color: dark green
Line Width: thin
Line Type: solid
[New] button...
Var Name: ShortMa_SumVQI
Name: (VQI Short MA)
Line Color: red
Line Width: thin
Line Type: solid
[New] button...
Var Name: LongMa_SumVQI
Name: (VQI Long MA)
Line Color: yellow
Line Width: thin
Line Type: solid
5. In the Horizontal Line tab, create the following lines:
This indicator requires no horizontal lines.
6. In the Formula tab, copy and paste the following formula:
TR:= ATR(1);
C1:= Ref(C,-1);
© 2011 Visual Trading Systems, LLC
Technical Indicators
719
VQI:= If(TR<>0 AND (H-L)<>0,((C-C1/TR)+((C-O)/(H-L)))*0.5,Prev(0));
VQI:= Abs(VQI)*((C-C1+(C-O))*0.5);
SumVQI:= Cum(VQI);
ShortMa_SumVQI:= Mov(SumVQI,ShMaPeriods,S);
LongMa_SumVQI:= Mov(SumVQI,LgMaPeriods,S);
7. Click the "Save" icon to finish building the Volatility Quality Index indicator.
6.113 Williams Percent Range (%R)
Overview
Developed by Larry Williams, the Williams %R (pronounced "percent R") indicator is a momentum
oscillator used to measure overbought and oversold levels. It's very similar to the Stochastic Oscillator
except that the %R is plotted upside-down on a negative scale from 0 to -100 and has no internal
smoothing.
The %R defines the relationship of the close price relative to the High-Low range over n-Periods. The
nearer the close price is to the highest high of the range the nearer to zero the reading will be.
Alternatively, the nearer the close price is to the lowest low of the range the nearer to -100 the reading
will be. If the close price equals the highest high of the range the reading will be 0; if the close price
equals the lowest low of the range to reading will be -100.
© 2011 Visual Trading Systems, LLC
720
VT Trader 2.0 Help Manual
Interpretation
As an overbought/oversold indicator, Williams %R values from 0 to -20 are considered overbought while
values from -80 to -100 are considered oversold. An interesting phenomenon of the %R indicator is its
uncanny ability to anticipate a reversal in the underlying trading instrument's price.
Construction
1. Click the Ribbon>Technical Analysis menu>Indicators group>Indicator Builder command>
Indicator Builder window's [New] button
2. In the General tab, type the following text for each field:
Name: Williams %R
Function Name Alias: vt_WilliamsR
Label Mask: Williams %%R (%Periods%) = %R%
Placement: New Frame
Data Inspection Alias: Williams %R
3. In the Input Variable(s) tab, create the following variables:
[New] button...
Name: Periods
Display Name: Periods
Type: integer
Default: 14
4. In the Output Variable(s) tab, create the following variables:
[New] button...
Var Name: R
Name: (%R)
Line Color: dark blue
Line Width: thin
Line Type: solid
5. In the Horizontal Line tab, create the following lines:
[New] button...
Value: -20.0000
Color: red
Width: thin
Type: dashed
[New] button...
Value: -80.0000
Color: red
Width: thin
Type: dashed
© 2011 Visual Trading Systems, LLC
Technical Indicators
721
4. In the Formula tab, copy and paste the following formula:
R:= ((HHV(H,Periods)-C) / (HHV(H,Periods) - LLV(L,Periods))) * -100;
5. Click the "Save" icon to finish building the Williams %R indicator.
© 2011 Visual Trading Systems, LLC
Trading Systems
Part
VII
Trading Systems
7
723
Trading Systems
A trading system, simply defined, consists of a concise set of non-emotional, objective rules based on
measurable factors that are used to describe when to buy and sell a trade instrument. A trading system
can generate various types of alerts based on pre-defined conditions and request automated trading
actions* to be taken on those conditions.
VT Trader provides clients with several automated trading systems. These trading systems generate
alerts based on some of the most common ways that many of VT Trader's standard technical indicators
are used or can be used for technical analysis. These trading systems can be generally categorized
into: breakout methods, trend/momentum trading methods, and range/counter-trend trading methods.
While fully functional and able to execute automated trades while attached to a chart and running in
Auto-Trade mode, these trading systems are meant to serve only as examples of some types of
systems that can be created using VT Trader's Trading Systems Builder 205 and scripting language 329 .
These trading systems are not to be construed as recommendations for trading strategies nor does
Visual Trading Systems LLC or its affiliates have access to or maintain records relating to potential
profitability (a.k .a. back tests) of the sample automated trading systems. * Please note: Certain rules
and restrictions apply to any trading system running in Auto-Trade mode. It is STRONGLY
recommended that you take a few minutes to read through the Automated Trading FAQ for trading
systems by clicking here 1148 .
Below is an alphabetical listing of the automated trading systems. Click on the trading system's name
for full details.
A 723 B 723 C 723 D 724 E 724 F 724 G 724 H 724 I 724 J 724 K 724 L 725 M 725 N 725 O 725 P 725 Q
725 R 726 S 726 T 726 U 726 V 726 W 726 X 726 Y 727 Z 727
A
Aroon Oscillator Cross System 727
B
Balance of Power Cross System 730
Bollinger Bands Breakout System 734
Bollinger Bands Reversal System 738
Bull / Bear Heikin-Ashi Candlesticks Reversal System 742
Bull / Bear Japanese Candlesticks Reversal System 745
C
Chande's Dynamic Momentum Index Cross System 749
Chande's Dynamic Momentum Index Reversal System 753
Chande's QStick Cross System 757
Chande's Trend Momentum System 761
Chande's TrendScore Trend Surfing System 765
Chande's VIDYA Cross System 769
Chaos Accelerator Oscillator Cross System 773
Chaos Accelerator Oscillator Reversal System 777
© 2011 Visual Trading Systems, LLC
724
VT Trader 2.0 Help Manual
Chaos Awesome Oscillator / Signal Line Cross System 781
Chaos Awesome Oscillator / Zero Cross System 785
Chaos Awesome Oscillator Reversal System 789
Chaos Fractals Breakout System 793
Chaos Fractals Reversal System 797
Commodity Channel Index (CCI) Complex Cross System 801
Commodity Channel Index (CCI) Cross System 805
Commodity Channel Index (CCI) Reversal System 809
Complex Trend System #1 (Fast MA / Slow MA / RSI / MACD) 813
D
Darvas Box Breakout System 817
Detrended Price Oscillator (DPO) Cross System 821
Directional Movement Index "Extreme Price Rule" System 825
Directional Movement Index Cross System 829
Disparity Index Cross System 833
Disparity Index Reversal System 837
Donchian Channel Breakout System 841
Double Exponential Moving Average (DEMA) Cross System 845
Double Stochastic Oscillator Cross System 849
Double Stochastic Oscillator Reversal Cross System 852
E
Ehlers
Ehlers
Ehlers
Ehlers
Ehlers
Fisher Transform Cross System 856
Laguerre Relative Strength Index Cross System 860
Laguerre Relative Strength Index Reversal System 864
MAMA / FAMA Cross System 868
Relative Vigor Index Cross System 871
F
-G
Gann Basic "Swing Chartist" System 875
H
Hull Moving Average Cross System 879
I
Ichimoku Kinko Huo "Strong Signals" System 883
Inertia Cross System 888
J
-K
© 2011 Visual Trading Systems, LLC
Trading Systems
Kase CD Cross System 891
Kase Peak Oscillator Cross System 895
Kaufman's Adaptive Moving Average (KAMA) Cross System 899
Kaufman's Efficiency Ratio UpTrend / DownTrend System 903
Keltner Bands Breakout System 907
Keltner Bands Reversal System 911
Keltner Channels Breakout System 915
Keltner Channels Reversal System 919
Kurtosis Cross System 923
L
Linear Regression Cross System 927
Linear Regression Reversal System 931
Linear Regression Slope Cross System 934
Linear Regression Slope High / Low Breakout System 938
Linear Regression Slope Tops / Bottoms Reversal System 942
M
MACD Fast Line / Signal Line Cross System 946
MACD Fast Line / Zero Cross System 950
MACD Histogram High / Low Breakout System 954
MACD Histogram Tops and Bottoms Reversal System 958
McClellan Oscillator Cross System 962
McClellan Summation Index Cross System 966
McGinley Dynamic Cross System 970
Momentum Cross System 974
Moving Average Envelope Breakout System 978
Moving Average Envelope Reversal System 982
Moving Averages Cross System 986
Moving Averages Double Cross System 991
Moving Slope Rate of Change Cross System 995
N
-O
-P
Parabolic SAR Reversal System 999
Percentage Price Oscillator / Signal Line Cross System 1003
Percentage Price Oscillator / Zero Cross System 1007
Percentage Price Oscillator Histogram High / Low Breakout System 1011
Percentage Price Oscillator Histogram Tops / Bottoms Reversal System 1015
Polarized Fractal Efficiency Cross System 1019
Q
© 2011 Visual Trading Systems, LLC
725
726
VT Trader 2.0 Help Manual
Quantitative Qualitative Estimation (QQE) Cross System 1023
R
Rate of Change (ROC) Cross System 1029
Relative Momentum Index Cross System 1032
Relative Momentum Index Reversal System 1036
Relative Strength Index (RSI) Cross System 1040
Relative Strength Index (RSI) Reversal System 1044
Relative Volatility Index (RVI) Cross System 1048
Relative Volatility Index (RVI) Reversal System 1052
RSI Bollinger Bands Breakout System 1056
RSI Bollinger Bands Reversal System 1060
RSI Moving Averages Cross System 1064
S
Schaff Trend Cycle Double Reversal System 1070
Schaff Trend Cycle Reversal System 1073
Slow Stochastic Oscillator Cross System 1077
Slow Stochastic Oscillator Reversal Cross System 1080
STARC Bands Reversal System 1084
Stochastic Momentum Index Cross System 1088
T
T3 Moving Average Cross System 1096
Trailing Stoploss Reversal Level Cross System 1100
Trend Continuation Factor Cross System 1104
Trend Continuation Factor Strong Trend System 1108
Trend Trigger Factor (TTF) Reversal System 1112
Triple Exponential Average (TRIX) Cross System 1116
Triple Exponential Moving Average (TEMA) Cross System 1119
True Strength Index Cross System 1123
U
Ultimate Oscillator / Signal Line Cross System 1126
Ultimate Oscillator Cross System 1130
Ultimate Oscillator Reversal System 1134
V
-W
Williams Percent Range (%R) Cross System 1138
Williams Percent Range (%R) Reversal System 1142
X
© 2011 Visual Trading Systems, LLC
Trading Systems
727
-Y
-Z
--
RISK DISCLAIMER
Past performance is not indicative of future results. Trading foreign exchange and futures on margin
carries a high level of risk, and may not be suitable for all investors. The high degree of leverage can
work against you as well as for you. Before deciding to invest in foreign exchange or futures you should
carefully consider your investment objectives, level of experience, and risk appetite. The possibility
exists that you could sustain a loss of some or all of your initial investment and therefore you should not
invest money that you cannot afford to lose. You should be aware of all the risks associated with foreign
exchange and futures trading, and seek advice from an independent financial advisor if you have any
doubts.
The materials presented in this manual are solely for informational purposes. No offer or solicitation to
buy or sell currencies or commodities, or any type of investment or trading advice or strategy, is made,
given or in any manner endorsed by Visual Trading Systems LLC or its affiliates. You are fully
responsible for any investment or trading decisions you make, and such decisions should be based
solely on your evaluation of your financial circumstances, investment or trading objectives, risk tolerance
and liquidity needs.
7.1
Aroon Oscillator Cross System
Overview
The Aroon Oscillator Cross System uses the Aroon Oscillator to generate signals for potential trading
opportunities.
The signals are generated using the following logic:
A Long signal is generated when the Aroon Oscillator crosses above zero.
A Short signal is generated when the Aroon Oscillator crosses below zero.
This trading system can be used in Recommendation Only mode to generate alerts and, if you choose,
in Auto-Trade mode to automatically request orders based on its signals and its Trading Enabled output
variables (OpenBuy, CloseBuy, OpenSell, and CloseSell).
System Outputs and Signals Logic
The Aroon Oscillator Cross System consists of the following output variables and display parameters:
© 2011 Visual Trading Systems, LLC
728
VT Trader 2.0 Help Manual
The Aroon Oscillator displays in Additional Frame 1 as a blue histogram.
When a Long signal is generated a blue up arrow graphic displays in the chart window, the
message "Long signal detected! The Aroon Oscillator crossed above zero." displays in the Trading
Activity window, and an audio sound file plays. If Auto-Trade mode is enabled automated trading
actions request orders based on the logic of the OpenBuy output variable, the logic of the CloseSell
output variable, and the parameters defined in the Trading System Properties window's Trading
Parameters tab.
When a Short signal is generated a red down arrow graphic displays in the chart window, the
message "Short signal detected! The Aroon Oscillator crossed below zero." displays in the Trading
Activity window, and an audio sound file plays. If Auto-Trade mode is enabled automated trading
actions request orders based on the logic of the OpenSell output variable, the logic of the CloseBuy
output variable, and the parameters defined in the Trading System Properties window's Trading
Parameters tab.
Below is a screenshot that shows the Aroon Oscillator Cross System attached to a chart window
using its default parameters...
System Parameters
© 2011 Visual Trading Systems, LLC
Trading Systems
729
This trading system includes adjustable input parameters for added flexibility. You can make any
required changes from the System Parameters tab in its properties window.
The System Parameters tab contains the following input parameters:
Instrument, Interval, Bid/Ask
These parameters are "read only" values. They are the instrument, chart interval, and chart type the
trading system is (or will be) attached to.
Aroon Oscillator Periods
This parameter defines the number of periods used to calculate the Aroon Oscillator.
Auto-Trading Parameters
It is extremely important that you verify (and change, if necessary) the parameters in the Trading
Parameters tab if you intend to use this trading system in Auto-Trade mode. You must specify the
Amount (in Lots) that will be used for each order the trading system requests.
© 2011 Visual Trading Systems, LLC
730
VT Trader 2.0 Help Manual
For the trading system to auto-trade, it is necessary to start it in Auto-Trade mode; failure to do this will
result in no automated order requests being submitted. Auto-Trade mode may be started once the
trading system is properly configured and successfully attached to a chart.
7.2
Balance of Power Cross System
Overview
The Balance of Power Cross System uses the Balance of Power (BOP) indicator to generate signals
for potential trading opportunities.
The signals are generated using the following logic:
A Long signal is generated when the BOP crosses above zero.
A Short signal is generated when the BOP crosses below zero.
This trading system can be used in Recommendation Only mode to generate alerts and, if you choose,
in Auto-Trade mode to automatically request orders based on its signals and its Trading Enabled output
variables (OpenBuy, CloseBuy, OpenSell, and CloseSell).
System Outputs and Signals Logic
The Balance of Power Cross System consists of the following output variables and display
parameters:
© 2011 Visual Trading Systems, LLC
Trading Systems
731
The Balance of Power (BOP) indicator displays in Additional Frame 1 as a black histogram. Its midlevel (0) displays in the same frame as a dashed black line.
The Trend Frame displays a white up arrow against a blue background while the BOP is greater
than zero.
The Trend Frame displays a white down arrow against a red background while the BOP is less than
zero.
When a Long signal is generated a blue up arrow graphic displays in the chart window, the
message "Long signal detected! The Balance of Power crossed above zero." displays in the Trading
Activity window, and an audio sound file plays. If Auto-Trade mode is enabled automated trading
actions request orders based on the logic of the OpenBuy output variable, the logic of the CloseSell
output variable, and the parameters defined in the Trading System Properties window's Trading
Parameters tab.
When a Short signal is generated a red down arrow graphic displays in the chart window, the
message "Short signal detected! The Balance of Power crossed below zero." displays in the
Trading Activity window, and an audio sound file plays. If Auto-Trade mode is enabled automated
trading actions request orders based on the logic of the OpenSell output variable, the logic of the
CloseBuy output variable, and the parameters defined in the Trading System Properties window's
Trading Parameters tab.
Below is a screenshot that shows the Balance of Power Cross System attached to a chart window
using its default parameters...
© 2011 Visual Trading Systems, LLC
732
VT Trader 2.0 Help Manual
System Parameters
This trading system includes adjustable input parameters for added flexibility. You can make any
required changes from the System Parameters tab in its properties window.
© 2011 Visual Trading Systems, LLC
Trading Systems
733
The System Parameters tab contains the following input parameters:
Instrument, Interval, Bid/Ask
These parameters are "read only" values. They are the instrument, chart interval, and chart type the
trading system is (or will be) attached to.
BOP Smoothing Periods and DOP Smoothing Type
These parameters define the number of periods and the type of moving average used to used to
calculate the Balance of Power (BOP) indicator.
Auto-Trading Parameters
It is extremely important that you verify (and change, if necessary) the parameters in the Trading
Parameters tab if you intend to use this trading system in Auto-Trade mode. You must specify the
Amount (in Lots) that will be used for each order the trading system requests.
© 2011 Visual Trading Systems, LLC
734
VT Trader 2.0 Help Manual
For the trading system to auto-trade, it is necessary to start it in Auto-Trade mode; failure to do this will
result in no automated order requests being submitted. Auto-Trade mode may be started once the
trading system is properly configured and successfully attached to a chart.
7.3
Bollinger Bands Breakout System
Overview
The Bollinger Bands Breakout System uses Bollinger Bands to generate signals for potential trading
opportunities.
The signals are generated using the following logic:
A Long signal is generated when the Close price crosses above the upper Bollinger Band. If the "Require
Price Confirmation of Breakout?" input parameter (see description below) is set to "Yes", the Long signal
is generated when the Close price crosses above the High price of the upper Bollinger Band breakout bar
within the following two bars.
A Short signal is generated when the Close price crosses below the lower Bollinger Band. If the "Require
Price Confirmation of Breakout?" input parameter (see description below) is set to "Yes", the Short
signal is generated when the Close price crosses below the Low price of the lower Bollinger Band
breakout bar within the following two bars.
This trading system can be used in Recommendation Only mode to generate alerts and, if you choose,
in Auto-Trade mode to automatically request orders based on its signals and its Trading Enabled output
variables (OpenBuy, CloseBuy, OpenSell, and CloseSell). Note: This trading system's Auto-Trade mode
always attempts to request orders based on the "Always_in_the_Market" method of generating signals
to help ensure that only one position is open at any given time even if the "Alert_for_ALL_Signals" input
© 2011 Visual Trading Systems, LLC
Trading Systems
735
selection is chosen.
System Outputs and Signals Logic
The Bollinger Bands Breakout System consists of the following output variables and display
parameters:
The upper and lower Bollinger Bands display in the Price Frame as thin, solid, green lines. The
middle Bollinger Band displays in the Price Frame as a thin, dashed, green line.
If the "Require Price Confirmation of Breakout?" input parameter is set to "Yes", medium-sized
green dots display in the Price Frame to designate the High price of the upper Bollinger Band
breakout bar and medium-sized pink dots display in the Price Frame to designate the Low price of
the lower Bollinger Band breakout bar.
When a Long signal is generated a green up arrow graphic displays in the chart window, the
message "Long signal detected! Price has broken out above the Upper Bollinger Band." displays
in the Trading Activity window, and an audio sound file plays. If Auto-Trade mode is enabled
automated trading actions request orders based on the logic of the OpenBuy output variable, the
logic of the CloseSell output variable, and the parameters defined in the Trading System
Properties window's Trading Parameters tab.
When a Short signal is generated a pink down arrow graphic displays in the chart window, the
message "Short signal detected! Price has broken out below the Lower Bollinger Band." displays
in the Trading Activity window, and an audio sound file plays. If Auto-Trade mode is enabled
automated trading actions request orders based on the logic of the OpenSell output variable, the
logic of the CloseBuy output variable, and the parameters defined in the Trading System
Properties window's Trading Parameters tab.
Below is a screenshot that shows the Bollinger Bands Breakout System attached to a chart window
using its default parameters...
© 2011 Visual Trading Systems, LLC
736
VT Trader 2.0 Help Manual
System Parameters
This trading system includes adjustable input parameters for added flexibility. You can make any
required changes from the System Parameters tab in its properties window.
© 2011 Visual Trading Systems, LLC
Trading Systems
737
The System Parameters tab contains the following input parameters:
Instrument, Interval, Bid/Ask
These parameters are "read only" values. They are the instrument, chart interval, and chart type the
trading system is (or will be) attached to.
Bollinger Bands Price, Periods, MA Type, and Std. Deviations
These parameters define price, number of periods, MA Type, and number of standard deviations
used to calculate the Bollinger Bands.
Require Price Confirmation of Breakout?
This parameter changes the conditions necessary to generate the Long and Short signals. Please
refer to the Overview section above for details.
Method for Generating Signals
This parameter is a selection list with two choices. "Alert_for_ALL_Signals" allows the trading
system to provide alerts for all potential trading signals, including multiple consecutive long or short
signals. "Always_in_the_Market" forces the trading system to provide alerts for only the first signal
in a consecutive series of long or short signals.
Auto-Trading Parameters
It is extremely important that you verify (and change, if necessary) the parameters in the Trading
Parameters tab if you intend to use this trading system in Auto-Trade mode. You must specify the
Amount (in Lots) that will be used for each order the trading system requests.
© 2011 Visual Trading Systems, LLC
738
VT Trader 2.0 Help Manual
For the trading system to auto-trade, it is necessary to start it in Auto-Trade mode; failure to do this will
result in no automated order requests being submitted. Auto-Trade mode may be started once the
trading system is properly configured and successfully attached to a chart.
7.4
Bollinger Bands Reversal System
Overview
The Bollinger Bands Reversal System uses Bollinger Bands to generate signals for potential trading
opportunities.
The signals are generated using the following logic:
A Long signal is generated when the price reverses from the lower Bollinger Band using either a 1-bar or
2-bar reversal formation.
Long 1-Bar Formation = Close price > Open price AND Close price > Lower Bollinger Band AND
Low price <= Lower Bollinger Band
Long 2-Bar Formation = Close price > Open price AND Close price > Lower Bollinger Band AND
Close price > Open price 1 bar ago AND Close price 1 bar ago < Open price 1 bar ago AND Low
price 1 bar ago <= Lower Bollinger Band 1 bar ago
A Short signal is generated when the price reverses from the upper Bollinger Band using either a 1-bar or
2-bar reversal formation.
Short 1-Bar Formation = Close price < Open price AND Close price < Upper Bollinger Band AND
© 2011 Visual Trading Systems, LLC
Trading Systems
739
High price >= Upper Bollinger Band
Short 2-Bar Formation = Close price < Open price AND Close price < Upper Bollinger Band AND
Close price < Open price 1 bar ago AND Close price 1 bar ago > Open price 1 bar ago AND High
price 1 bar ago >= Upper Bollinger Band 1 bar ago
This trading system can be used in Recommendation Only mode to generate alerts and, if you choose,
in Auto-Trade mode to automatically request orders based on its signals and its Trading Enabled output
variables (OpenBuy, CloseBuy, OpenSell, and CloseSell). Note: This trading system's Auto-Trade mode
always attempts to request orders based on the "Always_in_the_Market" method of generating signals
to help ensure that only one position is open at any given time even if the "Alert_for_ALL_Signals" input
selection is chosen.
System Outputs and Signals Logic
The Bollinger Bands Reversal System consists of the following output variables and display
parameters:
The upper and lower Bollinger Bands display in the Price Frame as thin, solid, green lines. The
middle Bollinger Band displays in the Price Frame as a thin, dashed, green line.
When a Long signal is generated a blue up arrow graphic displays in the chart window, the
message "Long signal detected! Price is potentially reversing from Lower Bollinger Band."
displays in the Trading Activity window, and an audio sound file plays. If Auto-Trade mode is
enabled automated trading actions request orders based on the logic of the OpenBuy output
variable, the logic of the CloseSell output variable, and the parameters defined in the Trading
System Properties window's Trading Parameters tab.
When a Short signal is generated a red down arrow graphic displays in the chart window, the
message "Short signal detected! Price is potentially reversing from the Upper Bollinger Band."
displays in the Trading Activity window, and an audio sound file plays. If Auto-Trade mode is
enabled automated trading actions request orders based on the logic of the OpenSell output
variable, the logic of the CloseBuy output variable, and the parameters defined in the Trading
System Properties window's Trading Parameters tab.
Below is a screenshot that shows the Bollinger Bands Reversal System attached to a chart window
using its default parameters...
© 2011 Visual Trading Systems, LLC
740
VT Trader 2.0 Help Manual
System Parameters
This trading system includes adjustable input parameters for added flexibility. You can make any
required changes from the System Parameters tab in its properties window.
© 2011 Visual Trading Systems, LLC
Trading Systems
741
The System Parameters tab contains the following input parameters:
Instrument, Interval, Bid/Ask
These parameters are "read only" values. They are the instrument, chart interval, and chart type the
trading system is (or will be) attached to.
Bollinger Bands Price, Periods, MA Type, and Std. Deviations
These parameters define price, number of periods, MA Type, and number of standard deviations
used to calculate the Bollinger Bands.
Method for Generating Signals
This parameter is a selection list with two choices. "Alert_for_ALL_Signals" allows the trading
system to provide alerts for all potential trading signals, including multiple consecutive long or short
signals. "Always_in_the_Market" forces the trading system to provide alerts for only the first signal
in a consecutive series of long or short signals.
Auto-Trading Parameters
It is extremely important that you verify (and change, if necessary) the parameters in the Trading
Parameters tab if you intend to use this trading system in Auto-Trade mode. You must specify the
Amount (in Lots) that will be used for each order the trading system requests.
© 2011 Visual Trading Systems, LLC
742
VT Trader 2.0 Help Manual
For the trading system to auto-trade, it is necessary to start it in Auto-Trade mode; failure to do this will
result in no automated order requests being submitted. Auto-Trade mode may be started once the
trading system is properly configured and successfully attached to a chart.
7.5
Bull / Bear Heikin-Ashi Candlesticks Reversal System
Overview
The Bull / Bear Heikin-Ashi Candlesticks Reversal System uses the Heikin-Ashi candlesticks to
generate signals for potential trading opportunities.
The signals are generated using the following logic:
A Long signal is generated when the specified number of consecutive Bull Heikin-Ashi candlesticks
form. A Bull candlestick forms when its Close price is greater than its Open price.
A Short signal is generated when the specified number of consecutive Bear Heikin-Ashi candlesticks
form. A Bear candlestick forms when its Close price is less than its Open price.
This trading system can be used in Recommendation Only mode to generate alerts and, if you choose,
in Auto-Trade mode to automatically request orders based on its signals and its Trading Enabled output
variables (OpenBuy, CloseBuy, OpenSell, and CloseSell). Note: This trading system's Auto-Trade mode
always attempts to request orders based on the "Always_in_the_Market" method of generating signals
to help ensure that only one position is open at any given time even if the "Alert_for_ALL_Signals" input
selection is chosen.
System Outputs and Signals Logic
© 2011 Visual Trading Systems, LLC
Trading Systems
743
The Bull / Bear Heikin-Ashi Candlesticks Reversal System consists of the following output variables
and display parameters:
When a Long signal is generated a blue up arrow graphic displays in the chart window, the
message "Long signal detected! Bull Heikin-Ashi Candle(s) formation suggests a potential price
reversal." displays in the Trading Activity window, and an audio sound file plays. If Auto-Trade mode
is enabled automated trading actions request orders based on the logic of the OpenBuy output
variable, the logic of the CloseSell output variable, and the parameters defined in the Trading
System Properties window's Trading Parameters tab.
When a Short signal is generated a red down arrow graphic displays in the chart window, the
message "Short signal detected! Bear Heikin-Ashi Candle(s) formation suggests a potential price
reversal." displays in the Trading Activity window, and an audio sound file plays. If Auto-Trade mode
is enabled automated trading actions request orders based on the logic of the OpenSell output
variable, the logic of the CloseBuy output variable, and the parameters defined in the Trading
System Properties window's Trading Parameters tab.
Below is a screenshot that shows the Bull / Bear Heikin-Ashi Candlesticks Reversal System
attached to a chart window using its default parameters...
© 2011 Visual Trading Systems, LLC
744
VT Trader 2.0 Help Manual
System Parameters
This trading system includes adjustable input parameters for added flexibility. You can make any
required changes from the System Parameters tab in its properties window.
The System Parameters tab contains the following input parameters:
Instrument, Interval, Bid/Ask
These parameters are "read only" values. They are the instrument, chart interval, and chart type the
trading system is (or will be) attached to.
# of Bull H.A. Candles Required for Reversal
This parameter defines the number of consecutive Bull Heikin-Ashi candlesticks that must form
before a Long signal is generated.
# of Bear H.A. Candles Required for Reversal
This parameter defines the number of consecutive Bear Heikin-Ashi candlesticks that must form
before a Short signal is generated.
Method for Generating Signals
This parameter is a selection list with two choices. "Alert_for_ALL_Signals" allows the trading
system to provide alerts for all potential trading signals, including multiple consecutive long or short
signals. "Always_in_the_Market" forces the trading system to provide alerts for only the first signal
in a consecutive series of long or short signals.
© 2011 Visual Trading Systems, LLC
Trading Systems
745
Auto-Trading Parameters
It is extremely important that you verify (and change, if necessary) the parameters in the Trading
Parameters tab if you intend to use this trading system in Auto-Trade mode. You must specify the
Amount (in Lots) that will be used for each order the trading system requests.
For the trading system to auto-trade, it is necessary to start it in Auto-Trade mode; failure to do this will
result in no automated order requests being submitted. Auto-Trade mode may be started once the
trading system is properly configured and successfully attached to a chart.
7.6
Bull / Bear Japanese Candlesticks Reversal System
Overview
The Bull / Bear Japanese Candlesticks Reversal System uses the traditional Japanese candlesticks
to generate signals for potential trading opportunities.
The signals are generated using the following logic:
A Long signal is generated when the specified number of consecutive Bull Japanese candlesticks form.
A Bull candlestick forms when its Close price is greater than its Open price.
A Short signal is generated when the specified number of consecutive Bear Japanese candlesticks form.
A Bear candlestick forms when its Close price is less than its Open price.
This trading system can be used in Recommendation Only mode to generate alerts and, if you choose,
© 2011 Visual Trading Systems, LLC
746
VT Trader 2.0 Help Manual
in Auto-Trade mode to automatically request orders based on its signals and its Trading Enabled output
variables (OpenBuy, CloseBuy, OpenSell, and CloseSell). Note: This trading system's Auto-Trade mode
always attempts to request orders based on the "Always_in_the_Market" method of generating signals
to help ensure that only one position is open at any given time even if the "Alert_for_ALL_Signals" input
selection is chosen.
System Outputs and Signals Logic
The Bull / Bear Japanese Candlesticks Reversal System consists of the following output variables
and display parameters:
When a Long signal is generated a blue up arrow graphic displays in the chart window, the
message "Long signal detected! Bull Candle(s) formation suggests a potential price reversal."
displays in the Trading Activity window, and an audio sound file plays. If Auto-Trade mode is
enabled automated trading actions request orders based on the logic of the OpenBuy output
variable, the logic of the CloseSell output variable, and the parameters defined in the Trading
System Properties window's Trading Parameters tab.
When a Short signal is generated a red down arrow graphic displays in the chart window, the
message "Short signal detected! Bear Candle(s) formation suggests a potential price reversal."
displays in the Trading Activity window, and an audio sound file plays. If Auto-Trade mode is
enabled automated trading actions request orders based on the logic of the OpenSell output
variable, the logic of the CloseBuy output variable, and the parameters defined in the Trading
System Properties window's Trading Parameters tab.
Below is a screenshot that shows the Bull / Bear Japanese Candlesticks Reversal System attached
to a chart window using its default parameters...
© 2011 Visual Trading Systems, LLC
Trading Systems
System Parameters
This trading system includes adjustable input parameters for added flexibility. You can make any
required changes from the System Parameters tab in its properties window.
© 2011 Visual Trading Systems, LLC
747
748
VT Trader 2.0 Help Manual
The System Parameters tab contains the following input parameters:
Instrument, Interval, Bid/Ask
These parameters are "read only" values. They are the instrument, chart interval, and chart type the
trading system is (or will be) attached to.
# of Bull Candles Required for Reversal
This parameter defines the number of consecutive Bull Japanese candlesticks that must form before
a Long signal is generated.
# of Bear Candles Required for Reversal
This parameter defines the number of consecutive Bear Japanese candlesticks that must form
before a Short signal is generated.
Method for Generating Signals
This parameter is a selection list with two choices. "Alert_for_ALL_Signals" allows the trading
system to provide alerts for all potential trading signals, including multiple consecutive long or short
signals. "Always_in_the_Market" forces the trading system to provide alerts for only the first signal
in a consecutive series of long or short signals.
Auto-Trading Parameters
It is extremely important that you verify (and change, if necessary) the parameters in the Trading
Parameters tab if you intend to use this trading system in Auto-Trade mode. You must specify the
Amount (in Lots) that will be used for each order the trading system requests.
© 2011 Visual Trading Systems, LLC
Trading Systems
749
For the trading system to auto-trade, it is necessary to start it in Auto-Trade mode; failure to do this will
result in no automated order requests being submitted. Auto-Trade mode may be started once the
trading system is properly configured and successfully attached to a chart.
7.7
Chande's Dynamic Momentum Index Cross System
Overview
The Chande's Dynamic Momentum Index Cross System uses Chande's Dynamic Momentum Index
to generate signals for potential trading opportunities.
The signals are generated using the following logic:
A Long signal is generated when the Chande's Dynamic Momentum Index crosses above its Long Entry
Level.
A Short signal is generated when the Chande's Dynamic Momentum Index crosses below its Short
Entry Level.
This trading system can be used in Recommendation Only mode to generate alerts and, if you choose,
in Auto-Trade mode to automatically request orders based on its signals and its Trading Enabled output
variables (OpenBuy, CloseBuy, OpenSell, and CloseSell). Note: This trading system's Auto-Trade mode
always attempts to request orders based on the "Always_in_the_Market" method of generating signals
to help ensure that only one position is open at any given time even if the "Alert_for_ALL_Signals" input
selection is chosen.
© 2011 Visual Trading Systems, LLC
750
VT Trader 2.0 Help Manual
System Outputs and Signals Logic
The Chande's Dynamic Momentum Index Cross System consists of the following output variables
and display parameters:
The Chande's Dynamic Momentum Index displays in Additional Frame 1 as a slightly thicker, solid
blue line. Its overbought (70) and oversold (30) levels display in the same frame as red dashed lines.
Its mid-level (50) displays in the same frame as a grey dashed line.
The Chande's Dynamic Momentum Index's Long Entry Level and Short Entry Level display in
Additional Frame 1 as dashed blue lines.
When a Long signal is generated a blue up arrow graphic displays in the chart window, the
message "Long entry signal detected! Chande's DMI crossed above its Long Entry Level." displays
in the Trading Activity window, and an audio sound file plays. If Auto-Trade mode is enabled
automated trading actions request orders based on the logic of the OpenBuy output variable, the
logic of the CloseSell output variable, and the parameters defined in the Trading System Properties
window's Trading Parameters tab.
When a Short signal is generated a red down arrow graphic displays in the chart window, the
message "Short entry signal detected! Chande's DMI crossed below its Short Entry Level." displays
in the Trading Activity window, and an audio sound file plays. If Auto-Trade mode is enabled
automated trading actions request orders based on the logic of the OpenSell output variable, the
logic of the CloseBuy output variable, and the parameters defined in the Trading System Properties
window's Trading Parameters tab.
Below is a screenshot that shows the Chande's Dynamic Momentum Index Cross System attached
to a chart window using its default parameters...
© 2011 Visual Trading Systems, LLC
Trading Systems
System Parameters
This trading system includes adjustable input parameters for added flexibility. You can make any
required changes from the System Parameters tab in its properties window.
© 2011 Visual Trading Systems, LLC
751
752
VT Trader 2.0 Help Manual
The System Parameters tab contains the following input parameters:
Instrument, Interval, Bid/Ask
These parameters are "read only" values. They are the instrument, chart interval, and chart type the
trading system is (or will be) attached to.
Chande's DMI Price, Std. Dev. Periods, MA of Std. Dev. Periods, MA of Std. Dev. Type, Periods,
and Dynamic Periods Lower/Upper Bounds
These parameters define the values used to calculate Chande's Dynamic Momentum Index. Please
refer to Chande's Dynamic Momentum Index's Notes section in VT Trader for additional indicator
details.
Chande's DMI Long Entry Level
This parameter defines the value used in the Chande's DMI-related conditions to generate the Long
signal.
Chande's DMI Short Entry Level
This parameter defines the value used in the Chande's DMI-related conditions to generate the Short
signal.
Method for Generating Signals
This parameter is a selection list with two choices. "Alert_for_ALL_Signals" allows the trading
system to provide alerts for all potential trading signals, including multiple consecutive long or short
signals. "Always_in_the_Market" forces the trading system to provide alerts for only the first signal
in a consecutive series of long or short signals.
© 2011 Visual Trading Systems, LLC
Trading Systems
753
Auto-Trading Parameters
It is extremely important that you verify (and change, if necessary) the parameters in the Trading
Parameters tab if you intend to use this trading system in Auto-Trade mode. You must specify the
Amount (in Lots) that will be used for each order the trading system requests.
For the trading system to auto-trade, it is necessary to start it in Auto-Trade mode; failure to do this will
result in no automated order requests being submitted. Auto-Trade mode may be started once the
trading system is properly configured and successfully attached to a chart.
7.8
Chande's Dynamic Momentum Index Reversal System
Overview
The Chande's Dynamic Momentum Index Reversal System uses Chande's Dynamic Momentum
Index to generate signals for potential trading opportunities.
The signals are generated using the following logic:
A Long Entry signal is generated when Chande's Dynamic Momentum Index crosses above its OverSold
Level from below.
A Long Exit signal is generated when Chande's Dynamic Momentum Index crosses below its
OverBought Level from above OR Chande's Dynamic Momentum Index crosses below its OverSold Level
from above.
© 2011 Visual Trading Systems, LLC
754
VT Trader 2.0 Help Manual
A Short Entry signal is generated when Chande's Dynamic Momentum Index crosses below its
OverBought Level from above.
A Short Exit signal is generated when Chande's Dynamic Momentum Index crosses above its OverSold
Level from below OR Chande's Dynamic Momentum Index crosses above its OverBought Level from
below.
This trading system can be used in Recommendation Only mode to generate alerts and, if you choose,
in Auto-Trade mode to automatically request orders based on its signals and its Trading Enabled output
variables (OpenBuy, CloseBuy, OpenSell, and CloseSell).
System Outputs and Signals Logic
The Chande's Dynamic Momentum Index Reversal System consists of the following output variables
and display parameters:
Chande's Dynamic Momentum Index displays in Additional Frame 1 as a solid, slightly thicker blue
line.
Chande's Dynamic Momentum Index OverBought and OverSold levels display in Additional Frame 1
as dashed red lines.
When a Long Entry signal is generated a blue up arrow graphic displays in the chart window, the
message "Long entry signal detected! Chande's DMI crossed above its OverSold Level." displays in
the Trading Activity window, and an audio sound file plays. If Auto-Trade mode is enabled
automated trading actions request orders based on the logic of the OpenBuy output variable and the
parameters defined in the Trading System Properties window's Trading Parameters tab.
When a Long Exit signal is generated a blue exit graphic displays in the chart window, the
message "Long exit signal detected! Chande's DMI crossed below its OverBought Level or OverSold
Level." displays in the Trading Activity window, and an audio sound file plays. If Auto-Trade mode
is enabled automated trading actions request orders based on the logic of the CloseBuy variable
and the parameters defined in the Trading System Properties window's Trading Parameters tab.
When a Short Entry signal is generated a red down arrow graphic displays in the chart window, the
message "Short entry signal detected! Chande's DMI crossed below its OverBought Level."
displays in the Trading Activity window, and an audio sound file plays. If Auto-Trade mode is
enabled automated trading actions request orders based on the logic of the OpenSell output
variable, the logic of the CloseBuy output variable, and the parameters defined in the Trading
System Properties window's Trading Parameters tab.
When a Short Exit signal is generated a red exit graphic displays in the chart window, the message
"Short exit signal detected! Chande's DMI crossed above its OverSold Level or OverBought Level."
displays in the Trading Activity window, and an audio sound file plays. If Auto-Trade mode is
enabled automated trading actions request orders based on the logic of the OpenSell output
variable and the parameters defined in the Trading System Properties window's Trading Parameters
tab.
Below is a screenshot that shows the Chande's Dynamic Momentum Index Reversal System
attached to a chart window using its default parameters...
© 2011 Visual Trading Systems, LLC
Trading Systems
System Parameters
This trading system includes adjustable input parameters for added flexibility. You can make any
required changes from the System Parameters tab in its properties window.
© 2011 Visual Trading Systems, LLC
755
756
VT Trader 2.0 Help Manual
The System Parameters tab contains the following input parameters:
Instrument, Interval, Bid/Ask
These parameters are "read only" values. They are the instrument, chart interval, and chart type the
trading system is (or will be) attached to.
Chande's DMI Price, Std. Dev. Periods, MA of Std. Dev. Periods, MA of Std. Dev. Type, Periods,
and Dynamic Periods Lower/Upper Bounds
These parameters define the values used to calculate Chande's Dynamic Momentum Index. Please
refer to Chande's Dynamic Momentum Index's Notes section in VT Trader for additional indicator
details.
Chande's DMI OverBought Level
This parameter defines the OverBought value used in the Chande's Dynamic Momentum Indexrelated conditions to generate the Long Exit, Short Entry, and Short Exit signals.
Chande's DMI OverSold Level
This parameter defines the OverSold value used in the Chande's Dynamic Momentum Index-related
conditions to generate the Long Entry, Long Exit, and Short Exit signals.
Auto-Trading Parameters
It is extremely important that you verify (and change, if necessary) the parameters in the Trading
Parameters tab if you intend to use this trading system in Auto-Trade mode. You must specify the
Amount (in Lots) that will be used for each order the trading system requests.
© 2011 Visual Trading Systems, LLC
Trading Systems
757
For the trading system to auto-trade, it is necessary to start it in Auto-Trade mode; failure to do this will
result in no automated order requests being submitted. Auto-Trade mode may be started once the
trading system is properly configured and successfully attached to a chart.
7.9
Chande's QStick Cross System
Overview
The Chande's QStick Cross System uses Chande's QStick to generate signals for potential trading
opportunities.
The signals are generated using the following logic:
A Long signal is generated when Chande's QStick Histogram crosses above zero.
A Short signal is generated when Chande's QStick Histogram crosses below zero.
This trading system can be used in Recommendation Only mode to generate alerts and, if you choose,
in Auto-Trade mode to automatically request orders based on its signals and its Trading Enabled output
variables (OpenBuy, CloseBuy, OpenSell, and CloseSell).
System Outputs and Signals Logic
The Chande's QStick Cross System consists of the following output variables and display parameters:
© 2011 Visual Trading Systems, LLC
758
VT Trader 2.0 Help Manual
The Chande's QStick Histogram displays in Additional Frame 1 as a histogram. The histogram is
green if the current value is greater than the value 1 bar ago and it's red when the current value is
less than the value 1 bar ago.
The Trend Frame displays a white up arrow against a dark blue background while Chande's QStick
Histogram is greater than zero.
The Trend Frame displays a white down arrow against a dark red background while Chande's
QStick Histogram is less than zero.
When a Long signal is generated a dark blue up arrow graphic displays in the chart window, the
message "Long signal detected! Chande's QStick crossed above zero." displays in the Trading
Activity window, and an audio sound file plays. If Auto-Trade mode is enabled automated trading
actions request orders based on the logic of the OpenBuy output variable, the logic of the CloseSell
output variable, and the parameters defined in the Trading System Properties window's Trading
Parameters tab.
When a Short signal is generated a dark red down arrow graphic displays in the chart window, the
message "Short signal detected! Chande's QStick crossed below zero." displays in the Trading
Activity window, and an audio sound file plays. If Auto-Trade mode is enabled automated trading
actions request orders based on the logic of the OpenSell output variable, the logic of the CloseBuy
output variable, and the parameters defined in the Trading System Properties window's Trading
Parameters tab.
Below is a screenshot that shows the Chande's QStick Cross System attached to a chart window
using its default parameters...
© 2011 Visual Trading Systems, LLC
Trading Systems
System Parameters
This trading system includes adjustable input parameters for added flexibility. You can make any
required changes from the System Parameters tab in its properties window.
© 2011 Visual Trading Systems, LLC
759
760
VT Trader 2.0 Help Manual
The System Parameters tab contains the following input parameters:
Instrument, Interval, Bid/Ask
These parameters are "read only" values. They are the instrument, chart interval, and chart type the
trading system is (or will be) attached to.
Chande's QStick Periods
This parameter defines the number of periods used to calculate Chande's QStick
Chande's QStick MA Type
This parameter defines the type of moving average used to calculate Chande's QStick
Auto-Trading Parameters
It is extremely important that you verify (and change, if necessary) the parameters in the Trading
Parameters tab if you intend to use this trading system in Auto-Trade mode. You must specify the
Amount (in Lots) that will be used for each order the trading system requests.
© 2011 Visual Trading Systems, LLC
Trading Systems
761
For the trading system to auto-trade, it is necessary to start it in Auto-Trade mode; failure to do this will
result in no automated order requests being submitted. Auto-Trade mode may be started once the
trading system is properly configured and successfully attached to a chart.
7.10
Chande's Trend Momentum System
Overview
The Chande's Trend Momentum System uses Chande's Momentum Oscillator to generate signals for
potential trading opportunities.
The signals are generated using the following logic:
A Long Entry signal is generated when Chande's Momentum Oscillator crosses above its Long Entry
Level.
A Long Exit signal is generated when Chande's Momentum Oscillator crosses below its OverBought
Level OR Chande's Momentum Oscillator crosses below its Short Entry Level.
A Short Entry signal is generated when Chande's Momentum Oscillator crosses below its Short Entry
Level.
A Short Exit signal is generated when Chande's Momentum Oscillator crosses above its OverSold Level
OR Chande's Momentum Oscillator crosses above its Long Entry Level.
This trading system can be used in Recommendation Only mode to generate alerts and, if you choose,
in Auto-Trade mode to automatically request orders based on its signals and its Trading Enabled output
variables (OpenBuy, CloseBuy, OpenSell, and CloseSell).
© 2011 Visual Trading Systems, LLC
762
VT Trader 2.0 Help Manual
System Outputs and Signals Logic
The Chande's Trend Momentum System consists of the following output variables and display
parameters:
Chande's Momentum Oscillator displays in Additional Frame 1 as a solid blue line.
Chande's Momentum Oscillator OverBought and OverSold levels display in Additional Frame 1 as
dashed red lines.
Chande's Momentum Oscillator Long Entry and Short Entry levels display in Additional Frame 1 as
dashed black lines.
When a Long Entry signal is generated a blue up arrow graphic displays in the chart window, the
message "Long entry signal detected! CMO crossed above its Long Entry Level." displays in the
Trading Activity window, and an audio sound file plays. If Auto-Trade mode is enabled automated
trading actions request orders based on the logic of the OpenBuy output variable and the
parameters defined in the Trading System Properties window's Trading Parameters tab.
When a Long Exit signal is generated a blue exit graphic displays in the chart window, the
message "Long exit signal detected!CMO crossed below its OverBought Level or its Short Entry
Level." displays in the Trading Activity window, and an audio sound file plays. If Auto-Trade mode
is enabled automated trading actions request orders based on the logic of the CloseBuy variable
and the parameters defined in the Trading System Properties window's Trading Parameters tab.
When a Short Entry signal is generated a red down arrow graphic displays in the chart window, the
message "Short entry signal detected! CMO crossed below its Short Entry Level." displays in the
Trading Activity window, and an audio sound file plays. If Auto-Trade mode is enabled automated
trading actions request orders based on the logic of the OpenSell output variable, the logic of the
CloseBuy output variable, and the parameters defined in the Trading System Properties window's
Trading Parameters tab.
When a Short Exit signal is generated a red exit graphic displays in the chart window, the message
"Short exit signal detected! CMO crossed above its OverSold Level or its Long Entry Level."
displays in the Trading Activity window, and an audio sound file plays. If Auto-Trade mode is
enabled automated trading actions request orders based on the logic of the OpenSell output
variable and the parameters defined in the Trading System Properties window's Trading Parameters
tab.
Below is a screenshot that shows the Chande's Trend Momentum System attached to a chart
window using its default parameters...
© 2011 Visual Trading Systems, LLC
Trading Systems
System Parameters
This trading system includes adjustable input parameters for added flexibility. You can make any
required changes from the System Parameters tab in its properties window.
© 2011 Visual Trading Systems, LLC
763
764
VT Trader 2.0 Help Manual
The System Parameters tab contains the following input parameters:
Instrument, Interval, Bid/Ask
These parameters are "read only" values. They are the instrument, chart interval, and chart type the
trading system is (or will be) attached to.
Chande's Mom. Osc. Price and Chande' Mom. Osc. Periods
These parameters define the values used to calculate Chande's Momentum Oscillator.
Chande's Mom. Osc. OverBought Level
This parameter defines the value used in the Chande's Momentum Oscillator-related conditions to
generate the Long Exit signal.
Chande's Mom. Osc. OverSold Level
This parameter defines the value used in the Chande's Momentum Oscillator-related conditions to
generate the Short Exit signal.
Chande's Mom. Osc. Long Entry Level
This parameter defines the value used in the Chande's Momentum Oscillator-related conditions to
generate the Long Entry signal.
Chande's Mom. Osc. Short Entry Level
This parameter defines the value used in the Chande's Momentum Oscillator-related conditions to
generate the Short Entry signal.
© 2011 Visual Trading Systems, LLC
Trading Systems
765
Auto-Trading Parameters
It is extremely important that you verify (and change, if necessary) the parameters in the Trading
Parameters tab if you intend to use this trading system in Auto-Trade mode. You must specify the
Amount (in Lots) that will be used for each order the trading system requests.
For the trading system to auto-trade, it is necessary to start it in Auto-Trade mode; failure to do this will
result in no automated order requests being submitted. Auto-Trade mode may be started once the
trading system is properly configured and successfully attached to a chart.
7.11
Chande's TrendScore Trend Surfing System
Overview
The Chande's TrendScore Trend Surfing System uses Chande's TrendScore indicator to generate
signals for potential trading opportunities.
The signals are generated using the following logic:
A Long Entry signal is generated when Chande's TrendScore is equal to 10 for two bars.
A Long Exit signal is generated when Chande's TrendScore crosses below zero.
A Short Entry signal is generated when Chande's TrendScore is equal to -10 for two bars.
A Short Exit signal is generated when Chande's TrendScore crosses above zero.
© 2011 Visual Trading Systems, LLC
766
VT Trader 2.0 Help Manual
This trading system can be used in Recommendation Only mode to generate alerts and, if you choose,
in Auto-Trade mode to automatically request orders based on its signals and its Trading Enabled output
variables (OpenBuy, CloseBuy, OpenSell, and CloseSell).
System Outputs and Signals Logic
The Chande's TrendScore Trend Surfing System consists of the following output variables and
display parameters:
Chande's Momentum Oscillator displays in Additional Frame 1 as a solid, slightly thicker green
line. Its mid-level (0) displays in the same frame as a dashed black line.
When a Long Entry signal is generated a blue up arrow graphic displays in the chart window, the
message "Long entry signal detected! Chande's TrendScore has been equal to 10 for two bars."
displays in the Trading Activity window, and an audio sound file plays. If Auto-Trade mode is
enabled automated trading actions request orders based on the logic of the OpenBuy output
variable and the parameters defined in the Trading System Properties window's Trading Parameters
tab.
When a Long Exit signal is generated a blue exit graphic displays in the chart window, the
message "Long exit signal detected! Chande's TrendScore crossed below zero." displays in the
Trading Activity window, and an audio sound file plays. If Auto-Trade mode is enabled automated
trading actions request orders based on the logic of the CloseBuy variable and the parameters
defined in the Trading System Properties window's Trading Parameters tab.
When a Short Entry signal is generated a red down arrow graphic displays in the chart window, the
message "Short entry signal detected! Chande's TrendScore has been equal to -10 for two bars."
displays in the Trading Activity window, and an audio sound file plays. If Auto-Trade mode is
enabled automated trading actions request orders based on the logic of the OpenSell output
variable, the logic of the CloseBuy output variable, and the parameters defined in the Trading
System Properties window's Trading Parameters tab.
When a Short Exit signal is generated a red exit graphic displays in the chart window, the message
"Short exit signal detected! Chande's TrendScore crossed above zero." displays in the Trading
Activity window, and an audio sound file plays. If Auto-Trade mode is enabled automated trading
actions request orders based on the logic of the OpenSell output variable and the parameters
defined in the Trading System Properties window's Trading Parameters tab.
Below is a screenshot that shows the Chande's TrendScore Trend Surfing System attached to a
chart window using its default parameters...
© 2011 Visual Trading Systems, LLC
Trading Systems
System Parameters
This trading system includes adjustable input parameters for added flexibility. You can make any
required changes from the System Parameters tab in its properties window.
© 2011 Visual Trading Systems, LLC
767
768
VT Trader 2.0 Help Manual
The System Parameters tab contains the following input parameters:
Instrument, Interval, Bid/Ask
These parameters are "read only" values. They are the instrument, chart interval, and chart type the
trading system is (or will be) attached to.
Chande's TrendScore Price
These parameters define the price used to calculate Chande's TrendScore
Auto-Trading Parameters
It is extremely important that you verify (and change, if necessary) the parameters in the Trading
Parameters tab if you intend to use this trading system in Auto-Trade mode. You must specify the
Amount (in Lots) that will be used for each order the trading system requests.
© 2011 Visual Trading Systems, LLC
Trading Systems
769
For the trading system to auto-trade, it is necessary to start it in Auto-Trade mode; failure to do this will
result in no automated order requests being submitted. Auto-Trade mode may be started once the
trading system is properly configured and successfully attached to a chart.
7.12
Chande's VIDYA Cross System
Overview
Chande's VIDYA Cross System uses fast and slow Chande Variable Index Dynamic Averages
(VIDYA's) to generate signals for potential trading opportunities.
The signals are generated using the following logic:
A Long signal is generated when the Fast VIDYA crosses above the Slow VIDYA.
A Short signal is generated when the Fast VIDYA crosses below the Slow VIDYA.
This trading system can be used in Recommendation Only mode to generate alerts and, if you choose,
in Auto-Trade mode to automatically request orders based on its signals and its Trading Enabled output
variables (OpenBuy, CloseBuy, OpenSell, and CloseSell).
System Outputs and Signals Logic
The Chande's VIDYA Cross System consists of the following output variables and display parameters:
The Fast VIDYA displays in the Price Frame as slightly thicker, solid blue line.
© 2011 Visual Trading Systems, LLC
770
VT Trader 2.0 Help Manual
The Slow VIDYA displays in the Price Frame as a slightly thicker, solid red line.
The Trend Frame displays a white up arrow against a blue background while the Fast VIDYA is
greater than the Slow VIDYA.
The Trend Frame displays a white down arrow against a red background while the Fast VIDYA is
less than the Slow VIDYA.
When a Long signal is generated a blue up arrow graphic displays in the chart window, the
message "Long signal detected! Fast VIDYA crossed above Slow VIDYA." displays in the Trading
Activity window, and an audio sound file plays. If Auto-Trade mode is enabled automated trading
actions request orders based on the logic of the OpenBuy output variable, the logic of the CloseSell
output variable, and the parameters defined in the Trading System Properties window's Trading
Parameters tab.
When a Short signal is generated a red down arrow graphic displays in the chart window, the
message "Short signal detected! Fast VIDYA crossed below Slow VIDYA." displays in the Trading
Activity window, and an audio sound file plays. If Auto-Trade mode is enabled automated trading
actions request orders based on the logic of the OpenSell output variable, the logic of the CloseBuy
output variable, and the parameters defined in the Trading System Properties window's Trading
Parameters tab.
Below is a screenshot that shows the Double Exponential Moving Average (DEMA) Cross System
attached to a chart window using its default parameters...
© 2011 Visual Trading Systems, LLC
Trading Systems
System Parameters
This trading system includes adjustable input parameters for added flexibility. You can make any
required changes from the System Parameters tab in its properties window.
© 2011 Visual Trading Systems, LLC
771
772
VT Trader 2.0 Help Manual
The System Parameters tab contains the following input parameters:
Instrument, Interval, Bid/Ask
These parameters are "read only" values. They are the instrument, chart interval, and chart type the
trading system is (or will be) attached to.
Fast VIDYA Price, Fast CMO Periods, and Fast VIDYA Periods
These parameters define the price, number of periods, and number of CMO periods used to
calculate the Fast Variable Index Dynamic Average (VIDYA).
Slow VIDYA Price, Slow CMO Periods, and Slow VIDYA Periods
These parameters define the price, number of periods, and number of CMO periods used to
calculate the Slow Variable Index Dynamic Average (VIDYA).
Auto-Trading Parameters
It is extremely important that you verify (and change, if necessary) the parameters in the Trading
Parameters tab if you intend to use this trading system in Auto-Trade mode. You must specify the
Amount (in Lots) that will be used for each order the trading system requests.
© 2011 Visual Trading Systems, LLC
Trading Systems
773
For the trading system to auto-trade, it is necessary to start it in Auto-Trade mode; failure to do this will
result in no automated order requests being submitted. Auto-Trade mode may be started once the
trading system is properly configured and successfully attached to a chart.
7.13
Chaos Accelerator Oscillator Cross System
Overview
The Chaos Accelerator Oscillator Cross System uses the Chaos Accelerator Oscillator to generate
signals for potential trading opportunities.
The signals are generated using the following logic:
A Long signal is generated when the Chaos Accelerator Oscillator crosses above zero.
A Short signal is generated when the Chaos Accelerator Oscillator crosses below zero.
This trading system can be used in Recommendation Only mode to generate alerts and, if you choose,
in Auto-Trade mode to automatically request orders based on its signals and its Trading Enabled output
variables (OpenBuy, CloseBuy, OpenSell, and CloseSell).
System Outputs and Signals Logic
The Chaos Accelerator Oscillator Cross System consists of the following output variables and display
parameters:
© 2011 Visual Trading Systems, LLC
774
VT Trader 2.0 Help Manual
The Chaos Accelerator Oscillator displays in Additional Frame 1 as a histogram. The histogram is
green if the current value is greater than the value 1 bar ago and it's red when the current value is
less than the value 1 bar ago. Its mid-level (0) displays in the same frame as a black dashed line.
The Trend Frame displays a white up arrow against a blue background while the Chaos Accelerator
Oscillator is greater than zero.
The Trend Frame displays a white down arrow against a red background while the Chaos
Accelerator Oscillator is less than zero.
When a Long signal is generated a blue up arrow graphic displays in the chart window, the
message "Long signal detected! The Chaos Accelerator Osc. crossed above zero." displays in the
Trading Activity window, and an audio sound file plays. If Auto-Trade mode is enabled automated
trading actions request orders based on the logic of the OpenBuy output variable, the logic of the
CloseSell output variable, and the parameters defined in the Trading System Properties window's
Trading Parameters tab.
When a Short signal is generated a red down arrow graphic displays in the chart window, the
message "Short signal detected! The Chaos Accelerator Osc. crossed below zero." displays in the
Trading Activity window, and an audio sound file plays. If Auto-Trade mode is enabled automated
trading actions request orders based on the logic of the OpenSell output variable, the logic of the
CloseBuy output variable, and the parameters defined in the Trading System Properties window's
Trading Parameters tab.
Below is a screenshot that shows the Chaos Accelerator Oscillator Cross System attached to a chart
window using its default parameters...
© 2011 Visual Trading Systems, LLC
Trading Systems
System Parameters
This trading system includes adjustable input parameters for added flexibility. You can make any
required changes from the System Parameters tab in its properties window.
© 2011 Visual Trading Systems, LLC
775
776
VT Trader 2.0 Help Manual
The System Parameters tab contains the following input parameters:
Instrument, Interval, Bid/Ask
These parameters are "read only" values. They are the instrument, chart interval, and chart type the
trading system is (or will be) attached to.
Chaos AC Osc. Price
This parameter defines the price used to calculate the Chaos Accelerator Oscillator
Chaos AC Osc. Fast MA Periods
This parameter defines the number of periods used to calculate the fast moving average used to
calculate the Chaos Accelerator Oscillator
Chaos AC Osc. Slow MA Periods
This parameter defines the number of periods used to calculate the slow moving average used to
calculate the Chaos Accelerator Oscillator
Chaos AC Osc. Signal MA Periods
This parameter defines the number of periods used to calculate the signal line used to calculate the
Chaos Accelerator Oscillator
Auto-Trading Parameters
It is extremely important that you verify (and change, if necessary) the parameters in the Trading
© 2011 Visual Trading Systems, LLC
Trading Systems
777
Parameters tab if you intend to use this trading system in Auto-Trade mode. You must specify the
Amount (in Lots) that will be used for each order the trading system requests.
For the trading system to auto-trade, it is necessary to start it in Auto-Trade mode; failure to do this will
result in no automated order requests being submitted. Auto-Trade mode may be started once the
trading system is properly configured and successfully attached to a chart.
7.14
Chaos Accelerator Oscillator Reversal System
Overview
The Chaos Accelerator Oscillator Reversal System uses the Chaos Accelerator Oscillator to
generate signals for potential trading opportunities.
The signals are generated using the following logic:
A Long signal is generated when the Chaos Accelerator Oscillator turns upwards (i.e. the current Chaos
AC value is greater than the previous Chaos AC value).
A Short signal is generated when the Chaos Accelerator Oscillator turns downwards (i.e. the current
Chaos AC value is less than the previous Chaos AC value).
This trading system can be used in Recommendation Only mode to generate alerts and, if you choose,
in Auto-Trade mode to automatically request orders based on its signals and its Trading Enabled output
variables (OpenBuy, CloseBuy, OpenSell, and CloseSell).
System Outputs and Signals Logic
© 2011 Visual Trading Systems, LLC
778
VT Trader 2.0 Help Manual
The Chaos Accelerator Oscillator Reversal System consists of the following output variables and
display parameters:
The Chaos Accelerator Oscillator displays in Additional Frame 1 as a histogram. The histogram is
green if the current value is greater than the value 1 bar ago and it's red when the current value is
less than the value 1 bar ago. Its mid-level (0) displays in the same frame as a black dashed line.
When a Long signal is generated a blue up arrow graphic displays in the chart window, the
message "Long signal detected! The Chaos Accelerator Osc. turned upwards." displays in the
Trading Activity window, and an audio sound file plays. If Auto-Trade mode is enabled automated
trading actions request orders based on the logic of the OpenBuy output variable, the logic of the
CloseSell output variable, and the parameters defined in the Trading System Properties window's
Trading Parameters tab.
When a Short signal is generated a red down arrow graphic displays in the chart window, the
message "Short signal detected! The Chaos Accelerator Osc. turned downwards." displays in the
Trading Activity window, and an audio sound file plays. If Auto-Trade mode is enabled automated
trading actions request orders based on the logic of the OpenSell output variable, the logic of the
CloseBuy output variable, and the parameters defined in the Trading System Properties window's
Trading Parameters tab.
Below is a screenshot that shows the Chaos Accelerator Oscillator Reversal System attached to a
chart window using its default parameters...
© 2011 Visual Trading Systems, LLC
Trading Systems
System Parameters
This trading system includes adjustable input parameters for added flexibility. You can make any
required changes from the System Parameters tab in its properties window.
© 2011 Visual Trading Systems, LLC
779
780
VT Trader 2.0 Help Manual
The System Parameters tab contains the following input parameters:
Instrument, Interval, Bid/Ask
These parameters are "read only" values. They are the instrument, chart interval, and chart type the
trading system is (or will be) attached to.
Chaos AC Osc. Price
This parameter defines the price used to calculate the Chaos Accelerator Oscillator
Chaos AC Osc. Fast MA Periods
This parameter defines the number of periods used to calculate the fast moving average used to
calculate the Chaos Accelerator Oscillator
Chaos AC Osc. Slow MA Periods
This parameter defines the number of periods used to calculate the slow moving average used to
calculate the Chaos Accelerator Oscillator
Chaos AC Osc. Signal MA Periods
This parameter defines the number of periods used to calculate the signal line used to calculate the
Chaos Accelerator Oscillator
Auto-Trading Parameters
It is extremely important that you verify (and change, if necessary) the parameters in the Trading
© 2011 Visual Trading Systems, LLC
Trading Systems
781
Parameters tab if you intend to use this trading system in Auto-Trade mode. You must specify the
Amount (in Lots) that will be used for each order the trading system requests.
For the trading system to auto-trade, it is necessary to start it in Auto-Trade mode; failure to do this will
result in no automated order requests being submitted. Auto-Trade mode may be started once the
trading system is properly configured and successfully attached to a chart.
7.15
Chaos Awesome Oscillator / Signal Line Cross System
Overview
The Chaos Awesome Oscillator / Signal Line Cross System uses the Chaos Awesome Oscillator to
generate signals for potential trading opportunities.
The signals are generated using the following logic:
A Long signal is generated when the Chaos Awesome Oscillator crosses above its Signal Line.
A Short signal is generated when the Chaos Awesome Oscillator crosses below its Signal Line.
This trading system can be used in Recommendation Only mode to generate alerts and, if you choose,
in Auto-Trade mode to automatically request orders based on its signals and its Trading Enabled output
variables (OpenBuy, CloseBuy, OpenSell, and CloseSell).
System Outputs and Signals Logic
© 2011 Visual Trading Systems, LLC
782
VT Trader 2.0 Help Manual
The Chaos Awesome Oscillator / Signal Line Cross System consists of the following output variables
and display parameters:
The Chaos Awesome Oscillator displays in Additional Frame 1 as a histogram. The histogram is
green if the current value is greater than the value 1 bar ago and it's red when the current value is
less than the value 1 bar ago. Its mid-level (0) displays in the same frame as a black dashed line.
The Chaos Awesome Oscillator's Signal Line displays in Additional Frame 1 as a blue dashed line.
When a Long signal is generated a blue up arrow graphic displays in the chart window, the
message "Long signal detected! The Chaos Awesome Osc. crossed above its Signal Line."
displays in the Trading Activity window, and an audio sound file plays. If Auto-Trade mode is
enabled automated trading actions request orders based on the logic of the OpenBuy output
variable, the logic of the CloseSell output variable, and the parameters defined in the Trading
System Properties window's Trading Parameters tab.
When a Short signal is generated a red down arrow graphic displays in the chart window, the
message "Short signal detected! The Chaos Awesome Osc. crossed below its Signal Line."
displays in the Trading Activity window, and an audio sound file plays. If Auto-Trade mode is
enabled automated trading actions request orders based on the logic of the OpenSell output
variable, the logic of the CloseBuy output variable, and the parameters defined in the Trading
System Properties window's Trading Parameters tab.
Below is a screenshot that shows the Chaos Awesome Oscillator / Signal Line Cross System
attached to a chart window using its default parameters...
© 2011 Visual Trading Systems, LLC
Trading Systems
System Parameters
This trading system includes adjustable input parameters for added flexibility. You can make any
required changes from the System Parameters tab in its properties window.
© 2011 Visual Trading Systems, LLC
783
784
VT Trader 2.0 Help Manual
The System Parameters tab contains the following input parameters:
Instrument, Interval, Bid/Ask
These parameters are "read only" values. They are the instrument, chart interval, and chart type the
trading system is (or will be) attached to.
Chaos AO Osc. Price
This parameter defines the price used to calculate the Chaos Awesome Oscillator
Chaos AO Osc. Fast MA Periods
This parameter defines the number of periods used to calculate the fast moving average used to
calculate the Chaos Awesome Oscillator
Chaos AO Osc. Slow MA Periods
This parameter defines the number of periods used to calculate the slow moving average used to
calculate the Chaos Awesome Oscillator
Chaos AO Osc. Signal MA Periods
This parameter defines the number of periods used to calculate the Chaos Awesome Oscillator's
Signal Line
Auto-Trading Parameters
It is extremely important that you verify (and change, if necessary) the parameters in the Trading
© 2011 Visual Trading Systems, LLC
Trading Systems
785
Parameters tab if you intend to use this trading system in Auto-Trade mode. You must specify the
Amount (in Lots) that will be used for each order the trading system requests.
For the trading system to auto-trade, it is necessary to start it in Auto-Trade mode; failure to do this will
result in no automated order requests being submitted. Auto-Trade mode may be started once the
trading system is properly configured and successfully attached to a chart.
7.16
Chaos Awesome Oscillator / Zero Cross System
Overview
The Chaos Awesome Oscillator / Zero Cross System uses the Chaos Awesome Oscillator to
generate signals for potential trading opportunities.
The signals are generated using the following logic:
A Long signal is generated when the Chaos Awesome Oscillator crosses above zero.
A Short signal is generated when the Chaos Awesome Oscillator crosses below zero.
This trading system can be used in Recommendation Only mode to generate alerts and, if you choose,
in Auto-Trade mode to automatically request orders based on its signals and its Trading Enabled output
variables (OpenBuy, CloseBuy, OpenSell, and CloseSell).
System Outputs and Signals Logic
© 2011 Visual Trading Systems, LLC
786
VT Trader 2.0 Help Manual
The Chaos Awesome Oscillator / Zero Cross System consists of the following output variables and
display parameters:
The Chaos Awesome Oscillator displays in Additional Frame 1 as a histogram. The histogram is
green if the current value is greater than the value 1 bar ago and it's red when the current value is
less than the value 1 bar ago. Its mid-level (0) displays in the same frame as a black dashed line.
The Chaos Awesome Oscillator's Signal Line displays in Additional Frame 1 as a blue dashed line.
The Trend Frame displays a white up arrow against a blue background while the Chaos Awesome
Oscillator is greater than zero.
The Trend Frame displays a white down arrow against a red background while the Chaos Awesome
Oscillator is less than zero.
When a Long signal is generated a blue up arrow graphic displays in the chart window, the
message "Long signal detected! The Chaos Awesome Osc. crossed above zero." displays in the
Trading Activity window, and an audio sound file plays. If Auto-Trade mode is enabled automated
trading actions request orders based on the logic of the OpenBuy output variable, the logic of the
CloseSell output variable, and the parameters defined in the Trading System Properties window's
Trading Parameters tab.
When a Short signal is generated a red down arrow graphic displays in the chart window, the
message "Short signal detected! The Chaos Awesome Osc. crossed below zero." displays in the
Trading Activity window, and an audio sound file plays. If Auto-Trade mode is enabled automated
trading actions request orders based on the logic of the OpenSell output variable, the logic of the
CloseBuy output variable, and the parameters defined in the Trading System Properties window's
Trading Parameters tab.
Below is a screenshot that shows the Chaos Awesome Oscillator / Zero Cross System attached to a
chart window using its default parameters...
© 2011 Visual Trading Systems, LLC
Trading Systems
System Parameters
This trading system includes adjustable input parameters for added flexibility. You can make any
required changes from the System Parameters tab in its properties window.
© 2011 Visual Trading Systems, LLC
787
788
VT Trader 2.0 Help Manual
The System Parameters tab contains the following input parameters:
Instrument, Interval, Bid/Ask
These parameters are "read only" values. They are the instrument, chart interval, and chart type the
trading system is (or will be) attached to.
Chaos AO Osc. Price
This parameter defines the price used to calculate the Chaos Awesome Oscillator
Chaos AO Osc. Fast MA Periods
This parameter defines the number of periods used to calculate the fast moving average used to
calculate the Chaos Awesome Oscillator
Chaos AO Osc. Slow MA Periods
This parameter defines the number of periods used to calculate the slow moving average used to
calculate the Chaos Awesome Oscillator
Chaos AO Osc. Signal MA Periods
This parameter defines the number of periods used to calculate the Chaos Awesome Oscillator's
Signal Line
Auto-Trading Parameters
It is extremely important that you verify (and change, if necessary) the parameters in the Trading
© 2011 Visual Trading Systems, LLC
Trading Systems
789
Parameters tab if you intend to use this trading system in Auto-Trade mode. You must specify the
Amount (in Lots) that will be used for each order the trading system requests.
For the trading system to auto-trade, it is necessary to start it in Auto-Trade mode; failure to do this will
result in no automated order requests being submitted. Auto-Trade mode may be started once the
trading system is properly configured and successfully attached to a chart.
7.17
Chaos Awesome Oscillator Reversal System
Overview
The Chaos Awesome Oscillator Reversal System uses the Chaos Awesome Oscillator to generate
signals for potential trading opportunities.
The signals are generated using the following logic:
A Long signal is generated when the Chaos Awesome Oscillator turns upwards (i.e. the current Chaos
AO value is greater than the previous Chaos AO value).
A Short signal is generated when the Chaos Awesome Oscillator turns downwards (i.e. the current
Chaos AO value is less than the previous Chaos AO value).
This trading system can be used in Recommendation Only mode to generate alerts and, if you choose,
in Auto-Trade mode to automatically request orders based on its signals and its Trading Enabled output
variables (OpenBuy, CloseBuy, OpenSell, and CloseSell).
System Outputs and Signals Logic
© 2011 Visual Trading Systems, LLC
790
VT Trader 2.0 Help Manual
The Chaos Awesome Oscillator Reversal System consists of the following output variables and
display parameters:
The Chaos Awesome Oscillator displays in Additional Frame 1 as a histogram. The histogram is
green if the current value is greater than the value 1 bar ago and it's red when the current value is
less than the value 1 bar ago. Its mid-level (0) displays in the same frame as a black dashed line.
The Chaos Awesome Oscillator's Signal Line displays in Additional Frame 1 as a blue dashed line.
When a Long signal is generated a blue up arrow graphic displays in the chart window, the
message "Long signal detected! The Chaos Awesome Osc. turned upwards." displays in the
Trading Activity window, and an audio sound file plays. If Auto-Trade mode is enabled automated
trading actions request orders based on the logic of the OpenBuy output variable, the logic of the
CloseSell output variable, and the parameters defined in the Trading System Properties window's
Trading Parameters tab.
When a Short signal is generated a red down arrow graphic displays in the chart window, the
message "Short signal detected! The Chaos Awesome Osc. turned downwards." displays in the
Trading Activity window, and an audio sound file plays. If Auto-Trade mode is enabled automated
trading actions request orders based on the logic of the OpenSell output variable, the logic of the
CloseBuy output variable, and the parameters defined in the Trading System Properties window's
Trading Parameters tab.
Below is a screenshot that shows the Chaos Awesome Oscillator Reversal System attached to a
chart window using its default parameters...
© 2011 Visual Trading Systems, LLC
Trading Systems
System Parameters
This trading system includes adjustable input parameters for added flexibility. You can make any
required changes from the System Parameters tab in its properties window.
© 2011 Visual Trading Systems, LLC
791
792
VT Trader 2.0 Help Manual
The System Parameters tab contains the following input parameters:
Instrument, Interval, Bid/Ask
These parameters are "read only" values. They are the instrument, chart interval, and chart type the
trading system is (or will be) attached to.
Chaos AO Osc. Price
This parameter defines the price used to calculate the Chaos Awesome Oscillator
Chaos AO Osc. Fast MA Periods
This parameter defines the number of periods used to calculate the fast moving average used to
calculate the Chaos Awesome Oscillator
Chaos AO Osc. Slow MA Periods
This parameter defines the number of periods used to calculate the slow moving average used to
calculate the Chaos Awesome Oscillator
Chaos AO Osc. Signal MA Periods
This parameter defines the number of periods used to calculate the Chaos Awesome Oscillator's
Signal Line
Auto-Trading Parameters
It is extremely important that you verify (and change, if necessary) the parameters in the Trading
© 2011 Visual Trading Systems, LLC
Trading Systems
793
Parameters tab if you intend to use this trading system in Auto-Trade mode. You must specify the
Amount (in Lots) that will be used for each order the trading system requests.
For the trading system to auto-trade, it is necessary to start it in Auto-Trade mode; failure to do this will
result in no automated order requests being submitted. Auto-Trade mode may be started once the
trading system is properly configured and successfully attached to a chart.
7.18
Chaos Fractals Breakout System
Overview
The Chaos Fractals Breakout System uses the Chaos Fractals indicator to generate signals for
potential trading opportunities.
The signals are generated using the following logic:
A Long signal is generated when the Close price crosses above the most recent Up Fractal. If the
"Require Price Confirmation of Breakout?" input parameter (see description below) is set to "Yes", the
Long signal is generated when the Close price crosses above the High price of the most recent Up
Fractal breakout bar within the following two bars.
A Short signal is generated when the Close price crosses below the most recent Down Fractal. If the
"Require Price Confirmation of Breakout?" input parameter (see description below) is set to "Yes", the
Short signal is generated when the Close price crosses below the Low price of the most recent Down
Fractal breakout bar within the following two bars.
This trading system can be used in Recommendation Only mode to generate alerts and, if you choose,
in Auto-Trade mode to automatically request orders based on its signals and its Trading Enabled output
© 2011 Visual Trading Systems, LLC
794
VT Trader 2.0 Help Manual
variables (OpenBuy, CloseBuy, OpenSell, and CloseSell). Note: This trading system's Auto-Trade mode
always attempts to request orders based on the "Always_in_the_Market" method of generating signals
to help ensure that only one position is open at any given time even if the "Alert_for_ALL_Signals" input
selection is chosen.
System Outputs and Signals Logic
The Chaos Fractals Breakout System consists of the following output variables and display
parameters:
The Up Fractals levels are shown in the Price Frame as small blue dots.
The highest High value of the Up Fractals are shown in the Price Frame as large dark blue dots.
These dots are shown over the 3rd bar of the fractal only after the fractal has been identified on its
5th bar.
The Down Fractals levels are shown in the Price Frame as small red dots. These dots are shown
under the 3rd bar of the fractal only after the fractal has been identified on its 5th bar.
The lowest Low value of the Down Fractals are shown in the Price Frame as large dark red dots.
If the "Require Price Confirmation of Breakout?" input parameter is set to "Yes", medium-sized
green dots display in the Price Frame to designate the High price of the most recent Up Fractal
breakout bar and medium-sized pink dots display in the Price Frame to designate the Low price of
the most recent Down Fractal breakout bar.
When a Long signal is generated a green up arrow graphic displays in the chart window, the
message "Long signal detected! Price has broken out above the most recent Up Fractal." displays
in the Trading Activity window, and an audio sound file plays. If Auto-Trade mode is enabled
automated trading actions request orders based on the logic of the OpenBuy output variable, the
logic of the CloseSell output variable, and the parameters defined in the Trading System
Properties window's Trading Parameters tab.
When a Short signal is generated a pink down arrow graphic displays in the chart window, the
message "Short signal detected! Price has broken out below the most recent Down Fractal."
displays in the Trading Activity window, and an audio sound file plays. If Auto-Trade mode is
enabled automated trading actions request orders based on the logic of the OpenSell output
variable, the logic of the CloseBuy output variable, and the parameters defined in the Trading
System Properties window's Trading Parameters tab.
Below is a screenshot that shows the Chaos Fractals Breakout System attached to a chart window
using its default parameters...
© 2011 Visual Trading Systems, LLC
Trading Systems
System Parameters
This trading system includes adjustable input parameters for added flexibility. You can make any
required changes from the System Parameters tab in its properties window.
© 2011 Visual Trading Systems, LLC
795
796
VT Trader 2.0 Help Manual
The System Parameters tab contains the following input parameters:
Instrument, Interval, Bid/Ask
These parameters are "read only" values. They are the instrument, chart interval, and chart type the
trading system is (or will be) attached to.
Require Price Confirmation of Breakout?
This parameter changes the conditions necessary to generate the Long and Short signals. Please
refer to the Overview section above for details.
Method for Generating Signals
This parameter is a selection list with two choices. "Alert_for_ALL_Signals" allows the trading
system to provide alerts for all potential trading signals, including multiple consecutive long or short
signals. "Always_in_the_Market" forces the trading system to provide alerts for only the first signal
in a consecutive series of long or short signals.
Auto-Trading Parameters
It is extremely important that you verify (and change, if necessary) the parameters in the Trading
Parameters tab if you intend to use this trading system in Auto-Trade mode. You must specify the
Amount (in Lots) that will be used for each order the trading system requests.
© 2011 Visual Trading Systems, LLC
Trading Systems
797
For the trading system to auto-trade, it is necessary to start it in Auto-Trade mode; failure to do this will
result in no automated order requests being submitted. Auto-Trade mode may be started once the
trading system is properly configured and successfully attached to a chart.
7.19
Chaos Fractals Reversal System
Overview
The Chaos Fractals Reversal System uses the Chaos Fractals indicator to generate signals for
potential trading opportunities.
The signals are generated using the following logic:
A Long signal is generated when the prices form a new Down Fractal.
A Short signal is generated when the prices form a new Up Fractal.
This trading system can be used in Recommendation Only mode to generate alerts and, if you choose,
in Auto-Trade mode to automatically request orders based on its signals and its Trading Enabled output
variables (OpenBuy, CloseBuy, OpenSell, and CloseSell). Note: This trading system's Auto-Trade mode
always attempts to request orders based on the "Always_in_the_Market" method of generating signals
to help ensure that only one position is open at any given time even if the "Alert_for_ALL_Signals" input
selection is chosen.
System Outputs and Signals Logic
© 2011 Visual Trading Systems, LLC
798
VT Trader 2.0 Help Manual
The Chaos Fractals Reversal System consists of the following output variables and display
parameters:
The Up Fractals levels are shown in the Price Frame as small blue dots.
The highest High value of the Up Fractals are shown in the Price Frame as large dark blue dots.
These dots are shown over the 3rd bar of the fractal only after the fractal has been identified on its
5th bar.
The Down Fractals levels are shown in the Price Frame as small red dots. These dots are shown
under the 3rd bar of the fractal only after the fractal has been identified on its 5th bar.
The lowest Low value of the Down Fractals are shown in the Price Frame as large dark red dots.
When a Long signal is generated a blue up arrow graphic displays in the chart window, the
message "Long signal detected! Price has formed a new Down Fractal." displays in the Trading
Activity window, and an audio sound file plays. If Auto-Trade mode is enabled automated trading
actions request orders based on the logic of the OpenBuy output variable, the logic of the
CloseSell output variable, and the parameters defined in the Trading System Properties window's
Trading Parameters tab.
When a Short signal is generated a red down arrow graphic displays in the chart window, the
message "Short signal detected! Price has formed a new Up Fractal." displays in the Trading
Activity window, and an audio sound file plays. If Auto-Trade mode is enabled automated trading
actions request orders based on the logic of the OpenSell output variable, the logic of the
CloseBuy output variable, and the parameters defined in the Trading System Properties window's
Trading Parameters tab.
Below is a screenshot that shows the Chaos Fractals Reversal System attached to a chart window
using its default parameters...
© 2011 Visual Trading Systems, LLC
Trading Systems
System Parameters
This trading system includes adjustable input parameters for added flexibility. You can make any
required changes from the System Parameters tab in its properties window.
© 2011 Visual Trading Systems, LLC
799
800
VT Trader 2.0 Help Manual
The System Parameters tab contains the following input parameters:
Instrument, Interval, Bid/Ask
These parameters are "read only" values. They are the instrument, chart interval, and chart type the
trading system is (or will be) attached to.
Method for Generating Signals
This parameter is a selection list with two choices. "Alert_for_ALL_Signals" allows the trading
system to provide alerts for all potential trading signals, including multiple consecutive long or short
signals. "Always_in_the_Market" forces the trading system to provide alerts for only the first signal
in a consecutive series of long or short signals.
Auto-Tradi