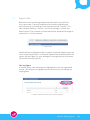
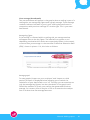
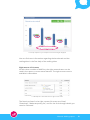
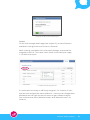
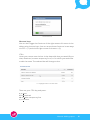
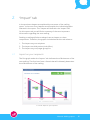
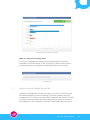
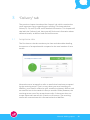
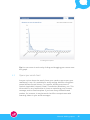
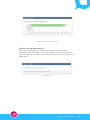
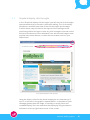
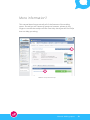
1
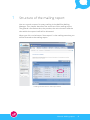
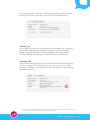
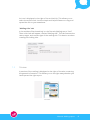
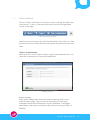
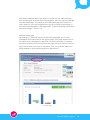
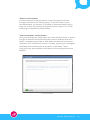
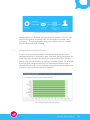
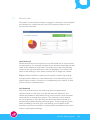
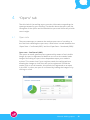
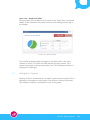
Manual:
Mailing report
This manual is written for Marcom Mailer en Campaigns
Table of contents
Introduction...................................................................................... 1
1 Structure of the mailing report...................................................... 2
1.1 General information tabs................................................................. 3
1.2 Preview............................................................................................... 5
1.3 Action buttons................................................................................... 6
1.4 Report tabs....................................................................................... 10
2 “Impact” tab.................................................................................... 17
2.1 Impact on your recipients.............................................................. 17
2.2 Impact on third parties................................................................... 18
2.3 Impact on your (target group) list................................................. 19
3 “Delivery” tab................................................................................. 21
3.1 Acceptatio ratio............................................................................... 21
3.2 Accepted emails per domain......................................................... 22
3.3 Bounce rate...................................................................................... 23
3.4 Email bounces per domain............................................................ 24
4 “Opens” tab..................................................................................... 25
4.1 Open rate......................................................................................... 25
4.2 Histogram of opens........................................................................ 26
4.3 Opens per email client.................................................................... 27
5 “Click-throughs” tab...................................................................... 29
5.1 Click-through rate in your mailing................................................. 29
5.2 Details about the click-throughs................................................... 30
5.3 Graphical display click-throughs................................................... 32
More information........................................................................... 33
Manual: Mailing report
Introduction
MailPlus is an intuitive and user-friendly email marketing application
that does not require an extensive user manual. We would, however,
also like to extend a hand to those users who would like some
additional background information. Therefore, you will find more
information regarding the structure of the mailing report in this
manual.
An extensive report is available for every sent mailing in the MailPlus
Mailing Manager. This report is the way to measure the performance of
a mailing, and provides a valuable resource for future campaigns. The
mailing report contains all the well-known email marketing metrics,
including “acceptance”, “opens”, “click-throughs”, and the “effectiveness”
of the sent mailing. However, in this report you will also find the
number of “social shares”, the “subscriber retention rate”, the “bounce
rate”, the amount delivered per domain, the graphic representation of
click-throughs, etc. What does all of this mean? The next chapters will
provide the answers.
Before diving into the details of the report, it may be useful to consult
chapter 1 first. In this chapter we will explain the interface, along with a
number of general features of the mailing report.
We aim to cover all the necessary information in this manual. Should
you still have unanswered questions, however, please do not forget to
consult the tooltips and Fast Help. We have provided various FAQs to
help you along.
Manual: Mailing report
1
1
Structure of the mailing report
You can consult a report for every mailing in the MailPlus Mailing
Manager. This chapter describes the structure of this mailing report.
The general information tabs, the preview, the action buttons and the
tabs within the report itself will be discussed.
When you click on the button “View report” in the mailing overview, you
will be directed to the mailing report.
1.1 Mailing overview with the “View report” button
Manual: Mailing report
2
The newly opened page containing the report features a number of
different elements:
1.
2.
3.
4.
General information tab
Preview
Action buttons
Report tabs
1.2 Overview mailing report
1.1
General information tabs
At the top of the mailing report page you will always find a minimum
of two tabs: “Mailing” and “Message”. The “Mailing title” tab will only
appear when the mailing is filed within such a mailing title. A mailing
title is a special feature within the MailPlus Mailing Manager that allows
Manual: Mailing report
3
you to group similar mailings. A mailing title enables you to consult
trend reports and to generate mean rates (for the benchmark)1 .
1.3 General information tabs
“Mailing” tab
The content of this tab is visible by default (see image 1.3). It contains
information regarding the mailing in question, such as the name,
sender, target group, date, and benchmarking. This last attribute
indicates whether the mailing is contained within a mailing title.
“Message” tab
Here you will find information about the message that was sent along
with this mailing. This includes information such as the title of the
message, the author, the subject line, the reply address, view message,
and the archive link.
1.4 “Message” tab with icon
1
You can find more information concerning mailing titles in the Fast Help. To access the Fast Help, first open
the main menu button “Mailing titles”, then click on the Fast Help icon.
Manual: Mailing report
4
An icon is displayed to the right of the archive link. This allows you to
select the archive link. Use this simple and helpful feature to copy and
spread the link to your newsletter.
“Mailing title” tab
Is the attribute “Benchmarking” on the first tab (Mailing) set to “Yes”?
Then a third tab will appear, marked “Mailing title”. This tab features the
name, target, and content type of the mailing title. This data is set when
creating the mailing title.
1.5 “Mailing title” tab
1.2
Preview
A preview of the mailing is displayed to the right of the tabs containing
the general information. This allows you to see right away whether you
have opened the right report.
1.6 Preview
Manual: Mailing report
5
1.3
Action buttons
You can “Share” and “Export” the report of your mailing, and add “Your
conclusions”. To do so, use the action buttons at the top right-hand
corner of the page.
1.7 Action buttons for the report
Next to the action buttons you will find the familiar Fast Help icon. Here
you will find various FAQs that will help answer any questions you may
have.
“Share” action button
When you click on the “Share” button, a pop-up window will open. You
can enter a maximum of three email addresses.
1.8. Mailing the report
Report message
Every email address will receive an email containing a link to the
external report page. This provides an easy way to inform your
colleagues about the performance of your newsletter. The biggest
advantage is that they can view the report without having to log in to
MailPlus.
Manual: Mailing report
6
1.9 Report message
If you are using mailing titles you can also allow MailPlus to send the
report message automatically. While creating a new mailing title (or
editing one afterwards) you can submit one or more email addresses
and select a date and time for delivery. These settings will be used each
time you send a new mailing linked to that mailing title. This way you
can ensure, for instance, that the report is circulated automatically two
weeks after the mailing has been sent. You can find more information
about mailing titles in the MailPlus Fast Help.
Manual: Mailing report
7
The data contained within the report is frozen for the external page
the moment you send the report message (or have the report message
sent automatically). The email and the external page thus contain a
static data set. You can recognize this by the so-called “timestamp” in
the email message and on the page itself. These timestamps have been
circled in images 1.9 and 1.10.
External report page
By clicking on “View full report” in the email message, you or your
colleagues will be directed to the report page. This page features all of
the same charts displayed in MailPlus. For security reasons, however,
the action buttons are missing from this page, and you cannot use the
right mouse button on any of the charts. This is to prevent data from
being viewed or even exported without permission.
1.10 Report page
Manual: Mailing report
8
“Export” action button
In some situations it may be useful to export the opens and clickthroughs collected in the mailing report. To use this data on your
own dashboards, for instance, or to allow an external analysis tool to
carry out its work. By clicking on the action button “Export”, a CSV-file
containing this data will be downloaded.
”Your conclusions” action button
Does your mailing have a high open rate, many hard bounces, or would
you like to mention that the mailing was sent at a different time than
usual? It is always a good idea to note down remarks and conclusions
under the “Your conclusions” section. This way, you and your colleagues
can always access these notes at any point in the future. These
conclusions are also available in the report on the mailing titles within
MailPlus.
1.11 Your conclusions
Manual: Mailing report
9
1.4
Report tabs
Below the block containing the general information you will find
four report tabs. The most important information regarding the
performance of your mailing is listed on the first tab, “Impact”. The
tabs marked “Delivery”, “Opens”, and “Click-throughs” contain the
detail reports. The contents of these tabs will be explained at length in
chapters 2 to 5 of this manual.
1.12 Report tabs
We would like to highlight briefly a number of general features you can
use in every detail report. Four special features are available within the
report: the key figure (1), your average (2), the right mouse click menu
(3) and the shortcut keys (4).
The key figure
In almost every chart a key figure is highlighted in the top right-hand
corner. This way you can gauge the performance of your mailing at a
single glance.
1.13 Table “Subscriber Retention Rate” and the key figure
Manual: Mailing report
10
Your average (benchmark)
Two extra elements will appear in the graphs when a mailing is part of a
mailing title: an average key figure and a graph average. These average
numbers indicate how well or poorly your mailing has performed in
comparison with previous mailings of a similar type. This is your own
benchmark.
Average key figure
If the mailing is collected within a mailing title, an average number
will appear next to the key figure. The label will turn green or red
depending on whether the results are respectively better (or the same),
or worse than your average. In the overview “Subscriber Retention Rate
(SRR)”, shown in picture 1.14, this looks as follows:
1.14 Table “Subscriber Retention Rate (SRR)” with the average key figure.
Average graph
For two graphs (“Impact on your recipients” and “Impact on third
parties”) a button is displayed below, allowing you to switch the
calculation of your benchmark on or off. This way you can examine not
only the average key figures, but also the details of the graph itself.
Should the number of opens your mailing has generated be below
average, for instance, then it may be of use to re-examine the subject
line or at what time the message was sent.
Manual: Mailing report
11
1.15 Graph “Impact on your recipients” with the averages displayed
You can find more information regarding the benchmark and the
mailing titles in the Fast Help of the mailing titles.
Right mouse click menu
As with other modules of MailPlus, the right mouse button can be
used in the report to access extra features. The right mouse menu is
available in data tables.
1.16 Example of a data table with the right mouse menu
The functions listed in the right mouse click menu are “View”,
“Download”, “Make temporary list”, and for the click-through details you
can also “Rename”.
Manual: Mailing report
12
View
Using the “View” option, you can open a pop-up window containing a
list of contacts and their profile information. For example, if you would
like to know who has unsubscribed, you can use this feature to view
a list of your unsubscribed contacts. There are fields at the top of the
pop-up window that can be used to filter and search through this list.
1.17 Pop-up window “View”
Download
Would you also like to download the list of contacts who have
unsubscribed? In that case, use the “Download” function in the right
mouse click menu. You will receive a CSV-file.
Make temporary list
In some cases, it can be useful to save a selection of the target audience
for new mailing activities. For instance, all the readers who have clicked
through via an article about a new service you have recently launched.
Maybe you would like to mail an offer to this specific group of contacts.
By selecting “Make temporary list” in the right mouse click menu, a
temporary list containing this selection of contacts will be prepared for
you in the MailPlus List Manager. You can immediately use this list for
the follow-up mailing.
Manual: Mailing report
13
1.8 Pop-up window “Create temporary list”
Rename
On the click-through details page (see chapter 5), an extra feature is
available in the right mouse click menu: “Rename”.
While creating a trackable link in the email message, a name will be
assigned to the link. This name is also visible in the table (see image
1.19) within the report.
1.19 Table “Click-throughs per link”
If a name was not clearly or efficiently assigned – for instance, 2 links
that are both assigned the name “Website” – then you can change them
afterwards via the right mouse click menu to gain a better analysis.
You could rename them “Website header” and “Website footer”, for
instance.
Manual: Mailing report
14
1.20 Rename link
Shortcut keys
You can also trigger the functions of the right mouse click menu in the
tables using shortcut keys. You can access these functions in two ways:
via CRTL + (1) and via the right mouse click menu + (2).
CTRL +
Hover your mouse over the bar in the data table that you would like to
view, download, create a temporary list of, or for which you would like
to edit the name. The selected bar will change colour.
1.21 Highlighted bar in the data table
Then use your CTRL key and press:
v; to view
d; to download
m; to make a temporary listt
r; to rename
Manual: Mailing report
15
Right mouse click menu +
These shortcut keys are also available via the right mouse click menu.
Instead of pressing the CTRL key, you can right click the bar you wish to
select. The right mouse click menu will appear and you can now press
the “v”, “d”, “m”, or “r” keys to trigger the desired features.
Manual: Mailing report
16
2
“Impact” tab
In the previous chapter we explained the structure of the mailing
report. In the next four chapters we will explain the individual graphs
featured in the report. This chapter will deal with the “Impact” tab.
On this report tab you will find a summary of the most important
information regarding the sent mailing.
Sending a mailing will almost always have an impact on three
components. Therefore, the graphs included under this tab relate to:
1. The impact on your recipients
2. The impact on third parties (viral effect)
3. The impact on your (target group) list
2.1
Impact on your recipients
The first graph under the “Impact” tab indicates the effectiveness of the
sent mailing. The four bars form a funnel that will ultimately determine
the effectiveness of the mailing.
2.1 Funnel “Impact on your recipients”
Manual: Mailing report
17
The percentages displayed between two bars represent a comparison
between those bars. Thus, the delivery rate is determined by comparing
the “Accepted emails” with the “Sent emails”. Next you will find the
click-through rate, which is a comparison between the “Unique clickthroughs” and the “Unique opens”. The effectiveness is finally calculated
by comparing the number of “Unique click-throughs” with the number
of “Sent emails”.
effectiveness
delivery rate
open rate
click-through
rate
2.2 The rates for “Impact on your recipients”
2.2
Impact on third parties
Would you like to know how many times your mailing has been shared?
Consult the bar chart “Impact on third parties”. This diagram illustrates
the number of times recipients have clicked on the social media and
mail-a-friend links in your mailing. This is an important indication
regarding the reach and impact of your mailing on people aside from
your subscribers, and is also known as the “viral effect”.
Manual: Mailing report
18
2.3 Impact on third parties (viral effect)
Why do I only see an emty chart
This chart is displayed as empty for all mailings sent before the
December 2012-R3 release. In the ‘old’ report, data concerning the
social impact was not registered, and will therefore be missing.
2.4 Empty chart
2.3
Impact on your (target group) list
Sending a mailing will also have an impact on your list. Bounces may
be detected when you send a mailing, and some readers may also
unsubscribe. This means your subscriber database will shrink. You will,
of course, want to prevent this from happening in order to preserve
your audience. The “Subscriber Retention Rate (SRR)” will provide an
Manual: Mailing report
19
indication of this impact and allow you to detect any issues. Is this rate
always close to 100%? Then you have nothing to worry about.
2.4 Impact on your (target group) list
Manual: Mailing report
20
3
“Delivery” tab
The previous chapter introduced the “Impact” tab, which contains the
most important report regarding your mailing. The three tabs that
follow (C3, C4, and C5) offer more detailed information. This chapter will
deal with the “Delivery” tab. Here you will find more information about
delivered emails, as well as hard and soft bounces.
3.1
Acceptance ratio
The first item on the tab contains a pie chart and data table detailing
the amount of accepted emails compared to the total number of sent
emails.
3.1 Acceptance ratio
We use the term ‘accepted’ to refer to emails that have been accepted
by the receiving server. That is to say, when you send a mailing via
MailPlus, your email is offered to your readers (recipients). Before such
an email arrives in the reader’s inbox (or another folder) however, the
receiving server must first accept these mails. If the server does not
accept these mails we call this a hard or soft bounce. The receiving
server will communicate this information back to MailPlus.
Manual: Mailing report
21
3.2 Diagram illustrating acceptance and delivery
MailPlus will try to redeliver a bounced mail a number of times. If an
email is not directly accepted, it will run through a so-called “retry
procedure”. This partly explains why your statistics are not instantly
processed directly after sending.
3.2
Accepted emails per domain
A top 15 of the total percentage of accepted emails per domain is
displayed below the “Acceptance rate” overview. Here you will see the
most important domains via which you have reached your readers.
You can use this information to optimize communication. For example,
if you see that a large portion of your total target audience uses a
Hotmail-domain (live, or now Outlook.com) then we would advise you
at least to open your own test account there.
3.3 Percentage accepted emails per domain
Manual: Mailing report
22
3.3
Bounce rate
The emails in the overview shown in image 3.1 that were “not accepted”
are divided into “Hard bounced” and “Soft bounced” emails in the
bounce rate overview.
3.4 Bounce rate
Hard bounced
Emails marked as a hard bounce are not delivered due to reasons that
are permanent. For example, because a non-existent email address was
used. Email addresses that result in a hard bounce are automatically
moved to the inactive database in the List Manager. This means that
when a new mailing is sent, these contacts will no longer be mailed.
Tip: Would you still like to reach your bounced contacts? By clicking
the right mouse button on “Hard bounced” in this data table, you can
export these contacts. Use this list to telephone your contacts, so that
you can restore communication.
Soft bounced
side from a hard bounce, an email may also be registered as
“soft bounced”. In this case, the mail was also not delivered. The
difference between a hard bounce and a soft bounce is that the latter
occurred due to a temporary reason. The recipient’s inbox may be
full, for example, or the mail may not have been delivered due to a
(temporarily) malfunctioning receiving server. These issues may have
been resolved by the time your next mailing occurs. MailPlus will
therefore continue to include a soft bounced email address four more
times in subsequent mailings.
Manual: Mailing report
23
3.4
Email bounces per domain
At the bottom of the “Delivery” tab you will find another top 15. These
are the top 15 email bounces. Has your mailing triggered a large
amount of bounces? If that is the case, it may be helpful to consult this
overview. It is possible that you are encountering a problem with a
specific domain.
3.5 Percentage of email bounces per domain
This top 15 overview illustrates the number of bounced emails in
comparison with the total amount of emails sent to this domain. For
example: Have you sent an email to 500 Hotmail addresses and have
370 of these emails bounced? This will be marked as 74% in the graph.
The top 15 is sorted by the amount sent per domain. In other words,
this overview can tell you whether there is a delivery issue regarding a
domain you frequently send mailings to.
Tip: Explanatory notes about the percentages will appear in this chart
when you hover your mouse over the bars.
Manual: Mailing report
24
4
“Opens” tab
The third tab of the mailing report contains information regarding the
opens generated by your mailing. The details about the open rate, the
histogram of the opens and the subdivision per email client will provide
more insight.
4.1
Open rate
There are two ways to measure the unique open rate of a mailing. In
the first block detailing the open rate, a distinction is made between the
“Open Rate – Confirmed (ORC)” and the “Open Rate – Rendered (ORR)”.
Open rate - Confirmed (ORC)
The opens an email generates are measured by means of an invisible
image. An open is registered in MailPlus as soon as the reader loads
images. Recording an open is thus dependent upon your reader’s
actions. This means that if your recipient reads the mailing without
allowing the images to load, this will not be registered. Should the
reader click on a link however, this will also be registered as an open
in the ORC. In short, an open is confirmed by loading the images or by
clicking on a link.
4.1 Open rate - Confirmed (ORC)
Manual: Mailing report
25
Open rate - Rendered (ORR)
Click-throughs are not taken into account in the “Open Rate - Rendered
(ORR)”. These numbers are purely based on the loading (rendering) of
the images.
4.2 Open rate - Rendered (ORR)
The number displayed after the opens in the data table is the total
number of opens. The ORC and ORR denote unique contacts, yet a
contact may open a mailing more than once. This unfiltered number is
displayed in small type.
4.2
Histogram of opens
Would you like to know when your readers opened your mailing? This is
displayed in histograms covering the first 48 hours and the first week.
The number of opens is marked per hour in the graph.
Manual: Mailing report
26
4.3 Histogram of opens
Tip: You can zoom in and out by clicking and dragging your mouse over
this graph.
4.3
Opens per email client
Are you curious about the email clients your readers use to open your
newsletter? A top 10 is available for every mailing. MailPlus recognizes
several different email clients. For instance, different versions of
Outlook, Apple Mail, Hotmail, Gmail, Thunderbird, Blackberry, etc. This
information is very useful when it comes to optimizing your content,
message, and/or email template. If you have many Hotmail-based
readers, for instance, it may be worth the effort to experiment with
featuring videos in your email messages.
Manual: Mailing report
27
4.4 Bar chart of opens per email client
Why do I see an empty chart?
This chart is displayed as empty for all mailings sent before the
December 2012-R3 release. In the ‘old’ report, data concerning these
email clients was not registered, and will therefore be missing from the
new report.
4.5 Empty chart
Manual: Mailing report
28
5
“Click-throughs” tab
The last tab in the mailing report contains information regarding the
mailing’s click-throughs. The details concerning the click-to-open rate,
the click-throughs per link, and the visual clicks overlay will provide
more insight into the behaviour of your readers. Which content is most
popular? Does this have anything to do with the order in which items
appear in the mailing?
5.1
Click-through rate in your mailing
The percentage of click-throughs is represented in two ways in MailPlus:
as the “Click-To-Open Rate (CTO)” and the “Click-Through Rate (CTR)”.
Clicks-To-Open rate (CTO)
The CTO indicates the amount of unique click-throughs compared to
the number of opened mails. ‘Unique’ means that if a reader clicks on a
link contained within the newsletter three times, this click-through will
only be registered once. This means that multiple clicks by the same
contact are not included. The total number of clicks is displayed in small
type. As you can see, a reader will often click more than once.
5.1 Click-To-Open Rate (CTO)
Manual: Mailing report
29
Click-Through Ratio (CTR)
The CTR does not compare the number of click-throughs with the
number of opened mailings but with the number of accepted mailings.
The click-through percentage will therefore always be lower than that of
the CTO.
5.2 Click-Through Rate (CTR)
5.2
Details about the click-throughs
In this table you will find all your ‘trackable links’. These are the
links that you have marked for tracking in the email message. The
percentage of click-throughs and the number of contacts that have
clicked through are shown per link. You can examine these details “Per
Link” or “Per URL”. The latter option is useful when multiple links refer
to the same page on your website, for instance. You can then sort these
per URL and see how many readers in total have clicked through to the
page in question.
Manual: Mailing report
30
5.3 Details about the click-throughs
Sorting & navigation
The table of click-throughs comes with a number of extra features to
examine the data contained within. You can use the arrows in the top
bar to sort this data.
5.4 Sort data
You can navigate the subsequent pages and select the number of links
displayed (10, 25, 50 or 100) using the options displayed at the bottom
of the table.
5.5 Display options and navigation
Manual: Mailing report
31
5.3
Graphical display click-throughs
In the “Graphical display click-throughs” you will see the click-throughs
represented as they occurred in the actual mailing. The ‘click overlay’
provides an excellent overview of the click-throughs and the ways
in which these may be linked to the layout of the mailing and the
positioning within this layout. Have any click-throughs occurred via the
articles at the bottom of the newsletter? Are articles with images more
popular than those without, or does that not matter much to your
subscribers?
5.6 Graphical display of click-throughs
Using the slider (circled in the above image) you can view the top 5,
top 10, or all links in the graphic representation. Is the width of your
message greater than the image, or would you simply like a less
crowded display? You can maximize the display by using the button
indicated in the top right-hand corner of the screen.
Manual: Mailing report
32
More information?
This manual describes practically all of the features of the mailing
report. Should you still have any questions however, please do not
forget to consult the tooltips and the Fast Help. Here you will find FAQs
that can help you along.
MailPlus Tooltip and Fast Help
Manual: Mailing report
33