1
M5PrimeLab
M5' regression tree, model tree, and tree ensemble toolbox for
Matlab/Octave
ver. 1.4.1
Gints Jekabsons
http://www.cs.rtu.lv/jekabsons/
User's manual
November, 2015
Copyright © 2010-2015 Gints Jekabsons
CONTENTS
1. INTRODUCTION..........................................................................................................................3
2. AVAILABLE FUNCTIONS..........................................................................................................4
2.1. Function m5pbuild.................................................................................................................4
2.2. Function m5pparams...............................................................................................................6
2.3. Function m5pparamsensemble...............................................................................................7
2.4. Function m5ppredict.............................................................................................................9
2.5. Function m5ptest...................................................................................................................9
2.6. Function m5pcv.....................................................................................................................10
2.7. Function m5pout...................................................................................................................11
3. EXAMPLES OF USAGE.............................................................................................................12
3.1. Growing regression trees, model trees, and decision rules...................................................12
3.2. Growing ensembles of trees..................................................................................................15
4. REFERENCES.............................................................................................................................19
2
1. INTRODUCTION
What is M5PrimeLab
M5PrimeLab is a Matlab/Octave toolbox for building regression trees and model trees using
M5' method (Wang & Witten, 1997; Quinlan, 1992) as well as building ensembles of M5' trees
using Bagging (Breiman, 1996), Random Forests (Breiman, 2001; Breiman, 2002), and Extremely
Randomized Trees (also known as Extra-Trees) (Geurts et al., 2006). The built trees can also be
linearized into decision rules either directly or using the M5'Rules method (Holmes et al., 1999).
With this toolbox you can build trees and decision rules either individually or in ensembles and
test them on separate test sets or using Cross-Validation, use them for prediction, assess variable
importance, as well as print and plot the structure. M5PrimeLab accepts input variables to be
continuous, binary, and categorical, as well as manages missing values.
Note that regardless of which ensembling algorithm one chooses, M5PrimeLab builds the
individual trees according to the M5' method, i.e., usage of the Standard Deviation Reduction
criterion as well as how the categorical input variables are dealt with and other details specific to
the method are not reconfigurable. Also see the note on Extra-Trees below.
This user's manual provides overview of the functions available in the M5PrimeLab.
M5PrimeLab can be downloaded at http://www.cs.rtu.lv/jekabsons/.
The toolbox code is licensed under the GNU GPL ver. 3 or any later version.
A note on Extremely Randomized Trees implementation in M5PrimeLab
The current implementation of Extra-Trees in M5PrimeLab deals with categorical variables
with more than two categories differently from how the standard Extra-Trees method does it.
In standard Extra-Trees (Geurts et al., 2006), if a categorical variable is chosen for splitting, two
random subsets of categories are drawn – one from the list of categories that reached the node and
the other from the list that did not reach the node. The splitting point is then the union of those two
subsets versus all the other categories.
In the M5PrimeLab implementation of Extra-Trees, such categorical variables are automatically
replaced with synthetic binary variables in accordance with the M5' method before any building of
trees is even started. The number of the synthetic binary variables is equal to the number of
categories minus one. If such a categorical variable is chosen for splitting, the splitting point is then
defined using one of those synthetic binary variables, chosen randomly.
The more such categorical variables are in the data, the potentially more different the results
from the standard Extra-Trees.
However, note that continuous and binary variables are dealt with exactly in the same way as in
standard Extra-Trees.
Feedback
For any feedback on the toolbox including bug reports feel free to contact me via the email
address given on the title page of this user's manual.
Citing the M5PrimeLab toolbox
Jekabsons G., M5PrimeLab: M5' regression tree, model tree, and tree ensemble toolbox for
Matlab/Octave, 2015, available at http://www.cs.rtu.lv/jekabsons/
3
2. AVAILABLE FUNCTIONS
M5PrimeLab toolbox provides the following list of functions:
m5pbuild – builds M5' regression tree, model tree, or ensemble of trees; the trees can also
be linearized into decision rules;
m5pparams – creates configuration for building M5' trees;
m5pparamsensemble – creates configuration for building ensembles of trees;
m5ppredict – makes predictions using M5' tree or ensemble of trees;
m5ptest – tests M5' tree or ensemble of trees on a test data set;
m5pcv – tests M5' performance using Cross-Validation;
m5pout – prints or plots M5' tree in a human-readable form.
2.1. Function m5pbuild
Purpose:
Builds M5' regression tree, model tree, or ensemble of trees.
The trees can also be linearized into decision rules.
Call:
[model, time, ensembleResults] = m5pbuild(Xtr, Ytr, trainParams, isBinCat,
trainParamsEnsemble, keepInteriorModels, verbose)
All the input arguments, except the first two, are optional. Empty values are also accepted (the
corresponding default values will be used).
Input:
: Xtr is a matrix with rows corresponding to observations and columns
corresponding to input variables. Ytr is a column vector of response values.
Input variables can be continuous, binary, as well as categorical (indicate
using isBinCat). All values must be numeric. Categorical variables with
more than two categories will be automatically replaced with synthetic
binary variables (in accordance with the M5' method). Missing values in
Xtr must be indicated as NaN.
trainParams
: A structure of training parameters for the algorithm. If not provided,
default values will be used (see function m5pparams for details).
isBinCat
: A vector of flags indicating type of each input variable – either continuous
(false) or categorical (true) with any number of categories, including
binary. The vector should be of the same length as the number of columns
in Xtr. m5pbuild then detects all the actually possible values for
categorical variables from the training data. Any new values detected later,
i.e., during prediction, will be treated as NaN. By default, the vector is
created with all values equal to false, meaning that all the variables are
treated as continuous.
trainParamsEnsemble : A structure of parameters for building ensemble of trees. If not
provided, a single tree is built. See function m5pparamsensemble for
details. This can also be useful for variable importance assessment. See
user's manual for examples of usage.
Note that the ensemble building algorithm employs random number
generator for which you can set seed before calling m5pbuild.
Xtr, Ytr
4
: Whether to keep models (in case of model trees) and output values (in
case of regression trees) in interior nodes of trees. These can be useful for
custom analysis or printing/plotting of the trees. Default value = false, i.e.,
the information is removed from the trees so that the structure takes up less
memory. Note that for smoothed trees this argument is always forced to
false regardless of user's choice.
: Whether to output additional information to console. (default value =
true)
keepInteriorModels
verbose
Output:
model
binCat
trainParams
: A single M5' tree (or a decision rule set) or a cell array of M5' trees (or
decision rule sets) if an ensemble is built. A structure defining one tree (or a
decision rule set) has the following fields:
: Information regarding original (continuous / binary / categorical) input
variables, transformed (synthetic binary) input variables, possible values
for categorical input variables and other information.
: A structure of training parameters for the algorithm (updated if any values
are chosen automatically).
tree, rules, outcomes, outcomesCoefs, outcomesAttrIdx, outcomesAttrAvg,
outcomesNumCases : Structures and arrays defining either the built tree or
the generated decision rules.
: Algorithm execution time (in seconds).
: A structure of results for ensembles of trees or decision rules. Not
available for Extra-Trees. The structure has the following fields:
OOBError
: Out-of-bag estimate of prediction Mean Squared Error of the ensemble
after each new tree is built. The number of rows is equal to the number of
trees built. OOBError is available only if getOOBError in
trainParamsEnsemble is set to true.
OOBNum
: Number of times observations were out-of-bag (and thus used in
computing OOBError). The length of OOBNum is equal to the number of
rows in Xtr and Ytr. OOBNum is available only if getOOBError in
trainParamsEnsemble is set to true.
varImportance : Variable importance assessment. Calculated when out-of-bag data of a
variable is permuted. A matrix with four rows and as many columns as
there are columns in Xtr. First row is the average increase of out-of-bag
Mean Absolute Error (MAE), second row is standard deviation of the
average increase of MAE, third row is the average increase of out-of-bag
Mean Squared Error (MSE), fourth row is standard deviation of the average
increase of MSE. The final variable importance estimate is often calculated
by dividing each MAE or MSE by the corresponding standard deviation.
Bigger values then indicate bigger importance of the corresponding
variable. See user's manual for example of usage. varImportance is
available only if getVarImportance in trainParamsEnsemble is > 0.
time
ensembleResults
Remarks:
M5' method builds a tree in two phases: growing phase and pruning phase. In the first phase the
algorithm starts with one leaf node and recursively tries to split each leaf node so that intra -subset
variation in the output variable’s values down each branch is minimized (i.e., Standard Deviation
Reduction (SDR) is maximized).
At the end of the first phase we have a large tree that typically overfits the data, and so a
pruning phase is engaged. In this phase, the tree is pruned back from each leaf until an estimate of
the expected error that will be experienced at each node cannot be reduced any further.
5
Finally, the tree is smoothed (optionally). In M5PrimeLab, smoothing is done in m5pbuild,
right after the pruning phase (instead of doing it only at the moment of prediction, i.e., in
m5ppredict), by incorporating regression models of the interior nodes into regression models of
each leaf. Smoothing can substantially increase accuracy of predictions but it also makes the trees
more difficult to interpret, as smoothed trees have more complex models at their leaves (that can
even look as if dropping of terms never occurred).
2.2. Function m5pparams
Purpose:
Creates configuration for building M5' trees or decision rules. The output structure is for further
use with m5pbuild and m5pcv functions.
Call:
trainParams
=
m5pparams(modelTree,
minLeafSize,
minParentSize,
smoothingK, splitThreshold, aggressivePruning, extractRules)
prune,
All the input arguments of this function are optional. Empty values are also accepted (the
corresponding default values will be used).
It is quite possible that the default values for minLeafSize, minParentSize, smoothingK, and
aggressivePruning will be far from optimal for your data.
For a typical configuration of ensembles of regression trees (whether Bagging, Random Forests,
or Extra-Trees), call trainParams = m5pparams(false, 1, 5, false, 0, 1E-6);
Input:
modelTree
minLeafSize
minParentSize
prune
smoothingK
: Whether to build a model tree (true) or a regression tree (false) (default
value = true). Model trees combine a conventional regression tree with the
possibility of linear regression functions at the leaves. However, note that
whether a leaf node actually contains more than just a constant depends on
pruning and smoothing (if both are disabled, a model tree will not differ
from a regression tree).
: The minimum number of training observations a leaf node may represent.
If prune = true, values lower than 2 are not allowed. Otherwise, minimum
is 1. Default value = 2 (Wang & Witten, 1997). If built trees contain too
many too small leaves (especially in the top layers of the tree), consider
increasing this number. This will also result in smaller trees that are less
sensitive to noise (but can also be underfitted).
: The minimum number of observations a node must have to be considered
for splitting, i.e., the minimum number of training observations an interior
node may represent. Default value = minLeafSize × 2 (Wang & Witten,
1997). Values lower than that are not allowed. If built trees are too large or
overfit the data, consider increasing this number – this will result in smaller
trees that are less sensitive to noise (but can also be underfitted). For
ensembles of unpruned trees, the typical value is 5 (with
minLeafSize = 1).
: Whether to prune the tree. (default value = true). Pruning is done by
eliminating leaves and subtrees in regression trees and model trees as well
as eliminating terms in models of model trees (using sequential backward
selection algorithm) if doing so improves the estimated error.
: Smoothing parameter. Set to 0 to disable smoothing. Default value = 15
(Quinlan, 1992; Wang & Witten, 1997). Smoothing is usually not
6
recommended for regression trees but can be useful for model trees. It tries
to compensate for sharp discontinuities occurring between adjacent nodes
of the tree. The larger the value compared to the number of observations
reaching the nodes, the more pronounced is the smoothing. In case studies
by Quinlan, 1992, as well as Wang & Witten, 1997, this almost always had
a positive effect on model trees. Smoothing is performed after building and
pruning, therefore this parameter does not influence those processes.
Unfortunately, smoothed trees are harder to interpret.
splitThreshold
: A node is not split if the standard deviation of the values of output
variable at the node is less than splitThreshold of the standard deviation
of response variable for the entire training data (default value = 0.05 (i.e.,
5%) (Wang & Witten, 1997)). The results are usually not very sensitive to
the exact choice of the threshold (Wang & Witten, 1997).
aggressivePruning : By default, pruning is done as proposed by Quinlan, 1992, and Wang &
Witten, 1997, but you can also employ more aggressive pruning, the one
that is implemented in Weka's version of M5' (Hall et al., 2009). Simply
put, in the aggressive pruning version, while estimating error of a subtree,
one penalizes not only the number of parameters of regression models at its
leaves but also its total number of splits. Aggressive pruning produces
smaller trees that are less sensitive to noise and, because of their small size,
are also easier to interpret. However, this can also result in underfitting.
(default value = false)
extractRules
: M5' trees can also be used for generating decision rules. M5PrimeLab
provides two methods for doing it. Set extractRules = 1 to extract rules
from one tree directly. Each leaf is made into a rule by making a
conjunction of all the tests encountered on the path from the root to that
leaf. This produces rules that are unambiguous in that it doesn’t matter in
what order they are executed. The rule set always makes exactly the same
predictions as the original tree, even with unknown values and smoothing.
Set extractRules = 2 to use the M5'Rules method (Holmes et al., 1999).
With this method, the rules are generated iteratively. In each iteration, a
new tree is built using the training data and one leaf that has the largest data
coverage is made into a rule. Then the tree is discarded and all observations
covered by the rule are removed from the data. The process is repeated
until the data is empty. M5'Rules produces smaller rule sets than the simple
extraction method, however it cannot use the M5' smoothing technique
(parameter smoothingK is ignored).
(default value = 0, i.e., no rules are extracted)
Output:
trainParams
: A structure of parameters for further use with m5pbuild and m5pcv
functions containing the provided values (or default ones, if not provided).
2.3. Function m5pparamsensemble
Purpose:
Creates configuration for building ensembles of M5' trees using Bagging, Random Forests, or
Extra-Trees. The output structure is for further use with m5pbuild and m5pcv functions.
Call:
7
trainParamsEnsemble
=
withReplacement,
inBagFraction,
verboseNumIter)
m5pparamsensemble(numTrees,
numVarsTry,
extraTrees,
getOOBError,
getVarImportance,
All the input arguments of this function are optional. Empty values are also accepted (the
corresponding default values will be used). The first five arguments control the behaviour of the
ensemble building method. The last three arguments enable getting additional information.
The default values are prepared for building Random Forests. Changes required for a Bagging
configuration: numVarsTry = 0. Changes required for a typical Extra-Trees configuration:
numVarsTry = 0, extraTrees = true.
Remember to configure how individual trees are built for the ensemble (see description of
m5pparams). See Section 3.2 for examples of usage.
Input:
: Number of trees to build (default value = 100). Should be set so that every
data observation gets predicted at least a few times.
numVarsTry
: Number of input variables randomly sampled as candidates at each split in
a tree. Set to -1 (default) to automatically sample one third of the variables
(typical for Random Forests in regression). Set to 0 to use all variables
(typical for Bagging and Extra-Trees in regression). Set to a positive
integer if you want some other number of variables to sample. To select a
good value for numVarsTry in Random Forests, Leo Breiman suggests
trying the default value and trying a value twice as high and half as low
(Breiman, 2002).
In Extra-Trees, this parameter is also called attribute selection strength
(Geurts et al., 2006).
Note that while using this parameter, function m5pbuild takes the total
number of input variables directly from supplied training data set, before
synthetic binary variables are made, if any.
withReplacement : Should sampling of in-bag observations for each tree be done with ( true)
or without (false) replacement? Both, Bagging and Random Forests
typically use sampling with replacement. (default value = true)
inBagFraction
: The fraction of the total number of observations to be sampled for in-bag
set. Default value = 1, i.e., the in-bag set will be the same size as the
original data set. This is the typical setting for both, Bagging and Random
Forests. Note that for sampling without replacement inBagFraction
should be lower than 1 so that out-of-bag set is not empty.
extraTrees
: Set to true to build Extra-Trees (default = false). If enabled, parameters
withReplacement,
inBagFraction,
getOOBError,
and
getVarImportance are ignored. This is because Extra-Trees method does
not use out-of-bag data, i.e., all trees are build using the whole available
training data set.
getOOBError
: Whether to perform out-of-bag error calculation to estimate prediction
error of the ensemble (default value = true). Disable for speed.
getVarImportance : Whether to assess importance of input variables (by calculating the
average increase in error when out-of-bag data of a variable is permuted)
and how many times the data is permuted per tree for the assessment.
Default value = 1. Set to 0 to disable and gain some speed. Numbers larger
than 1 can give slightly more stable estimate, but the process is even
slower.
verboseNumIter
: Set to some positive integer to print progress every verboseNumIter
trees. Set to 0 to disable. (default value = 50)
numTrees
8
Output:
: A structure of parameters for further use with m5pbuild and m5pcv
functions containing the provided values (or default ones, if not provided).
trainParamsEnsemble
Remarks:
See the note in Section 1 on the most important difference between the implementation of
Extra-Trees in M5PrimeLab and standard Extra-Trees.
2.4. Function m5ppredict
Purpose:
Predicts response values for the given query points Xq using M5' tree or ensemble of trees.
Call:
Yq = m5ppredict(model, Xq)
Input:
model
Xq
: M5' model or a cell array of M5' models, if ensemble of trees is to be
used.
: A matrix of query data points. Missing values in Xq must be indicated as
NaN.
Output:
Yq
: A column vector of predicted response values. If model is an ensemble, Yq
is a matrix whose rows correspond to Xq rows (i.e., observations) and
columns correspond to each ensemble size (i.e., the increasing number of
trees), the values in the very last column being the values for a full
ensemble.
Remarks:
1. If the data contains categorical variables with more than two categories, they are
transformed in a number of synthetic binary variables in exactly the same way as m5pbuild
does it.
2. Any previously unseen values of binary or categorical variables are treated as NaN.
2.5. Function m5ptest
Purpose:
Tests M5' tree or ensemble of trees on a test data set (Xtst, Ytst).
Call:
results = m5ptest(model, Xtst, Ytst)
Input:
model
Xtst, Ytst
: M5' model or a cell array of M5' models (if ensemble of trees is to be
tested).
: Xtst is a matrix with rows corresponding to testing observations, and
columns to corresponding input variables. Ytst is a column vector of
response values. Missing values in Xtst must be indicated as NaN.
9
Output:
results
MAE
MSE
RMSE
RRMSE
R2
: A structure of different error measures calculated on the test data set. The
structure has the following fields (if the model is an ensemble, the fields are
column vectors with one (cumulative) value for each ensemble size, the
very last value being error for a full ensemble):
: Mean Absolute Error.
: Mean Squared Error.
: Root Mean Squared Error.
: Relative Root Mean Squared Error.
: Coefficient of Determination.
2.6. Function m5pcv
Purpose:
Tests M5' performance using k-fold Cross-Validation.
Call:
[results, residuals] = m5pcv(X, Y, trainParams, isBinCat, k, shuffle, nCross,
trainParamsEnsemble, verbose)
All the input arguments, except the first two, are optional. Empty values are also accepted (the
corresponding default values will be used).
For more stable results, call m5pcv a few times and average the results.
Note that, if parameter shuffle is set to true, this function employs random number generator
for which you can set seed before calling the function.
Input:
: Observations. Missing values in X must be indicated as NaN. (see function
m5pbuild for details)
trainParams
: A structure of training parameters. If not provided, default values will be
used (see function m5pparams for details).
isBinCat
: See description for function m5pbuild.
k
: Value of k for k-fold Cross-Validation. The typical values are 5 or 10. For
Leave-One-Out Cross-Validation set k equal to n. (default value = 10)
shuffle
: Whether to shuffle the order of observations before performing CrossValidation. (default value = true)
nCross
: How many times to repeat Cross-Validation with different data
partitioning. This can be used to get more stable results. Default value = 1,
i.e., no repetition. Useless if shuffle = false.
trainParamsEnsemble : A structure of parameters for building ensembles of trees. If not
provided, a single tree is built. See function m5pparamsensemble for
details.
verbose
: Whether to output additional information to console. (default
value = true)
X, Y
Output:
resultsTotal
: A structure of results averaged over Cross-Validation folds. For tree
ensembles, the structure contains fields that are column vectors with one
value for each ensemble size, the very last value being value for a full
ensemble.
10
: A structure of row vectors of results for each Cross-Validation fold. For
tree ensembles, the structure contains matrices whose rows correspond to
Cross-Validation folds while columns correspond to each ensemble size,
the very last value being a value for a full ensemble.
Both structures have the following fields:
MAE
: Mean Absolute Error.
MSE
: Mean Squared Error.
RMSE
: Root Mean Squared Error.
RRMSE
: Relative Root Mean Squared Error. Not reported for Leave-One-Out
Cross-Validation.
R2
: Coefficient of Determination. Not reported for Leave-One-Out CrossValidation.
nRules
: Number of rules in tree. For ensembles of trees, this field is omitted.
nVars
: Number of input variables included in tree. This counts original variables
(not synthetic ones that are automatically made). For ensembles of trees,
this field is omitted.
resultsFolds
2.7. Function m5pout
Purpose:
Prints or plots M5' tree in a human-readable form. Does not work with ensembles.
Call:
m5pout(model, showNumCases, precision, plotTree, plotFontSize, dealWithNaN)
All the input arguments, except the first one, are optional. Empty values are also accepted (the
corresponding default values will be used).
Input:
model
showNumCases
precision
plotTree
plotFontSize
dealWithNaN
: M5' model.
: Whether to show the number of training observations corresponding to
each leaf (default value = true).
: Number of digits in the regression model coefficients, split values etc.
(default value = 15)
: Whether to plot the tree instead of printing it (default value = false). In
the plotted tree, left child of a node corresponds to outcome 'true' and right
child to 'false'. This argument is ignored if model contains decision rules.
: Font size for text in the plot (default value = 10). This argument is ignored
if plotTree = false or model contains decision rules.
: Whether to display how the tree deals with missing values ( NaN, displayed
as '?'). (default value = false)
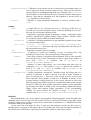
Remarks:
1. For smoothed trees, the smoothing process is already done in m5pbuild, therefore if you
want to see unsmoothed versions (which are usually easier to interpret) you should build
trees with smoothing disabled.
2. If the training data has categorical variables with more than two categories, the
corresponding synthetic binary variables are shown.
11
3. EXAMPLES OF USAGE
3.1. Growing regression trees, model trees, and decision rules
We start by creating a dataset using a three-dimensional function with one continuous variable,
one binary variable, and one categorical variable with four categories. The data consists of
randomly uniformly distributed 100 observations.
X = [rand(100,1) rand(100,1)<0.5 floor(rand(100,1)*4)];
Y = X(:,1).*(X(:,3)==0) + X(:,2).*(X(:,3)==1) - ...
2*X(:,1).*(X(:,3)==2) + 3*(X(:,3)==3) + 0.02*randn(100,1);
First let's try to grow a model tree. We will turn off smoothing because our data has sharp
discontinuities and we don't want to loose them. All the other parameters will be left to their
defaults. We will supply isBinCat vector indicating that the first input variable is continuous, the
second is binary, and the third is categorical with four categories (detected automatically). M5' tree
is grown by calling m5pbuild.
params = m5pparams(true, [], [], [], 0);
model = m5pbuild(X, Y, params, [false true true]);
As the growing process ends, we can examine the structure of the grown tree using function
First we see synthetic variables (automatically made if the data contains at least one
categorical variable with more than two categories) and then the tree itself. Each leaf of a model
tree contains either a constant or a linear regression model. Number of training data observations for
each leaf is shown in parentheses.
m5pout.
m5pout(model, true, 5);
Synthetic variables:
z1 = x1
z2 = x2
z3 = 1, if x3 is in {0, 1, 3} else = 0
z4 = 1, if x3 is in {1, 3} else = 0
z5 = 1, if x3 is in {3} else = 0
The tree:
if z5 == 0
if z3 == 0
y = -0.0039976 -2.0036*z1 (28)
else
if z2 == 0
if z4 == 0
y = -0.0055303 +1.0162*z1 (9)
else
y = -0.0012792 (15)
else
if z4 == 0
y = -0.0083598 +1.0228*z1 (10)
else
y = 1.0004 (14)
else
y = 2.9962 (24)
Number of rules: 6
Number of original input variables used: 3 (x1, x2, x3)
If the tree is too large or overfits, consider increasing minLeafSize and/or minParentSize or
setting aggressivePruning to true. You can use function m5pcv to test different configurations.
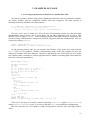
Now let’s plot the tree. Left child of a node corresponds to outcome 'true' and right child to
'false'.
12
m5pout(model, true, 5, true)
We can evaluate performance of this M5' configuration on the data using 10-fold CrossValidation. This is done using function m5pcv. Note that for more stable results one should consider
repeating Cross-Validation several times (see description of the argument nCross for function
m5pcv).
rng(1);
results = m5pcv(X, Y, params, [false true true])
results =
MAE:
MSE:
RMSE:
RRMSE:
R2:
nRules:
nVars:
0.0175
5.7272e-04
0.0226
0.0178
0.9996
6.1000
3
Let’s try doing the same but instead of model tree we will grow a regression tree. In a regression
tree each leaf predicts the output using just a simple constant.
params = m5pparams(false, [], [], [], 0);
model = m5pbuild(X, Y, params, [false true true]);
m5pout(model, true, 5);
Synthetic variables:
z1 = x1
z2 = x2
z3 = 1, if x3 is in {0, 1, 3} else = 0
z4 = 1, if x3 is in {1, 3} else = 0
z5 = 1, if x3 is in {3} else = 0
The tree:
if z5 == 0
if z3 == 0
if z1 <= 0.54819
if z1 <= 0.24359
if z1 <= 0.16427
y = -0.14619 (2)
else
y = -0.41656 (2)
else
if z1 <= 0.3558
y = -0.6216 (5)
else
y = -0.83133 (4)
else
if z1 <= 0.77846
13
if z1 <= 0.68792
y = -1.2857 (5)
else
y = -1.4471 (3)
else
if z1 <= 0.89632
y = -1.685 (4)
else
y = -1.9157 (3)
else
if z2 == 0
if z4 == 0
if z1 <= 0.74506
y = 0.44942 (6)
else
y = 0.91532 (3)
else
y = -0.0012792 (15)
else
if z4 == 0
if z1 <= 0.47721
if z1 <= 0.097205
y = 0.031616 (2)
else
y = 0.18881 (6)
else
y = 0.79682 (2)
else
y = 1.0004 (14)
else
y = 2.9962 (24)
Number of rules: 16
Number of original input variables used: 3 (x1, x2, x3)
rng(1);
results = m5pcv(X, Y, params, [false true true])
results =
MAE:
MSE:
RMSE:
RRMSE:
R2:
nRules:
nVars:
0.0754
0.0178
0.1233
0.1029
0.9842
14.9000
3
Next, let's try generating decision rules from M5' model trees using the M5'Rules method. This
is an iterative method. In each iteration it grows a tree, selects the rule that covers the most data
observations, discards the tree, and removes all observations from the data that were covered by the
selected rule. The method is slower than the direct rule extraction method but it usually produces
fewer rules.
params = m5pparams(true, [], [], [], 0, [], [], 2);
model = m5pbuild(X, Y, params, [false true true]);
m5pout(model, true, 5);
Synthetic variables:
z1 = x1
z2 = x2
z3 = 1, if x3 is in {0, 1, 3} else = 0
z4 = 1, if x3 is in {1, 3} else = 0
z5 = 1, if x3 is in {3} else = 0
The decision rules:
if z5 == 0 and z3 == 0 then y = -0.0039976 -2.0036*z1 (28)
if z5 == 1 then y = 2.9962 (24)
if z2 == 0 and z4 == 1 then y = -0.0012792 (15)
if z4 == 0 then y = -0.0074507 +1.0195*z1 (19)
y = 1.0004 (14)
14
Number of rules: 5
Number of original input variables used: 3 (x1, x2, x3)
These decision rules actually perfectly capture the function that generated our dataset.
Let's evaluate performance of this M5'Rules configuration on the data using 10-fold CrossValidation.
rng(1);
results = m5pcv(X, Y, params, [false true true])
results =
MAE:
MSE:
RMSE:
RRMSE:
R2:
nRules:
nVars:
0.0161
3.9249e-04
0.0196
0.0156
0.9997
5
3
We can see that for our dataset on average this method produces fewer rules than there were in
model trees above while the predictive performance got even a little better.
3.2. Growing ensembles of trees
For this example we will use Housing dataset available at the UCI repository
(http://archive.ics.uci.edu/ml/). The data has 506 observations and 13 input variables. One input
variable is binary, all others are continuous.
We will grow a Random Forest for this data.
First, we must create a configuration for growing individual trees in the ensemble. We will
create a typical configuration for ensembles of regression trees: the minimum number of
observations a node must have to be considered for splitting will be 5, the minimum number of
training observations a leaf node may represent will be 1, the trees will not be pruned, no smoothing
will be applied, and we will set splitThreshold equal to 1E-6.
params = m5pparams(false, 1, 5, false, 0, 1E-6);
Next, we must create a configuration for growing the ensemble. This is done using function
The default parameters in this function are already prepared to grow Random
Forests but let's try to find a better value for numVarsTry (this is the number of input variables
randomly sampled as candidates at each split while growing a tree). By default the value is -1 which
means that m5pbuild will automatically set it to one third of the number of input variables (typical
for Random Forests in regression problems). For our data, the value is floor(13 / 3) = 4. But let's try
also a value twice as high and half as low (as suggested by Breiman, 2002) as well as all variables
(which is the value for Bagging), i.e., 2, 4, 8, and 13. For faster processing, we will grow only 50
trees. Later, when the “best” value is found, we will grow a bigger ensemble.
We will also enable getOOBError because we need out-of-bag error estimates and disable
getVarImportance because we don't yet need variable importance estimates.
An ensemble is grown by calling m5pbuild. We will supply isBinCat vector indicating that
one variable is binary and the rest are continuous. By supplying the fifth argument
(paramsEnsemble) we indicate that an ensemble should be created instead of just one tree.
m5pparamsensemble.
15
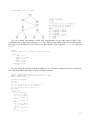
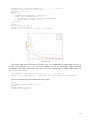
paramsEnsemble = m5pparamsensemble(50, [], [], [], [], true, 0);
isBinCat = [false(1,3) true false(1,9)];
numVarsTry = [2 4 8 13];
figure;
for i = 1:4
paramsEnsemble.numVarsTry = numVarsTry(i);
[model, time, ensembleResults] = ...
m5pbuild(X, Y, params, isBinCat, paramsEnsemble);
plot(ensembleResults.OOBError(:,1));
hold on;
end
grid on;
xlabel('Number of trees');
ylabel('Out-of-bag MSE');
legend({'2' '4' '8' '13'}, 'Location', 'NorthEast');
We can see that curves for values 4, 8, and 13 are very similar and are better than curve for 2.
So let's say we choose numVarsTry to be the default, 4. Now we will build a larger ensemble
consisting of 200 trees and, while we're at it, use it to estimate input variable importance (set
getVarImportance to 1).
paramsEnsemble = m5pparamsensemble(200, [], [], [], [], true, 1);
[model, time, ensembleResults] = m5pbuild(X, Y, params, isBinCat, paramsEnsemble);
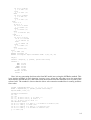
Now we can inspect the out-of-bag error curve again.
figure;
plot(ensembleResults.OOBError(:,1));
grid on;
xlabel('Number of trees');
ylabel('Out-of-bag MSE');
16
We can see that the prediction error estimate becomes quite stable. The values in last row of
show us that the ensemble of 200 trees estimates its prediction error
to be MSE = 9.8.
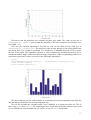
Now let's plot variable importances. For that we will use the third and the forth row of
ensembleResults.varImportance. The third row is the average increase of out-of-bag MSE when
out-of-bag data of a variable is permuted. The fourth row is standard deviation of the average
increase of the MSE. The importance estimate is often calculated by dividing the increase by its
standard deviation. Bigger values then indicate bigger importance of the corresponding variable (we
could also express these values as percent of the maximum importance).
ensembleResults.OOBError
figure;
bar(ensembleResults.varImportance(3,:) ./ ensembleResults.varImportance(4,:));
xlabel('Variable number');
ylabel('Variable importance');
We can see that the 6th and 13th variables are estimated to be the most important ones while the
2nd and 4th are estimated to be the least important ones.
We can also evaluate the ensemble using Cross-Validation or a separate test data set. This is
done using m5pcv and m5ptest. The output arguments of both these functions contain vectors with
errors calculated at each ensemble size (as well as, in case of m5pcv, at each fold).
17
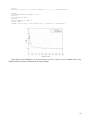
rng(1);
resultsCV = m5pcv(X, Y, params, isBinCat, 10, [], [], paramsEnsemble);
figure;
plot(ensembleResults.OOBError(:,1));
hold on;
plot(resultsCV.MSE);
grid on;
xlabel('Number of trees');
ylabel('MSE');
legend({'Out-of-bag' 'Cross-Validation'}, 'Location', 'NorthEast');
After doing Cross-Validation, we can see that in our case it gives us error estimate that is very
similar to the previously calculated out-of-bag estimate.
18
4. REFERENCES
1. Breiman L. Bagging predictors. Machine Learning 24 (2), 1996, pp. 123-140.
2. Breiman L. Random forests. Machine Learning, 45 (1), 2001, pp. 5-32.
3. Breiman L. Manual on setting up, using, and understanding random forests v4.0. Statistics
Department University of California Berkeley, CA, USA, 2002
4. Geurts P., Ernst D., Wehenkel L. Extremely randomized trees. Machine Learning 63 (1), 2006,
pp. 3-42.
5. Hall M., Frank E., Holmes G., Pfahringer B., Reutemann P., Witten I.H. The WEKA data
mining software: an update, SIGKDD Explorations, 11 (1), 2009
6. Holmes G., Hall M., Frank E. Generating rule sets from model trees. 12th Australian Joint
Conference on Artificial Intelligence, 1999, pp. 1-12.
7. Quinlan J.R. Learning with continuous classes. Proceedings of 5th Australian Joint Conference
on Artificial Intelligence, World Scientific, Singapore, 1992, pp. 343-348.
8. Wang Y. & Witten I.H. Induction of model trees for predicting continuous classes. Proceedings
of the 9th European Conference on Machine Learning Poster Papers, Prague, 1997, pp. 128-137.
19