1
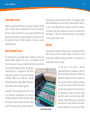
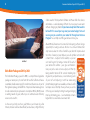
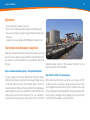
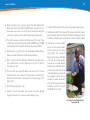
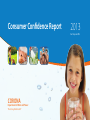
Consumer Confidence Report
2013
For the year 2012
Corona
Department of Water and Power
“Protecting Public Health”
2
Consumer Confidence Report 2013 (for year 2012)
Message from the General Manager
T
he Department of Water and Power provides our
customers with water that meets or exceeds the
standards set by State and Federal Law. This report lists the
types and amounts of key elements in your water supply, their
likely sources and the maximum contaminant level (MCL) that
the United States Environmental Protection Agency considers
safe. We utilize a multi-barrier treatment process to assure safe
drinking water is delivered to your home or place of business.
The Department of Water and Power’s mission is to “Protect Public Health;” we work
diligently to provide you with the highest quality product and service. We are proud to
provide our annual report to you. Information contained in this annual report includes
required statistics and information on water quality, provided to our customers in order
to help them make informed choices about the water they drink. This report not only
reflects our ability to meet health standards, it also demonstrates our commitment to
you that we will always provide you with the best that we can offer.
In addition to required elements, the report provides an opportunity for the Department
of Water and Power to share information with our customers about our operations,
accomplishments and future. Over the past year, we have completed $20 million in
projects, launched a new public website – www.CoronaDWP.org, completed two
major expansions of our reclaimed water system, installed a demonstration garden of
water-wise plants at City Hall, began the update of our water master plan, and obtained
$1.65 million in grant funds for future projects. Looking forward,
this year we will see the groundbreaking on a new reservoir, to
enhance water supply reliability, reduce energy use and provide
enhanced fire flow protection; continued planning efforts for
groundwater recharge and use of reclaimed water; and the
implementation of a major software program – our enterprise
asset management system – to help us proactively maintain our
assets through their full life cycle and forecast future needs.
Our Department takes pride in our product and facilities. The
Department of Water and Power invites you to attend a tour of our facilities. In the last
year, we hosted students, residents and business leaders on tours of some of our major
facilities. The tour offers a chance for participants to get a “behind-the-scenes” look at
the facilities that provide reliable water and waste water services that our community
depends on to thrive.
I invite you to contact me with any questions on this report or if you require
additional information.
Jonathan Daly
General Manager
951-736-2477
www.CoronaDWP.org
his report not only reflects our ability to meet health standards, it also demonstrates our
“Tcommitment
to you that we will always provide you with the best that we can offer.
”
3
www.CoronaDWP.org
Corona’s Water Sources
In 2012, Corona residents and businesses used approximately 11.4 billion
gallons of drinking water. Groundwater wells owned and operated by
the City of Corona provided 53% of our water supply. Another 39% came
from the Colorado River by way of Lake Mathews. The final 8% is from
the State Water Project in Northern California, coming to us via the
California Aqueduct.
Water Treatment Processes
The water from the Colorado River requires treatment to remove and
inactivate harmful organisms. This process is accomplished using the
City of Corona’s two surface water treatment facilities: the Sierra Del Oro
and Lester Water Treatment Facilities. These facilities
incorporate the use of coagulant aids which bind
small particles together to remove them through
multimedia filtration and disinfection. Through
independent laboratory testing, 100% of the samples
taken in 2012 were free of harmful organisms.
The Department of Water and Power disinfects the distribution system
with monochloramines (a ratio of chlorine and ammonia). This allows us
to achieve a long-lasting chlorine residual and reduce the production
of disinfection byproducts. Disinfection byproducts are formed when
disinfectants (i.e. chlorine and monochloramines) react with naturally
occurring organic matter in water.
Blending
The Department of Water and Power has five active blending facilities
that blend water with low nitrate, fluoride, perchlorate and Total
Dissolved Solids with the remaining groundwater sources to deliver safe,
reliable drinking water to your tap.
About half of the groundwater pumped in Corona
is sent through a state-of-the-art reverse osmosis
membrane treatment facility, the Temescal Desalter.
This facility incorporates nitrate and Total Dissolved
Solids (TDS) removal, and also provides disinfection.
Lester Water Treatment Facility
You will notice in the tables of detected
contaminants that the groundwater exceeds the
primary standard for nitrate and perchlorate. The
Department of Water and Power is required by
law to report the range of all samples monitored,
as well as the average concentration delivered to
your tap. The averages are much lower because
the Department of Water and Power blends
water from several sources to meet water quality
standards. The blending stations are continuously
monitored and routinely sampled to ensure that
the water delivered to your tap meets all health
4
standards with a safety margin of no less than 10%. Please refer to the
“Treated Average System Water” column in the tables at the end of the
report for a more accurate representation of system water quality.
For more information about fluoridation, oral health, and current issues visit:
www.cdph.ca.gov/certlic/drinkingwater/Pages/Fluoridation.aspx.
Reclaimed Water
To improve water supply reliability for the City, the Department of Water
and Power developed and built our reclaimed water system in 2006.
California and our region face many challenges that affect our drinking
water supply, such as periodic drought, a growing population and
environmental constraints. Utilizing
reclaimed water to help meet water
demands for the City reduces the
impact of imported water supply
shortages and costs.
The reclaimed water system uses highly
treated wastewater from our state-ofthe-art water reclamation facilities and
distributes it throughout the reclaimed
water system. The reclaimed system is
completely separate from the drinking
Consumer Confidence Report 2013 (for year 2012)
water system, utilizing purple pipes, sprinklers and signage to denote
its location. Reclaimed water is used primarily on landscaping at parks,
schools and parkway areas, and even in a commercial building for trap
priming. By re-using water that would normally have been wasted, we
save potable water for our homes and businesses.
The City of Corona’s infrastructure for the reclaimed water system consists
of approximately 44 miles of pipeline, three storage reservoirs, and three
pump stations. In 2012, the City expanded its reclaimed water system with
two new projects – the Masters Drive and City Park Extensions. In addition,
the City is currently exploring additional ways to use reclaimed water, from
cooling towers to dual plumbing for commercial facilities.
The reclaimed water system produced 1.41 billion gallons of reclaimed
water in 2012 and we are continually adding new customers. Grants – We’re Working For You!
The City received a $300,000 grant from the Bureau of Reclamation
to install a pilot project of “smart” meters for a portion of our service
area. Smart meters are meters with advanced metering technology
capabilities that will assist the City with its water conservation efforts. The
meters will improve the City’s ability to serve its customers and manage
its water losses by providing the technology to make notifications
for leaks through real-time meter reading capabilities. This project is
5
www.CoronaDWP.org
very exciting and will result in increased customer
service and conservation of our region’s precious
water resources.
Challenges to Our Imported Water Supplies
Because of a dry winter, California faces a major
challenge in meeting the water needs for the State.
Corona, like much of California, depends on imported
water to meet demands for its customers. In 2012,
47% of our water supply was imported through the
Metropolitan Water District: 8% from the State Water
Project (SWP) in Northern California and 39% from
the Colorado River.
Pumping Restrictions on the Delta
Pumping restrictions on the Delta due to the Endangered Species Act
remain in effect. The State is required to maintain certain flow and
volume for the Delta in order to maintain designated habitat and protect
endangered species such as the Delta Smelt. It is difficult to meet 100%
of requested deliveries due to these pumping restrictions. After a dry
winter, neither the SWP nor the Central Valley Project (CVP) are able to
deliver 100% of water requests this year. As of March 2013, the projected
delivery allocation from the SWP is 35% of requests, and only 20% of
agricultural requests and 70% of municipal requests from the CVP.
Drought on the Colorado River
The Colorado River has been in the midst of a
drought for over a decade. Water from the Colorado
River is shared per the 1922 Colorado River Compact,
which allocates water to seven states and Mexico.
The Upper Colorado region states, consisting of
Colorado, Utah, New Mexico and Wyoming, receive
7.5 million acre-feet of water per year. Lower region
states, including Arizona, California and Nevada,
receive 7.5 million acre-feet of Colorado River water
per year; California receives the largest share at
4.5 million acre-feet per year. Mexico receives 1.5
million acre-feet per year. (An acre-foot of water is 325,829 gallons. This
is enough water for two typical households for a whole year.) For many
years, California has received its share of Colorado River water and up to
50% of the surplus of water available from other states not using their full
share. Due to the drought and other states now taking their fair share,
the surplus of water California once received is no longer available. Many
experts believe the Colorado River has been over-allocated; the amounts
set in the 1922 compact were set for levels in wet years, and may not be
normal volumes the Colorado River can sustain.
6
Consumer Confidence Report 2013 (for year 2012)
clothes washer. The Department of Water and Power offers free devices
and rebates – so take advantage of them. It’s an easy way to save water
without changing any habits. Do you have a leaky toilet that needs to
be fixed? If it’s caused you to go over your water budget, fix it and
we can give you a credit on your water bill through our Variance
Program. You can help reach the goal and save money, too.
Lake Mead
Delta Water Package and 20% by 2020
The Delta Water Package, passed in 2009, is a comprehensive legislative
package on water policy. It came from the need for California to have a
sustainable, reliable water supply for residents and businesses. As part of
this legislative package, Senate Bill No. 7 requires all urban water agencies
to reduce statewide per capita water consumption 20% by 2020. Corona
is working towards its goal; with an eye on continued water efficiency
we are sure to reach it.
So how can you help reach our goal? Reduce your showers by a few
minutes, install a low-flow showerhead, faucet aerator, or high-efficiency
About 60% of all water use in Corona is for landscaping; so there’s a huge
opportunity for savings outdoors. We live in a semi-arid climate that
only receives about 12 inches of rainfall a year, but turf requires about
52 inches of water per year. Replace your old sprinkler controller with
a “smart” timer – it adjusts for the weather, so you can
set it and forget it. Try taking a minute off of each of
your stations this summer – your grass can handle it.
Give your yard a week or two to adjust, and then try
taking another minute off. Or consider installing drip
irrigation in your planter areas, or even removing some
of your turf and replacing it with low water-using
plants. Rebate programs are available, and we also offer
landscape classes that help show you how you can do
it! Free up your Saturday morning mowing and edging
time by eliminating grass – low maintenance means
big benefits: less work and a lower water bill.
7
www.CoronaDWP.org
Water: An Undervalued Resource
Tour Our Facilities
Only about 3% of the earth’s water is fresh water that is used for drinking;
two-thirds of that water is stored in ice caps and glaciers. That’s a small
amount of water for everyone on the planet to share. Yet many of us don’t
think twice about the water that we use every day. All too often, treated,
imported water can be seen running down the storm drain – wasted. Water
is a precious resource; we all need it to live. Where there is water, there is
life. The last few years have proven that water availability is not guaranteed.
In past years, the snowpack in the Sierra Nevada mountains has been able
to fill the State’s reservoirs and keep the lifeblood of California flowing; but
recently, the snowpack has been well below
average, causing reduced deliveries across the
State. It’s time to take our water future into our
own hands, use our resources efficiently, and
focus on sustainable water supplies.
A lot goes on behind the scenes to provide our customers with clean
and affordable drinking water. Do you want to learn more about how
your water is treated and delivered? Are you interested in seeing how
we produce reclaimed water? Join us on a tour of DWP facilities. Here are
some comments received from past tour participants:
“There is so much that goes on behind the scenes to deliver our water.”
“The key to conservation is education. Need to really get the word out
on all sources.”
“I feel our City is in complete capable hands.”
Our Water Resources Team is here to help
you save water. We offer landscape checkups, rebates, landscape classes, and more.
Please contact the Water Resources Team at
951-736-2234 or by email at StopTheDrop@
discovercorona.com. Make every drop count
– use water efficiently.
Facility Tour
If you have any questions about our water
supply or water reclamation facilities, or
you’re just curious, we encourage you to
attend one of our quarterly facility tours.
Contact our Water Resources Team at
951‑736-2234 or by e-mail at StopTheDrop@
discovercorona.com to sign up for an
upcoming tour. You must be at least 18 years
old and a customer of the Department of
Water and Power to attend.
8
Tiered Rates and Water Budgets
Tiered rates and water budgets promote efficient water use, resource
conservation, provide fair rates and are an equitable way to share
resources. The water budget provides each customer with a budget that
uses the customer’s unique characteristics. All Department of Water and
Power customers receive a monthly water budget.
Residential customers receive a water budget that has two components:
an indoor budget and an outdoor budget. The indoor budget provides
60 gallons per person per day in the billing cycle, based
on the number of people in the home. The default indoor
budget for a single family home is based on four people
per household, and two people
Tiered Rate
Water Budgets
for each unit in a multi-family
residence. The outdoor budget is based on daily
weather data and the amount of landscaped
area. The outdoor budget will decrease during
cooler months and increase in warmer summer
months, because more water is needed by the
landscape when the weather is warm, and less is
needed when it is cool and we receive rain.
Consumer Confidence Report 2013 (for year 2012)
Commercial and industrial mixed use and structure accounts (accounts
serving a building and irrigation or just a building) receive a budget
based on a three-year rolling average. For accounts that have not been
established for more than a year, the budget is the actual water use in the
first year. Landscapes with a dedicated meter receive an outdoor budget
based on landscaped area and weather data, just like residential accounts.
Variance Program
The Department of Water and Power has a variance program to request
changes to your water budget. You can use the variance program if the
number of people in the residence is greater than the default budget, or
a measurement shows the irrigated area estimate was not sufficient. A
variance may also be granted if you find and
fix a leak on your property. Forms are available
online at www.CoronaDWP.org, at City Hall, or
can be mailed to you by calling our Customer
Service Team at 951-736-2321.
9
www.CoronaDWP.org
Did you know?
• There are 748 gallons of water in one unit.
• One acre-foot of water equals 325,829 gallons or 435.6 billing units.
• One acre-foot of water can supply two typical families with water for a
whole year.
• A leaky toilet can waste between 30 to 500 gallons of water per day.
From Your Drain to the Environment – Keep it Clean
While water reclamation treatment removes most pollutants, even trace
amounts of some substances may be harmful to the environment. The
best solution is to prevent pollution from going down the drain in the
first place.
Dispose of unwanted medicine properly…No Drugs Down the Drain!
For years, unwanted medicine was flushed down the drain to protect
children and pets from accessing it, and to ensure against illegal recovery
of controlled substances. Today, there are better options. The City of
Corona Department of Water and Power and the Police Department are
working together to protect our environment from the harmful effects
of improperly discarded, unused medications. For your convenience,
a pharmaceutical disposal bin has been placed at the Corona Police
Department lobby located at 730 Corporation Yard Way. For more
information, please call 951-736-2330.
Keep drains free of FOG – fats, oils and grease
When washed down the drain, cooking fats, oils and grease, or “FOG,”
can block sewer lines, causing raw sewage to back up into your home
or into neighborhood streets and storm drains. Overflows can be costly,
and pose health and environmental hazards. Keep your sewer lines FOGfree by scraping cooking fats into the garbage or into your food scrap
recycling bin, where available – not down the drain.
10
General Water Quality Information
The sources of drinking water (both tap and
bottled water) include rivers, lakes, streams,
ponds, reservoirs, springs, and wells. As water
travels over the surface of the land or through the
ground, it dissolves naturally-occurring minerals
and, in some cases, radioactive material, and can
pick up substances resulting from the presence of
animals or from human activity.
Contaminants that may be present in source
water include:
•M
icrobial contaminants, such as viruses and bacteria, that may come
from sewage treatment plants, septic systems, agricultural livestock
operations, and wildlife.
Consumer Confidence Report 2013 (for year 2012)
production, and can also come from gas
stations, urban stormwater runoff, agricultural
application and septic systems.
• R adioactive contaminants, that can be
naturally-occurring or be the result of oil and
gas production and mining activities.
In order to ensure that tap water is safe to drink,
the U.S. Environmental Protection Agency
(USEPA) and the California Department of Public
Health (CDPH) prescribe regulations that limit
the amount of certain contaminants in water
provided by public water systems. CDPH regulations also establish limits for contaminants in bottled water that provide the same protection for public health.
Drinking water, including bottled water, may reasonably be expected to
• Inorganic contaminants, such as salts and metals, that can be naturally- contain at least small amounts of some contaminants. The presence of
occurring or result from urban stormwater runoff, industrial or domestic
wastewater discharges, oil and gas production, mining or farming.
• P esticides and herbicides, that may come from a variety of sources such
as agriculture, urban stormwater runoff, and residential uses.
contaminants does not necessarily indicate that water poses a health
risk. More information about contaminants and potential health effects
can be obtained by calling the USEPA’s Safe Drinking Water Hotline
(1-800-426-4791).
•O
rganic chemical contaminants, including synthetic and volatile organic Some people may be more vulnerable to contaminants in drinking
chemicals that are byproducts of industrial processes and petroleum
water than the general population. Immuno-compromised persons such
as persons with cancer undergoing chemotherapy, persons who have
11
www.CoronaDWP.org
undergone organ transplants, people with HIV/AIDS or other immune
system disorders, some elderly, and infants can be particularly at risk
from infections. These people should seek advice about drinking water
from their health care providers. USEPA/Centers for Disease Control
(CDC) guidelines on appropriate means to lessen the risk of infection by
Cryptosporidium and other microbial contaminants are available from
the Safe Drinking Water Hotline (1-800-426-4791).
Nitrate
Nitrate in drinking water at levels above 45 mg/L is a health risk for
infants of less than six months of age. Such nitrate levels in drinking
water can interfere with the capacity of the infant’s
blood to carry oxygen, resulting in a serious illness;
symptoms include shortness of breath and blueness
of the skin. Nitrate levels above 45 mg/L may also
affect the ability of the blood to carry oxygen in
other individuals, such as pregnant women and
those with certain specific enzyme deficiencies. If
you are caring for an infant, or you are pregnant, you
should ask advice from your health care provider.
Lead
If present, elevated levels of lead can cause serious health problems,
especially for pregnant women and young children. Lead in drinking water
is primarily from materials and components associated with service lines
and home plumbing. The City of Corona is responsible for providing high
quality drinking water, but cannot control the variety of materials used
in plumbing components. When your water has been sitting for several
hours, you can minimize the potential for lead exposure by flushing your
tap for 30 seconds to 2 minutes before using water for drinking or cooking.
If you are concerned about lead in your water, you may wish to have your
water tested. Information on lead in drinking water, testing methods, and
steps you can take to minimize exposure is available from
the Safe Drinking Water Hotline or at http://www.epa.
gov/safewater/lead.
Chromium-6
On July 27, 2011, the Office of Environmental Health
Hazard Assessment (OEHHA) established a public
health goal (PHG) for chromium-6 (hexavalent
chromium) of 0.02 parts per billion (ppb). The PHG
will contribute to CDPH’s development of a primary
drinking water standard (maximum contaminant level,
MCL) that is specific for chromium-6. Please refer to
http://www.cdph.ca.gov/certlic/drinkingwater/
Pages/Chromium6.aspx for more information.
12
Consumer Confidence Report 2013 (for year 2012)
Source Water Assessment
In accordance with the Federal Safe Drinking Water Act (SDWA), the
State Department of Public Health Division of Drinking Water and
Environmental Management developed a program, called the Drinking
Water Source Assessment and Protection (DWSAP) Program, to assess the
vulnerability of drinking water sources to contamination. Assessments of
the drinking water sources for the City of Corona were completed most
recently in February 2012. The assessment concluded that the City of
Corona’s sources are considered most vulnerable to the following activities
not associated with any detected contaminants in the water supply:
automobile – gas stations, chemical/petroleum pipelines, chemical/
petroleum processing/storage,
dry cleaners, historic gas
stations, machine shops, metal
plating/finishing/fabricating,
mining – sand/gravel, National
Pollutant Discharge Elimination
System (NPDES) and Waste
Discharge Requirements (WDR)
permitted discharges, plastics/
synthetics producers, septic
systems – low density [<1/acre],
sewer collection systems,
underground storage tanks
100% of the samples taken in 2012 were
free from harmful organisms.
– confirmed leaking tanks, utility stations – maintenance areas, and
wastewater treatment plants. A copy of the complete assessments are
available through the City of Corona’s City Clerk’s office at 400 S. Vicentia,
Corona, CA 92882, or by using the online Public Records Request form at
www.CoronaDWP.org.
Lead and Copper Rule Monitoring
The Lead and Copper Rule (LCR) was developed to protect public
health by minimizing lead and copper levels in drinking water. The LCR
established an action level of 15 parts per billion (ppb) for lead and 1.3
parts per million (ppm) for copper based on the 90th percentile level of tap
water samples collected. Lead and copper are sampled on a mandated
three year testing cycle with sampling conducted at the customer’s tap.
Parameter
Units
State MCL
PHG
State DLR
Date
Sampled
90th
Percentile
No. Sites
Sampled
No. Sites
Exceeding AL
Lead
ppb
AL=15
0.2
5
2011
<5
50
2
Copper
ppm
AL=1.3
0.3
0.05
2011
0.1
50
0
AL
Allowable Levels
DLR
Detection Limits for purposes of
Reporting
MCL
Maximum Contaminant Level
PHG
Public Health Goal
ppb
Parts per billion or micrograms per
liter (μg/L)
ppm
Parts per million or milligrams per
liter (mg/L)
13
www.CoronaDWP.org
Please see pages 19-21 for key to abbreviations and footnotes
Primary Standards – Mandatory Health-Related Standards
Parameter
Units
State
MCL
[MRDL]
Combined Filter
Effluent Turbidity
NTU
TT 0.3
%
95(a)
Combined Filter
Effluent Turbidity
NTU
TT 0.3
%
95(a)
Parameter
Units
PHG
(MCLG)
[MRDLG]
State
DLR
NA
-
NA
-
State
MCL
[MRDL]
PHG
(MCLG)
[MRDLG]
State
DLR
5.0 (b)
(0)
-
Range
Average
Water Source
Major Sources in Drinking Water
CLARITY
Highest
% < 0.3
Highest
% < 0.3
0.07
Metropolitan Water District
Henry J. Mills Water Treatment Plant
100%
City of Corona, Lester & Sierra Del Oro
Water Treatment Facilities
100%
0.14
Range
Average
Regulated in Distribution System
Range
Highest % of positive samples collected in any one month = 0.8%
Average
Total number of positive samples collected in 2012 = 1
Soil runoff
Soil runoff
Major Sources in Drinking Water
MICROBIOLOGICAL CONTAMINANTS
Total Coliform Bacteria
(Total Coliform Rule)
%
Fecal Coliform and E. Coli
(Total Coliform Rule)
(c)
Heterotrophic Plate Count
CFU/mL
(HPC)
Parameter
Units
(0)
-
TT
NA
NA
State
MCL
[MRDL]
PHG
(MCLG)
[MRDLG]
State
DLR
(c)
Range
Distribution System Wide: ND
Average
Total number of positive samples collected in 2012 = 0
Range
Distribution System Wide: ND-210
Average
Distribution System Wide: 3
Naturally present in the environment
Human and animal fecal waste
Naturally present in the environment
Range
Average
State
Project
Water
Colorado
River
Water
Ground
Water
Treated
Average
System Water
Major Sources in Drinking Water
RADIOACTIVE CONTAMINANTS (j)
Gross Alpha
Particle Activity
pCi/L
15
(0)
3
Uranium
pCi/L
20
0.43
1
Combined
Radium - 226+228
pCi/L
5
(0)
NA
Range
ND
3-5
0-13.5
-
Average
ND
4
7.09
-
Range
ND-1
2-3
ND-16.5
-
Average
1
3
5.75
-
Range
ND
ND
ND-0.008
-
Average
ND
ND
0.002
-
Erosion of natural deposits
Erosion of natural deposits
Erosion of natural deposits
14
Consumer Confidence Report 2013 (for year 2012)
Units
State
MCL
[MRDL]
PHG
(MCLG)
[MRDLG]
State
DLR
Arsenic
ppb
10
0.004
2
Barium
ppm
1
2
0.1
Chromium
ppb
50
(100)
10
Fluoride (e, h)
ppm
2
1
0.1
Nickel
ppb
100
12
10
Nitrate (as N03) (d,e,k)
ppm
45
45
2
Parameter
Range
Average
State
Project
Water
Colorado
River
Water
Ground
Water
Treated
Average
System Water
Major Sources in Drinking Water
INORGANIC CONTAMINANTS
Perchlorate (e, i, k)
Selenium
ppb
ppb
6
50
6
30
Range
ND
2.2
ND-3.8
ND-2
Average
ND
2.2
ND
ND
Range
ND
0.12
ND-0.15
ND
Average
ND
0.12
ND
ND
Range
ND
ND
ND-1.7
ND
Average
ND
ND
ND
ND
Range
0.3-0.9
0.3
ND-0.7
ND-1.2
Average
0.7
0.3
0.4
0.3
Range
ND
ND
ND-12
ND
Average
ND
ND
ND
ND
Range
3.2
ND
ND-100
ND-32
Average
3.2
ND
38
15
Range
ND
ND
ND-11
ND
Average
ND
ND
ND
ND
Range
ND
ND
ND-6.6
ND
Average
ND
ND
ND
ND
4
5
Erosion of natural deposits; runoff from orchards; glass and
electronics production wastes
Discharges of oil drilling wastes and from metal refineries;
erosion of natural deposits
Discharge from steel and pulp mills and chrome plating;
erosion of natural deposits
Erosion of natural deposits; water additive that promotes
strong teeth; discharge from fertilizer and aluminum
factories
Erosion of natural deposits; discharge from metal factories
Runoff and leaching from fertilizer use; leaching from
septic tanks and sewage; erosion of natural deposits
Perchlorate is an inorganic chemical used in solid rocket
propellant, fireworks, explosives, flares, matches, and a
variety of industries. It usually gets into drinking water
as a result of environmental contamination from historic
aerospace or other industrial operations that used or use,
store, or dispose of perchlorate and its salts
Discharge from petroleum, glass, and metal refineries;
erosion of natural deposits; discharge from mines
and chemical manufacturers; runoff from
livestock lots (feed additive)
15
www.CoronaDWP.org
Parameter
Units
State
MCL
[MRDL]
PHG
(MCLG)
[MRDLG]
State
DLR
Range
Average
State
Project
Water
Colorado
River
Water
Ground
Water
Treated
Average
System Water
Range
ND
ND
ND-30
ND
Average
ND
ND
ND
ND
Major Sources in Drinking Water
SYNTHETIC ORGANIC CONTAMINANTS including Pesticides/PCBs
Dibromochloropropane (DBCP)
ppt
200
1.7
10
Banned nematocide that may still be present in soils due
to runoff/leaching from former use on soybeans, cotton,
vineyards, tomatoes, and tree fruit
VOLATILE ORGANIC CONTAMINANTS
Tetrachloroethylene
(PCE)
ppb
5
0.06
0.5
Trichloroethylene
(TCE)
ppb
5
1.7
0.5
Range
ND
ND
ND-1
ND
Average
ND
ND
ND
ND
Range
ND
ND
ND-1.9
ND
Average
ND
ND
0.7
ND
Discharge from factories, dry cleaners, and auto shops
(metal degreaser)
Discharge from metal degreasing sites and other factories
DISINFECTION BYPRODUCTS, DISINFECTANT RESIDUALS, AND DISINFECTION BYPRODUCT PRECURSORS (m)
Total Trihalomethanes
(TTHMs) (n)
ppb
80
NA
1
Range
12-18
-
ND-1
ND-40
Average
15
-
ND
19.7
Byproduct of drinking water disinfection
SECONDARY STANDARDS – Aesthetic Standards
Aluminum (u)
ppb
200
600
50
Chloride
ppm
500
NA
NA
Color
Units
15
NA
NA
Manganese (f, k)
ppb
50
NL=500
20
Specific
Conductance (k)
µS/
cm
1,600
NA
NA
Sulfate
ppm
500
NA
0.5
Range
65-160
ND
ND
80-440
Average
120
ND
ND
190
Range
80-100
82-87
ND-230
20
Average
92
84
126
20
Range
1
2
ND-3
ND
Average
1
2
ND
ND
Range
ND
ND
ND-820
ND
Average
ND
ND
45
ND
Range
380-600
930-940
3-1,600
160
Average
490
930
1163
160
Range
27-44
210-220
ND-350
3.4
Average
36
220
178
3.4
Erosion of natural deposits; residue from some surface
water treatment processes
Runoff/leaching from natural deposits; seawater influence
Naturally-occurring organic materials
Leaching from natural deposits
Substances that form ions when in water; seawater
influence
Runoff/leaching from natural deposits; industrial wastes
16
Consumer Confidence Report 2013 (for year 2012)
Parameter
Units
State
MCL
[MRDL]
PHG
(MCLG)
[MRDLG]
State
DLR
Range
Average
State
Project
Water
Colorado
River
Water
Ground
Water
Treated
Average
System Water
Major Sources in Drinking Water
SECONDARY STANDARDS – Aesthetic Standards – continued
Total Dissolved
Solids (e, k, t)
ppm
1,000
NA
NA
Turbidity
Units
5
NA
NA
Zinc
ppm
5
NA
0.05
Range
280-290
570-580
ND-1,100
54-720
Average
290
570
760
350
Range
ND
0.3-0.5
ND-1.2
ND
Average
ND
0.4
0.1
ND
Range
ND
ND
ND-0.1
ND
Average
ND
ND
ND
ND
UNREGULATED CHEMICALS REQUIRING MONITORING (STATE AND FEDERAL )
Boron (p)
ppm
NA
NL=1
ppb
NA
0.02
1
Vanadium
ppb
NA
NL=50
3
Soil runoff
Runoff/leaching from natural deposits; industrial wastes
Health Effects
(g)
Range
0.15
0.13
0.35-0.85
0.24-0.29
Average
0.15
0.13
0.53
0.26
0.1
Chromium VI (q)
Runoff/leaching from natural deposits
Range
ND
ND
ND-1.1
-
Average
ND
ND
0.46
-
Range
ND
ND
ND-10
ND-3.1
Average
ND
ND
4.8
ND
The babies of some pregnant women who drink water
containing boron in excess of the notification level may
have an increased risk of developmental effects, based on
studies in laboratory animals
NA
The babies of some pregnant women who drink water
containing vanadium in excess of the notification level may
have an increased risk of developmental effects, based on
studies in laboratory animals
17
www.CoronaDWP.org
Other Parameters
Chemical
Units
State
MCL
[MRDL]
PHG
(MCLG)
[MRDLG]
State
DLR
Alkalinity
ppm
NA
NA
NA
Calcium
ppm
NA
NA
NA
Hardness ( r)
ppm
NA
NA
NA
Magnesium
ppm
NA
NA
NA
pH
pH
Units
NA
NA
NA
Potassium
ppm
NA
NA
NA
Sodium (s)
ppm
NA
NA
NA
Bicarbonate
ppm
NA
NA
NA
Range
Average
State
Project
Water
Colorado
River
Water
Ground
Water
Treated
Average
System Water
Range
Average
Range
Average
Range
Average
Range
Average
Range
Average
Range
Average
Range
Average
Range
Average
64-86
75
16-23
20
78-110
100
12-13
12
8.2-8.6
8.4
2.8-2.9
2.8
60-67
64
-
120
120
64-65
64
260-270
270
24-25
24
8.2-8.4
8.3
4.4-4.5
4.4
85-88
86
-
ND-290
207
ND-160
111
ND-700
399
ND-71
29
6.3-7.9
7.3
ND-12
3.9
ND-150
89
ND-350
250
17-100
49
3-49
20
9-170
70
ND-13
5
6.0-9.2
8
1
1
26
26
21-120
60
18
Consumer Confidence Report 2013 (for year 2012)
2013 Annual Water Quality Report for 2012
UNIT
State MCL PHG (MCLG) State
[MRDL]
[MRDLG]
DLR
Range
Avg/Max
RAA
Distribution
System Wide
Major Sources in
Drinking Water
Health Effects Language
DISINFECTION BYPRODUCTS, DISINFECTANT RESIDUALS, AND DISINFECTION BYPRODUCT PRECURSORS FEDERAL RULE (m)
Total
Trihalomethanes
(TTHMs) (n)
ppb
Haloacetic Acids (o)
ppb
60
NA
1
Bromate (Mills WR-24 Conn.) (l)
ppb
10
0.1
1
Chloramines
Control of DBP
precursors (TOC)
ppm
ppm
80
[4]
TT
NA
[4]
NA
Range
ND-40
RAA
19.7
Range
ND-17
RAA
8.9
Range
ND-11
Max RAA
3.4
Range
0.1-2.7
Max RAA
1.65
Range
2.1-2.6
1
NA
0.3
Avg
2.2
Byproduct of drinking
water disinfection
Some people who drink water containing trihalomethanes
in excess of the MCL over many years may experience liver,
kidney, or central nervous system problems, and may have an
increased risk of getting cancer
Byproduct of drinking
water disinfection
Some people who drink water containing haloacetic acids in
excess of the MCL over many years may have an increased
risk of getting cancer
Byproduct of drinking
water disinfection
Some people who drink water containing bromate in
excess of the MCL over many years may have an increased
risk of getting cancer
Drinking water
disinfectant added
for treatment
Some people who use water containing chloramines well in
excess of the MRDL could experience irritating effects to their eyes
and nose. Some people who drink water containing chloramines
well in excess of the MRDL could experience stomach
discomfort or anemia
Various natural and
manmade sources
Total organic carbon (TOC) has no health effects. However, total
organic carbon provides a medium for the formation of
disinfection byproducts. These byproducts include trihalomethanes (THMs)
and haloacetic acids (HAAs). Drinking water containing
these byproducts in excess of the MCL may lead to adverse health
effects, liver or kidney problems, or nervous system effects, and
may lead to an increased risk of cancer.
19
www.CoronaDWP.org
Key to Abbreviations
CFU/mL
Colony-Forming Units
per Milliliter
DBP
Disinfection Byproducts
DLR
Detection Limits for purposes
of Reporting
MBAS
Methylene Blue Active
Substances
N
Nitrogen
NA
Not Applicable
ND
Not Detected
NL
Notification Level
NTU
Nephelometri Turbidity Units
pCi/L PicoCuries per liter
Running Annual Average
ppb
Parts per billion or micrograms RAA
TOC
Total Organic Carbon
per liter (μg/L)
ppmParts per million or milligrams μS/cmmicroSiemen per centimeter
or micromho per centimeter
per liter (mg/L)
(µmho/cm)
ppt
Parts per trillion or nanograms
per liter (ng/L)
Extended Abbreviations
Maximum Contaminant Level (MCL): The highest
level of a contaminant that is allowed in drinking
water. Primary MCLs are set as close to the PHGs
(or MCLGs) as is economically and technologically
feasible. Secondary MCLs are set to protect the odor,
taste and appearance of drinking water.
Maximum Contaminant Level Goal (MCLG): The
level of a contaminant in drinking water below which
there is no known or expected risk to health. MCLGs
are set by the U.S. Environmental Protection Agency.
Public Health Goal (PHG): The level of a
contaminant in drinking water below which there is
no known or expected risk to health. PHGs are set by
the California Environmental Protection Agency.
Primary Drinking Water Standard (PDWS): MCLs
and MRDLs for contaminants that affect health along
with their monitoring and reporting requirements,
and water treatment requirements.
Maximum Residual Disinfectant Level (MRDL):
The highest level of a disinfectant allowed in drinking
water. There is convincing evidence that addition of
a disinfectant is necessary for control of microbial
contaminants.
Maximum Residual Disinfectant Level Goal
(MRDLG): The level of a drinking water disinfectant
below which there is no known or expected risk to
health. MRDLGs do not reflect the benefits of the use
of disinfectants to control microbial contaminants.
Regulatory Action Level: The concentration of a
contaminant which, if exceeded, triggers treatment or
other requirements that a water system must follow.
Treatment Technique (TT): A required process
intended to reduce the level of a contaminant in
drinking water.
20
Consumer Confidence Report 2013 (for year 2012)
Footnotes
(a)The turbidity level of the filtered water shall be less than or equal to 0.3 NTU
in 95% of the measurements taken each month and shall not exceed 1 NTU
at any time. Turbidity, a measure of the cloudiness of the water, is an indicator
of treatment performance. The averages and ranges of turbidity shown in the
Secondary Standards were based on the treatment plant effluent.
(b)Total coliform MCLs: No more than 5.0% of the monthly samples may be total
coliform-positive. Compliance is based on the combined distribution system
sampling from all the treatment plants. In 2012, 1593 samples were analyzed
and one was positive for total coliforms. The MCL was not violated.
(c)E. coli MCL: The occurrence of two consecutive total coliform-positive samples,
one of which contains E. coli, constitutes an acute MCL violation. The MCL was
not violated.
(d)State MCL is 45 mg/L as nitrate, which is the equivalent of 10 mg/L as N.
(e)
Fluoride, nitrate, perchlorate, and TDS are a part of Corona’s blending
remediation plan to reduce the levels being delivered to the consumer’s
tap. Refer to the “Treated Average System Water” column for a more accurate
representation of system water quality.
See how your water is treated and delivered by attending a quarterly facility tour.
(h)The City of Corona was in compliance with all provisions of the State’s
Fluoridation System Requirements. This is part of the City of Corona’s blending
plan to reduce the levels of fluoride being delivered to the consumers’ tap.
Refer to the “Treated Average System Water” column for a more accurate
representation of system water quality.
(f )The high concentration of Manganese is from two groundwater wells; the City
utilizes over 20 wells. Refer to the “Treated Average System Water” column for a
more accurate representation of system water quality.
(i) Perchlorate reporting level is 4 ppb.
(g)Unregulated contaminant monitoring helps the USEPA and CDPH determine
where certain contaminants occur and whether the contaminants need to be
regulated.
(k)This constituent was detected at high levels exceeding the MCL at the highlighted source. Please note that this water is blended with water from other
sources to provide customers with the highest quality drinking water.
(j) Data collected from four consecutive quarters of monitoring.
21
www.CoronaDWP.org
(l)Bromate reporting level is 3 ppb and reported from Mills Filtration Plant
Metropolitan Water District (MWD). Mills MWD water is blended with other
Corona water sources. Please note that this water is blended with water from
other sources to provide customers with the highest quality drinking water.
(m)The City of Corona was in compliance with all provisions of the Stage 1/Stage
2 Disinfectants and Disinfection Byproducts Rules (D/DBPR). Stage 2 D/DBPR
monitoring began in the 2nd quarter. Compliance was based on the RAA.
(n)Reporting level is 0.5 ppb for each of the trihalomethanes (bromodichloromethane, bromoform, chloroform, and dibromochloromethane).
(o)DLR is 1.0 ppb for each of the following: dichloroacetic acid, trichloroacetic
acid, monobromoacetic acid, and dibromoacetic acid; and 2.0 ppb for
monochloroacetic acid.
(p)The sources that were detected for Boron are all directed to the Temescal
Desalter for reverse osmosis treatment. The treated water is monitored at the
effluent of the facility which is represented in the “Treated Average System
Water” column.
(q) Chromium VI reporting level is 1 ppb.
(r)Hardness is the sum of polyvalent cations present in the water, generally
magnesium and calcium. The cations are usually naturally occurring.
(s)Sodium refers to the salt present in the water and is generally naturally occurring.
(t)Total Dissolved Solids (TDS) is a measure of the total amount of all the materials
that are dissolved in water. These minerals, both natural and anthropogenic (made
by humans), are mainly inorganic solids, with a minor amount of organic material.
(u)Aluminum has a secondary standard
limit. In 2012 the secondary standard
limit was exceeded at our Treatment
Facility effluent with a Maximum
Running Annual Average (Max RAA)
of 500 ug/L. No consumer action is
necessary since secondary standards
for aluminum are established only for
aesthetic effects (water color). We are
continually calibrating our aluminum
base coagulant to achieve the nonmandatory secondary standard limit
of 200 ug/L. We expect to achieve this
limit by the end of 2013. Our current
Max RAA for 2013 is 210 ug/L.
Free landscape check-ups help identify ways to
lower your water bill.
22
Frequently Asked Questions
How hard is my water?
Hardness is dissolved minerals, including calcium and magnesium. This
may cause a deposit or water spots on fixtures and dishes. Our average
hardness is 399 ppm or 23.3 grains per gallon, classified as hard to very
hard. Our water hardness can change depending on the water demand
and the season.
When I turn on my kitchen or bathroom faucet, the water comes out
white. What is wrong?
Dissolved air in the water
causes a milky appearance.
When you open your faucet,
the pressure is relieved and
this allows the air to form
bubbles that rise to the top
of the glass. It will clear within
a minute, beginning at the
bottom of the glass. The water
is safe to drink.
Consumer Confidence Report 2013 (for year 2012)
How do I flush my water heater?
We have general instructions for flushing your water heater; for specific
instructions consult your user’s manual or look on the manufacturer’s
website. Below are general instructions; for more information, please call
951-736-2234.
1. T urn the gas valve to “pilot.”
2. Hook up a garden hose to the water heater and find a proper location
to drain the water; use caution – water will be hot when it comes out.
3. Open the valve until all of the hot water has drained from the water
heater.
4. Close the valve where the garden hose is hooked up.
5. Allow the heater to fill up, and then close the cold water supply on
top of heater.
6. Open up the hose bib again and let it drain.
7. Repeat the cycle a couple of times.
8. Disconnect the garden hose, turn the water supply back on and turn
the gas valve to the “on” position.
23
www.CoronaDWP.org
I went over my budget – now what?
Give our Customer Service Team a call at 951-736-2321. We can verify
that your budget factors are correct and provide some common sources
for you to check. If that doesn’t resolve the issue, we will help you work
with our Water Resources Team to figure out what is the cause. Everyone
should be within their water budget; going over is usually a sign that
there may be a leak or overwatering issue. The great news is once you
find and fix the issue, we offer a Variance Program to provide a credit for
charges on your over-budget bill. Call us – we are here to help!
Where can I get information on how to conserve water?
Call us! The best way to get information on water conservation for your
home or business is to call our office and talk to our Water Resources
Team. Please call us at 951-736-2234. Our website also has a lot of good
conservation tips and rebate information to help you conserve water.
Please visit www.CoronaDWP.org for more information or e-mail
[email protected].
My water pressure has been very high recently, what’s wrong?
The City has six separate water pressure zones. Your pressure should be
constant throughout the day, but may decrease when system demands
go up, such as during the night when a lot of water is used for irrigation.
If your pressure has suddenly increased, it may mean that your pressure
regulator needs to be adjusted or replaced. Call us at 951-736-2234 and
we will be happy to help troubleshoot the issue for you.
This report contains important information about
your drinking water. Visit the following page
beginning July 1 and use the translator to translate
the report into the language of your choice:
www.CoronaDWP.org/CCRtranslation.
Español: Este informe contiene información muy
importante sobre su agua potable. Visite la siguiente
página de internet a partir del 1ro de Julio y use el
traductor para traducir el informe en el idioma de su
preferencia: www.CoronaDWP.org/CCRtranslation.
If you are interested in participating in decisions that affect
the quality and supply of the water in the City of Corona,
or for general information about this report and questions
related to water quality, please call 951-736-2234.
Regular City Council meetings are held on the first and third
Wednesday of every month.
PRESORTED
STANDARD
U.S. POSTAGE
PA I D
PERMIT #146
CORONA, CA
City of Corona
Department of Water and Power
P.O. Box 940
Corona, CA 92878
NT
APER • PR
DP
I
LE
ON RECY
ED
C
APER • PR
DP
I
LE
NT
Postal Customer
O N R EC Y
ED
C