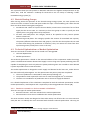
1
A Users Guide to EnergyPLAN David Connolly University of Limerick & Aalborg University 4 th March 2009 Version 1.1 [email protected] I would like to thank Prof. Henrik Lund and Assistant Prof. Brain Vad Mathiesen for all their help during my time at Aalborg University. Without their guidance, this document could not be written so soon. March 4, 2009 A USERS GUIDE TO ENERGYPLAN Contents Section 1 Title Page Introduction ........................................................................................................................ 4 2 Why EnergyPLAN? .............................................................................................................. 5 3 Collecting the Required Data ............................................................................................. 7 3.1 Section 1: Data for a Reference‐Model with a Technical Optimisation ........................ 9 3.1.1 Input Tab .................................................................................................................. 9 3.1.1.1 Electricity Demand............................................................................................... 10 3.1.1.2 District Heating .................................................................................................... 10 3.1.1.3 Renewable Energy ............................................................................................... 11 3.1.1.4 Storage ................................................................................................................. 13 3.1.1.5 Cooling ................................................................................................................. 14 3.1.1.6 Individual ............................................................................................................. 14 3.1.1.7 Industry ................................................................................................................ 17 3.1.1.8 Transport ............................................................................................................. 18 3.1.1.9 Waste ................................................................................................................... 18 3.2 Section 2: Data for Future‐Alternatives with a Technical Optimisation ..................... 19 3.2.1 Photovoltaic ........................................................................................................... 19 3.2.2 Tidal ........................................................................................................................ 19 3.2.3 Wave Power ........................................................................................................... 20 3.2.4 Future Additions ..................................................................................................... 22 3.3 Section 3: Data for Costs ............................................................................................. 23 3.3.1 Fuel Tab .................................................................................................................. 23 3.3.1.1 Fuel Price ............................................................................................................. 23 3.3.1.2 Fuel Handling Costs ............................................................................................. 23 3.3.1.3 Taxes .................................................................................................................... 23 3.3.1.4 CO2 Content ......................................................................................................... 23 3.3.1.5 CO2 Price .............................................................................................................. 24 3.3.2 Operation Tab ........................................................................................................ 24 3.3.3 Investment Tab ...................................................................................................... 24 3.3.4 Additional Tab ........................................................................................................ 24 2 Contents | A USERS GUIDE TO ENERGYPLAN March 4, 2009 4 Areas of Difficulty ............................................................................................................. 25 4.1 Thermal Energy System ............................................................................................... 25 4.2 District Heating Groups ............................................................................................... 26 4.3 Technical Optimisation vs. Market Optimisation ........................................................ 26 4.3.1 Business‐economic vs. Socio‐economic calculations ............................................. 26 5 Verifying Reference Model Data ...................................................................................... 28 6 Common Error Screens ..................................................................................................... 29 6.1 Wrong Number of Data Points .................................................................................... 29 6.2 Distribution File Location ............................................................................................ 30 7 Conclusions ....................................................................................................................... 31 8 References ........................................................................................................................ 32 9 Appendix A: Ireland’s Energy‐Balance 2007 ..................................................................... 34 | Introduction 3 March 4, 2009 A USERS GUIDE TO ENERGYPLAN 1 Introduction This is a brief description of my experience when I learned how to use the energy‐system‐analysis model EnergyPLAN [1]. It is a short description of why I chose EnergyPLAN for my particular study, followed by a brief account of the sources I used to gather the data for the model. When I was carrying out my work using EnergyPLAN, I did not know where to begin looking for a lot of the data I needed. As a result, the primary aim of this document is to share with others where or how I found the required data for my model. I hope that this brief overview of my experience will enable the reader to use EnergyPLAN quicker and more effectively. Finally, I welcome any contributions that could be made to improve the content of this document such as new sources of data, suggestions for new content etc. If you have any further questions or contributions regarding any of the material in this document, please don’t hesitate to contact me at [email protected]. 4 Introduction | A USERS GUIDE TO ENERGYPLAN March 4, 2009 2 Why EnergyPLAN? Before choosing the energy‐systems‐analysis model I would use, I had to decide what exactly I wanted to do. After some deliberation, I decided that the model for my investigation must be able “To identify how Ireland could integrate the most renewable‐energy into its energy system.” This statement, although broad at first, did limit my selection of energy‐system‐analysis models quite substantially. After a brief review of the energy‐system‐analysis models available, I narrowed my selection down to six: 1. EnergyPLAN (http://energy.plan.aau.dk/) 2. ENPEP (http://www.dis.anl.gov/projects/Enpepwin.html) 3. HOMER (https://analysis.nrel.gov/homer/) 4. LEAP (http://www.energycommunity.org/) 5. WILMAR (http://www.wilmar.risoe.dk/) 6. TIMES / MARKAL (http://www.etsap.org/) It is worth mentioning at this point that although I narrowed my selection to these six energy‐ system‐analysis models, there are a lot of others that I may have missed. Prof. Henrik Lund, Assistant Prof. Brian Vad Mathiesen, and I, are currently completing a review paper on the energy‐system‐ analysis models in use today. This paper will provide a much superior overview of the current energy‐system‐analysis models you can choose from, and a reference will be added here once it is completed. However, in relation to EnergyPLAN, there were a number of reasons that I chose it for my study: 1. It was simple to use and hence the training period would be short. Also in relation to this point, there is online training available from the EnergyPLAN website so it is easy to experience a typical application of the software [1]. 2. The EnergyPLAN software is free to download from its website [1]. 3. EnergyPLAN considers the three primary sectors of any national energy system: electricity, heat and transport. 4. EnergyPLAN was used to simulate a 100% renewable energy system for Denmark [2]. 5. Prof. Henrik Lund is actively publishing his results using EnergyPLAN within academic journals. A number of energy‐model developers publish their results in private reports for those who fund their investigations. However, in order to obtain my PhD qualification I needed to publish my work in academic journals. Therefore, it was fortunate that EnergyPLAN was being used for this purpose. 6. The quality of journal papers being produced using EnergyPLAN was a key attraction. Below are a few examples of the titles I recorded before contacting Prof. Henrik Lund about EnergyPLAN: a. Energy system analysis of 100% renewable energy systems – The case of Denmark in years 2030 and 2050 [3] b. The effectiveness of storage and relocation options in renewable energy systems [4] c. Large‐scale integration of optimal combinations of PV, wind and wave power into electricity supply [5] d. Large‐scale integration of wind power into different energy systems [6] | Why EnergyPLAN? 5 March 4, 2009 A USERS GUIDE TO ENERGYPLAN After reading these journal papers and observing the contribution that the results made to the Danish energy system, I felt that I could supply a similar insight into the Irish energy system using EnergyPLAN. 7. Finally and possibly the most important reason for using EnergyPLAN, was Prof. Henrik Lund’s supportive attitude when I approached him about using EnergyPLAN. I was invited to Aalborg University to learn about EnergyPLAN and complete my first model. My progress has been accelerated beyond expectation due to the support and guidance from both Prof. Henrik Lund and Associate Prof. Brian Vad Mathiesen during my time at Aalborg University. This is an essential aid when embarking on research, especially when deadlines need to be met also. 6 Why EnergyPLAN? | A USERS GUIDE TO ENERGYPLAN March 4, 2009 3 Collecting the Required Data As mentioned above, once I decided that EnergyPLAN was the most suitable energy‐systems‐analysis model for my particular study, I moved to Aalborg University for a short period to learn how to use the software correctly. During my time there, I completed a reference model of the existing Irish energy‐system. However, I felt that a lot of my questions could have been answered if I simply knew where to begin looking for the answers. Therefore, I decided to complete this document which simply discusses where I found the information I needed to complete my reference model of the Irish energy‐system. I hope that this will enable future EnergyPLAN users to collect their data more effectively. Important: There are important points below that need to be considered when reading the following chapters: 1. I have discussed a number of inputs in great detail and others only briefly. This reflects the effort required and the assumptions made in order to get the data and not the importance of the data. 2. When you download the EnergyPLAN model, a number of distributions are included with it. In a lot of studies these distributions will suffice as the results from the EnergyPLAN model may not be greatly improved by a more accurate distribution. Therefore, it is worth analysing the effects of various distributions on your results before allocating large periods of time to creating distributions. This chapter is divided into three primary sections: 1. Data for a Reference‐Model with a Technical Optimisation 2. Data for Future‐Alternatives with a Technical Optimisation 3. Data for Costs The order is used as this is the modelling sequence that is recommended when investigating an energy system. Firstly, a reference model must be created to ensure that the model is simulating the energy system correctly, before introducing alternatives. Subsequently, alternatives should be investigated from a technical point of view without including the costs. This ensures that alternative energy‐systems can be analysed without the restrictions imposed by existing economic‐ infrastructures. Finally, the costs are added so the restrictions imposed by economics as well as the actual costs of transforming the energy system can be identified. Finally, before discussing the data that was collected, it is important to be aware of the type of data that EnergyPLAN typical requires. Usually, the EnergyPLAN model requires two primary parameters: 1. The total annual production/demand 2. The hourly distribution of the total annual production/demand a. There must be 8784 data points, one for each hour b. The data points must be between 0 and 1, representing 0‐100% of production/demand as shown in Figure 3‐1. c. The distribution is inputted as a text file The distribution is simply adjusted to reflect the total annual production/demand. For example, in Figure 3‐2, the distributions for three separate demands are shown. In Figure 3‐2 the three distributions show how the distribution in Figure 3‐1 is manipulated to model the total demand. | Collecting the Required Data 7 March 4, 2009 A USERS GUIDE TO ENERGYPLAN 1 24 47 70 93 116 139 162 185 208 231 254 277 300 323 346 369 392 415 438 461 484 507 530 553 576 599 622 645 668 691 714 737 Demand (x100%) Irish Electricity‐Distribution: January 2007 1 0.9 0.8 0.7 0.6 0.5 0.4 0.3 0.2 0.1 0 Hour Figure 3‐1: Distribution of Irish Electricity‐Demand for January 2007 Irish Electricity Demand: January 2007 3000 Output (MW) 2500 2000 1500 1000 500 1 25 49 73 97 121 145 169 193 217 241 265 289 313 337 361 385 409 433 457 481 505 529 553 577 601 625 649 673 697 721 0 Hour 1.5 TWh Demand 1 TWh Demand 0.5 TWh Demand Figure 3‐2: Distribution modified by the total demand required 8 Collecting the Required Data | A USERS GUIDE TO ENERGYPLAN March 4, 2009 3.1 Section 1: Data for a Reference‐Model with a Technical Optimisation EnergyPLAN simulates a single year in hourly time‐steps. To create an initial model, I picked the year 2007, as it was the most recent. To explain where I got my data, I will discuss each tab within the EnergyPLAN model separately. The ‘Frontpage’ tab illustrates a flow diagram of the EnergyPLAN model, indicating how all the various components of the energy system interact with one another. The ‘Input’ tab is used to describe the parameters of the energy system in question. The ‘Cost’ tab is used to input the costs associated with the energy system being investigated and the ‘Output’ tab is used to analyse the results of your investigation. Finally, the ‘Settings’ tab enables the user to change the data‐units in the program. Below I will discuss in detail where I got the information for the ‘Input’ tab and the ‘Cost’ tab, as these account for the majority of data required. 3.1.1 Input Tab For my study, like most, the input tab proved to be a difficult section to complete. As a result, below is a brief description of where I sourced my data for each of the inputs I used in my model1. The first piece of information that you should try to source is the ‘Energy Balance’ for your country. The Irish Energy Balance was completed by Sustainable Energy Ireland [7], the Irish energy agency and they informed me that all OECD countries should have completed a similar document. The Energy Balance indicates the energy consumed within each sector of the energy system, see Figure 3‐3 and Appendix A. The International Energy Agency (IEA) completed two reports on energy balances in 2008: one with the Energy Balances for each of the OECD countries [8] and one with the Energy Balances for a number of non‐OECD countries [9]. These documents must be purchased so I have not obtained a copy. However, this is one possible source for an energy balance of your energy‐ system. 1 It is worth noting that the data required for EnergyPLAN is usually generic data that can be obtained in most OECD countries. Therefore, if I was able to obtain the data for the Irish energy system, it is likely to be available in other countries also. | Collecting the Required Data 9 March 4, 2009 A USERS GUIDE TO ENERGYPLAN DoubleClick to Open if MS Word Version Figure 3‐3: Irish Energy Balance for 2007 The Energy Balance document proved to the most useful source of information for my investigation. However, it is important to check the accuracy of the data in this document, as the figures can sometimes be based on estimates. 3.1.1.1 Electricity Demand Total electricity demand was obtained from the Irish Transmission System Operator (TSO), EirGrid [7], and the Energy Balance document 3.1.1.2 District Heating For my initial energy model I did not have to include any district heating or CHP as there are currently no large‐scale installations in Ireland. However, for the condensing plant data, I got a list of the power plants currently in operation in Ireland from the TSO [7]. Using the energy balance document I could calculate the efficiency of all the condensing plant, ηCOND, using the total fuel input, FIN (Wh), and total electricity generated, ElecTOT (Wh), (1) It was difficult to obtain the efficiencies fuel types of the individual condensing plant as it was “commercially sensitive information”. However, I obtained a breakdown of fuel inputted into the Irish condensing plants, see Figure 3‐4, once again from the Irish energy agency SEI, and used this to calculate the efficiencies for the different fuel‐type condensing plant (using formula 1). 10 Collecting the Required Data | A USERS GUIDE TO ENERGYPLAN March 4, 2009 Figure 3‐4: Breakdown of fuel consumption and electricity generated in Irish electricity system [10] There is a second entry available for the Condensing section called PP2. This is used for the economic analysis if there is highly contrasting plant on the system such as one plant with a high efficiency but it is expensive, and another plant which has a low efficiency but it is cheap. These may need to be analysed separately by the model. 3.1.1.3 Renewable Energy Before explaining how I obtained the data, I would like to recall what parameters are required. In order to define the energy available from a renewable energy resource in your energy system, you need to define five major features: 1. The type of renewable energy in question 2. The installed capacity of the renewable resource 3. The distribution profile (hourly for one year) 4. The stabilisation share 5. Correction factor Parameters 1‐3 are reasonably intuitive. Therefore, I will only recap on the ‘stabilisation share’ and the ‘correction factor’ here. So, just to repeat from the EnergyPLAN user manual [11], the stabilisation share is the percentage (between 0 and 1) of the installed capacity of the renewable resource that can contribute to grid stability i.e. provide ancillary services such as voltage and frequency regulation on the electric grid. At present renewable‐energy technologies, with the exception of hydro plants with storage, cannot help regulate the grid. Therefore, the stabilisation share will be set to 0 unless this changes in the future. Also from the EnergyPLAN user manual [11], the correction factor adjusts the hourly distribution inputted for the renewable resource. It does not change the power output at full‐load hours or hours of zero output. However, it does increase the output at all other times. This can be used for a number of different reasons. For example, future wind turbines may have higher capacity factors, and thus the same installed wind‐capacity will produce more power. | Collecting the Required Data 11 March 4, 2009 A USERS GUIDE TO ENERGYPLAN Onshore Wind I obtained the installed wind‐capacity and the hourly wind‐output for 2007 from the Irish TSO. The stabilisation factor was inputted as 0 because wind power does not contribute to grid stabilisation. Also, the correction factor was inputted as 0 because the installed wind‐capacity and the distribution used generated the expected annual wind‐energy. Otherwise, the correction factor would need to be adjusted until the wind production calculated by the model was the same as the actual annual‐ production Offshore Wind There was very little historical data available for offshore wind in Ireland. There is currently only one offshore wind farm constructed, which is located at Arklow Banks. This wind farm is using a new wind turbine developed by GE Energy, hence they will not release any information in relation to the power generated from the turbines. The only information I had was the installed capacity of the wind turbines: 25.2 MW (7 x 3.6 MW turbines). As a result I used the onshore wind‐distribution that I had obtained from the Irish TSO, combined with the correction factor in EnergyPLAN. The reason the onshore wind‐distribution is a good source of data, is because it accounts for the variations in wind speed over the island of Ireland. The only difference between onshore and offshore wind‐distributions is the higher capacity‐factor for offshore. This is accounted for by the correction factor in EnergyPLAN. Firstly, I found out the average‐annual wind‐speed for Arklow Banks (8.75 m/s). Then I got an annual offshore wind distribution from a data buoy located close to Arklow Banks (data buoy M2 from [12]). This data had an average‐annual wind‐speed of 7.82 m/s. Therefore, I scaled‐up this distribution curve until the average‐annual wind‐speed was 8.75 m/s (the same as the average‐annual wind‐ speed at Arklow Banks). Finally, I got the power curve for a Vestas V90 wind turbine as seen in Figure 3‐5, and calculated the expected output for a single year from the wind farm at Arklow Banks. I did not want to use the power curve for the GE Energy wind turbines as these are still at the testing stage. At this point I had calculated an expected offshore wind‐production of 0.11 TWh: using the power curve and wind‐speed distribution with average‐annual wind‐speed of 8.75 m/s. Using the onshore wind‐distribution, the annual electricity‐generated from the 25.2 MW offshore wind farm was 0.07 TWh. However, from my calculations, the total electricity that should have been generated was 0.11 TWh. Consequently, I adjusted the ‘Correction Factor’ (to 0.65) until the total offshore wind output was 0.11 TWh. This accounted for the higher capacity factor of the offshore wind turbines in comparison to the onshore wind turbines. 12 Collecting the Required Data | A USERS GUIDE TO ENERGYPLAN March 4, 2009 Figure 3‐5: Vestas V90 Power Curve [13] Photovoltaic There is currently no PV power installed in Ireland so no data was required for the reference model. River Hydro River hydro refers to hydroelectric dams with no storage facility i.e. they must operate as water passes through them. There is no river hydro in Ireland, however, if required the TSO would record hourly outputs from it, and could provide you with this data. Note that it took four months to obtain similar data from the Irish TSO, so long waiting‐periods may need to be considered. Tidal There is currently no tidal power installed in Ireland so no data was required for the reference model. Wave Power There is currently no wave power installed in Ireland so no data was required for the reference model. Hydro Power I found that hydro data was quite difficult to gather i.e. power capacity and storage capacity. As indicated in Figure 3‐4, hydro only provides 2.3% of Ireland’s electricity demands, and therefore there is not a lot of detailed information which is easily accessible for the hydro dams in Ireland. As a result, I found that the most productive approach was to contact the hydro plants directly, and request the data required from the operator in the control room. For the distribution of the hydro production, I used annual output data for the hydro plants which was recorded by the Irish TSO’s, EirGrid [14] /SEMO [15]. Geothermal / Nuclear There is currently no geothermal or nuclear power‐stations installed in Ireland so no data was required. 3.1.1.4 Storage Initially, my primary objective was to analyse the effects of additional energy storage on the Irish energy‐system. Therefore, the inclusion of energy storage technologies in EnergyPLAN was crucial at the outset. However, to date, only Pumped‐Hydroelectric Energy Storage (PHES) is in use in Ireland | Collecting the Required Data 13 March 4, 2009 A USERS GUIDE TO ENERGYPLAN so I did not have to gather any data on Electrolysers of Compressed‐Air Energy Storage (CAES). For the PHES parameters I simply contacted the plant control rooms and they provided information of pump/turbine and storage capacities. However, plant efficiencies could not be revealed as it was “commercially sensitive”. Therefore, from the Energy Balance, I calculated the overall PHES efficiency (power generated from PHES facilities divided by power used by PHES facilities). I then inserted the pump and turbine efficiencies so that the round‐trip‐efficiency was the same as that calculated from the Energy Balance. For example, from the Energy Balance, PHES facilities in Ireland had an efficiency of 63.9%. Therefore, I gave the pump an efficiency of 75% and the turbine an efficiency of 85.2%, therefore the round‐trip‐efficiency was 0.75*0.852 = 0.639. 3.1.1.5 Cooling There is currently no cooling‐load in Ireland so no data was required for the Irish reference‐model. Note that the heat demand under the cooling tab is for absorption cooling. 3.1.1.6 Individual Heat Distribution It was very difficult to predict the annual heat distribution for the entire population of Ireland. In order to estimate it, I used ‘Degree Day’ data from Met Eireann, the Irish meteorological service [16]. There are Heating Degree‐Days (HDD) and Cooling Degree‐Days (CDD). As their title suggest, the HDD indicate the level of heating required on a given day, and the CDD indicate the level of cooling required on a given day. In Ireland, cooling is not required due to the climate, therefore, using the Heating Degree‐Days indicate the amount of heat required could be estimated. Heating Degree‐Days work as follows: The temperature within a building is usually 2‐3°C more than outside, so when the outside temperature is 15.5°C, the inside of a building is usually 17.5°C to 18.5°C. Therefore, once the temperature drops below this 15.5°C outside‐temperature setpoint, the inside temperature drops below 17.5/18.5°C and the space heating within a building is usually turned on. Note that this 15.5°C setpoint is specifically for Ireland and it can change depending on a number of factors such as climate, house insulation etc [16]. A full explanation about the calculation and application of degree data can be obtained from [16, 17]. By obtaining the Heating Degree‐Day data, the level of heat required each day within a building can be estimated. Consequently, an annual distribution of space‐heating demand can be created with a resolution of 1 day (as Degree Day data is only recorded on a daily basis) as seen in Figure 3‐6. For the EnergyPLAN model, hourly data is required so this 1 day data was converted into hourly readings using a computer program written in MATLAB: if you follow the same approach you can contact me to use the model at [email protected]. However, this only considered the space‐heating distribution and not the hot‐water distribution. Therefore, the heat distribution accounting for both space heating and hot‐water demand had to be constructed. Remember though, for EnergyPLAN hourly data is required so this 1 day data must be converted into hourly readings. 14 Collecting the Required Data | A USERS GUIDE TO ENERGYPLAN March 4, 2009 Belmullet Heat Distribution 20 Degree Days 15 10 5 0 Figure 3‐6: Degree Day data from Belmullet meteorological station in Mayo, Ireland For the summer months, it was assumed that space heating would not be required: it was assumed that the heat absorbed by the building during warm temperatures, and also the building’s occupants, would keep the building warm during colder temperatures. Therefore, during the summer hot water is the only heating demand. It was also assumed that hot water is a constant demand each day for the entire year, as people tend to use a consistent amount of water regardless of temperature or time of year. The BERR in the UK completed a report in relation to domestic hot‐ water and space heating, which indicated that the ratio of space‐heating to hot‐water heating in the home is 7:3 [18]. Therefore, as seen in Figure 3‐7, for the heat distribution a 30% constant bandwidth was placed at the base representing hot‐water demand, and a 70% demand was placed on top (based on Degree Day data) representing the space‐heating requirements. Figure 3‐7Error! Reference source not found. represents the heat distribution constructed for modelling the heat demand within the Irish Energy System. 100 Heat Demand (%) 80 Space Heating 60 Hot Water 40 20 Dec‐ 07 Nov‐ 07 Oct‐ 07 Sep‐ 07 Aug‐ 07 Jul‐ 07 Jun‐ 07 May ‐07 Apr‐ 07 Mar‐ 07 Feb‐ 07 Jan‐ 07 0 Figure 3‐7: Individual heat distribution for Ireland Finally, the daily distribution created using the degree‐day data had to be converted into hourly data for the EnergyPLAN model. To do this a daily cycle was applied to the distribution which is displayed in Figure 3‐8. The daily cycle used was taken from a similar study completed on Denmark in [3]. It was assumed that Ireland would have a similar daily distribution for heat as Denmark. | Collecting the Required Data 15 March 4, 2009 A USERS GUIDE TO ENERGYPLAN 100 Heat Demand (%) 80 60 40 No Daily Cycle 20 With Daily Cycle 1 15 29 43 57 71 85 99 113 127 141 155 169 183 197 211 225 239 253 267 281 295 309 323 337 351 365 379 393 407 421 435 449 463 477 491 505 519 533 547 561 575 589 603 617 631 645 659 673 687 701 715 729 743 0 Hour Figure 3‐8: Individual heat‐distribution for January 2007 in Ireland (Hourly) Heat Fuel Consumption and Efficiency The fuel consumed for residential heating can be obtained from the Energy Balance. For the boiler efficiencies, I consulted the Building Energy Rating documentation provided by the Irish energy agency, SEI [19]. This documentation is used by assessors to complete energy ratings for homes in Ireland. Therefore, the documentation gave the typical type and efficiency of different domestic boilers used in Ireland. This documentation is possibly available in other countries also, or if not, the efficiencies within this documentation could be applied to other applications. Electric Heating Electric heating demand can also be difficult to quantify as it is usually discussed in conjunction with the heating demand not as a separate entity. From a report completed by the Irish energy agency, SEI, it was found that 14% of all domestic electricity is used for space heating and 23% for hot water [20]. In a separate report by SEI, it was found that 12% of commercial electricity was used for heating purposes [21]. Therefore, I used these figures to calculate the electric heating demand in Ireland. Solar Distribution There are two types of solar thermal in the EnergyPLAN model: Solar thermal that contributes to district heating and solar thermal for individual households. At present, only individual solar‐thermal energy is used in Ireland and hence it is discussed in this section under the individual’s heating‐ demands. The inputs required for the EnergyPLAN model are the: 1. The total solar‐thermal‐production for 2007 2. Hourly distribution of the solar‐thermal production in 2007 3. Solar‐thermal share The total‐solar‐production in Ireland for 2007 was got from the 2007 Energy Balance [22]. For the distribution, an attempt was made to obtain the hourly power‐output from a solar panel for an existing installation2 in Ireland, but this could not be obtained. As a result, the solar‐thermal‐output curve that was constructed for Denmark [3] was used, as the solar radiation in Denmark is very similar to the solar radiation in Ireland, as displayed in Figure 3‐9. To analyse this further, global‐ solar‐radiation data was compared between Denmark and Ireland as seen in Figure 3‐9, which clearly verifies the similarity. Therefore, it was considered reasonable to assume that the solar‐ thermal output would be very similar for both Denmark and Ireland. 2 Solar‐thermal output can be found by measuring the inlet and outlet temperatures of the collector, and also the flow rate. 16 Collecting the Required Data | A USERS GUIDE TO ENERGYPLAN March 4, 2009 This solar‐thermal distribution was created by a Danish energy consultancy, PlanEnergi [23] for the 2030 Danish Energy‐Plan [2]. The distribution gives the production of an individual‐solar‐thermal installation of 4.4 m2 during a typical Danish year. The production is calculated on the basis of a consumption of 150 litres per day, heated from 10°C to 55°C in combination with a 200 litre storage tank. The 4.4 m2 represents a solar‐thermal installation designed for hot water and some contribution to space heating. Table 3‐1: Global solar‐radiation in Denmark and Ireland Country Number of Stations That Provided Data Denmark Ireland 4 7 Average‐Annual Global‐Solar‐Radiation (kWh/m2) 976 989 Figure 3‐9: Solar radiation Solar Share The solar share is the percentage of houses that have a solar panel installed: This is currently being sourced for Ireland. Solar Input As stated above, I found the total solar energy utilised from the Irish Energy‐Balance [22]. The solar input and solar share can be adjusted until the solar production matches the value stated in the Energy Balance. 3.1.1.7 Industry Fuel Consumption The quantity of each fuel‐type consumed within industry can be found in the Energy Balance [22]. The ‘Various’ input is only used when a consumption cannot be specified anywhere else or may need to be analysed on its own i.e. gas consumption for offshore drilling. Industrial CHP: Energy Production In order to quantify the capacity of industrial CHP, I had to contact the statistics department within the Irish energy agency, SEI, who had the breakdown of CHP plants at their disposal. They could identify from their records how much CHP in Ireland was industrial and how much was dispatchable. | Collecting the Required Data 17 March 4, 2009 A USERS GUIDE TO ENERGYPLAN From this they could also provide the amount of electricity and heat that was produced from both industrial and dispatchable CHP. Industrial CHP: Distribution Since the industrial CHP in Ireland was not controlled by the TSO, this means that the distribution used for Industrial CHP was const.txt. This means that the output was simply constant. It is the best proxy for modelling a production that cannot be controlled. 3.1.1.8 Transport The amount of fuel used for transport is also available from the Energy Balance [22]. 3.1.1.9 Waste There is currently no waste used for energy production in Ireland so no data was required for the Irish reference‐model. 18 Collecting the Required Data | A USERS GUIDE TO ENERGYPLAN March 4, 2009 3.2 Section 2: Data for Future‐Alternatives with a Technical Optimisation Once the reference model is completed, a number of new technologies can be introduced. Below is a description of the inputs used in the first alternatives analysed for the Irish energy‐system. 3.2.1 Photovoltaic As I could not obtain PV output from Ireland, I used the results obtained from a Danish project called Sol300. This project involved the installation of grid‐connected PV‐panels on 300 homes in Denmark and the corresponding output was recorded. This output is discussed in [5], and is available in the Distributions folder that comes with the EnergyPLAN model. The name of the distribution is hour_PV_eltra2001 and hour_PV_eltra2002, for the years 2001 and 2002 respectively. 3.2.2 Tidal Tidal power is developing rapidly at present. It is very similar to most renewable‐energy as you must use it when it is being generated. However, the unique characteristic of tidal power is the fact that it can be predicted in advance: on a minute resolution, at least three years in advance, if not more. In order to simulate tidal power, I sourced two studies completed in Ireland: one by SEI (the Irish Energy Authority), titled “Tidal and Current Energy Resources in Ireland” [24], and one by the Department of Communications, Energy and Natural Resources called “All‐Island Grid‐Study: Renewable Energy Resource Assessment (Workstream 1)” [25]. The first study [24] identified viable tidal‐energy resource available in Ireland from tidal power (0.92 TWh), and the second study [25] created a power‐output curve for tidal devices as seen in Figure 3‐10. Using these two inputs it was possible to simulate tidal energy in EnergyPLAN. It is worth noting that these figures were based on ‘first‐generation tidal‐devices’, so the area investigated came under the following restrictions: 1. Water depth between 20m and 40m 2. Sites outside major shipping lanes 3. Sites outside military zones and restricted areas 4. Sites which do not interfere with existing pipelines and cables 5. 12 nautical mile limit offshore 6. Peak tidal velocity greater than 1.5m/s ‘Second‐generation tidal‐devices’ are expected to be developed that can be placed in areas without some of these restrictions (see Figure 3‐11). However, these devices are not expected until 2015 [25]. Power Output (kW) 150000 Tidal Output ‐ January 100000 50000 0 Figure 3‐10: Tidal Output from a 122 MW Tidal‐Farm [25] | Collecting the Required Data 19 March 4, 2009 A USERS GUIDE TO ENERGYPLAN Figure 3‐11: First and Second generation tidal technology [26] 3.2.3 Wave Power I consulted with Jens Peter Kofoed (Aalborg University) in order to generate the expected wave power data for my model. During our discussion, it became apparent that the future of wave power is very unclear. Unlike wind power where the three‐bladed design has become the primary turbine, there will be no standard design for future wave generators. This is due to the fact that wave power depends on two parameters: wave height and wave period. Different wave generators will be used depending on the specific wave height and period characteristics at the sites. It is unlikely that any single wave generator will be the most efficient at all sites. The most convincing way to predict the wave‐power contribution for an energy system in the future is to use the output from a wave generator device that is publicly providing a power matrix, particularly the Pelamis, see Figure 3‐12a. The Pelamis power matrix (as illustrated in Figure 3‐12b) is available to the public and hence can be used in conjunction with wave‐height and wave‐period data to predict future wave power. Since I created the wave‐power output I have also found two other wave‐power matrices: one for the Wave Dragon (see Figure 3‐13) and the other for the Archimedes (see Figure 3‐14). (a) (b) Figure 3‐12: Pelamis wave‐generator (a) and power‐matrix: output in kW (b) 20 Collecting the Required Data | A USERS GUIDE TO ENERGYPLAN March 4, 2009 Figure 3‐13: Wave Dragon Power Matrix (optimised for high average wave conditions): output in kW [27] Figure 3‐14: Archimedes‐Wave‐Swing Power‐Matrix (unrestricted): output in kW [27] When multiple power matrices are available, the suitability of the device for a particular site can be evaluated by completing a scatter diagram. The wave height and wave period recorded at the site in question should be plotted against one another as illustrated in Figure 3‐15. If the power matrix and recorded data from the site in question overlap each other significantly on the scatter diagram, then the wave energy generator being investigated is a good choice for that particular location. As seen in Figure 3‐15, the Pelamis is a very good match for the sample site analysed. | Collecting the Required Data 21 March 4, 2009 A USERS GUIDE TO ENERGYPLAN Pelamis Power Matrix Figure 3‐15: Scatter diagram for M4 data buoy off the coast of Ireland Once the most suitable wave power device has been chosen, and the power matrix obtained, the wave‐height and wave‐period data recorded at the site must be converted into power output. To do this, I have created a program using MATLAB which can be obtained by contacting me at [email protected]. For my particular study, I used wave‐height and wave‐period data from four different sites around the coast of Ireland. The data was gathered by the Marine Institute in Ireland using data buoys distributed around the coast [28]. Obtaining data from four different locations spread over each corner of the island, ensured that wave energy fluctuations were minimised. A list of data buoys can be seen at [29]. 3.2.4 Future Additions A number of other technologies will be analysed in upcoming alternatives for the Irish energy‐ system so the input details will be added in due course. 22 Collecting the Required Data | A USERS GUIDE TO ENERGYPLAN March 4, 2009 3.3 Section 3: Data for Costs 3.3.1 Fuel Tab 3.3.1.1 Fuel Price I found the cost of the individual fuels at the following websites: • Crude Oil: http://www.oil‐price.net/?gclid=COnOoJeI65YCFQpUtAodCUf9PQ • Coal: http://www.eia.doe.gov/cneaf/coal/page/coalnews/coalmar.html • Natural Gas: http://www.bloomberg.com/markets/commodities/energyprices.html • Wood Pellets: http://www.techstore.ie/Renewable‐Energy/Wood‐Pellet/Wood‐Pellet‐ Supply.htm Fuel Oil, Diesel and Petrol prices can be found by contacting an oil refinery. For my study, I simply used the ratio of costs recommended by the Danish Energy Authority [30]: • Crude Oil to Fuel Oil – 1 : 0.70 • Crude Oil to Diesel – 1 : 1.25 • Crude Oil to Petrol – 1 : 1.33 It was presumed that although the price of oil may fluctuate, the costs of processing the oil should remain constant. 3.3.1.2 Fuel Handling Costs I got the fuel‐handling costs from Brian Vad Mathiesen’s doctoral thesis also, as seen in Table 3‐2 [31]. These are the costs associated with handling the fuel within the energy system i.e. transporting the fuel to the power plant. Table 3‐2: Fuel handling costs [32] 3.3.1.3 Taxes I rang the Irish revenue office to find out if there were any taxes on specific fuels or technologies and found that there was none. Note that Value Added Tax (VAT) is not included here. 3.3.1.4 CO2 Content I found the CO2 content for different fuels from a report completed by the Irish energy agency [33]. They were as follows: 1. Coal/Peat3: 88 kg/GJ 2. Fuel Oil: 69 kg/GJ 3. Gas: 51 kg/GJ 3 Coal and Peat were modelled as a single entity as they have very similar costs and CO2 emissions. This value should not be used when modelling coal on its own as it is a specific value for the Irish energy system. | Collecting the Required Data 23 March 4, 2009 A USERS GUIDE TO ENERGYPLAN 3.3.1.5 CO2 Price There is no carbon tax in Ireland at the moment. However, Ireland participates in the European carbon trading scheme and therefore there is a cost associated with carbon, even though it is not an internal government tax. For information on carbon costs, visit http://www.pointcarbon.com/. 3.3.2 Operation Tab Under this tab you must enter the variable operation and maintenance costs. These are the costs that occur if the technology in question is used. For example, an annual service has to be done every year regardless of how often the generating plant operates. Therefore, this is a fixed operation and maintenance charge. However, if the generating plant generates 1 GWh it must get a second service costing €1500. Therefore, the generating plant has a variable operation and maintenance cost of €1500/GWh or €1.50/MWh, as this second service will only be necessary if the plant actually operates. For the condensing plant, I found the variable operation and maintenance costs from the Danish Energy Authority [34]. For the Pumped‐Hydroelectric Energy Storage (PHES) facilities, I obtained the variable operation and maintenance costs from [35]. I could not find the variable operation and maintenance cost for the individual units. 3.3.3 Investment Tab Under this tab you must enter the investment, lifetime and fixed operation and maintenance costs. These costs are used for to calculate the annual costs of each component. Once again, I got the information for the Condensing Plant from the Danish Energy Authority [34], and from [35] for the energy‐storage facilities. For onshore and offshore wind‐turbines, the investment and fixed O&M costs in [34] have been updated in [36]. For the individual heating‐units (such as boilers, electric heaters, solar) I found the costs by contacting the suppliers. Remember to include the installation costs for boiler and solar systems (i.e. plumbing and storage). The breakdown of the heating systems in Ireland (by fuel type) was got from a report carried out by the Irish Central Statistics Office (CSO) [37]. However, even with this information it is difficult to identify what size boiler was installed in each home. Therefore, a more detailed investigation is necessary in the future for quantifying these costs, and when completed the details will be provided here. Finally, just to note that taxes should not be included in the costs inputted here. Therefore, if a supplier is contacted to obtain the costs, ensure the price quoted is without tax. 3.3.4 Additional Tab This can be used if there is any additional costs which have not been accounted for. 24 Collecting the Required Data | A USERS GUIDE TO ENERGYPLAN March 4, 2009 4 Areas of Difficulty Although a large degree of EnergyPLAN is intuitive, there were some areas which I found difficult to understand at first. Therefore, a few aspects of the model are discussed in more detail here. 4.1 Thermal Energy System Coming from a country very little CHP plants or district heating exist, and the fact that heat is usually generated at the point of demand, I did not fully understand how a thermal energy system worked. As EnergyPLAN can model this type of energy system, a brief outline is provided. To illustrate the flexibility induced by thermal energy storage on such a system, a snapshot of the power production during different scenarios is presented below. The system in question contains a CHP plant, wind turbines, a thermal storage, a hot‐water demand, and an electrical demand as illustrated in Figure 4‐1. During times of low wind‐power, a lot of electricity must be generated by the CHP plants to accommodate for the shortfall power production. As a result, a lot of hot water is also being produced from the CHP plant as seen in Figure 4‐1a. The high production of hot water means that production is now greater than demand, and consequently, hot water is sent to the thermal storage. Conversely, at times of high wind‐power, the CHP plants produce very little electricity and hot water. Therefore, there is now a shortage in of hot water so the thermal storage is used to supply the shortfall, as seen in Figure 4‐1b. Note: This system can be simulated by choosing the Technical Optimisation 2: Balancing Heat and Electricity Demands under the Regulation tab in EnergyPLAN. Wind Power Wind Power Electricity Demand Electricity Demand CHP Plant CHP Plant Hot Water Demand Hot Water Demand Thermal Storage Thermal Storage (a) (b) Figure 4‐1: Energy System with district heating and thermal energy‐storage during (a) a low‐wind scenario and (b) a high‐ wind scenario | Areas of Difficulty 25 March 4, 2009 A USERS GUIDE TO ENERGYPLAN This system has been put into practice in Denmark which has the highest wind penetration in the world. Also, Lund has outlined a roadmap for Denmark to use this setup in achieving a 100% renewable energy system [3]. 4.2 District Heating Groups After learning about the operation of the thermal‐storage energy‐system, the next question that comes to mind is in relation to the CHP inputs under the ‘Input ‐> DistrictHeating’ tab. Under this tab there are three district‐heating (DH) categories: 1. DH without CHP: These are systems that use boilers, waste heat or some other form of heat supply but do not use CHP. It is necessary to have this group in order to specify the heat capacity that is not going to be met by CHP plants. 2. DH with small CHP‐plants: This category needs to be specified as they cannot operate without a heat load. 3. DH with large CHP‐plants: This category specifies the amount of centralised CHP capacity. The primary difference between these and group 2, is the fact that these plants do not need to create heat during the production of electricity. They can remove the heat from their system using water (usually from a river or the sea). 4.3 Technical Optimisation vs. Market Optimisation There are two kinds of studies that can be carried out in EnergyPLAN: 1. Technical Optimisation 2. Market Optimisation The technical optimisation is based on the technical abilities of the components within the energy system. The difference between demand and supply is met as long as the power‐producing units are capable of completing the task. Only when the power‐producing units are not able to meet demand is power imported from the external market. The market optimisation is designed to match supply and demand at the least cost, rather than on the most technically advantageous. For this optimisation two primary steps are completed: 1. The cost of production is calculated for each power‐producing unit 2. The production‐level required for each unit to meet the marginal cost4 is calculated 3. The least‐cost combination of production units is chosen to supply the demand For a detailed explanation of the calculations completed in both the technical optimisation and the market optimisation, read chapter 6 and 7 respectively in the EnergyPLAN user‐manual [38]. 4.3.1 Businesseconomic vs. Socioeconomic calculations There are two types of market optimisations: 1. Business Economic: Taxes are included in the market optimisation 2. Socio Economic: Taxes are not included in the market optimisation The socio‐economic studies are designed to show what society can afford to do. In a socio‐economic study the aim is to identify the costs associated with the best Technical Optimisation. This way you 4 Marginal Cost: Is the cost at which there is enough supply to meet demand 26 Areas of Difficulty | A USERS GUIDE TO ENERGYPLAN March 4, 2009 can optimise the performance of the energy system without the restrictions imposed by economic infrastructures. Therefore, the following steps can be followed: 1. Complete a Technical Optimisation identifying the optimum technical‐operation of the energy system, for example the system with minimum Critical Excess Electricity Production (CEEP) or minimum CO2. 2. Complete a socio‐economic study to identify the costs associated with the technical optimisation The business‐economic studies show what can be done while being profitable for a business or person. Once the socio‐economic study is completed, the market‐economic study should be done to identify how the existing market‐infrastructure obstructs the optimal technical‐solution. Therefore, after completing steps 1 and 2 above: 3. Carry out a business‐economic market‐optimisation to identify how the existing system prevents the introduction of the optimal technical‐solution. 4. Make changes to the existing tax system to outline how the existing market could be adjusted to promote the optimal technical‐solution. Sometimes, socio‐economic costs can include the following aspects also: 1. Job Creation 2. Balance of Payment5 3. Public Finances 4. Environmental Costs However, these calculations are not made by the EnergyPLAN model. Instead, these benefits must be calculated externally based on the investments made in the different energy‐system‐sectors. These calculations are discussed further in [39]. __________________________________________________________________________________ Note: There are a number of areas in EnergyPLAN that I still do not understand, primarily because I have not needed to use these technologies or calculations to date. If anyone would like to add to some information to any of these areas, please contact me at [email protected]. 5 http://en.wikipedia.org/wiki/Balance_of_payments | Areas of Difficulty 27 March 4, 2009 A USERS GUIDE TO ENERGYPLAN 5 Verifying Reference Model Data Once all the data has been inputted into EnergyPLAN, the final step is to verify that the model created is operating the same as the energy‐system that you are trying to simulate. The first step is to ensure that all the capacities and distributions are correct, including interconnection capacity that is placed under the Regulation tab. Afterwards, the energy outputs from the model must be compared with those of the actual energy‐system. There are five guidelines listed below that may be useful for completing this task (see Figure 5‐1 also): 1. Check that the electricity demand is correct (including demand, heating, cooling and interconnection) 2. Ensure the consumption is also correct at point 2 3. Check that the production other than the power plants are producing the required amount of energy 4. Are the power plants generating the correct amount of energy for each fuel type? If steps 3 and 4 are correct, but the power plants are not generating the correct amount of energy, then the power plant efficiency under the Input ‐> DistrictHeating tab needs to be adjusted. 5. Is the total amount of fuel being used within the energy system correct? 1 2 4 3 5 Figure 5‐1: Verifying the EnergyPLAN model is functioning accurately 28 Verifying Reference Model Data | A USERS GUIDE TO ENERGYPLAN March 4, 2009 6 Common Error Screens These are some of the common error screens that I saw during the time that I used EnergyPLAN, with a brief explanation of their cause. 6.1 Wrong Number of Data Points If you do not have 8784 data points within a distribution in your model, you will get an error that says “ is not a valid floating point value as shown in Figure 6‐1. You need to have 8784 data points so that there is a data point for each hour of the year (366 hours * 24 days). Figure 6‐1: Error that occurs with the wrong number of data points in a distribution | Common Error Screens 29 March 4, 2009 A USERS GUIDE TO ENERGYPLAN 6.2 Distribution File Location If the distribution file that you have used is not located in the Distributions folder that you downloaded with the EnergyPLAN model, you will receive an error that says File not found: location\distribution_name.txt as shown in Figure 6‐2. Figure 6‐2: Error that occurs when the distribution is placed in the wrong folder 30 Common Error Screens | A USERS GUIDE TO ENERGYPLAN March 4, 2009 7 Conclusions The EnergyPLAN model is extremely useful because it is simple. However, this simplicity creates a responsibility on the user to ensure that the data inputted is as accurate and applicable as possible. The time required to build the reference model is cumbersome as there is a lot of false‐paths along the way. However, the wave of possibilities that present themselves upon completion of the reference model, ensure that the time spent searching for data becomes a worthy experience. Once the reference model is completed, it is possible to build and analyse energy systems with endless quantities of renewable, conventional, storage and transport technologies, in a relatively short period of time. Hopefully upon completion of my study, I will be able to expand the benefits of EnergyPLAN even further. Finally, the level of detail discussed in this report is not necessary for every study completed using EnergyPLAN, especially in relation to the distributions used. Therefore, before spending a large period of time gathering data, ensure that the data is required for the accuracy of the results. | Conclusions 31 March 4, 2009 A USERS GUIDE TO ENERGYPLAN 8 References 1. 2. 3. 4. 5. 6. 7. 8. 9. 10. 11. 12. 13. 14. 15. 16. 17. 18. 19. 20. 21. 22. 23. Lund, H., 2009 EnergyPLAN: Advanced Energy System Analysis Computer Model. [cited 10th January 2009]; Available from: http://energy.plan.aau.dk/. The Danish Society of Engineers, The Danish Society of Engineers' Energy Plan 2030, 2006, http://ida.dk/sites/climate/introduction/Documents/Energyplan2030.pdf Lund, H. and B.V. Mathiesen, Energy system analysis of 100% renewable energy systems‐‐ The case of Denmark in years 2030 and 2050. Energy. In Press, Corrected Proof. Blarke, M.B. and H. Lund, The effectiveness of storage and relocation options in renewable energy systems. Renewable Energy, 2008. 33(7): p. 1499‐1507. Lund, H., Large‐scale integration of optimal combinations of PV, wind and wave power into the electricity supply. Renewable Energy, 2006. 31(4): p. 503‐515. Lund, H., Large‐scale integration of wind power into different energy systems. Energy, 2005. 30(13): p. 2402‐2412. SEI, 2009 Sustainable Energy Ireland. [cited 9th January 2009]; Available from: http://www.sei.ie/. International Energy Agency, Energy Balances of OECD Countries, 2008, http://www.iea.org/Textbase/publications/free_new_Desc.asp?PUBS_ID=2033 International Energy Agency, Energy Balances of Non‐OECD Countries, 2008, http://www.iea.org/Textbase/publications/free_new_Desc.asp?PUBS_ID=1078 Howley, M., B. Ó'Gallachóir, and E. Dennehy, Energy in Ireland 1990 ‐ 2007, 2008, http://www.sei.ie/Publications/Statistics_Publications/EPSSU_Publications/ Lund, H., Aalborg University, EnedrgyPLAN: Advanced Energy Systems Analysis Computer Model, 2008, http://energy.plan.aau.dk/manual.php Marine Institute, 2009 Irish Marine Weather Buoy Network. [cited 23rd February 2009]; Available from: http://www.marine.ie/home/publicationsdata/data/buoys/. Vestas, V90 ‐ 3.0 MW, 2007, http://www.vestas.com/en/wind‐power‐solutions/wind‐ turbines/3.0‐mw.aspx EirGrid, 2009 Welcome to EirGrid. [cited 9th January 2009]; Available from: http://www.eirgrid.com/. SEMO, 2009 The Single Electricity Market Operator. [cited 28th February 2009]; Available from: http://www.sem‐o.com/. Met Eireann, 2009 Degree Days. [cited 10th January 2009]; Available from: http://www.met.ie/climate/degree‐day.asp. The Chartered Institution of Building Services Engineers, Degree‐days: theory and application, 2006, http://www.cibse.org/index.cfm?go=publications.view&item=356 Department for Business Enterprise & Regulatory Reform, UK, Energy Trends: September 2008, 2008, http://www.berr.gov.uk/whatwedo/energy/statistics/publications/trends/index.html Sustainable Energy Ireland, Dwellings Energy Assesment Procedure: Version 3, 2008, http://www.sei.ie/Your_Building/BER/BER_Assessors/Technical/DEAP/ O'Leary, F., M. Howley, and B. Ó'Gallachóir, Sustainable Energy Ireland, Energy in the Residential Sector, 2008, http://www.sei.ie/Publications/Statistics_Publications/EPSSU_Publications/ Department of Communications, Marine and Natural Resources, Bioenergy Action Plan for Ireland, 2006, http://www.dcenr.gov.ie/NR/rdonlyres/6D4AF07E‐874D‐4DB5‐A2C5‐ 63E10F9753EB/27345/BioenergyActionPlan.pdf Sustainable Energy Ireland, Energy Balance 2007, 2008, http://www.sei.ie/Publications/Statistics_Publications/2007_Energy_Balance/ Nielsen, J.E., The Danish Society of Engineers' Energy Plan 2030: Solar Distribution, 2006, http://www.planenergi.dk/default.asp?id=16354 32 References | A USERS GUIDE TO ENERGYPLAN March 4, 2009 24. 25. 26. 27. 28. 29. 30. 31. 32. 33. 34. 35. 36. 37. 38. 39. SEI, Tidal and Current Energy Resources in Ireland, 2004, http://www.sei.ie/Publications/Renewables_Publications/ ESBI, All‐Island Grid‐Study: Renewable Energy Resource Assessment (Workstream 1), 2008, http://www.dcenr.gov.ie/Energy/North‐South+Co‐ operation+in+the+Energy+Sector/All+Island+Electricity+Grid+Study.htm Whittaker, T., et al., The potential for the use of marine current energy in Northern Ireland, 2003, http://www.detini.gov.uk/cgi‐bin/moreutil?utilid=41&site=99&util=2 Environmental Change Institute, University of Oxford, Variability of UK Marine Resources, 2005, http://www.carbontrust.co.uk/NR/rdonlyres/EC293061‐611D‐4BC8‐A75C‐ 9F84138184D3/0/variability_uk_marine_energy_resources.pdf Marine Institute, 2009 Marine Institute. [cited 10th January 2009]; Available from: http://www.marine.ie/Home/. NDBC, 2007 National Data Buoy Center Stations. [cited 17th February 2009]; Available from: http://www.ndbc.noaa.gov/to_station.shtml. Danish Energy Authority, Forudsætninger for samfundsøkonomiske analyser på energiområdet, 2009, http://www.ens.dk/sw80140.asp Mathiesen, B.V., Fuel cells and electrolysers in future energy systems, in Department of Planning and Development. 2008, Aalborg University: Aalborg. Mathiesen, B.V., Fuel Cells and Electrolysers in Future Energy Systems, in Department of Development and Planning. 2008, Aalborg University: Aalborg. Sustainable Energy Ireland, A Study on Renewable Energy in the New Irish Electricity Market, 2004, http://www.sei.ie/Publications/Renewables_Publications/ Danish Energy Authority, Technology Data for Electricity and Heat Generating Plants, 2005, http://www.energinet.dk/NR/rdonlyres/4F6480DC‐207B‐41CF‐8E54‐ BF0BA82926D7/0/Teknologikatalog050311.pdf Gonzalez, A., et al., Sustainable Energy Ireland, Study of Electrcity Storage Technologies and Their Potential to Address Wind Energy Intermittency in Ireland, 2004, http://www.sei.ie/Grants/Renewable_Energy_RD_D/Projects_funded_to_date/Wind/Study _of_Elec_Storage_Technologies_their_Potential_to_Address_Wind_Energy_Intermittency_i n_Irl/ Danish Energy Authority, Basisfremskrivning af Danmarks energiforbrug frem til 2025, 2008, http://www.ens.dk/graphics/Publikationer/Energipolitik/Basisfremskrivning_2007_170108/i ndex.htm CSO, Household Budget Survey 2004‐2005: Final Results, 2007, http://www.cso.ie/releasespublications/pr_hseholds.htm Lund, H., Aalborg University, EnergyPLAN: Advanced Energy Systems Analysis Computer Model, 2008, http://energy.plan.aau.dk/manual.php Lund, H., A Green Energy Plan for Denmark. Environmental and Resource Ecnomics, 1998. 14(3): p. 431‐439. | References 33 March 4, 2009 A USERS GUIDE TO ENERGYPLAN 9 Appendix A: Ireland’s EnergyBalance 2007 34 Appendix A: Ireland’s Energy‐Balance 2007 |