1
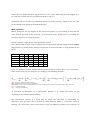
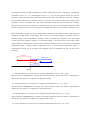
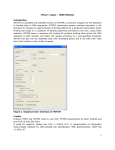
FITOM V1.0 USER MANUAL Introduction FITOM is a computer program for the detection of binding sites in DNA or RNA sequences. It implements several methods described in the literature to compute an approximation of binding affinity for a particular site based on a collection of binding sequences provided by the user. Using this method, FITOM scans a sequence file looking for putative binding sites across the DNA/RNA sequence in both strands, and filters the results according to a userspecified threshold. If sequence annotation is provided in the sequence file, FITOM will also link the identified sites with annotated genes and it will infer their role from their location in the vicinity of genes. Getting started In its current version (v1.0), FITOM is a command-line argument program, meaning that it must be run from a DOS prompt. Since it requires a file to scan and a collection of binding sites, these are the only mandatory command-line arguments of FITOM. Thus, the program can be run from the DOS prompt by typing: C:\>FITOM Sequence_file.ext Collection_file.ext The sequence file The sequence file (Sequence_file.ext) is the file containing the sequence or sequences the user wants to scan. These files can be in two possible formats: FASTA and GenBank, carrying the respective extensions. FASTA files should contain a first definition line, beginning with a ‘>’ character, and the sequence thereafter, starting on the second line, and typically wrapped on 70-char lines. FITOM does not require 70-char wrapping, but does require that the first line be strictly the definition line. If the FASTA file comes from NCBI, FITOM will try to extract locus and name information from the definition line. If it does not succeed, it will use the whole definition line as both locus and name for the organism/sequence under study. GenBank files contain both the sequence and annotation information, and they should be used preferentially, as their analysis will convey additional information on the putative function of identified sites. FITOM will infer file type from the file name extension. Accepted extensions are: FAS/FNA for FASTA files and GBK/GB for GenBank files. If your file does not carry any of these extensions please rename it accordingly before use. Only once sequence per file is accepted for GenBank format, while multiple sequences per file are allowed in FASTA format. The collection file The collection file (Collection_file.ext) is the file containing the collection of known binding sites that the user provides the program with in order to construct its model of binding site, or motif. Collection files can be either bare site files (with aligned sites on consecutive lines) or FASTA files, in which each site line is preceded by an identification line beginning with ‘>’. As in the case of sequence files, FITOM will infer file type from the file name extension. Accepted extensions are: FAS/FNA for FASTA files and TXT for bare site files. If your file does not carry any of these extensions please rename it accordingly before use. Specifying options Running FITOM with only two command line arguments, as described above, will issue a user warning stating that no options file name was provided and that the program will be running in default options mode. An options file can be made available to FITOM by setting it as a third command line argument: C:\>FITOM Sequence_file.ext Collection_file.ext Options_file.ext The options file All options can be set in the options file. The options file (Options_file.ext) is a simple text file containing all the advanced options. If a sample options file was not present with your distribution, please contact the developers. Options are set simply by assigning each parameter with a positive integer value in a single line preceded by a $ sign. All other text is considered to be comments and is discarded by the program. A sample of the options file can look like this: OPTIONS: - 1 - Log results (1 - yes, 0 - no) $1 - 2 - Method (1-8, see documentation for details) $5 … where the first option (boolean log) would be set to 1 (yes), indicating that file logging is to be conducted, while the second option (method) is set to 5. All options can be set this way, following always the same ordering, which is the one used in describing each option in the following pages. Main operation Before going into the description of the advanced options, it is interesting to describe the main modus operandi of the program. As mentioned above, FITOM starts by loading the provided sequence and collection files. Position-specific weight matrix and information content The collection file is then used to compute the motif position-specific weight matrix (PSWM). This matrix is a matrix of the relative frequencies of each nucleotide at each position in the motif: 1 2 3 4 5 6 A 0.031 0.055 0.650 0.349 0.309 0.007 C 0.928 0.015 0.015 0.071 0.158 0.007 G 0.007 0.206 0.166 0.031 0.079 0.976 T 0.031 0.722 0.166 0.547 0.452 0.007 Consensus C T A T T G From the positions specific weight matrix, the information content (Rsequence) or redundancy index of the motif can be computed, according to the following formula: L L L ⎛ ⎡ ⎤ Rsequence = ∑ I (l ) = ∑ (H before (l ) − H after (l ) ) = ∑ ⎜ ⎢− ∑ ( f ( S )·(log 2 ( f ( S ) ))⎥ − ⎜ l =1 l =1 l =1 ⎝ ⎣ S ∈Ω ⎦ ⎡ ⎤⎞ ⎢− ∑ ( p ( S l )·log 2 ( p ( S l ) ))⎥ ⎟⎟ ⎣ S l ∈Ω ⎦⎠ f(S) – frequency of base S in the genome p(S) – frequency of base S in the motif PSWM (FITOM adds 10-100 to each motif frequency to avoid 0·log(0) terms for bases not represented in the collection) Hbefore – a priori entropy Hafter – entropy after binding as described by Schneider et al. (Schneider, Stormo et al. 1986) and based on the assumption of positional independency. The information content of a motif tells us about the reduction in uncertainty we experience once we know that a protein (or other element) binds to a sequence. Prior to binding, our uncertainty about what bases occupy the different positions of a sequence is maximal, and dictated by the base composition of the genome. Once we know that the protein associated with the provided motif binds that sequence, however, we have much less uncertainty about what bases occupy the different positions. We still have uncertainty, because protein binding is a noisy issue, but we have decreased our uncertainty and, thus, we can say we have gained information. Conversely, seen from the point of view of a genome, the information content can also be seen as the loss of entropy at certain regions in the genome, from an initial random state to a state of fixation of conserved binding sites. Thus, motif information content can also be as an index of the level of redundancy (RI) in the different positions of the motif (O'Neill 1998). Even though without a complete theoretical justification, a different index termed relative entropy (RE) has been proposed to substitute the RI in cases of heavily skewed genomes: ⎛ ⎛ p ( Sl ) ⎞ ⎞ ⎟⎟ ⎟⎟ RE (l ) = ∑ ⎜⎜ p ( Sl )·log 2 ⎜⎜ ( ) f S S ∈Ω ⎝ ⎝ ⎠⎠ Relative entropy (Schneider, Stormo et al. 1986) is also computed by FITOM and can be used in different ranking methods. Ranking methods Rsequence tells us how much information our motif conveys, but it does not provide answers to how well a particular sequence fits in the motif profile, which is what is required to scan for and rank putative binding sites. Several ranking methods have been proposed with diverse degrees of theoretical justification. FITOM provides two basic scoring methods that can be used to rank putative binding sites. The sequence information content (Ri) (Schneider 1997) is a method derived from the information content (Rsequence) formula that scores each position of a particular site (j) based on ratio of frequency in the motif with respect to genomic frequency for the particular base observed in the site: ⎛ ⎛ p( S l j ) + 1 / N ⎞ ⎞⎤ ⎡ ⎤ ⎡ ⎟⎟ ⎟⎥ Ri = I j (l ) = ⎢− ∑ ( f ( S )·(log 2 ( f ( S ) ))⎥ − ⎢− log 2 ⎜⎜ ⎜⎜ ⎟ 1 4 / N + ⎠ ⎠⎥⎦ ⎣ S∈Ω ⎦ ⎢⎣ ⎝ ⎝ (1/N)/(1+4/N) is the zero-frequency correction following Laplace Law of Succession to estimate the frequency of a base present in a sequence and not present in the collection. N is the number of sequences in the collection. Another proposed method is the Berg-von Hippel Heterology Index (HI), based on the relative frequency of the observed base with respect to the dominant (consensus) base at each position (Berg and von Hippel 1987): L ⎛ P (l ) + 1 / N ⎞ ⎟⎟ BvH = HI = ∑ ln⎜⎜ cons l =1 ⎝ P (lobs ) + 1 / N ⎠ 1/N is again a correction factor for bases with zero frequencies in the collection As a result of their formulation, both ranking methods discard information from the other motif base frequencies. As explained in (O'Neill 2003), this can lead to erroneous scoring, where the same score may be given to little or heavily conserved positions since information about the redundancy of each position (the information from the rest of bases at that position discarded by both methods) is not used. To correct this, O’Neill proposed averaging this kind of methods with the know redundancy index of the collection (O'Neill 1989), so that the final score was given by: L Rsequence ·BvH = ∑ Rsequence (l )·BvH (l ) l =1 L Rsequence ·Ri = ∑ Rsequence (l )·Ri (l ) j l =1 An even more interesting approach was also proposed by O’Neill to solve some of the different problems of the methods described above. The differential Rsequence (R’sequence) is a method to score putative binding sites based on the successive evaluation of the Rsequence before (Rsequence -) and after (Rsequence +) assuming that the site is a member of the collection. − ( + − Rsequence ' (l ) = Rsequence (l )· Rsequence (l ) − Rsequence (l ) ) Computing then the difference between both Rsequence values provides a measure of how well does the putative site sit within the collection. If the site does not agree with the motif profile generated by the collection, the expanded Rsequence (Rsequence+) will decrease with respect to Rsequence- and the difference will be negative. Conversely, if the site agrees well with the motif profile, Rsequence+ will increase and the difference will be positive. Cut-off and tagging A priori, every subsequence of the same size as the motif is a putative binding site. Therefore, as FITOM scans the sequence, it must discard false positive sites and save only what it considers true positives. This is done using one of the ranking methods described above and a threshold that, again, is provided by the user. Since the specific cut-off value depends on the method, it is often more convenient to specify it using a relative threshold. This value, in the [0-1] range, specifies how many sites from the original collection should be above the cut-off value. Therefore, if the relative threshold is 0.5, a cut-off value will be chosen by FITOM so that, assuming a normal distribution, only 50% of the collection sites is above the threshold. If available in the sequence GenBank file, FITOM will also gather information on the location of genes in the genome. Using this information and the position of identified binding sites, FITOM will correlate the results in order to link sites to genes. Following userdefined limits, FITOM will assign different tags to sites, labeling them as operators (within limits), intragenic (within coding region) or intergenic (between genes) Results FITOM will save the results of the analysis into a comma-separated value (CSV) file (Sequence_file_name)_(method)_(threshold).csv that can be opened directly with spreadsheet software such as Ms Excel. The results file contains the identified binding sites, together with their score, position and strand. In case gene information is available, the results file will also contain a site tag, the distance from site to gene start, and basic gene information. For more than one sequence, the results file will be divided into consecutive sequences separated by a sequence-name row. At the end of the file, the total number of sequences and sites, as well as the a priori entropy, selected method and threshold are displayed. Advanced options 1 - Log option The log option (1 - yes, 0 - no) simply determines whether the program should log partial results during operation. If the log option is set, FITOM will generate the following files: (Sequence_file_name)_seqs_log.txt contains the read DNA sequences; can be used to extract the DNA sequence in FASTA format from a GenBank source. (Sequence_file_name)_site_collection_log.txt contains the read site collection in FASTA format (Sequence_file_name)_genes_log.csv contains the list of genes read from an annotated GenBank file (Sequence_file_name)_freq_table.csv contains the frequency table constructed for the read site collection, and the computed positional information content (Sequence_file_name)_motif_score_log.csv contains the list of read sites and the score associated to each of them, as well as the cutoff value (Sequence_file_name).log displays incidences on the program run FITOM will also generate a Fitom.log file if any problem is encountered while reading files and the program must stop. 2- Method option The method option allows the user to choose between the different methods described above. This is a numerical parameter that, in version 1.0, accepts values from 1 to 8. The different values chose the following methods: 1. Information content of a individual DNA sequence (Ri) 2. Berg & von Hippel Heterology Index (HI) 3. Rsequence averaged Berg & von Hippel Heterology Index Rsequence·BvH 4. Rsequence averaged differential Rsequence (Rsequence’) 5. Rsequence averaged individual sequence information content (Rsequence·Ri) 6. PredictRegulon Index The index described in (Yellaboina, Seshadri et al. 2004) for the PredictRegulon server. 7. RE averaged individual sequence information content (RE·Ri) The same as Rsequence·Ri but using relative entropy (RE) instead of information content (Rsequence) as the averaging factor. 8. Differential RE (RE’) The same as Rsequence’ but using relative entropy (RE) instead of information content (Rsequence). 9. Iseq Derives from RE in the same way as Ri derives from Rsequence. Described in (Hertz, Hartzell et al. 1990). 10. FitomHI (RE’) A modification of Berg & von Hippel heterology index (HI) to truly account for the divergence between consensus and observed bases. 11. Differential Rsequence (Non-weighted Rsequence’) A modification of the differential Rsequence method to converted into a non-weighted method. 3 - Background entropy option In computing the background entropy Hbefore, several authors have proposed assuming equiprobability [Hbefore=2 bits], irrespective of the genome composition, on the argument that a protein does not know about genome composition in skewed genomes and, hence, its a priori uncertainty should be assumed to be maximal (Schneider, Stormo et al. 1986). Even though the argument can be disputed, mainly because the protein will have also evolved in the skewed genome, FITOM allows the user to specify whether to use a fixed 2 bits background entropy (0) or to derive it from genome composition (1). In case of a FASTA file with multiple sequences, FITOM will assume that Hbefore is 2 bits, regardless of this option’s setting. 4 - Threshold The value introduced in the threshold option can specify two different parameters, depending on the setting of option 9. If option 9 is set to 0 (no literal cut-off), FITOM will use the value specified in this option (0-1) as a threshold relative to the collection of sites provided by the user. FITOM will assume that the provided collection of binding sites has a normal distribution of scores and will determine the (method-dependent) cut-off that selects the percentage of sites from the collection indicated by the user through this parameter. If option 9 is set to 1 (literal cut-off), FITOM will use the value provided in option 4 as the cut-off for the chosen method. 5 - Distance to promoter option If available, identified sites are tagged with gene information. An important parameter in this tagging, in order to further filter the results provided by FITOM, is to determine whether a particular site may or may not be an operator (i.e. a site involved in promoter regulation). Since known prokaryote operator sequences fall within a range of the translational start point, FITOM relies on two user-provided parameters: the distance to promoter and the distance in-gene presets. The first makes reference to the maximum distance a site can be upstream of the gene translational start point in order to tag it as operator. The default is 350 bp. 6 - Distance in-gene option This second distance parameter (see above) makes reference to the maximum distance a site can be downstream of the gene translational start point in order to tag it as operator. The default in this case is 100 bp. 7 - Sorting method option Results can be sorted according to two main parameters of identified binding sites: their position within the genome (0) or their ranking (1). Results can later be resorted in Excel. 8 - Remove redundant matches option Since the sequence is scanned in both strands, for palindromic motifs a same site will be located in both scans. In some cases, if the site is particularly good, both versions will be picked up as positive results, leading to duplicity of results. The remove redundant matches option allows the user to remove (1) or not (0) these duplicate sites. Duplicate removal proceeds based on a best-ranking policy: among the two versions of the same site, only the better scoring one will be preserved. 9 - Literal cut-off option This option allows the knowledgeable user to introduce a literal cut-off (instead of a relative, percentual threshold). If the option is set (1), will use FITOM the value set in the threshold option as a literal cut-off, instead of as a relative threshold. Default options If an options file name is not specified, FITOM will use a set of predefined option values. These default values are listed below: Log option: true (1) – Additional log files will be saved Method: RI averaged BvH (3) – Default method Background entropy: false (0) – Background entropy not computed Threshold: 0.8 (relative threshold) – Threshold at 80% of collection sites Promoter distance: 350 bp – 350 bp max distance upstream of ATG for operator site In-gene distance: 100 bp – 100 bp max distance downstream of ATG for operator Sort option: false (0) – Sort results by genomic position Remove redundant matches: true (1) – Redundant matches will be removed Literal cut-off: false (0) – Threshold value will be used as relative threshold CHANGES IN VERSION 1.2 Version 1.2 is a major update of FITOM to take into account local complexity (in the form of signal overrepresentation) in the detection of binding sites. The idea, developed initially for bacterial promoter detection, is based on the proposed hypothesis that RNA-polymerase (and other DNA-binding proteins) may use weak binding sites upstream of true promoters to improve its promoter-seek dynamics, as 3D diffusion appears to be too limiting to account for the efficiency of RNA-polymerase in transcription (Berg, Winter et al. 1981; Ricchetti, Metzger et al. 1988; Halford and Marko 2004). Thus, to validate this hypothesis, FITOM was updated to compute the mean score (ranking) of sites in intervals both upstream and downstream of the site under evaluation, so that the current site score could be corrected according to a local complexity measure that took into account the presence of nearby pseudo-sites (integrative correction). Main operation In version 1.2 FITOM proceeds normally and scans the sequence in both strands, but it does so using a look-ahead method. This means that FITOM will pre-compute the mean score of upstream and downstream regions for the first sequence position (assuming circular DNA). This is called the pre-run. Once this initial means have been computed, FITOM scans the sequence and adds the new score to the current means. The site under evaluation then changes to the middle site in the mean-computing interval. A relaxed threshold is used to allow a substantially larger number of candidate sites, which are saved together with the mean values of their surroundings. Once the sequence has been scanned, selected sites are re-evaluated by multiplying their score with a correction factor derived from a ratio between means (e.g. upstream/downstream mean). Additional advanced options The integrative factor correction (as it is called in FITOM) described above can naturally be turned on or off and is completely user-customizable. The following describes the different options added to FITOM and their role in program operation: 10 – Integrative factor This option indicates whether FITOM operates in normal (0) or integrative (1) mode. When in normal mode, FITOM works in the way explained above for version 1.0. In integrative mode, FITOM computes four mean values: local mean [-max(X,Y), +max(X,Y)], upstream mean [-X, -x], downstream mean [+y, +Y] and the global mean for all the sequence. The intervals can be freely specified by the user. For instance, one may compute the upstream mean from positions -200 to +50 of the site, and the downstream mean from positions +100 to +500 from site. The only restriction is that the intervals may not overlap. The local mean interval is always site-symmetrical and covers the maximum distance from the site specified by the user; in the above example it would cover the [-500, +500] interval. After computing the pre-run mean, FITOM starts analyzing the genome with a look-ahead of max(X,Y). In this mode of operation, the cut-off value usually applied to putative sites is relaxed using a user-determined constant. After scanning the sequence, the sites with scores above the relaxed cutoff are re-evaluated using a correction factor that takes some of the computed means into account. Three different modes of score correction are possible: (upstream mean / global mean), (upstream mean / local mean), (upstream mean / downstream mean). In all of them, the original score is multiplied by one of the above fractions. UpLeftDist DwRightDist UpRightDist DwLeftDist Site 11 – Further distance of current site to compute upstream mean (+/- X) -> [X,Y] This parameter (UpLeftDist) controls the farthest distance (from site under evaluation) in which the user wants to compute the upstream mean. 12 – Closer distance of current site to compute upstream mean (+/- Y) -> [X,Y] This parameter (UpRightDist) controls the closest distance (from site under evaluation) in which the user wants to compute the upstream mean. 13 – Further distance of current site to compute downstream mean (+/- I) -> [I,J] This parameter (DwRightDist) controls the farthest distance (from site under evaluation) in which the user wants to compute the downstream mean. 14 – Closer distance of current site to compute downstream mean (+/- J) -> [I,J] This parameter (DwLeftDist) controls the closest distance (from site under evaluation) in which the user wants to compute the downstream mean. 15 – Relaxation constant This parameter controls the degree to which the normal threshold (specified either as relative or literal cutoff) is relaxed in integrative mode. Threshold relaxation is required for the integrative mode to introduce new information to ranking. Else, the method would only re-rank the sites already detected in normal operation. The default relaxation constant is 1.5. Bigger relaxation constants will provide the integrative mode with additional freedom to choose sites based on their integrative component (a larger pool of candidate sites will be rescored), while smaller constants will reduce the contribution of the integrative factor. Care should be taken in specifying very big (>2) relaxation constants when analyzing large files, since this could result in a very large amount of sites selected for rescoring, which may lead to slow runs and, in extreme cases, out of memory errors. 16 – Rescoring method The rescoring method option (1-3) allows the user to specify the method that will be applied to rescore candidate sites in integrative mode. Three methods are available in FITOM to rescore sites, which differ on the fraction they apply as a multiplicative correction factor: 1 – Upstream mean / global mean 2 – Upstream mean / local mean 3 – Upstream mean / downstream mean By combining this option with interval definition (options 11-14), many different reevaluation strategies may be assayed. For instance, if one is interested in obtaining the local/global mean, a suitable upstream region is defined as the intended local mean, regardless of the downstream interval, and method 1 is used. Default advanced options As with normal options, if an option file is not provided FITOM will set options to the following default values: Integrative factor: true (0) – FITOM will not run in integrative mode UpLeftDist: -200 – Farthest distance from site to compute upstream mean UpRightDist: 50 – Closest distance from site to compute upstream mean DwLeftDist: 250 – Closest distance from site to compute downstream mean DwRightDist: 850 – Farthest distance from site to compute downstream mean Relaxation constant: 1.5 – Cut-off will be relaxed (multiplied) by 1.5 Rescoring method: 2 – Scores will be reevaluated multiplying by the upstream/local mean ratio References Berg, O. G. and P. H. von Hippel (1987). "Selection of DNA binding sites by regulatory proteins : Statisticalmechanical theory and application to operators and promoters." J Mol Biol 193(4): 723-743. Berg, O. G., R. B. Winter, et al. (1981). "Diffusion-driven mechanisms of protein translocation on nucleic acids. 1. Models and theory." Biochemistry 20(24): 6929-48. Halford, S. E. and J. F. Marko (2004). "How do site-specific DNA-binding proteins find their targets?" Nucleic Acids Res 32(10): 3040-3052. Hertz, G. Z., G. W. Hartzell, 3rd, et al. (1990). "Identification of consensus patterns in unaligned DNA sequences known to be functionally related." Comput Appl Biosci 6(2): 81-92. O'Neill, M. C. (1989). "Consensus methods for finding and ranking DNA binding sites. Application to Escherichia coli promoters." J Mol Biol 207(2): 301-10. O'Neill, M. C. (1998). "A general procedure for locating and analyzing protein-binding sequence motifs in nucleic acids." Proc Natl Acad Sci U S A 95(18): 10710-5. O'Neill, M. C. (2003). "A procedure for identifying loosely conserved protein-binding DNA sequences." Methods Enzymol 370: 229-37. Ricchetti, M., W. Metzger, et al. (1988). "One-Dimensional Diffusion of Escherichia coli DNA-Dependent RNA Polymerase: A Mechanism to Facilitate Promoter Location." Proc Natl Acad Sci U S A 85(13): 4610-4614. Schneider, T. D. (1997). "Information Content of Individual Genetic Sequences." Journal of Theoretical Biology 189(4): 427-441. Schneider, T. D., G. D. Stormo, et al. (1986). "Information content of binding sites on nucleotide sequences." J Mol Biol 188(3): 415-31. Yellaboina, S., J. Seshadri, et al. (2004). "PredictRegulon: a web server for the prediction of the regulatory protein binding sites and operons in prokaryote genomes." Nucleic Acids Res 32(Web Server issue): W318-20.