1
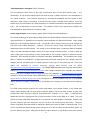
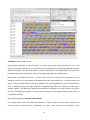
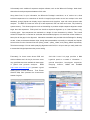
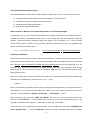
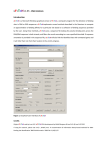
BSC4933/5936(5) Intro’ to BioInfo’ Lab #6
BSC4933/5936: Introduction to Bioinformatics
Laboratory Section: Tuesdays from 3:45 to 5:45 PM.
Gene Finding Strategies
Week Six, Tuesday, September 30, 2003
Author and Instructor: Steven M. Thompson
How are coding sequences recognized in genomic DNA?
After the sequencing’s done, and the fragments have all been assembled, and preliminary
database searches have been run, what’s next?
What more can we learn about a
nucleotide sequence? Searching by signal versus searching by content, i.e. transcriptional
and translational regulatory sites and exon/intron splice sites, versus 'nonrandomness,'
codon usage; and homology inference. Understanding the concepts and limitations of the
methods and differentiating between the approaches.
Steve Thompson
BioInfo 4U
2538 Winnwood Circle
Valdosta, GA, USA 31601-7953
[email protected]
229-249-9751
¥
®
GCG is the Genetics Computer Group, part of Accelrys Inc., a subsidiary of Pharmacopeia Inc.,
®
producer of the Wisconsin Package for sequence analysis.
” 2003 BioInfo 4U
2
Nucleic Acid Characterization: Recognizing Coding Sequences
Standard disclaimer
I write these tutorials from a ‘lowest-common-denominator’ biologist’s perspective. That is, I only assume that
you have fundamental molecular biology knowledge, but are relatively inexperienced regarding computers.
As a consequence of this they are written quite explicitly. Therefore, if you do exactly what is written, it will
work. However, this requires two things: 1) you must read very carefully and not skim over vital steps, and 2)
you mustn’t take offense if you already know what I’m discussing. I’m not insulting your intelligence. This
also makes the tutorials longer than otherwise necessary. Sorry.
I use three writing conventions in the tutorials, besides my casual style. I use bold type for those commands
and keystrokes that you are to type in at your keyboard or for buttons or menus that you are to click in a GUI.
I also use bold type for section headings. Screen traces are shown in a ‘typewriter’ style Courier font
and “////////////” indicates abridged data. The arrow symbol (>) indicates the system prompt and
should not be typed as a part of commands. Really important statements may be underlined.
As you’ve learned, specialized X-server graphics communications software is required to use GCG’s SeqLab.
I’ll remind you of a few user hints while using X: X Windows are only active when the mouse cursor is in that
window, and always close X Windows when you are through with them to conserve system memory.
Furthermore, to activate X items, just <click> on them, rather than holding your mouse button down. Also, X
buttons are turned on when they are pushed in and shaded. Finally, don’t close X Windows with the X-server
software’s close icon in the upper right- or left-hand window corner, rather, always, if available, use the
window’s own “File” menu “Exit” choice, or “Close,” or “Cancel,” or “OK” button.
Introduction
What sort of information can be determined from a genomic sequence?
Easy
restriction digests and associated mapping; e.g. software like the Wisconsin Package’s Map,
MapSort, and MapPlot.
Harder
fragment assembly (e.g. Week Four’s GCG FAS) and genome mapping; like packages from
the University of Washington’s Genome Center (http://www.genome.washington.edu/),
Phred/Phrap/Consed (http://www.phrap.org/) and SegMap, and The Institute for Genomic
Research’s (http://www.tigr.org/) Lucy and Assembler programs.
Very hard gene finding and sequence annotation. This will be the topic of today’s tutorial and is a
primary focus of current genomics research.
Easy
forward translation to peptides.
Hard again genome scale comparisons and analyses.
3
How are encoded proteins recognized in uncharacterized eukaryotic, genomic DNA? Translating from all
translational start codons to all ‘nonsense’ chain terminating, stop codons in every frame produces a list of
ORFs (Open Reading Frames), but which of them, if any, actually code for proteins? And this only works in
organisms without exons and introns. Three general solutions to the gene finding problem can be imagined:
1) all genes have certain regulatory signals positioned in or about them,
2) all genes by definition contain specific code patterns, and
3) many genes have already been sequenced and recognized in other organisms so we can infer
function and location by homology if our new sequence is similar enough to an existing sequence.
All of these principles can be used to help locate the position of genes in DNA and are often known as
“searching by signal,” “searching by content,” and “homology inference” respectively.
Homology inference can be very helpful, but what happens in the case where no similar proteins can be found
in the databases, and even if homologues can be found, discovering exon-intron borders and UTRs (5’ and 3’
untranslated regions) can be very difficult. If you have cDNA available, then you can try to align it to the
genomic in order to ascertain where the genes lay, but even this can be quite difficult and cDNA libraries are
not always available. No one method is absolutely reliable, but one seldom has the luxury of knowing the
complete amino acid sequence to the protein of interest and simply translating DNA until the correct pieces
fall out. This is the only method that would be 100% positive. Since we are usually forced to discover just
where these pieces are, especially with genomic DNA, computerized analysis becomes invaluable.
DNA needs to be very special in order to encode genes. It must have regulational “switches” to turn things on
and off, and most eukaryotic DNA must have “signals” that indicate the beginnings and ends of exons and
introns. Coding regions must have certain periodicities and patterns. These constraints arise in a number of
ways — the three base genetic code, the ‘wobble’ hypothesis, an unequal use of synonymous codons,
translational factors, the amino acid content of the encoded proteins themselves, and, possibly, because of
remnants of an ancient genetic code. The problem all comes down to figuring out all of your DNA’s URFs and
ORFs — what’s the difference? Do any of them actually code for a protein?
URF
Unidentified Reading Frame — any potential string of amino acids encoded by a stretch of DNA.
Any given stretch of DNA has potential URFs on any combination of six potential reading frames,
three forward and three backward.
ORF
Open Reading Frame — by definition any continuous reading frame that starts with a start codon
and stops with a stop codon. Not usually relevant to discussions of genomic eukaryotic DNA, but
very relevant when dealing with mRNA/cDNA or prokaryotic DNA.
The first order of business is to translate all six reading frames of the sequence because there is no way of
knowing where any genes may lay upon it. DNA often has genes on opposite reading frames. This will
generate all URFs as opposed to ORFs. This is an especially important distinction when dealing with
4
organisms that have exons and introns, since many exons will not begin with a start codon (only the first will
necessarily begin with one); therefore, URFs are the more appropriate choice for most genomic eukaryotic
sequences. After that’s done we can see that there are many potentially translated stretches, so what? What
can be done with them; how can we turn them into potential genes?
Signal searching: Signal searches look for transcriptional and translational features.
Typical signals to look for are promoter and terminator consensus sequences and repeat regions. GCG
provides a searching program named Terminator for looking for terminator sites in prokaryotic rhoindependent cases; however, promoter signals from both prokaryotes and eukaryotes are so varied that they
do not have a ‘canned’ search for them. An impressive eukaryotic transcription factor consensus sequence
database has been assembled though, and prokaryotic promoter sequences are fairly well characterized. We
can utilize the Wisconsin Package program FindPatterns to look for these type of sites within our sequence.
GCG also provides the ability to find short consensus patterns based on a family of related sequences using
weight matrix analysis with the programs Consensus and FitConsensus. These can be used to form and
search for specific promoters or other signals based on known sequences. Also, many termination sites are
accompanied by inverted repeats, and enhancer sequences are often strong direct repeats; because of these
points, the GCG programs StemLoop and Repeat, as well as dotplot procedures, may be helpful.
Start sites
Transcriptional regulatory sites such as promoters and other transcription factor and enhancer binding
sequences can help identify the beginnings of genes; however, some of these motifs can be quite distant from
the actual start of transcription. The prokaryote Shine-Dalgarno consensus, (AGG,GAG,GGA)x{6,9}ATG
(Stormo et al., 1982), based on complementarity to 16s rRNA, obviously relates to translation initiation, as
does the methionine start codon itself. Eukaryote ribosomes seem to initiate translation at the first AUG
encountered following the modified guanosine 5’ cap and do not appear to be based on 18s complementarity.
Kozak (1984) has compiled a Eukaryote start consensus of cc(A,g)ccAUGg that seems to hold true in many
situations. However, matters can be complicated by alternative start codons; AUG works in about 90% of
cases, but there are exceptions in some prokaryotes and organellar genomes.
Exon-Intron junctions
Well-characterized splice site donor-acceptor consensus sequences can point to intron-exon borders. The
exon-intron junction has the following consensus structure around its donor and acceptor sites:
Donor Site
Acceptor Site
Exonبææææææææææææ Intron æææææææææææÆØExon
A64G73G 100T 100A62A68G84T63
. . . 6Py74-87NC65A 100G 100N
5
The splice cut sites occur before a 100% GT consensus at the donor site and after a 100% AG consensus at
the acceptor site. GCG’s weight matrices for these sites do not start at the cut site, rather they start a varying
distance upstream of it!
End sites
Transcriptional terminator and attenuator sequences can help identify gene ends, as do the chain termination
‘nonsense’ (stop) codons. The GCG program Terminator will find about 95% of all prokaryotic factorindependent terminators.
This is great odds for any computer algorithm; even its namesake Arnold
Schwarzenegger would have a hard time matching this! But that’s only for prokaryotes. The sequence
YGTGTTYY has been reported as a eukaryotic terminator consensus (McLauchlan et al., 1985 [this is the
consensus from the weight matrix listed below]) and the poly(A) adenylation signal AAUAAA is well conserved
(Proudfoot and Brownlee, 1976). However, exceptions can be found, especially in some ciliated protists and
due to eukaryote suppresser tRNAs. The GCG programs StemLoop and Repeat may also provide some
regulatory insight since many eukaryotic terminators have hairpin structures associated with them and some
enhancer sequences contain strong direct repeats. It’s all quite complicated. Nothing is as simple as it could
be in biology, and most signal searches, even a sophisticated two-dimensional approach like Terminator, find
too many false positives, in other words they are not discriminatory enough. Just like Schwarzenegger in T2,
a few innocents always manage to get in the way.
All of these types of signals can help us recognize coding sequences; however, realize the inherent problems
of consensus searches. A major problem is simple one-dimensional consensus pattern type searching is
often either overly or insufficiently stringent because of the variable and loosely defined nature of these types
of sites. An advantage is they are quick and easy. Two-dimensional weight matrix approaches can be much
more powerful and sensitive, but they are not nearly as easy to set up in most sequence analysis packages.
Both types of signal searches pinpoint exact locations on the DNA strand. A main point consensus type
searches emphasize is “Don’t believe everything your computer tells you!” (von Heijne, 1987a). A computer
can provide guidance and insight but the limitations can sometimes be overwhelming.
One-dimensional signal searching
The Wisconsin Package’s FindPatterns program provides a simple consensus style pattern-matching tool.
I have written and placed the prokaryote promoter consensus pattern, TTGACwx{15,21}TAtAaT, based on the
E. coli data of Hawley and McClure (1983) in the GCG logical directory location GenMoreData:promoter.dat
that encompasses both the -35 and -10 regions. The Pribnow box pattern file follows so that you can see it’s
format and content:
The standard E. coli RNA polymerase promoter "Pribnow" box file for the program
FINDPATTERNS. This pattern includes both the -35 & the -10 region. For an
incredibly extensive list of eukaryotic transcription factor recognition sites
see the GCG public datafile tfsites.dat. To specify one of these files use the
command line option -data=_datafile_name.
6
Name
Offset
Pribnow
1
Pattern
Overhang
TTGACwx{15,21}TAtAaT
0
Documentation
..
!Hawley & McClure (1983)
As mentioned above, another signal that can be looked for in a similar fashion is the prokaryote ShineDalgarno translational initiation, ribosome binding site, (AGG,GAG,GGA)x{6,9}ATG (Stormo et al., 1982).
However, the prokaryote patterns won’t do us much good on eukaryotic sequences.
An impressive
eukaryotic transcription factor consensus sequence database (TFSites.Dat, Ghosh, 1990 and 2000) is
available in the GCG logical directory location GenMoreData:tfsites.dat. Using this database is the same idea
as looking for protein motifs in Bairoch’s PROSITE Dictionary; however, with TFSites we are not looking for
signatures that identify function or structure, rather we are looking for signatures that identify the binding of
various cataloged transcription factors to DNA. FindPatterns can look for these type of sites. But always
beware of the inherent problem of one-dimensional approaches: they are usually not discriminatory enough,
i.e. in addition to finding the true positive sites they find lots of false positives as well.
A Better Way: Two-dimensional weight matrix signal searching and GCG’s FitConsensus
Just as Profile Analysis provides a more robust method of searching for protein sequence similarities,
FitConsensus provides a more robust nucleotide searching technique with a matrix approach. However,
FitConsensus does not incorporate variable weighting depending on positional conservation like profile
analysis does, nor does it allow gapping to occur within its pattern. However, these types of patterns probably
should not be allowed to gap anyway, and all positions of the pattern may be almost equally important, since
the patterns are generally quite small.
GCG has pre-assembled consensus weight matrices of the donor and acceptor site sequences at exon-intron
splice junctions for use with FitConsensus available in their public data files. However, they do not provide
any others; therefore, I have reformatted the four weight matrix descriptions of eukaryotic RNA polymerase II
promoter elements reported by Bucher (1990) into a form appropriate for the Wisconsin Package.
Additionally, McLauchlan et al. (1985) assembled a eukaryotic terminator weight matrix that I have
reformatted for GCG use. I have placed all of these files in GCG’s logical directory location GenMoreData on
the FSU GCG server. They have the file names tata.csn, cap.csn, ccaat.csn, gc.csn, and terminator.csn.
Specifically, take a look at the donor.csn file. The matrix describes the probability at each base position to be
either A, C, U, or G, in percentages. I indicate the cut site and the 100% GT consensus below:
CONSENSUS from: Donor Splice site sequences
from Stephen Mount NAR 10(2) 459;472 figure 1 page 460
Exon
%G
%A
%U
%C
Total
Intron
Ø
20
30
20
30
9
40
7
44
11
64
13
11
74
9
12
6
100
0
0
0
0
0
100
0
29
61
7
2
12
67
11
9
84
9
5
2
9
16
63
12
18
39
22
20
20
24
27
28
140
140
140
140
140
140
140
140
140
140
137
137
7
CONSENSUS sequence to a certainty level of 75 percent at each position:
Length: 12 bp
1- 12
11-JUL-83
13:34
Check: 6055
..
VMWKGTRRGW HH
Even though this is a standard GCG sequence format file, suitable as input anywhere you are asked for a
sequence, the FitConsensus program reads the matrix, not the sequence. Notice the location of the 100%
GT requirement; the splice cut occurs right before this, not four bases away at the beginning of the matrix!
Next, the acceptor.csn file:
CONSENSUS of: Acceptor.Dat. IVS Acceptor Splice Site Sequences
from Stephen Mount NAR 10(2); 459-472 figure 1 page 460
Intron
%G
%A
%T
%C
15
15
52
18
Total 114
Exon
Ø
22
10
44
25
10
10
50
30
10
15
54
21
10
6
60
24
6
15
49
30
7
11
48
34
9
19
45
28
7
12
45
36
5
3
57
35
5
10
58
27
24
25
30
21
1
4
31
64
114
115
127
127
127
128
128
128
130
131
131
131
0
100
0
0
131
100
0
0
0
131
52
22
8
18
24
17
37
22
19
20
29
32
131
131
131
CONSENSUS sequence to a certainty level of 75.0 percent at each position:
Length: 18
1
February 15, 1989
16:05
Check: 3343
..
BBYHYYYHYY YDYAGVBH
Here the problem of the cut site not being congruent with the beginning of the matrix is even worse — it’s
fifteen bases away from the absolute AG! This can easily cause misinterpretation of the results — be careful.
Let’s look at the other five matrices that I have made available. First the CCAAT site. The ‘cat’ box usually
occurs around 75 base pairs upstream of the start point of eukaryotic transcription (preferred region -212 to 57); it may be involved in the initial binding of RNA polymerase II and CCAAT binding proteins have been
identified.
Eukaryotic promoter CCAAT region. Base freguencies according to
Philipp Bucher (1990) J. Mol. Biol. 212:563-578.
Preferred region: motif within -212 to -57.
Optimized cut-off value: 87.2%.
%G
%A
%U
%C
Total
7
32
30
31
25
18
27
30
14
14
45
27
40
58
1
1
57
29
11
3
1
0
1
99
0
0
1
99
0
100
0
0
12
68
15
5
9
10
82
0
34
13
2
51
30
66
1
3
175
175
175
175
175
175
175
175
175
175
175
175
CONSENSUS sequence to a certainty level of 68 percent at each position:
Ccaat.Csn
1
Length: 12
October 7, 1992
12:17
HBYRRCCAAT SR
8
Type: N
Check: 5922
..
Next, the famous TATA site (aka “Hogness” box). The tata box is a conserved A-T rich sequence found
about 25 base pairs upstream of the start point of eukaryotic transcription (preferred region -36 to -20). It may
be involved in positioning RNA polymerase II for correct initiation and it binds Transcription Factor IID
proteins.
Eukaryotic promoter TATA region. Base freguencies according to
Philipp Bucher (1990) J. Mol. Biol. 212:563-578.
Preferred region: center between -36 and -20.
Optimized cut-off value: 79%.
%G
%A
%U
%C
39
16
8
37
5
4
79
12
1
90
9
0
1
1
96
3
1
91
8
0
0
69
31
0
5
93
2
1
11
57
31
1
40
40
8
11
39
14
12
35
33
21
8
38
33
21
13
33
33
21
16
30
36
17
19
28
36
20
18
26
Total 389
389
389
389
389
389
389
389
389
389
389
389
389
389
389
CONSENSUS sequence to a certainty level of 61 percent at each position:
Tata.Csn
Length: 15
1
October 4, 1992
17:12
Type: N
Check: 715
..
STATAWAWRS SSSSS
Next the GC box. This consensus may relate to the binding of transcription factor Sp1 and occurs anywhere
from -164 to +1 on the DNA sequence:
Eukaryotic promoter GC-Box region. Base freguencies according to
Philipp Bucher (1990) J. Mol. Biol. 212:563-578.
Preferred region: motif within -164 to +1.
Optimized cut-off value: 88%.
%G
%A
%U
%C
18
37
30
15
41
35
12
11
56
18
23
2
75
24
0
0
100
0
0
0
99
1
0
0
0
20
18
62
82
17
1
0
81
0
18
1
62
29
9
0
70
8
15
6
13
0
27
61
19
7
42
31
40
15
37
9
Total 274
274
274
274
274
274
274
274
274
274
274
274
274
274
CONSENSUS sequence to a certainty level of 67 percent at each position:
Gc.Csn
Length: 14
1
October 7, 1992
13:46
Type: N
Check: 7852
..
WRKGGGHGGR GBYK
Next, the cap signal. The cap is a structure at the 5’ end of eukaryotic mRNA introduced after transcription by
linking the 5’ end of a guanine nucleotide to the terminal base of the mRNA and methylating at least the
additional guanine; the structure is 7MeG5’ppp5’Np. . . . The signal pattern is centered about +2:
Eukaryotic promoter Cap region. Base freguencies according to
Philipp Bucher (1990) J. Mol. Biol. 212:563-578.
Preferred region: center between 1 and +5.
Optimized cut-off value: 81.4%.
%G
%A
%U
%C
23
16
45
16
0
0
0
100
0
95
5
0
38
9
26
27
0
25
43
31
15
22
24
39
24
15
33
28
18
17
33
32
Total
303
303
303
303
303
303
303
303
9
CONSENSUS sequence to a certainty level of 63 percent at each position:
Cap.Csn
1
Length: 8
October 7, 1992
11:53
Type: N
Check: 2736
..
KCABHYBY
Finally, McLauchlan et al.’s (1985) eukaryotic terminator weight matrix follows:
Possible eukaryotic termination signal region. Base freguencies
according to McLauchlan et al. (1985) N.A.R. 13:1347-1368.
found in about 2/3's of all eukaryotic gene sequences.
%G
%A
%U
%C
19
13
51
17
81
9
9
1
9
3
89
0
94
3
3
0
14
4
79
3
10
0
61
29
11
11
56
21
19
13
47
21
Total
70
70
70
70
70
70
70
70
CONSENSUS sequence to a certainty level of 68 percent at each position:
Terminator.Csn
1
Length: 8
October 7, 1992
14:25
Type: N
Check: 2895
..
BGTGTBYY
You can find as many of any of these sites in a DNA sequence as you want, by running the list sizes as large
as you want. Most will be false positives. None are a guarantee of coding potential, only a possibility. Not all
genes have all or any of these sites in a biologically active state! How is all of this sorted out? There’s got to
be more, so what else is there?
Content approaches: Strategies for finding coding regions based on the content of the DNA itself.
I’ve discussed many of the pitfalls of signal searching. In general, the second type of gene-finding technique,
“searching by content,” is more reliable, at least it is much less fraught with false positives, but its answers
aren’t concise either. They do not provide exact starting and stopping positions, just trends. However, used
in concert, the two can be quite powerful tools. Adding in the third, inference through homology, often
clinches the story.
Searching by content utilizes the fact that genes necessarily have many implicit biological constraints
imposed on their genetic code. This induces certain periodicities and patterns in coding sequences as
opposed to noncoding stretches of DNA. These factors create distinctly unique coding sequences; noncoding stretches do not exhibit this type of periodic compositional bias. These principles can serve to help
discriminate structural genes from all the rest of the so-called, but misnamed, “junk” DNA found in most
genomes depending on what the sequence ‘looks’ like in two ways: 1) based on the local “non-randomness”
of a stretch, and 2) based on the known codon usage of a particular life form. The first, the non-randomness
test, does not tell us anything about the particular strand or reading frame; however, it does not require a
previously built codon usage table. The second approach is based on the fact that different organisms use
different frequencies of codons to code for particular amino acids. This requires a codon usage table built up
from known translations; however, it tells us the strand and reading frame for the gene products.
10
“Non-Randomness” techniques: GCG’s TestCode
The first technique relies solely on the base compositional bias of every third position base — nonrandomness. A truly random sequence does not show any type of pattern at all and is not characteristic of
any coding sequence.
The TestCode algorithm can estimate the probability that any stretch of DNA
sequence is either coding or noncoding. It will not tell us the strand or reading frame; however, it does not
require any a priori assumptions as it relies exclusively on a statistical evaluation of the sequence composition
itself — the nonrandomness of every third base. This statistic is known as the period three constraint and
was developed by James Fickett at Los Alamos (1982).
Codon usage analysis: Codon frequency tables, GCG’s Frames, and CodonPreference.
The second content type of gene finding strategy utilizes the fact that different organisms have different codon
usage preferences, i.e. genomes use synonymous codons unequally in a phylogenetic fashion. Codon usage
frequency is not the genetic translation code — the genetic code is nearly universal across all phylogenetic
lines with some notable exceptions.
However, not all lines use the same percentage of the various
degenerate codons the same amount. The manner in which different types of organisms utilize the available
codons is usually tabulated into what is known as a codon usage or frequency table. In order to utilize the
codon usage gene finding strategy a codon usage table for the particular organism in question must be
accessible. GCG provides six tables in the public data library GenMoreData. The available codon usage
tables, in addition to the default E. coli highly expressed genes table, ecohigh.cod, are: celegans_high.cod,
celegans_low.cod, drosophila_high.cod, human_high.cod, maize_high.cod, and yeast_high.cod. Even more
tables
are
available
at
various
molecular
biology
data
servers
such
as
IUBIO
(http://iubio.bio.indiana.edu/soft/molbio/codon/). The TRANSTERM database at the European Bioinformatics
Institute (ftp://ftp.ebi.ac.uk/pub/databases/transterm/) also contains several and an especially good selection
derived from recent GenBank versions comes from the CUTG database (http://www.kazusa.or.jp/codon/)
available in GCG format through various SRS servers (e.g. see http://srs.sanger.ac.uk/srsbin/cgi-bin/wgetz?page+LibInfo+-id+2keC31K_fq2+-lib+CUTG). Furthermore, if you are not satisfied with any of the available
options, GCG has a program, CodonFrequency, that enables you to create your own custom codon frequency
table.
Two GCG content analysis programs use codon usage tables in this context: Frames, a very simple open
reading frame identifier that can utilize codon frequency tables to show rare codon usages, and the quite
sophisticated codon frequency analyzer CodonPreference (Gribskov, et al., 1984).
CodonPreference
additionally plots the compositional bias of the third position of each codon (Bibb et al., 1984). You must
specify the codon usage table appropriate for your situation with either program. Remember, however, that
for most eukaryotic genomic sequences, only the first exon will actually have a start codon. Therefore,
Frames is generally more appropriate for sequences without exons such as cDNA or prokaryotic data. For it
to be of any help with sequences with exons and introns run it with the “Show all start and stop signals, not
just open frames” (-All) option. With genomic data, this option allows us to see whether intron-exon structure
11
and/or sequencing errors may be responsible for the interruption of ORFs. One advantage of Frames is it
shows you both forward and reverse translation frames.
Homology inference
Similarity searching methods can be particularly powerful for inferring gene location by homology. These can
often be the most informative of any of the gene finding techniques, especially now that so many sequences
have been collected and analyzed. Sequence similarity search and alignment routines, e.g. the Wisconsin
Package programs Motifs, the BLAST and FastA family of programs, Compare and DotPlot, Gap and BestFit,
and FrameAlign and FrameSearch can all be a huge help in this process. But this too can be misleading and
seldom gives exact start and stop positions unless you find an extremely close homologue.
Combined gene inference methods available on the Internet
An additional source of information that should not be ignored is the Internet. Several powerful World Wide
Web servers have been established that can be a huge help with gene finding analyses. Most of these
servers combine many of the methods previously discussed, but they consolidate the information and often
combine signal and content methods with homology inference in order to ascertain exon locations. Many use
powerful neural net or artificial intelligence approaches to assist in this difficult ‘decision’ process.
A very nice bibliography on computational methods for gene recognition has been compiled at Rockefeller
University (http://linkage.rockefeller.edu/wli/gene/) and the Baylor College of Medicine’s Gene Feature Search
(http://searchlauncher.bcm.tmc.edu/seq-search/gene-search.html) is another nice portal. Five popular genefinding services are GrailEXP, GeneId, NetGene2, GenScan, and GeneMark.
The neural net system
GrailEXP (Gene recognition and analysis internet link–EXPanded http://grail.lsd.ornl.gov/grailexp/) is a gene
finder, an EST alignment utility, an exon prediction program, a promoter and polyA recognizer, a CpG island
locater,
and
a
repeat
masker,
all
combined
into
one
package.
GeneId
(http://www1.imim.es/software/geneid/index.html) is an ‘ab initio’ Artificial Intelligence system for predicting
gene
structure
optimized
in
genomic
D r o s o p h i l a or H o m o
DNA.
NetGene2
(http://www.cbs.dtu.dk/services/NetGene2/), another ‘ab initio’ program, predicts splice site likelihood using
neural
net
techniques
in
human,
C.
e l e g a n s , and A.
thaliana
DNA.
GenScan
(http://genes.mit.edu/GENSCAN.html) is perhaps the most ‘trusted’ server these days with vertebrate
genomes. The GeneMark (http://opal.biology.gatech.edu/GeneMark/) family of gene prediction programs is
based on Hidden Markov Chain modeling techniques; originally developed in a prokaryotic context the
programs have now been expanded to include eukaryotic modeling as well.
Summary: The combinatorial approach
The chore of identifying coding sequences is far from trivial and is a long way from being solved in an
unambiguous manner; however, it is extremely important anytime anyone starts sequencing genomic DNA
and doesn’t have the luxury of a cDNA library and/or a very near, fully characterized genomic homologue.
12
About the best way to make any sense out of all of this data is to get it all in one spot. Automated solutions
exist (e.g. Gaasterland’s Magpie system and its relatives, http://genomes.rockefeller.edu/research.shtml) but
often you’ll be forced to do it manually. Either prepare a paper map, or a text file map, or use the annotation
capabilities of some of the specialized sequences editors such as the Wisconsin Package’s SeqLab.
However you do it, annotate your sequence with all of the relevant results from all analyses in order to see
‘how it all comes together.’ Show where the various signals and content biases you found are located.
Indicate precise positions where you believe relevant features lay. Note where you feel the actual starts and
stops of the coding regions are in your sequence. Develop a coding system to represent various attributes.
Used in combination text and color can be very helpful. Similarities discovered through database searching
will greatly assist your interpretation, especially if you are dealing with a system that has much available data.
More annotation added to the map results in greater consensus between the various methods, and, therefore,
more trust in their combined inference. More data is almost always good in computational molecular biology!
Wherever a preponderance of data suggests a gene is located, believe one is there; where the data is
contradictory, decisions can’t be made; and where lots of data argues against the location of genes, believe
one is not there. You need to synthesize all this data together to decide what portions of the tentative URFs
actually code for proteins. The validity of your interpretations will relate directly to your understanding of the
molecular biology of the system. Putative coding regions (CDSs) that the analyses have indicated can then
be translated.
Analyze genomic data carefully. It won’t be as easy as you would have hoped for. Fortunately, often in a lab
situation cDNA data is also available on a given sequence, although with the increased emphasis on genomic
sequencing this is becoming less and less true.
A careful application and interpretation of the many resources at your disposal can go a long way to
increasing your understanding of gene structure and function. But, as always, carry a healthy dose of
skepticism to, and be extremely wary, at any session with the computer, as the naive can easily be misled
into accepting inappropriate or downright wrong results. All available methods should be used together to
help reinforce and/or reject the others’ findings.
SeqLab is a great place to get all of this annotation together in one spot. SeqLab’s “Graphic Features”
“Display” mode represents annotation with colors and shapes in a ‘cartoon’ fashion. “Sequence Features”
windows describe the annotation. The following SeqLab screen snapshot shows the Editor in this mode
being used for genomic annotation:
13
Translation: where to start and stop
At least forward translation is nearly universal. The genetic code is almost the same across all of life. And
even for those weird situations like some mitochondrial and ciliate genomes, precompiled alternate translation
tables are available. But what about precursor versus mature proteins, and signal peptides, and other posttranslational processing mechanisms? How can we tell just what makes up a mature protein?
Many matters complicate the process. As we’ve seen, exons and introns (in most Eukaryota) can be
especially confusing, but prokaryotes and organelles have their own problems too. One that concerns all
genes is, after you do translate the entire thing, whether it has a signal peptide portion and how to tell which is
what. A database of pre-protein signal peptides is available through Gunnar von Heijne for just this type of
analysis (1987b). The Wisconsin Package program SPScan incorporates von Heijne’s method and can be
run with a prokaryote gram negative or positive switch to change from the default eukaryote search matrix. It
is remarkably accurate.
Beyond just finding genes: Genome scale analyses.
So, locating genes within uncharacterized genomes is a huge matter, but what about comparing and
analyzing genome scale sequences, megabases at a time?
14
What resources are available for that?
Unfortunately much ‘traditional’ sequence analyses software, such as the Wisconsin Package, ‘break down’
when asked to analyze sequence datasets of this order.
Along these lines, for your information, the Wisconsin Package’s restrictions, as of version 10.3, allow
individual sequences to be a maximum of 350 Kb in length (longer entries are cut into overlaps in the local
database), though SeqLab can display longer sequences and, therefore, cope with some genome scale
analyses. The MSF file format can hold up to 500 sequences; RSF can hold much more, only limited by
system memory. This allows programs such as HmmerAlign to produce multiple sequence alignment output
larger than 500 sequences. PileUp itself can handle a sequence alignment up to 7,000 characters long,
including gaps. Input sequences are restricted to a length of 5,000 characters by default. The 'overall
surface-of-comparison' is restricted to 2,250,000 with the default program, a bit more than all the residues or
bases plus all the gaps in the alignment. Alternative executables are provided with the Package for allowing
10,000, 15,000, and 20,000 character input, though these executables are usually not scripted into SeqLab.
Launch them from the command line with “pileup_10000,” “pileup_15000,” and “pileup_20000” respectively.
Take home message: You can make pretty big alignments with GCG; it's all up to what you really need to do
to answer the biological questions that you are asking.
Fortunately, for those cases where GCG and
And their Locus Link page provides a Web
similar software won’t do the job, there are some
hyperlink portal to a wealth of information —
very good Web resources available for these types
general description, homologous sequences,
of ‘global view’ genomic analyses.
mapping
NCBI
(http://www.ncbi.nlm.nih.gov/) presents a good
starting point in North America.
location,
associations . . .
Their Entrez
Genome Map View presents the chromosome
context of a gene:
15
OMIM
and
PubMed
.
.
.
including
the
(http://gdbwww.gdb.org/)
Genome
and
the
DataBase
excellent
Genome Browser at the University of California,
Santa Cruz (http://genome.ucsc.edu/) . . .
And tools are even available for performing
genome scale alignments on your own sequences.
A very good method for this objective is distributed
by
The
Institute
for
Genomic
Research
. . . and the Ensembl project at the Sanger Center
(http://www.tigr.org/) in the MUMMER package. It
for BioInformatics (http://www.ensembl.org/) . . .
also has a Web graphical viewer interface:
Other tools allow detailed observations of genome
scale alignments, e.g. the Blattner Lab E. coli
Genome resources at the University of Wisconsin,
Madison Campus, (http://www.genome.wisc.edu/)
shown top on the right opposite:
16
Your Project Molecular System choices
Your Project Molecules are again listed. Please maintain using the same one as in all the previous tutorials:
1) higher plant ribulose bisphosphate carboxylase/oxygenase, small subunit only
2) vertebrate P21 ras proto-oncogene transforming protein
3) vertebrate basic fibroblast growth factor
4) fungal Cu/Zn superoxide dismutase
Week 6 Tutorial: A ‘Real-Life’ Project Oriented Approach. Gene Finding Strategies
Activate and/or log on to the computing workstation you are sitting at and then log onto Mendel with an Xtunneled ssh session. Remember that we do this on the Conradi PC’s with the combination SSH and
XWin32. Review the Biology Computing Facility Help pages if you’ve forgotten how. If using an xterm
window on Mac OSX or UNIX/Linux then issue the following command (the X has to be capitalized and
replace “user” with your account name):
> ssh –X [email protected]
(Do not issue this command on MS Windows SSH/XWin32!)
Preliminary preparations
Change your directory (cd) from ‘home’ to last week’s subdirectory. List that directory (ls) and check out the
files left over from last week’s tutorial. Look through them (more) and remove (rm) any that you don’t want to
save. Be sure to save your BLAST and FastX output files from last week; we’ll be using them later on in the
semester. Also save your FAS consensus sequence that was used as a query last week. Next, change
directory back to your home directory, create a subdirectory (mkdir) for this week’s tutorial data, and then
change directory into it.
After you’ve taken care of these file maintenance chores launch SeqLab with the following command (but
remember with SSH/XWin32 you need to launch “xclock &” first):
> seqlab &
Next, it would probably be helpful to again change your SeqLab working directory to your present location so
that everything you do today will automatically be saved in your new directory rather than last week’s
directory. Do this with SeqLab’s “Options” “Preferences. . .” “Working Dir. . .” button.
Now verify that you are in SeqLab’s “Main List” “Mode:” and start a new list to contain this week’s data.
Therefore, select “New List. . .” from the “File” menu and give your new list an appropriate name. It’s not
essential to use the file name extension “.list” but it’s a good idea. Check “OK.”
You should now be in List Mode with an empty window. Go to the “File” menu and select “Add Sequences
From” “Sequence Files. . .” Use the “Directories” column to move from your present directory over to Week
17
four’s subdirectory and then replace the text in the “Filter” text box with the name or a wildcard specification
that will identify your FAS consensus sequence used as the query last week. Press the “Filter” button and
then select the correct entry. Press the “Add” button to add it into your new empty list file and then “Close”
the “Add Sequences” window. Select the sequence in your new list and switch “Mode:” to “Editor.”
One-dimensional signal searching with FindPatterns
Begin your Project Molecule’s FAS consensus gene finding investigation with a simple one-dimensional start
and poly(A) signal search. FindPatterns allows you to type individual patterns in, or you can specify data files
as we did in the primer discovery tutorial.
We’ll begin by looking for Kozak’s (1984) eukaryotic start
consensus and Proudfoot and Brownlee’s (1976) poly(A) adenylation signal. Launch “FindPatterns. . .” from
the “Gene Finding and Pattern Recognition” “Functions” menu. Press the “Search Set. . .” button and
then the “Add Main List Selection. . .” button in the new window. Select your FAS consensus sequence in
this week’s new list in the “List Chooser” window and then press “Add” and then “Close.” Also “Close” the
“Build FindPattern’s Search Set” window. Next, press the “Patterns. . .” button in the FindPatterns program
window to get a “Pattern Chooser for FindPatterns” window. Press “Create New. . .” in the Pattern
Chooser window. This will produce another new window, “Create or Modify Item;” in its “Pattern:” text box
type Kozak’s consensus pattern, “cc(A,g)ccAUGg.” The use of upper and lower case letters is unnecessary
and only indicates which positions are strongly conserved. Give the pattern a name, I used “Kozak,” and fill
in a comment that makes sense. Press “Add” and then “Close” the pattern editor window. Repeat the
“Create New. . .” procedure with the poly(A) signal, “AAUAAA.” “Close” the Pattern Chooser window after
specifying the two patterns. The FindPatterns main program window should now show that you are using
your chosen entry and your selected patterns. Select the checkbox next to “save matches as features in;”
the default RSF file name is fine. Next, press the “Options. . .” button and then push in the checkbox next to
“search only the top strand of nucleotide sequences” in the “FindPatterns Options” window and then
“Close” the Options window. We are taking advantage of this -OneStrand option to reduce complexity, since
I’m guaranteeing you that all exons will be in the forward direction on these sequences. This would not be the
case in a ‘real’ lab setting. “Run” FindPatterns to discover all of the occurrences of the start and poly(A)
patterns in your sequence. You may not find any in which case you could rerun the program allowing one
mismatch.
However, this could bring in false positives, so beware.
Especially pay attention to any
mismatches found within the ATG start codon — obviously it’s a false positive if that’s where a mismatch is
located. If you find any valid occurrences of the Kozak or poly(A) pattern, check out the .find output file. It
will list the pattern used, the location of the pattern in your sequence, and show any mismatches, if you
allowed them. Also, if your FindPatterns results looks promising, use your “Output Manager” “Add to
Editor” button and specify “Overwrite old with new” to add the new found feature annotation in the new
.rsf file to your FAS consensus sequence in the open Editor. My search with my example genomic
elongation factor sequence did not find any valid Kozak or poly(A) patterns. Nothing was found in my
example with zero mismatches and then when I increased the mismatch level to one, a Kozak pattern came
up but its mismatch was in the start codon and poly(A) sites were everywhere.
18
We’ll use FindPatterns once more today to look for one-dimensional signals. However, this time we’ll have it
look through David Ghosh’s Transcription Factor Sites database (1990). Relaunch “FindPatterns” through
the “Windows” menu. Leave the “Search Set. . .” as it is, but press the “Patterns. . .” button to change the
patterns from the previous search. Press “Pattern Data File. . .” in the Pattern Chooser window and then
replace the “File Chooser” specification in the “Filter” text box with “genmoredata:tfsites.dat.” Press
the “Filter” button and then select the file displayed, “tfsites.dat,” and then press the “OK” button. The
Pattern Chooser window will update to show the new patterns, “Close” its window. Back in the main
FindPatterns program window be sure that “save matches as features in” is still selected and that you are
still using the -OneStrand option. If you allowed a mismatch in the previous search, be sure to use the
“Options” window to set it back to zero. This is really important as even with zero mismatches, you’re going to
get a ton of hits from this pattern database! I got 433 with my example sequence.
The top file displayed will be your new findpatterns.rsf file that annotates all of transcription factor site
locations. Don’t bother trying to read it; just close it. But do use the “Output Manager” “Add to Editor”
button and then specify “Overwrite old with new” to add the new found feature annotation onto your FAS
consensus sequence. Also use the “Output Manager” to display the .find output file. Quickly scroll
through it and see if any of the patterns’ names are recognizable. Notice the output is huge, of which most
are probably false positives. How do you sort out which are relevant and which are not? It’s not trivial but . . .
The Ghosh Transcription Factor Sites data file is available on-line in the GCG public data directories; it can
help you decide whether an entry is relevant or not by listing the pertinent reference. After finding the
reference in the file you can investigate further in a science library or online with resources such as MEDLINE
through PubMed at NCBI (http://www.ncbi.nlm.nih.gov/entrez/query.fcgi).
Two-dimensional signal searching with FitConsensus
Now that you’ve seen how problematic signal searches are with a one-dimensional pattern search approach,
let’s see how well a two-dimensional matrix approach works. Refer to this tutorial’s introduction for a
description of the matrices to be used in this section. As discussed there, GCG’s FitConsensus program
enables this type of a search to be performed. Be sure that your FAS consensus sequence is selected and
then launch “FitConsensus. . .” off of the “Gene Finding and Pattern Recognition” “Functions” menu.
Unfortunately GCG has not updated this program to produce RSF output so we can’t take advantage of
SeqLab’s ability to automatically update it’s annotation based on the results of these program runs — we’ll
have to do it manually. There are no options in this program, but it may help reduce confusion some by
reducing the “Number of fits to show” from the default “40” down to “20.” Press the “Consensus table file.
. .“ button, then use the “File Chooser” to specify “genmoredata:donor.csn,” and then press the “Filter”
button to display the file. Select the donor consensus file in the “Files” window, then press “OK,” and then
“Run” FitConsensus.
Repeat this procedure with the other six consensus files in GenMoredata:
“acceptor.csn,” “tata.csn,” “cap.csn,” “ccaat.csn,” “gc.csn,” and “terminator.csn.” Use the
“Output Manager” to give the output files names that make sense based on the consensus file that you used.
19
I’ll show my elongation factor example donor site consensus fit output here:
FITCONSENSUS of FAS_consensus Using Consensus: donor.csn
CONSENSUS from: Splice site sequences from Stephen Mount NAR 10(2) 459-472
List-size: 20
Average quality: 37.80
February 9, 2003 10:21
..
position:
605 1243 1722 1784 1802 1889 2268 2670 2784 2904 2963
frame:
2
1
3
2
2
2
3
3
3
3
2
quality: 61.08 53.00 52.92 48.25 48.08 49.00 48.33 53.58 48.17 52.75 47.83
position: 3042 3248 3337 3458 3537 3572 3592 4173 4444
frame:
3
2
1
2
3
2
1
3
1
quality: 47.17 51.17 53.17 46.92 48.25 49.92 46.83 49.08 47.83
Note that the output includes the position, frame, and “quality” of each match. The position and quality are
tremendously helpful. Position is where in your sequence the specified weight matrix begins, perhaps not
where the site that you are most concerned is occurs, rather only where the matrix begins. This is particularly
important in the donor and acceptor matrices as these both begin in front of the splice site, not at it. Quality is
the percentage fit to the matrix. The higher the percentage, the more probability the site is an actual signal.
The frame designation is troubling — it is quite misleading as it identifies the frame of the best fit to the matrix,
not to the reading frame, so disregard it. It’ll only confuse you. Don’t worry about trying to incorporate these
results into your SeqLab sequence’s annotation at this point. We’ll take care of that later on.
Content approaches — TestCode, Frames, CodonPreference
Let’s begin investigating gene finding content approaches with a method based only on the randomness of
every third position within a given DNA sequence. Make sure that your FAS consensus sequence is still
selected and then launch “TestCode. . .” off of the “Gene Finding and Pattern Recognition” “Functions”
menu. Accept all of the program defaults and press “Run.” The results will quickly return, as seen below:
20
The plot is divided into three regions. The top and bottom areas predict coding and noncoding regions,
respectively, to a confidence level of 95%, while the middle area claims no statistical significance. Diamonds
and vertical bars above the graph denote potential stop and start codons respectively. One limitation of this
program is, it is not designed to detect coding regions shorter than 200 base pairs, hence the default 200 bp
window size. No claim is made for significance with windows less than the default 200; therefore, smaller
exons may be missed.
Launch “Frames. . .” from the same menu as the others next. As discussed in the introduction, Frames
generally isn’t that helpful for eukaryotic genomic DNA but works great for anything without introns. To use
Frames in a manner that is helpful with introns press the “Options. . .” button. First off notice that the default
codon frequency table comes for E. coli, not what we need for any of out Project Molecules! Therefore, press
the “Codon Frequency Table. . .” button and choose the most appropriate table in the “Chooser for Codon
Frequency Table” window for your system and then press “OK.” Alternative tables are also discussed in the
introduction. Next, tell Frames that you want to “Show all start and stop signals, not just open frames” to
activate the -All command line option. <Click> “Close” in the Option window and then “Run” in the program
window. My example Frames output follows below:
The plot shows ATG start signals with hash marks rising above the horizontal strand axes and stop signals
with hash marks falling below the axes, and it indicates rare codon choices above some specified threshold
with a dot above each individual reading frame. Notice that it shows all six frames, both forward and reverse.
The final GCG content analysis program that we’ll run is CodonPreference. It also uses a default E. coli
codon usage table, so change it to something more appropriate. Launch “CodonPreference. . .” and change
21
its codon frequency table just like in Frames. It also allows a “Show all start and stop signals, not just
open frames” option; take advantage of this through the “Options. . .” menu. However, CodonPreference
only shows forward translation frames. Therefore, if you had to analyze the opposite strand, you would have
to reverse-complement your sequence and run the program a second time. We will not be doing that here.
The plot from CodonPreference run with this option on my example’s forward strand is shown below:
The plot shows two color-coded curves, a red codon preference curve and a blue third position GC bias
curve, for each forward reading frame of the sequence in question. These curves rise above background
scatter in areas of strong probability of coding potential. In general, coding regions will show a propensity of
preferred codons and will have more G’s or C’s in their third position. The horizontal lines within each plot are
the average values of each attribute.
CodonPreference moves its window in increments of three,
recalculating its statistic at each position to generate a continuous function so that each function defines an
individual reading frame.
An open reading frame display accompanies each panel with start codons
represented as vertical lines rising above each box and stop codons shown as lines falling below the reading
frame boxes. Do not use the ORF display for exon discovery, but the stop codon portion of it may be helpful.
Rare codon choices are again shown for each frame, now hash marks below the reading frames. One must
realize, however, that not all genes show particularly high codon usage preference. This is especially true of
22
genes that are only weakly expressed. Therefore, you must, as always, carefully interpret your results and
use as many sources of information as possible!
Homology inference with FrameAlign
This part will be too easy because our Project Molecules are all very well studied. Just imagine how difficult it
would be if we couldn’t find any close homologues! We would only have the previous types of analyses to go
on. But for now we’ll do it the easy way by aligning our genomic sequence to its exact protein counterpart.
Therefore, temporarily switch to your xterm window; do not yet exit SeqLab. Change directory over to last
week’s database searching subdirectory and look at (more) the FastX output file. Write down the top hit (i.e.
that pairwise alignment with the lowest E value that is relevant), the very most similar entry to your FAS
consensus from the Swiss-Prot protein sequence database. Now return to your SeqLab session and load
that sequence into the display by using the “File” “Add Sequences From” “Databases. . .” button.
Remember that you need to specify both the database and the sequence name or accession code for this to
work. For instance, I typed “sw:ef11_human” under “Database Specification:” in the “Database Browser”
window for my example; you’ll use your own Project Molecule Swiss-Prot entry. Press “Add to Main
Window” and then “Close” the “Database Browser.” You’ll now have your FAS consensus sequence and
the new Swiss-Prot entry, one on top of the other, in your SeqLab Editor.
Select both entries and then go to the “Functions” “Pairwise Comparisons” menu and pick “FrameAlign. .
.” For FrameAlign to work this way, that is, to use it for aligning more than one exon to a protein sequence,
you need to change some of its parameters. Therefore, press the “Options. . .” button and change from the
default “local alignment” to “global alignment.”
It also helps to tell FrameAlign “Don’t penalize gap
extensions longer than” about “12” or so. This way there’s minimal penalty for jumping over the introns.
Were the similarity between the protein and genomic sequence not so high, then reducing all of the gap
penalties may also be required, but since we’re dealing with things that should be nearly 100% identical, that
won’t be an issue. “Close” the Options window and “Run” the program. After the program finishes the
.framealign file will be displayed. Notice how the introns have been successfully jumped over by the
algorithm. Write down the nucleotide positions where each exon starts and stops for use in the homework.
“Close” the .framealign file and use the “Output Manager” to give it a more sensible name and then
“Close” the “Output Manager” to return to your Editor display.
If this were a real lab experience with uncharacterized eukaryotic genomic DNA, then you would want to go
back to your SeqLab Editor and use its ability to add custom feature annotation beyond what can be done
automatically by those programs that can produce RSF output. After getting all of your results in one spot,
the Editor display, you would decide what regions are exons and translate them. For the sake of time I will
not require you to do this today, but realize that even with a very close, or identical homologue as we have
here, its not a trivial chore. Nonetheless, study the results from today’s tutorial; note how the various
programs’ outputs either agree or disagree with those regions that FrameAlign nailed down as the true
translated regions of your consensus sequence. These observations will be in today’s homework.
23
Exit SeqLab with the “File” menu “Exit” choice and save your RSF file and any changes in your list with
appropriate responses. Accept the suggested changes and designate names that make sense to you;
SeqLab will close.
Log out of your current UNIX session on Mendel and exit the X software on the
workstation that you are sitting at.
Homework assignment
Submit your consensus sequence to an appropriate World Wide Web gene finding site, as discussed in the
introduction. Do not use X for this as the copying and pasting between Mendel and your workstation will
generally be simpler in a standard ssh terminal window.
After comparing all of the results from this tutorial and from the WWW site query above with reality as
predicted by FrameAlign, tell me what programs found the real exons in your consensus sequence. I want to
know where each exon lays and which predictions correctly identified each. As with last week’s homework,
type up a simple table with these answers. For instance use something like the following (imaginary values):
Reality
Exon 1
Exon 2
Exon 3
632 to 701
838 to 929
etc.
FindPatterns TFSites TATA at 598
etc.
poly(A) at 3896
Kozak ATG at 632
FitConsensus TATA at 578
ccaat at 454
TestCode
high probability
CodonPreference
WWW
acceptor at 823 donor at 934
donor at 694
etc.
donor at 1235
etc.
terminator at 4987
low probability
medium high
etc.
high probability
high probability
etc.
etc.
what happened?
Conclusion
You have been exposed to a perplexing variety of techniques for the identification and analysis of protein
coding regions in genomic DNA. As in all molecular and biological computer analyses, the more you
understand the chemical, physical and biological systems involved, the better your chance of success in
analyzing them. Certain strategies are inherently more appropriate to others in certain circumstances.
Making these types of subjective, discriminatory decisions and utilizing all of the available options so that you
can generate the most practical data for evaluation are two of the most important ‘take-home’ messages that I
can offer!
Several general references are available in this field — many provide extensive weight matrices for
consensus pattern searches. Naturally each would have to be tailored into the format correct for whichever
matrix searching program you might be using. They also all describe many of the factors involved and the
24
constraints used in content type algorithms. Sequence Analysis Primer, by Gribskov and Devereux (1992), is
a dated, but still good starting point.
Supplemental information
Phillipp Bucher’s Eukaryotic Promoter Database (EPD) (1995 and 2002 http://www.epd.isb-sib.ch/index.html):
Bucher has assembled an extensive list of eukaryotic promoter regions compiled from the EMBL database.
His database includes a user’s manual, the sequence information itself, and an independent, journal
abstracted data reference section for each entry. In order to be included in EPD an entry must:
1) be recognized by eukaryotic RNA POL II,
2) be active in eukaryotes (excludes phycophytes, fungi, myxomycetes, protists),
3) be experimentally defined or sufficiently similar to one defined as such,
4) be biologically functional,
5) be available in the current EMBL release,
6) be distinct from other promoters in the database.
EPD Release 73 (January 2003) has 2997 total promoter entries.
References
Bibb, M.J., Findlay, P.R., and Johnson, M.W. (1984). The relationship between base composition and codon
usage in bacterial genes and its use for the simple and reliable identification of protein-coding sequences.
Gene 30, 157–166.
Bucher, P. (1990). Weight matrix descriptions of four eukaryotic RNA polymerase II promoter elements
derived from 502 unrelated promoter sequences. Journal of Molecular Biology 212, 563–578.
Bucher, P. (1995). The Eukaryotic Promoter Database EPD. EMBL Nucleotide Sequence Data Library
Release 42, Postfach 10.2209, D-6900 Heidelberg.
Fickett, J.W. (1982). Recognition of Protein Coding Regions in DNA Sequences. Nucleic Acids Research 10,
5303–5318.
Genetics Computer Group (GCG“), (Copyright 1982-2003) Program Manual for the Wisconsin Package“,
version 10.3, http://www.accelrys.com/products/gcg_wisconsin_package/index.html Accelrys, a wholly
owned subsidiary of Pharmacopeia Inc., San Diego, California, U.S.A.
Ghosh, D. (2000). Object-oriented transcription factors database (ooTFD). Nucleic Acids Research 28,
308–310.
Ghosh, D. (1990). A relational database of transcription factors. Nucleic Acids Research 18, 1749–1756.
25
Gribskov, M. and Devereux, J., editors (1992). Sequence Analysis Primer. W.H. Freeman and Company, New
York, N.Y., U.S.A.
Gribskov, M., Devereux, J., and Burgess, R.R. (1984). The codon preference plot: graphic analysis of protein
coding sequences and prediction of gene expression. Nucleic Acids Research 12, 539–549.
Hawley, D.K. and McClure, W.R. (1983). Compilation and analysis of Escherichia coli promoter sequences.
Nucleic Acids Research 11, 2237–2255.
Kozak, M. (1984). Compilation and analysis of sequences upstream from the translational start site in
eukaryotic mRNAs. Nucleic Acids Research 12, 857–872.
McLauchen, J., Gaffrey, D., Whitton, J. and Clements, J. (1985). The consensus sequences YGTGTTYY
located downstream from the AATAAA signal is required for efficient formation of mRNA 3’ termini.
Nucleic Acid Research 13, 1347–1368.
Mount, S.M. (1982). A catalogue of splice junction sequences. Nucleic Acids Research 10, 459–472.
Praz, V., Périer, R.C., Bonnard, C., and Bucher, P. (2002). The Eukaryotic Promoter Database, EPD: new
entry types and links to gene expression data. Nucleic Acids Research 30, 322–324.
Proudfoot, N.J. and Brownlee, G.G. (1976). 3’ noncoding region in eukaryotic messenger RNA. Nature 263,
211–214.
Stormo, G.D., Schneider, T.D. and Gold, L.M. (1982). Characterization of translational initiation sites in E. coli.
Nucleic Acids Research 10, 2971–2996.
von Heijne, G. (1987a). Sequence Analysis in Molecular Biology; Treasure Trove or Trivial Pursuit. Academic
Press, Inc., San Diego, CA.
von Heijne, G. (1987b). SIGPEP: A sequence database for secretory signal peptides. Protein Sequences &
Data Analysis 1, 41-42.
26