1
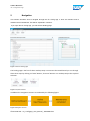
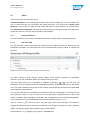
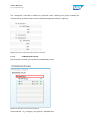
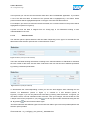
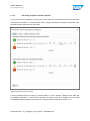
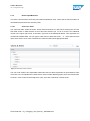
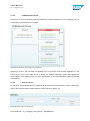
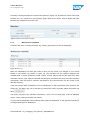
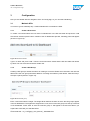
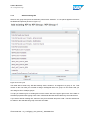
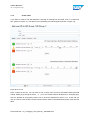
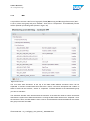
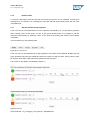
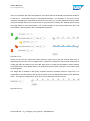
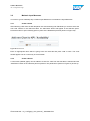
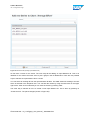
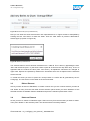
User Manual iCI-Configuration App ICI-Configuration App User Manual © 2014 SAP AG – iCI_ ConfigApp_User_Manual_ 20140626.docx User Manual iCI-Configuration App Table of Content 1 Introduction 1.1 Objective 2 Navigation 2.1 Views 2.1.1 Define Dashboard 2.1.2 Define Input Measures 2.1.3 Maintenance completed 3 Configuration 3.1 Maintain KPIs 3.1.1 Create a Scorecard 3.1.2 Create a KPI Group 3.1.3 Add an existing KPI 3.1.4 Create a KPI 3.1.5 MAI 3.1.6 Remove a KPI 3.1.7 Set KPI and KPI Group Properties 3.2 Maintain Input Measures 3.2.1 Create a Chart 3.2.2 Create a Series 3.3 Edit an Element 3.4 Delete an Element 4 Table of Figures © 2014 SAP AG – iCI_ ConfigApp_User_Manual_ 20140626.docx 3 3 4 5 5 9 11 12 12 12 12 13 14 15 16 16 19 19 19 21 21 22 User Manual iCI-Configuration App 1 Introduction The iCI Config App (interactive Continuous Improvement Configuration Application) is a maintenance tool for the iCI Dashboard (interactive Continuous Improvement Dashboard) which helps to: create/update/delete scorecards, KPI groups and KPI’s maintain Thresholds, Baselines and URL’s of KPI’s maintain Weight of KPI groups and KPI’s create/update/delete Charts and Series for Input Measures of KPI’s 1.1 Objective Purpose of this document: This outline shall give an overview and introduce the navigation of the iCI Config App. This outline enables the reader to create and edit own scorecards, KPI groups and KPI’s. This outline enables the reader to set properties for a KPI group or KPI. This outline enables the reader to create and edit own charts and series for Input Measurement. © 2014 SAP AG – iCI_ ConfigApp_User_Manual_ 20140626.docx User Manual iCI-Configuration App 2 Navigation This section describes how to navigate through the ICI Config App. It does not describe how to maintain the iCI Dashboard. This will be explained in section 3. If you open the iCI Config App, you will see this landing page. Figure 1 Overview landing page The landing page is the first of three roadmap steps. To maintain the iCI Dashboard you run through these three steps by clicking on “Next”-Button, ”Previous”-Button or a roadmap step in the top level selection. Figure 2 Top level selection In addition the navigation structure is visualized by the following figure. Figure 3 Navigation structure © 2014 SAP AG – iCI_ ConfigApp_User_Manual_ 20140626.docx User Manual iCI-Configuration App 2.1 Views A short introduction to the existing views: “Define Dashboard” is the landing page and first view of the iCI Config App. This view enables the user to create and edit own scorecards, KPI groups and KPI’s. The second View “Define Input Measures” can be used to create and edit charts and series for Input Measures of a selected KPI. The “Maintenance completed” view gives an insight to the log of operations which were executed in the first two steps. It is an easy way to reproduce user activities. 2.1.1 Define Dashboard This view contains a KPI tree table, iCI Dashboard preview, selection panel and properties popup. 2.1.1.1 KPI Tree Table The KPI tree table called “Scorecards, KPI Groups & KPIs” holds the same KPI data like the iCI Dashboard Application in a hierarchical, but more compressed way making it easier to maintain the elements. Figure 4 Tree table “Scorecards, KPI Groups & KPIs” (unassigned KPIs) The table consists of three columns. Column “Name” holds names of different iCI Dashboard elements. “Unit” and “Calculation Mode” are relevant columns for KPI’s. There are nodes which can be expanded or collapsed by pressing or . The root node “iCI Dashboard” at the top represents the iCI Dashboard Application. Scorecards are the first child nodes of the root node containing KPI groups as their children. After all KPI groups are the last expandable nodes holding the KPI elements. The very first child node of “iCI Dashboard” contains KPIs that are not assigned to a scorecard or KPI group (shown in Figure 4). They are part of the unique KPI group “unassigned” which is part of the unique scorecard called “unassigned”. These KPIs are not displayed in the iCI Dashboard Application. How to assign them to a scorecard and KPI group will be explained in section 3.1.3. There is a pencil ( ) placed on top of the upper right corner of the tree table. If the pencil is pressed, Display-Mode will be switched to Edit-Mode. The symbol will change to a pair of glasses ( ). Pressing the symbol again switches back to Display-Mode. © 2014 SAP AG – iCI_ ConfigApp_User_Manual_ 20140626.docx User Manual iCI-Configuration App The “unassigned” scorecard is followed by scorecard nodes containing KPI groups including KPI elements which are actual visible in the iCI Dashboard Application (shown in Figure 5). Figure 5 Tree table “Scorecards, KPI Groups & KPIs” (structure) 2.1.1.2 iCI Dashboard Preview Next to the KPI tree table you can find an iCI Dashboard preview. Figure 6 iCI Dashboard preview (Define Dashboard) © 2014 SAP AG – iCI_ ConfigApp_User_Manual_ 20140626.docx User Manual iCI-Configuration App In this preview you can see how the structure looks like in the iCI Dashboard Application. If you select a row of the KPI tree table, an element of the preview will be highlighted by a red frame. Which preview element will be highlighted depends on the type of the KPI tree table element. For example if you select a scorecard in the KPI tree table, the scorecard section in the preview will be highlighted red (shown in Figure 6). It points out how the data is mapped from iCI Config App to iCI Dashboard making it more understandable for the user. 2.1.1.3 Selection Panel The selection panel is placed below the KPI tree table. Depending on the type of a selected KPI tree table element the selection panel shows context-sensitive content. Figure 7 selection panel (root node selected) There are text fields showing information according to the selected element. If Edit-Mode is activated, the user is able to edit some of these fields. Furthermore the user has access to different operations by pressing a selection panel button. Figure 8 selection panel (KPI selected) To demonstrate the context-depending content you can see what happens when selecting the root element “iCI Dashboard” (shown in Figure 7) in contrast to a KPI element (shown in Figure 8). In Figure 7 you can only add a new scorecard by pressing “Add ScoreCard”. In Figure 8 you can edit the name, unit and calculation mode of the KPI, save your changes, remove the KPI or have a deeper look into the properties. If you press ID. By pressing you can lay open another text field showing the KPI the KPI ID will be hidden again. Just select elements with different types from the KPI tree table to get to know all possible patterns the selection panel provides. © 2014 SAP AG – iCI_ ConfigApp_User_Manual_ 20140626.docx User Manual iCI-Configuration App 2.1.1.4 KPI Group properties and KPI properties To get a look into the properties of a KPI group or KPI select such an element from the KPI tree table and press the “Properties…” selection panel button. A popup will appear showing the properties of the selected element categorized by some tabs. Figure 9 properties popup (KPI selected) If a KPI is selected (shown in Figure 9), the tabs “Status”, “Trend”, “Weight”, “Baseline” and “URL” will be available. Otherwise if a KPI Group is selected, the popup shows only “Weight” as a tab. What functionalities these properties have and how to edit them will be explained in section 3.1.7. © 2014 SAP AG – iCI_ ConfigApp_User_Manual_ 20140626.docx User Manual iCI-Configuration App 2.1.2 Define Input Measures This view is structured the same way like “Define Dashboard” View. There exist a chart tree table, an iCI Dashboard preview and a selection panel. 2.1.2.1 Chart Tree Table The chart tree table “Charts & Series” stores charts and series of a KPI. When entering the view the tree table shows no data because no KPI has been selected yet. To do so, there is an additional control in the upper right corner of the table, right next to the Edit-Mode Button. This dropdown box contains all available KPIs. You can type in a KPI name or press the arrow ( ) which opens an item list to select a KPI. Once a KPI is selected the chart tree table shows appropriate data. Figure 10 Tree table “Charts & Series” The root node “Charts” has expandable child nodes. Each of them represents an Input Measure chart of the KPI in the iCI Dashboard. Furthermore a chart includes different graphs which are referred here as series. Three charts can be assigned to a KPI, each with a maximum of three series. © 2014 SAP AG – iCI_ ConfigApp_User_Manual_ 20140626.docx User Manual iCI-Configuration App 2.1.2.2 iCI Dashboard Preview As well as in the first roadmap step the Dashboard preview illustrates how the mapping from iCI Config App to iCI Dashboard is managed. Figure 11 iCI Dashboard preview (Define Input Measures) Selecting a chart in the tree table will highlight one of the three chart sections depending on the number of the chart in the table (shown in Figure 11). Besides selecting a series will highlight the series section of the related chart. The chart “KPI Results” on the left hand side is always generated automatically. 2.1.2.3 Selection panel As well as in “Define Dashboard” the selection panel generates context-sensitive content. Selecting a chart in the chart tree table creates following content (shown in Figure 12). Figure 12 selection panel (Chart selected) © 2014 SAP AG – iCI_ ConfigApp_User_Manual_ 20140626.docx User Manual iCI-Configuration App Choosing a series generates the content below (shown in Figure 13). Important for series is the Input Measure ID. It is a reference to the necessary graph values for the series. How to handle with Input Measure IDs is explained in section 3.2.2. Figure 13 selection panel (Series selected) 2.1.3 Maintenance completed This is the last View. It contains a session log, a history log and a link to the iCI Dashboard. Figure 14 session log When the maintenance for KPIs and charts is done you can review your changes of your current session in the session log (shown in Figure 14). The log table has five columns displaying the essential data. It shows operations (create, update, remove, delete) and the time when they were executed. Column “Type” holds the affected element types (scorecard, KPI group, KPI, KPI properties (thresholds), chart and series). Columns “Old Element” and “New Element” list the names of the affected elements. If the user has got write permissions in the iCI Dashboard, he will automatically have access to the history log. The history log can be reached by clicking the history log button below the session log table. The History Log lists every operation executed by a user in the iCI Config App. It has an additional column “User” containing the SAP user names. To get to the iCI Dashboard a link is offered called “Open iCI Dashboard” on the right hand side above an image showing the iCI Dashboard. © 2014 SAP AG – iCI_ ConfigApp_User_Manual_ 20140626.docx User Manual iCI-Configuration App 3 Configuration Now you are familiar with the navigation of the iCI Config App, so you can start maintaining. 3.1 Maintain KPIs You have to go into roadmap step 1 “Define Dashboard” to maintain the KPIs. 3.1.1 Create a Scorecard To create a scorecard select the root node “iCI Dashboard” in the KPI tree table and press the “Add ScoreCard” selection panel button. Instead of the iCI Dashboard preview, following panel will appear (shown in Figure 15). Figure 15 add new scorecard Type in a name and press “Add”. Then the scorecard will be saved and the KPI tree table will refresh by itself. The new scorecard should be visible now. 3.1.2 Create a KPI Group Creating a KPI group is almost the same as creating a scorecard. Select the scorecard in the KPI tree table where the new group should be added to. Pressing the selection panel button “Add KPI Group” will open a panel (shown in Figure 16). Figure 16 add new KPI group Enter a name and select a weight. The weight factor defines the order in which the KPI groups appear in the iCI Dashboard. The higher the weight factor is set, the more the KPI group is at the top of the list in iCI Dashboard. Press “Add” to save the new KPI group. It will appear in the KPI tree table if you expand the scorecard you selected before. © 2014 SAP AG – iCI_ ConfigApp_User_Manual_ 20140626.docx User Manual iCI-Configuration App 3.1.3 Add an existing KPI Select a KPI group and press the selection panel button “Add KPI”. A new panel appears instead of the Dashboard preview (shown in Figure 17). Figure 17 add existing KPI The table above holds every KPI that already exists, whether it is assigned to a group or not. That means on the one hand you are able to assign unassigned KPIs to a group. On the other hand you can assign a KPI to multiple groups. To help you searching for an existing KPI use the search bar at the upper right corner of the table. It will make proposals while typing a KPI name. Afterwards the table will be filtered by the entered term. If you want to add an existing KPI, select an entry from the table and press “Add”. The KPI should now be visible in the selected KPI group of the KPI tree table. © 2014 SAP AG – iCI_ ConfigApp_User_Manual_ 20140626.docx User Manual iCI-Configuration App 3.1.4 Create a KPI If you want to create a new KPI instead of choosing an existing from the table, click on “Create new KPI” (shown in Figure 17). The table is then replaced by the following panel (shown in Figure 18). Figure 18 add new KPI Enter a name for the KPI. You can enter a Unit as well. Then choose a Calculation Mode (text field named “Mode”) by pressing the arrow ( ). You can choose between SUM (sum) or AVG (average). Also it is possible to set property values. How to do that is explained in section 3.1.7. At the end you click on “Add” to save the KPI. The KPI should now be visible in the selected KPI group of the KPI tree table. © 2014 SAP AG – iCI_ ConfigApp_User_Manual_ 20140626.docx User Manual iCI-Configuration App 3.1.5 MAI It is possible to activate a KPI from a large pool of MAI (Monitoring and Alerting Infrastructure) KPI’s. To do so, select a KPI group and press “Add KPI”. Then click on “Prepare KPI”. The Dashboard preview will be replaced by following table (shown in Figure 19). Figure 19 add new KPI The root node “MAI Scenarios” at the top of the table holds different scenarios which can be expanded. A scenario contains MAI KPI’s that have a name, a text as a description and a status. A status of a KPI can be “Inactive”, “Active” or “Prepared”. To add a MAI KPI to the selected KPI group you have to activate it. The activation will take some time because the extractor of the MAI KPI needs to collect all relevant data from the system first. While the extractor is running the MAI status will be set to “Prepared”. Once the extractor is done, the MAI status is set to “Active” and the MAI KPI should be added to the chosen KPI group in the KPI tree table. © 2014 SAP AG – iCI_ ConfigApp_User_Manual_ 20140626.docx User Manual iCI-Configuration App 3.1.6 Remove a KPI To remove a KPI means it will be removed from its KPI group but it won’t be deleted. The KPI gets unassigned so it is stored in the “unassigned” scorecard and KPI group directly below the root node “iCI Dashboard”. 3.1.7 Set KPI and KPI Group Properties If the user has got write permissions for KPI Properties (Thresholds), he can edit these properties while creating a KPI or KPI group. If a KPI or KPI group already exists, it is possible to edit the properties subsequently by selecting a KPI or KPI group and pressing the selection panel button “Properties”. In the Properties you see following tabs. Figure 20 KPI properties tabs If the user has no read permissions for KPI properties, these tabs will be disabled. Besides the KPI group properties only show the weight tab. Below the content of a tab you find a “Save” button to save all changes which were made while the properties window was open. The content of tab “Status” is illustrated in Figure 21. Figure 21 status tab © 2014 SAP AG – iCI_ ConfigApp_User_Manual_ 20140626.docx User Manual iCI-Configuration App Here you can define the status thresholds for “KPI Value Histories & Monthly Improvement Histories” as well as for “Achievement History & Plan/Actual Deviation”. The deviation to set points can be changed by dragging the range slider to the left or to the right. For a precise adjustment select a slider and press the right arrow key or left arrow key on your keyboard. Pressing the “Default” Button will set the range sliders to their initial position. The colored symbols on the left hand side show which set point relates to which symbol in the iCI Dashboard Application. Figure 22 trend tab Above you can see the “Trend” tab content (shown in Figure 22). A KPI has a trend value which is represented by an arrow in the iCI Dashboard. To adjust the Thresholds of these trend arrows the iCI Config App offers two sliders in the trend tab. Move them to change the thresholds or press “Default” to set them back to their default values. It is mentionable that the trend value (0%) of the yellow arrow is unchangeable. The weight tab is available in KPI group properties and KPI properties (shown in Figure 23). It is responsible for the list ranking of KPI groups and KPI’s in the iCI Dashboard summary view “Business Value”. The higher the weight factor is set, the more an element ascends in the list. Figure 23 weight tab © 2014 SAP AG – iCI_ ConfigApp_User_Manual_ 20140626.docx User Manual iCI-Configuration App To set the baseline of a KPI you have to switch into the “Baseline” tab. The baseline value and the baseline date can be set here (shown in Figure 24). Pressing “Default” sets the baseline to 0.000 and the date will be cleared. To set a new baseline value, type in a number (it can be a floating point number). Also a baseline date should be selected by clicking on the calendar symbol that will open a date picker for you. Now you can choose a date representing the starting point of your baseline value. Figure 24 baseline tab The “URL” tab provides the following settings (shown in Figure 25). Figure 25 URL tab In the details view of the iCI Dashboard you can find a question mark icon ( ) right next to the name of the KPI. This icon contains a URL which is opened in a new browser tab by clicking on it to provide some more information to the specific KPI. If you hover over the icon it will show a tooltip holding a description of the URL. This URL and its description can be maintained in the “URL” tab of the iCI Config App. You can choose whether you take an initial URL or a URL defined by yourself. If you tick the checkbox the iCI Dashboard will show your own URL. Only some KPIs which were predefined have an initial URL. Therefore in most cases it is recommended to create an own URL. © 2014 SAP AG – iCI_ ConfigApp_User_Manual_ 20140626.docx User Manual iCI-Configuration App 3.2 Maintain Input Measures You have to go into roadmap step 2 “Define Input Measures” to maintain the Input Measures. 3.2.1 Create a Chart After selecting a KPI from the KPI dropdown box and switching into Edit-Mode you need to select the root node “Charts” in the chart tree table. An “Add Chart” button will appear in the selection panel. Press this button to open following panel in place of the Dashboard preview (shown in Figure 26). Figure 26 add new chart Enter an appropriate name which is going to be the chart title and press “Add” to save. The chart should appear now as a new entry in the tree table. 3.2.2 Create a Series A new series (labeled graph) can be added to a chart if a chart from the tree table is selected and the “Add Series” button in the selection panel is pressed. The panel below (shown in Figure 27) shows up. © 2014 SAP AG – iCI_ ConfigApp_User_Manual_ 20140626.docx User Manual iCI-Configuration App Figure 27 add new series (existing Input Measure ID) At first enter a name for the series. The next step will be adding an Input Measure ID. This is an identifier for the values the series uses to plot a graph in the iCI Dashboard. There are two possible ways to allocate an Input Measure ID to a series. You can select an existing ID from the Input Measure ID table. This table shows IDs relating to the KPI which is selected in the dropdown box. You can filter the results by using the search bar in the upper right corner. After an ID is selected you can save the series by pressing “Add”. The other way to allocate an ID is to create a new Input Measure ID. This is done by pressing on “Create new ID”. The panel changes (shown in Figure 28). © 2014 SAP AG – iCI_ ConfigApp_User_Manual_ 20140626.docx User Manual iCI-Configuration App Figure 28 add new series (new Input Measure ID) Now you can enter the series name and an own Input Measure ID. In Figure 28 this is exemplified by entering the text “test series” for both text fields. Then the “Add” button is pressed. Afterwards a window pops up (shown in Figure 29). Figure 29 validate Input Measure ID The entered value for the ID has been transformed to a valid ID. This is done by appending the term “KPI” with the KPI ID (here “3”) the series refers to (KPI ID of KPI from the drop down box). Then it is appended with the entered ID value (here “test series”). All alphabetic characters are changed to upper case. Spaces are replaced by underscores. Characters which are not alpha numeric characters will be removed. To create the series you have to press the “Accept” button to confirm the ID generated by the iCI Config App. The new series is now visible in the chart tree table. 3.3 Edit an Element At first you have to switch to Edit-Mode, no matter in which view you are or which element you want to edit. Select an entry from the tree table and the selection panel shows you which attributes of this selected element are editable. Edit the attributes and press the selection panel button “Save”. 3.4 Delete an Element At first you have to switch to Edit-Mode again. Select an entry from the tree table you want to delete. Then press “Delete” in the selection panel. The element will be irrevocably deleted. © 2014 SAP AG – iCI_ ConfigApp_User_Manual_ 20140626.docx User Manual iCI-Configuration App 4 Table of Figures Figure 1 Overview landing page Figure 2 Top level selection Figure 3 Navigation structure Figure 4 Tree table “Scorecards, KPI Groups & KPIs” (unassigned KPIs) Figure 5 Tree table “Scorecards, KPI Groups & KPIs” (structure) Figure 6 iCI Dashboard preview (Define Dashboard) Figure 7 selection panel (root node selected) Figure 8 selection panel (KPI selected) Figure 9 properties popup (KPI selected) Figure 10 Tree table “Charts & Series” Figure 11 iCI Dashboard preview (Define Input Measures) Figure 12 selection panel (Chart selected) Figure 13 selection panel (Series selected) Figure 14 session log Figure 15 add new scorecard Figure 16 add new KPI group Figure 17 add existing KPI Figure 18 add new KPI Figure 19 add new KPI Figure 20 KPI properties tabs Figure 21 status tab Figure 22 trend tab Figure 23 weight tab Figure 24 baseline tab Figure 25 URL tab Figure 26 add new chart Figure 27 add new series (existing Input Measure ID) Figure 28 add new series (new Input Measure ID) Figure 29 validate Input Measure ID © 2014 SAP AG – iCI_ ConfigApp_User_Manual_ 20140626.docx 4 4 4 5 6 6 7 7 8 9 10 10 11 11 12 12 13 14 15 16 16 17 17 18 18 19 20 21 21