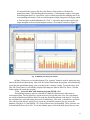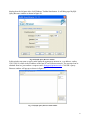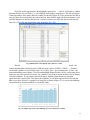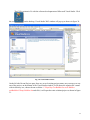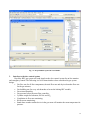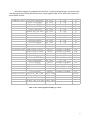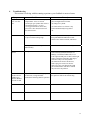
1
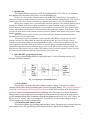
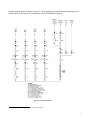
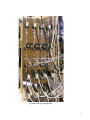
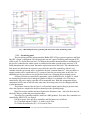
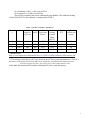
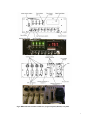
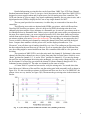
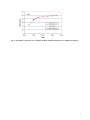
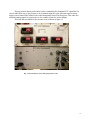
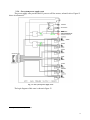
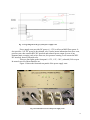
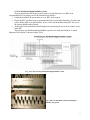
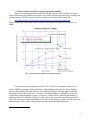
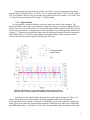
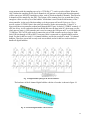
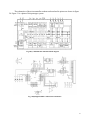
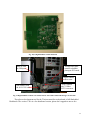
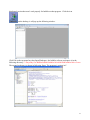
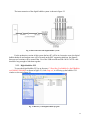
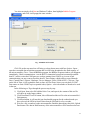
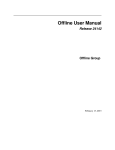
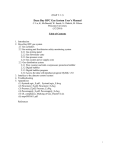
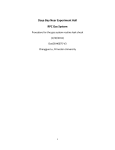
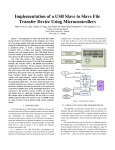
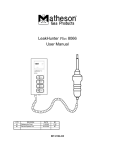
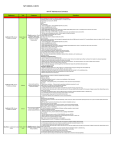
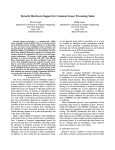
(Draft V.1.2)
Daya Bay RPC Gas Prototype System User’s Manual
C. Lu, K, McDonald, W. Sands, S. Chidzik, M. Peloso
Princeton University
(12/2/2008)
Table of Contents
1. Introduction
2. Daya Bay RPC gas prototype system
2.1 Gas cylinders
2.2 Gas mixing and fire/detector safety monitoring system
2.2.1 Gas mixing panel
2.2.2 Gas flowmeter crate
2.2.3 Gas pressure crate
2.2.4 Gas system power supply crate
2.3. Gas distribution system
2.3.1 Flow resistor and inlet overpressure protection bubbler
2.3.2 Digital bubbler
2.3.3 Digital bubbler program
2.3.4 Access the data with database program MySQL v5.0
3. Interface to the slow control system
4. Troubleshooting
5. Appendixes
(1) SystemLogic_E.pdf , SystemLogic_E.dwg
(2) Flowmeter_E.pdf, Flowmeter_E.dwg
(3) Pressure_E.pdf, Pressure_E.dwg
(4) Powersupply_E.pdf, Powersupply_E.dwg
(5) UL compliance, Marking of Gas_PanelsV2.xls
(6) msp430f1611.pdf
References
1
1. Introduction
The baseline RPC gas mixture is Ar/R134A/Isobutane/SF6 (65.5/30/4/0.5) [1], which has
been approved by Daya Bay safety officer as a non-flammable gas.
The RPC gas system will be similar to that used in the BELLE [2] and BABAR [3] experiments, in
which a gas mixing system distributes the gas mixture to the individual RPCs through simple “flow resistors”,
with the output flow from each flow branch being separately monitored by a low-cost digital bubbler [4].
Mixing of the chamber gases is performed with mass flow controllers. The electronic bubbler system
monitors the chamber gas flow by counting gas bubbles in a small oil bubbler as they pass a photogate.
Detailed histories of the output gas bubbling rate will be available via a local host PC. Slow-control system
and any other authorized networked PC can obtain all data through MySQL database on this host PC. Four
gases will be input from four auto/manual switchover panels to minimize interruptions of the gas flow during
chamber operation.
An extensive detector safety and fire safety system with status monitors and interlocks will be
implemented via four gas control crates.
This prototype system is a simplified version of the Daya Bay RPC gas system. The aim of this
prototype system is for using at IHEP and Daya Bay SAB during RPC Q/C period. The gas cylinder
switchover panels and gas cabinet are not implemented; the safety system is not included. Part of the slow
control signals are provided, which can be used for slow control group testing their hardware/software.
Through the longer term operation of this prototype system we can gain experience and get feedback from
IHEP users to further improve the gas system. This manual is only used for the prototype system. The final
gas system operation manual will be provided when the system is delivered.
1. Daya Bay RPC gas prototype system
The gas system building blocks are shown in figure 1. In the following sections we’ll
describe each block in details.
Fig. 1 Gas prototype system building blocks
2.1 Gas cylinders
The prototype gas system skips the cylinder switchover panels. Four gases are simply
connected to the inlets on the gas mixing panel via 6mm Swagelok fittings. After properly connected
the tubing, careful leakage checking must be performed. Many different types of the leak detector
can be used, such as Matheson Model 8066 LeakHunter Plus. The leak rate at all new connected
fittings must be at the undetectable level with the maximum sensitivity setting of the leak detector.
For the Matheson Model 8066 LeakHunter Plus the maximum sensitivity for Ar is 1x10⁻⁴ ml/sec, for
R134A is 1x10⁻⁵ ml/sec. There is no setting for C4H10 and SF6, we can use the setting of Ar and
R134A, respectively, for their leak detection.
2.2 Gas mixing and control system
This system consists of gas mixing panel and three crates: flowmeter crate, pressure crate and
power supply crate. The gas mixing panel is shown in figure 2 and the block diagram of the
2
monitor/control system is shown in figure 31. In the prototype system the safety monitoring crate is
not included, so in figure 3 the system status crate block should be ignored.
Fig. 2(A). Gas mixing panel.
1
See Appendix (1) SystemLogic_E.pdf for large scale diagram.
3
Fig. 2(B). Photo of gas mixing panel.
4
Fig. 3. Block diagram of the gas mixing and detector/fire safety monitoring system.
2.2.1. Gas mixing panel
The gas mixing panel has incorporated the BaBar RPC/LST gas system experience and Daya
Bay RPC system’s requirement. This mixing panel can mix 4 gases, including small amount of SF6,
which is in 0.5% of total flow rate level. To mitigate the possible interruption due to malfunction of
the gas flow controllers the whole system is constructed on rather spacious panel, and uses VCR
fitting throughout the entire system that makes replacement easier and faster. The redundant mass
flow meters are added into the system to cross check the mass flow controllers, which is very
valuable when the gas mixing ratio is in doubt for detector’s unusual behavior2. Also provided is a
sample port that can be connected to a GC system to check the gas mixing ratio in any time. An
additional port for gas outlet to vent will be used in the case of purging the gas mixing system.
All four gas inlets are controlled by pneumatic valves (indicated as esv in figure 2), which
are actuated by pressurized air or nitrogen cylinder at 100psi via a solenoid valve. The later is
controlled by the power supply crate that will be mentioned later. With this arrangement all gas
components will be turn on and off at the same time, the mixing ratio won’t be changing after the
system interruption.
The pressure sensors (xdcr in figure 2) will send the output signal to the gas pressure crate,
where the signals are compared to the preset normal pressure operating range.
Mass flow meters send the measured signal to the flowmeter crate , where the flow rates are
checked if they are within the preset normal ranges.
The mass flow controllers and flow meters are MKS products. Four mass flow controllers are
controlled by MKS 247D, see figure 4.
Full flow ranges of the gas flow controllers and flowmeters are as follows:
Ch.1 Tetrafluoroethane (C2H2F4) - 0-1000 sccm N2 Flow
Ch.2 Sulfur Hexafluoride (SF6) - 0-50 sccm N2 Flow
2
In the production version to reduce the cost of gas system the redundant mass flowmeters have been eliminated.
5
Ch.3 Isobutane (C4H10) - 0-200 sccm N2 Flow
Ch.4 Argon (Ar) - 0-1000 sccm N2 Flow
The gas flow controllers have been calibrated by soap bubbler. The calibrated Scaling
Control Fact (SCF) for four channels is summarized in Table 1.
Table 1. Gas flow controller’s parameters.
Channel
#
Gas
Full
range for
N2 (sccm)
Gauge
factor
1
2
R134A
SF6
1000
50
100
50
3
4
C4H10
Ar
200
1000
200
100
Gas
Calculated
Correction
Scaling
Factor*
Control
Factor
(SCF)**
0.3115
31.2
0.2502
12.5
0.273
1.4119
54.6
141.2
Calibrated
SCF
Calibrated
at flow rate
(sccm)
36
11
200
5
57
160.5
40
755
*Obtained from:
http://www.teledyne-hi.com/Manual/Flow/111-052007%20Nall%20Mass%20Flowmeter.pdf
** The Scaling Control Factor (SCF) are shown on the 247D rear panel potentiometers. The SCF is
the product of the Gauge Factor for the MFC in use and the Gas Correction Factor for the gas in use:
SCALING CONTROL FACTOR = GAUGE FACTOR x GAS CORRECTION FACTOR
In this table the calculated SCFs and the calibrated SCFs have some discrepancy.
6
Fig.4. MKS 247D four-channel readout box, (Top) front panel, (Bottom) rear panel.
7
Detailed information on using this box can be found from “MKS Type 247D Four-Channel
Readout Instruction Manual”. Here we just give a brief description of this control box. MKS 247D is
designed as power supply/readout and set point source for four analog mass flow controllers. The
247D unit consists of a power supply, four signal conditioning channels, four set point circuits, and a
digital panel meter (DPM) to display the flow rate of any single channel of a MFC.
The rear panel provides four connectors, via cables they are connected to four mass flow
controllers.
The following test results are obtained with OPERA gas mixture, which is different from
Daya Bay RPC baseline gas mixture. After it is delivered to IHEP, the mixing ratios have been
changed to the latter mixture. Since isobutane is a flammable gas, its ratio in a gas mixture needs to
be controlled below its flammable limit. Unless you are experts and want to make your adjustment to
the mass flow control system, you are not supposed to touch ANY of the dials, knobs and switches
on both front and rear panels. Otherwise you might change the mixing ratio and make a flammable
gas mixture without your notice. Please take it seriously! The only thing you are supposed to do if
you are on shift is choosing each channel by rotating the channel select knob, and read the digital
meter. Compare these numbers with the preset value, and the displayed numbers on “Gas
Flowmeter” crate, all three sets of numbers should be very close. The reading on gas flowmeter crate
has been adjusted at the total flow rate of 100sccm. If you are running the system at different flow
rate, the reading might be somewhat different from flow controllers and could be a few percent of
deviation.
The operation of MKS 247D is set in the ratio mode, the channel #1 (Isobutane) is the master
channel; the other three channels are slaves. On the front panel the Set Point Source Switch is set at
“Ratio” position for channel #2, 3, 4, and at “Flow” position for channel #1. If you need to change
the total flow rate and maintain the mixing ratio unchanged, you only need to change the flow rate of
the first channel. For Daya Bay gas mixture the channel #1 (master channel) changes to R134A,
Isobutane becomes channel #3. The other two channels are the same as before.
A Varian 3900 GC system has been used to verify the mixing ratio. Test results show that
from 100sccm to 1000sccm of the total flow rate the mixing ratio holds reasonably well as shown in
figure 5(A). We also tested the gas mixture in different total flow rate for a 2m x 1m IHEP RPC, the
plateau curves are very similar, see figure 5(B). That means the gas mixing ratios in the mixtures are
similar.
(A)
Fig. 5. (A) Gas mixing fraction in different total flow rates (OPERA gas mixture).
8
(B)
photo
of the plateau
gas mixing
panel
shown
in figure
7.
Fig. 5.A (B)
Efficiency
of a 2m
x 1misRPC
chamber
in different
total flow rate (OPERA gas mixture).
9
2.2.2. Gas flowmeter crate
The gas flowmeter crate is used to display the gas flow rate from seven mass flow meters:
four for each gas, three for the water vapor control branches: total, dry branch and water vapor
added branch. Simpson model H335 controller unit is used for the flow rate display and safety
control. A normal flow rate band is defined for each of seven flow meters through the Simpson
controller, if the flow rate is out of this preset band, the build-in relay of the Simpson controller
will be acting accordingly. Figure 6 shows the schematics of this crate3.
Fig. 6 Gas flow meter crate.
The logic diagram is shown in figure 7.
3
See Appendix (2) Flowmeter_E.pdf for large scale schematics.
10
Fig. 7. Logic diagram of the flowmeter crate.
This crate displays the gas flow rate measured by the flow meters, controls a relay contact
that closes on normal flow rate and opens on bad flow rate. Send this signal to gas pressure crate,
which will control the solenoid valve. The abnormal flow rate/pressure signal will shut off the
solenoid valve, which in turn will close all gas inlets to the mixing panel. In reality the gas flow
rate/pressure fluctuation due to power supply glitch and/or atmospheric pressure sudden change
is quite often during certain season. To eliminate this type of interfere there is a “BYPASS
TIMER” push button, push this button can bypass the status check logic for 5 minutes
(meanwhile a buzzer will be actuated to remind you that the bypass is acting), keep the solenoid
valves open for such time period. Usually within this period the environmental fluctuation would
calm down and return to normal, therefore the gas system will continually operate w/o interrupt.
When you see all flow rates and pressures show normal value, the Simpsons show no warning
signs on the right side bar, you should push the RESET/START button, and the “Flow Interlock
OK” green light should be back on.
There is a RESET/START button on the front panel. When the entire gas system is just
powered up, push and hold this button down until all seven flow rates displayed on the Simpson
meters reach normal value (no warning sign on any of the meters), then release the button. By
doing this the system will lock itself in a normal operation mode until the next abnormal state
occurs. After you push this button, the green light labeled as “Flow Interlock OK” should be on.
Also the water branches green light should be on, red light should be off.
The water branches are used for adding water vapor into the gas mixture. There are three
Simpson meters to display the flow rate for branch #1, #2 and the total. Branch #1 gas mixture
will be bubbling through water, then combine with the dry gas mixture from branch #2. The
metering valves on branch #1 and #2 can adjust the flow ratio between them, thus adjust the
water vapor content in the mixture. For the present set of the prototype system the water bubbler
is not provided, you can connect either branch to the RPC chambers, and just simply shut off the
other branch.
Figure 8 shows the picture of the front and rear panels of the flowmeter crate.
11
Fig. 8. Front and rear view of the flowmeter crate.
2.2.3. Gas pressure crate
The gas pressure crate is used for displaying the gas pressure at the upper stream of the flow
controller for each gas. The gas pressure sensor is MKS Type 892 transducer4. When any gas shows
lower than preset pressure limit, this crate will generate warning signal, shut off the solenoid valve
that will in turn shut off all gas inlet ports on the gas mixing panel. Figure 9 shows the schematics of
this crate5.
4
5
See the manual of the pressure sensor: http://www.mksinst.com/docs/UR/890_892DS.pdf
See Appendix (3) Pressure-E.pdf for details.
12
Usually the flow rate can maintain at the normal level for a while even the gas pressure drops
below the normal value. The gas pressure drop gives the first sign of the gas cylinder depletion. Only
the lower limit for the pressure display/control Simpsons is set, the upper limits are set at much
higher value, under no circumstance such over pressure warning will occur.
The gas pressure can be set by adjusting the pressure regulators on the gas mixing panel. The
recommended pressure is 30 psia for all four gases.
Fig. 9. Gas pressure crate.
The logic diagram of this crate is shown in figure 10.
Fig. 10. Logic diagram of the gas pressure crate.
13
The gas pressure display and control is also accomplished by Simpson H335 controllers. In
case of either flow rate or gas pressure is out of normal range this crate will send signal to power
supply crate to shut off the solenoid valve and consequently shut off all four gases. This crate also
sends the analog signals of gas pressure to slow control system for on-line display.
The front and rear panels for the pressure crate is shown in figure 11.
Fig. 11. Front and rear view of the gas pressure crate.
14
2.2.4. Gas system power supply crate
The power supply crate provides the DC power to all flow meters, solenoid valves. Figure 12
shows its schematics6.
Fig. 12. Gas system power supply crate.
The logic diagram of this crate is shown in figure 13.
6
See Appendix (4) Power-E.pdf for details.
15
Fig. 13. Logic diagram of the gas system power supply crate.
Power supply crate provides DC power (+/- 15V) to all seven MKS flow meters. It
also provides +24V DC power to the solenoid valve. It takes status information from flow crate,
pressure crate, then controls RPC HV interlock and solenoid power output. In case of any
abnormal state occurring, such as low flow rate, low pressure warning, it will actuate the RPC
HV interlock, shut off solenoid valve.
There are four lights on the front panel: +15V, -15V, +24V, (solenoid) Valves open.
In normal case all of them should be on.
Figure 14 shows the front and rear panels of the power supply crate.
Fig. 14. Front and rear view of the power supply crate.
16
2.3 Gas distribution/digital bubbler system
The gas mixture after the mixing system needs to be distributed to every RPC in an
experimental hall. The design goal can be summarized as follows:
• Uniformly distribute the gas mixture to every RPC in the system;
• Divide the RPC gas flow in one experimental hall into several panel-branches, of which each
will be further split to 16 sub-branches. In case of one sub-branch has leaky RPC the rest of
the system should not be affected;
• At the end of each sub-branch should implement a monitoring device to check if there is any
leaky RPC.
The prototype gas distribution/digital bubbler system is one such panel-branch. A sketch
diagram of this system is shown in figure 15(A).
Fig. 15(A). Gas prototype distribution/digital bubbler system
Fig. 15(B) Gas distribution (bottom) and digital
bubbler (top) panels.
17
2.3.1 Flow resistor and inlet overpressure protection bubbler
We have calculated the pressure drop ΔP for the RPC gas flow path. The RPC itself won't
bring in noticeable pressure drop due to large cross section. The major pressure drop is coming from
the long tubing. A CERN web site provides a calculator to calculate such pressure drop:
http://detector-gas-systems.web.cern.ch/detector-gas-systems/Tools/deltaP.htm
Figure 16 shows the verification of this calculator with some real test done by Bob Messner7 of
BaBar.
Fig. 16. Verification of CERN pressure drop calculator.
Use this tool to calculated the gas mixture (75/21/4 Ar/R134A/Isobutane), which is very
close to OPERA gas mixture, under maximum 5 volume changes/day flow rate. The calculated
pressure drop through 30m long, 4mm ID (1/4' OD) Polyflo tubing (30m long tubing is about the
round trip of the gas flow path) ΔP = 0.75cm WC. The digital bubbler's oil height is set at 0.5cm.
Total pressure drop through the system is 1.25cm WC. After the flow resistor an inlet bubbler is
implemented before connecting to RPC, it is used as the input overpressure protection for the RPC.
We set the overpressure protection bubbler at 2cm WC for the prototype system. We will make some
additional space in the future in case of higher protection pressure threshold needed.
7
Bob Messner, private communication.
18
Under normal operation mode the gas flow rate will be 1 volume change/day, the pressure
drop through 30m tubing will be 0.15cm WC. We use Upchurch Scientific U-101 S.S. tube, which is
0.02” bore diameter and 5cm long, the pressure drop with such flow rate would be 1.02 cm WC that
is 7 times of the pressure drop for 30m long 1/4” Polyflo tubing.
2.3.2. Digital bubbler
For a gas detector system the bubblers are always used at the outlets of the chambers. The
digital gas bubbler can provide a quick diagnosis of gas flow on-line; according to BaBar and Belle
it turns out to be a very useful system. We use a similar digital bubbler design as Belle RPC used [6].
In this system the bubblers are instrumented with the photogates. Its working principle is illustrated
in figure 17. Without the gas bubble the light reaches the photogate through oil without interruption.
When bubble passes, it will reflect partial light, and the light intensity at that moment would be
reduced, thus generates a pulse signal to the photogate PC board.
To digital bubbler
readout board
(A)
(B)
(C)
Figure 17. Digital gas bubbler. (A) Mechanical structure of the bubbler; (B) Working
principle of the photogate; (C) The digital bubbler output signal recorded by
microcontroller, it shows 8 channels are bubbling, the other 8 channels are not.
A schematics of the digital bubbler photogate PC board is shown in figure 18. This is a 16channel board that provides input signal to the microcontroller readout board. Each of the
microcontroller board can handle 16 channels. TI MSP430F1611[7] microcontroller is used on the
board, figure 20(A) shows the functional block diagram of MSP430x161x chip. It has 10KB RAM
and 48KB flash memory. The build-in 12-bit ADC can sequentially sample 8 channels of the input
19
at one moment with the sampling rate set by a 32768-Hz (215 ) watch crystal oscillator. When the
ADC finishes the sampling for the first 8 channels it will generate a switch signal that subsequently
will be sent to two MAX4674 multiplexer chips, each of which can handle 4 channels. Thus the next
8 channels will be sampled by the ADC. The system will be running for a few seconds that is long
enough to collect several cycles of the bubbles. All the data is stored in the RAM memory of the
microcontroller. At the end of the data taking cycle the program will set all 8 bits up to 1 for a
specific register U1TXBUF that is the serial port interface on the microcontroller. A host PC is
supervising the microcontroller readout board through RS232 port. It checks U1TXBUF routinely, if
all 8 bits are up, it will readout the data from RAM and store the data in the PC, then starts over the
whole process again. A USB extender pair is used to connect the USB port on PC to a USB hub with
7 USB slots. The CAT5E cable used to connect the pair of USB extender can be as long as 100ft.
Each USB slot through a USB to RS232 convertor cable is connected to a digital bubbler readout
board. For the far hall we need 11 16-channel bubblers, and for the near hall we need 7 16-channel
bubblers. Therefore at near hall we only need one such hub, and at far hall we need two hubs to
handle all digital bubblers.
Fig. 18. Digital bubbler photogate PC board schematics.
The hardware of the16 channel digital bubbler with the oil catcher is shown in figure 19.
Fig. 19. 16-channel digital bubbler with oil catcher.
20
The schematics of the microcontroller readout test board and its picture are shown in figure
20. Figure 21 is a photo of this prototype system.
Fig. 20(A) MSP430x161x functional block diagram.
Fig. 20(B) Digital bubbler readout board schematics
21
Fig. 20(C) Digital bubbler readout PC board
Host PC and
its USB port
Through flat cables
connect to bubbler
photogate PC boards
Digital bubbler
readout crate
USB extender with
100 ft CAT-5E cable
7-Port USB hub
with 7 USB to
RS232 converters
Fig. 21 Digital bubbler readout crate and its host PC with USB extender/100 ft long CAT-5E cable.
The software development tool for the TI microcontroller readout board is IAR Embedded
Workbench. The version 3.30A is a free distributed version, please don’t upgrade to newer free
22
distributed version that won’t work properly for bubbler readout program. Click the icon
on the desktop, it will pop up the following window:
Click File on the top menu bar, then Open|Workspace, the bubbler software workspace is in the
following directory: C:\Daya Bay Gas Bubbler\bubbler\bubbler16ch-09092008\bubbler16ch-v2.eww.
The opened workspace is shown in following figure. The program is written in C.
23
The interconnection of the digital bubbler system is shown in figure 22.
Fig. 22 Interconnection of the digital bubbler system.
For the production version of this system the host PC will be in electronics room, the digital
bubbler hardware and readout crate will be located on the RPC supporting platform, the distance
between two locations will be around 20m. Use of the USB extender and one 100 ft CAT5E cable
should be long enough to link them together.
2.3.3. Digital bubbler GUI
To open the digital bubbler GUI go to directory C:\Daya Bay Gas Bubbler\Lu Stuff\Bubbler
test\ Bubbler Published\ as shown in figure 23, click setup.exe, it will bring up the bubbler GUI
window as shown in figure 24.
Fig. 23 Directory of the digital bubbler program
24
You also can simply click Start on Windows Taskbar, then highlight Bubbler Program
and click, it will popup the same window.
Fig. 24 Bubbler GUI window
Click File on the top menu bar will bring up a drop-down menu with four choices: Open –
open the executable data acquisition program and wait for being download to the flash memory of
the microcontroller; Close – close the Bubbler program, the Bubbler Program window will disappear
immediately; Check communication – test the RS232 connection between microcontroller and the
host PC, in this version the COM ports we used are starting from COM21 up, in case of bad
communication you may want to check the host PC Ports setting, which can be accessed through
Start | Control Panel | System | Hardware | Device Manager | Ports (COM & LPT). Click on + sign
on the left of Ports, it will expand the Ports to show all Com Ports, where you can check if COM
Port names are from COM21 up in sequential order; Option – select the number of boards to be used
in the run.
In the following we’ll go through the process step by step:
1) Click Open, then select file bubbler16ch-v3.txt, and open it, the content of this txt file
will show up on the Input window;
2) Click Download TI txt File button, this will download the txt file to the microcontroller’s
flash memory;
3) Click Run button, it will run this just downloaded program for the readout boards you
have selected, the LEDs in front of these boards will flash for a few seconds;
4) Wait for a few seconds to let the microcontroller finish the data taking, then click Upload
Data button. The data in RAM memory of the microcontroller will be transferred to host
25
PC meanwhile the progress bar above the Retrieve Data window will show the
transferring status. Upon finishing the data transfer a 12-histograms window will popup.
Each histogram shows 16 vertical bars, each of which represents the bubbling rate for its
corresponding sub-branch. Click on each histogram a larger histogram will popup, which
is clear enough to read the bubbling rate. Click × sign on the upper-right corner of the
larger histogram will close this histogram window. An example is shown in figure 25.
Fig. 25 Bubbling rate histogram windows
In figure 24 there are several other buttons. The “minutes” button is used for setting the time
interval between each data taking. After click the Upload Data button the program will automatically
repeat the data upload/data taking cycle according to this “minutes” setting. To stop the timer click
Stop The Timer button, it will halt the program and change the label to Start The Timer. Click the
button again will resume the program.
2.3.4. Access the data with database program MySQL v5.0
The bubbling frequency data are collected in a database called newtest, table name is
newfrequencydata. The raw data files, which can be used to plot the pulse curve for each channel,
are stored in subdirectory Bubbler Data File under the Shared Documents of the host PC. Each day
has a subdirectory, and each run has next level of subdirectory. Files with _p attached are ascii data
files, which can be directly read by Excel. From any networked computer you can access this
database if MySQL v5.0 and MySQL GUI Tools software have been installed. These softwares can
be downloaded from web for free. To run the database query click on MySQL Query Browser icon
26
displayed on the left pane after click Windows Taskbar Start button. It will bring up a MySQL
Query Browser window as shown in figure 26.
Fig. 26 MySQL Query Browser window
In this window the name of Server Host should be replaced by the host PC’s IP address, such as
128.112.84.90, which is the IP address of the host PC on Princeton network. The password can be
obtained from me, just send me a request email: [email protected]. Click OK a Query
Browser window will pop up as shown in figure 27.
Fig. 27 MySQL Query Browser intial window
27
Click File on the top menu bar, then highlight Open Query …, click it, it will open a window
showing the files in Local Disk (C:), select MySQL-data.qbquery, and Open it. This file will appear
in the top window of the Query Browser window as shown in figure 28. If we choose the first line to
execute, place the mouse point at the end of this line, then click the right side Execute button, it will
fetch the database records into the browser’s window. Because we select the data records after the
Data_ID = 2560, thus the fetched data starts from Data_ID = 2561.
Fig. 28 Illustration of the MySQL Quesy Browser results
The database table consists of five columns: Data_ID – the data ID number; Board – the
readout board number, labeled by their COM port name, such as COM21, COM22 …; Channel –
sub-branch’s number for each board, from 1 to 16; Date_Time – the recording time; F_data – the
measured bubbling rate in Hertz. Click File and highlight Export Results, click it, on the drop-down
menu you can select various file format. For example if you want to export the data to Excel format,
click the fourth line. If you already checked the Query Options | Open results in associated
application after export (Click Tool menu, then Options), it will direct open an Excel file with the
data set you have selected. A sample Excel strip plot is shown in figure 29, we can see the bubbling
rate measured by the digital bubbler is reasonably stable.
Fig. 29 Sample strip chart of the bubbling rate of one channel (Y is in Hz).
28
The GUI is written in C# with the software development tool Microsoft Visual Studio. Click
the icon
on the desktop, Visual Studio 2005 window will pop up as shown in figure 30.
Fig. 30. Visual Studio window.
On the left side Recent Projects pane, there are several existing projects name, move mouse over any
one of the project, on the bottom of the Visual Studio window, it will shows the solution file’s name
with its directory tree, choose the one as below: C:\Daya Bay Gas Bubbler\Lu stuff\ Bubbler
test\Bubbler-CSharp\ Bubbler.sln and click, it will open the entire solution/project as shown in figure
31.
29
Fig. 31. Project Bubbler opened in Visual Studio.
3.
Interface to the slow control system
Daya Bay RPC gas system will send signals to the slow control system for on-line monitor
and emergency control. The following is a list of items that have been considered in gas system
design:
• Gas flow rate for all four components, the total flow rate and dry/wet branches flow rate
for the gas mixture;
• Gas bubbling rate for every sub-branches to locate the leaking RPC module;
• Gas mixture humidity;
• Gas pressure before the mass flow controller;
• Cylinder weight for Isobutane, R134A and SF6;
• Ventilation air flow rate monitoring;
• HAD sensors monitoring;
• Stand-alone weather station device in the gas room will monitor the room temperature/air
pressure.
30
All of these signals are summarized in the table 2. In the present prototype system the status
crate has not been provided, therefore the slow control signals listed in Gas status crate section are
not available for now.
Flowmeter crate Flow rate(Isobutane)
Flowr rate(Argon)
Flow rate(R134A)
Flow rate(SF6)
Total flow rate
Branch #1 flow rate
Branch #2 flow rate
DC
DC
DC
DC
DC
DC
DC
level
level
level
level
level
level
level
0
0
0
0
0
0
0
-
10V
10V
10V
10V
10V
10V
10V
J3
J3
J3
J3
J3
J3
J3
Pressure crate
DC
DC
DC
DC
level
level
level
level
0
0
0
0
-
10V
10V
10V
10V
J6
J6
J6
J6
Pressure(Isobutane)
Pressure(Argon)
Pressure(R134A)
Pressure(SF6)
Gas status crate
HAD sensor status
switch
O(alarm)/C(normal)
J10
Ventillation status
switch
O(alarm)/C(normal)
J10
Scale #1(Isobutane)
switch
O(alarm)/C(normal)
J12
Scale #1(Isobutane)
DC level
0 - 10V
Scale #2(R134A)
switch
O(alarm)/C(normal)
J12
Scale #2(R134A)
DC level
0 - 10V
Scale #3(SF6)
switch
O(alarm)/C(normal)
J12
Scale #3(SF6)
DC level
0 - 10V
Flow rate status
switch
O(alarm)/C(normal)
J11
Pressure status
switch
O(alarm)/C(normal)
J11
HV interlock
switch
O(alarm)/C(normal)
J11
Weather station Gas Stor. Rm. temp direct read
RS-232
Gas Stor. Rm. air presdirect read
Gas Mix. Rm. temp direct read
RS-232
Gas Mix. Rm. air pres direct read
Table 2. Slow control signals from RPC gas system.
31
4.
Troubleshooting
This section is evolving with the running experience; your feedback is most welcome.
Symptoms
Possible cause
All gas flow meters
show zero flow
rates.
(1) The solenoid valve doesn't open,
all pneumatic valves are closed.
(2) Nitrogen gas cylinder does not have
enough gas pressure (< 4 atm ).
(3) Any gas channel has lower than
preset lower flow limit, thus shut off
the solenoid valve.
(1) Check if all four gases have
pressures higher than low limits.
(2) Change N2 cylinder.
(1) Gas pressure and/or flow rate is out
of preset normal running range.
Solve the pressure/flow rate problem first,
then push RESET/START button until
all flow rates return to normal, and release.
Buzzer activated.
Histograms show
all zero
No data file saved
In the relevant
subdirectory,
but the database
records are OK.
Remedy
(3) Check 247D to see if there is any
switch unintentionally being turned
off.
(2) Bypass button has been pushed
unintentionally.
After 5' it will turns off automatically.
COM port lost connection.
(1) Check COM port communication: Start|
Control Panel|System|Hardware|Device
Manage, click Ports(COM & LPT) to see
if all required COM ports are there and in right
Order. Unplug the USB cable, then plug in,
sometime it may solve the problem.
(2) Sometime the electric interference,
such as plug in a new device into the
same power strip, may disturb the COM
port communication. The above method
may also solve the problem.
A possible minor software bug may
be the cause, a single bad data
blocked the following data file operation.
Restart the Bubbler GUI may solve
this problem. Will fix the software bug.
32
5.
Appendixes
(1) SystemLogic_E.pdf , SystemLogic_E.dwg
(2) Flowmeter_E.pdf, Flowmeter_E.dwg
(3) Pressure_E.pdf, Pressure_E.dwg
(4) Powersupply_E.pdf, Powersupply_E.dwg
(5) UL compliance
All parts used in the gas system are checked for their UL compliance, detailed
information is summarized in Marking of Gas_PanelsV2.xls. All parts are UL compliant.
(6) msp430f1611.pdf (“MSP430x15x, MSP430x16x, MSP430x161x Mixed Signal
Microcontroller”)
References
1. C. Lu and K. McDonald, DayaBay RPC Gas Safety System Design (June 19, 2008), DocDB #2691.
2. A. Abashian et al., Nucl. Instr. Meth. A449, 112 (2000).
3. S. Foulkes et al., Gas system upgrade for the BaBar IFR detector at SLAC, Nucl. Instr. Meth. A 538, 801
(2005).
4. M. Ahart et al., Flow Control and Measurement for RPC Gases, Belle Note 135 (Aug. 26, 1996),
http://wwwphy.princeton.edu/~marlow/rpc/gas/flow.ps
5. A. Paoloni et al. Gas mixture studies for streamer operation of Resistive Plate Chambers at low
rate, NIM A583(2007)264
6. Daniel Marlow, “Glass Resistive Plate Chamber in the Belle Experiment”, Seminar at Rice University, July
9, 1999. http://wwwphy.princeton.edu/~marlow/talks/rice/rice.pdf
7. “MSP430x15x, MSP430x16x, MSP430x161x Mixed Signal Microcontroller”, Texas Instruments.
33