1
Research Approach
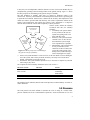
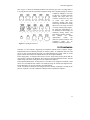
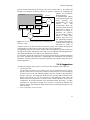
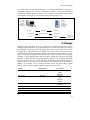
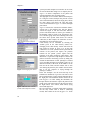
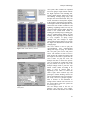
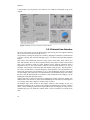
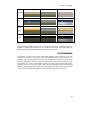
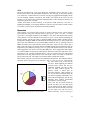
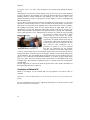
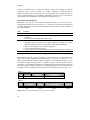
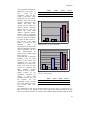
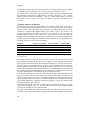
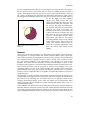
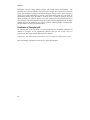
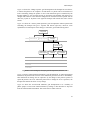
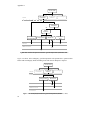
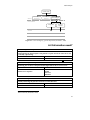
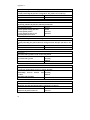
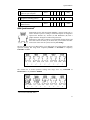
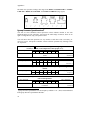
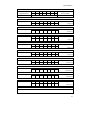
scale. Figure 2.3 shows the SAM questionnaire. The first line goes from a very Big Smile to
a very Big Frown. This line represents feelings that range from completely happy or elated to
completely unhappy or sad. The
second line of SAM represents
feelings that range from very
excited or involved to very calm
or bored. The third line
represents feelings that range
from being controlled to be being
taken care of or being in-control
or on top of things (large figure).
By using this questionnaire, we
are interested in find changes of
emotional feeling before and
after therapy sessions (stimuli).
The
analysis
for
SAM
questionnaire
results
use
ANOVA repeated measure with
Cronbach’s
alpha
for
its
reliability consistency measure.
Figure 2.3: SAM Questionnaire
2.4 Conclusion
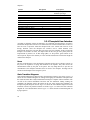
Generally, we used software engineering development methods such as analysis, design,
implementation and evaluation principals. In analysis phase, we conducted interviews and
survey in order to find features that need to be implemented in the system. Then we would
ignore features that could not be implemented on our development machine.
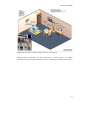
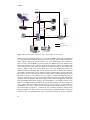
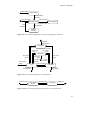
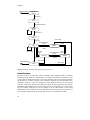
In the design phase, we designed two kinds of UI, the virtual world for the patient and the
user interface control for the therapist. We took into account the guidelines in HCI, VR and
VRET design. The detail of this phase will be explained in chapter 3.
In the implementation phase, for the patient’s UI, textures were designed or modified, sound
effects were recorded and new features were added by using our software development tools.
For the therapist’s UI new user interface was implemented.
At last, two kinds of evaluations were designed, for the usability of therapist’s UI and for the
presence of patient’s UI. The conducted evaluation will be explained in chapter 4.
11