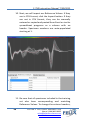
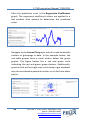
1
DECLARATION OF CONFORMITY Manufacturer: CID Bio Science, Inc. Felix Instruments – Applied Food Science 1554 NE 3rd Ave Camas, WA 98607 Declares that the CE-marked Product: Product Models (s): Model F-750 Complies With: 89/336/EEC Electromagnetic Compatibility Directive 73/23/EEC Low Voltage Directive Compliance Standards: EN 55027 RF Emissions Information Technology Equipment EN 50082-1 EMC Immunity Standard EN 60950 Safety of Information Technology Equipment Including Electrical Business Equipment February 11, 2015 Leonard Felix President Document Overview Introduction ............................................................................. 1 Features ............................................................................... 4 Specifications....................................................................... 5 Theory of Operation ............................................................ 6 Operating Instructions.............................................................. 9 Unpacking the F-750............................................................ 9 Loading the Battery ............................................................. 9 Basic Operation ................................................................. 11 Navigating Menus .............................................................. 13 Menu Map ........................................................ 14 Select Model ..................................................... 15 Browse Measurements ........................................ 16 Setup Instrument ............................................... 17 Warnings ........................................................................... 23 F-750 Data ......................................................................... 24 Instructions for Creating a Model .......................................... 27 Step 1: Creating a Training Set .......................................... 27 Step 2: Collecting Reference Values .................................. 34 Step 3: Importing a Training Set and Reference Values into Model Builder .................................................................... 35 Step 4: Creating a Model ................................................... 39 Step 5: Saving a Model to F-750 ........................................ 51 Step 6: Validating the Model ............................................. 51 Additional Instructions: ..................................................... 53 Merging Training Sets in Model Builder ................... 53 Alternate Method for Training Set Creation: Manual Data Collection and Entry ..................................... 55 Building a Model to Measure Two Traits .................. 61 Using the Small Fruit Adaptor Accessories ............... 63 Cleaning and Maintenance ................................................ 66 Firmware Update Procedure ................................. 67 Supporting Science ................................................................. 68 Fish Fat and Moisture Content........................................... 68 Wine Grape Anthocyanin Content ..................................... 69 Mango Model Optimal Wavelengths ................................. 70 Kiwifruit.............................................................................. 71 Apple Dry Matter ............................................................... 71 Instrument Precision Optimization .................................... 71 Publications ........................................................................ 72 F-750 Vocabulary Definitions .................................................. 75 Technical Support ................................................................... 79 Customer Service ............................................................... 80 Frequently Asked Questions .............................................. 81 Felix Instruments Hardware Warranty ................................... 85 Appendix I: Mango Model Building Standard Operating Procedure (SOP)...................................................................... 87 F-750 Production Test Check Sheet ........................................ 94 Warranty Registration Card .................................................... 96 This manual is written for firmware version 1.1 F-750 Instruction Manual 7/30/2015 Introduction The F-750 Produce Quality Meter aids agricultural suppliers in developing a fruit maturity and sweetness management process for the benefit of growers, processors, and consumers. Judging fruit maturity by shape and color alone results in varying success. The F-750 delivers the stability, repeatability, and precision that is necessary for successful chemometric-based measurements without destroying the product in a portable easy-to-use device. It comes equipped with a GPS for spatial mapping, enabling users to generate orchardwide maps of fruit parameters. With this information, users can plan harvest sequences and improve crop management techniques. The F-750 uses Herschelinfrared or NIR-a spectroscopy to estimate a variety of important produce quality indicators such as dry matter, Brix (total soluble solids), or acid content. “For quantitative analysis of complex samples, fast and inexpensive spectroscopic methods are preferable to the slow, expensive, and destructive ‘wet chemical’ approach. Historically, one disadvantage of spectroscopic methods has been the difficulty of determining frequency regions where the constituent of interest selectively interacts with light. Now with the power of multivariate techniques such as Partial Least Squares, we can use the spectra (X) to predict the concentration of the constituent of interest (Y), with accuracy approaching that of wet chemistry.” 1554 NE 3rd Ave, Camas, WA 98607, USA Phone: (360) 833-8835 [email protected] www.felixinstruments.com 1 F-750 Instruction Manual 7/30/2015 Adapted from Sjostrom and Wold (1983). A multivariate calibration problem in analytical chemistry solved by partial least-square models in latent variables. Analytica Chimica Acta, (150) 61-70. Dry matter (DM) is the ratio of the water content to the dry weight of the fruit. Dry matter is an indicator of both taste and texture in certain fruits. High dry matter fruits have sweeter tastes, stronger flavors, higher acidity, greater quantities of sugar and a higher vitamin C content. Fruit continue to accumulate dry matter until harvested. Once harvested, the DM of the fruit and the upper limit for soluble sugars the fruit develops is fixed. The soluble sugar content (SSC) of a fruit and the degrees of brix (Obrix) are interchangeable units of measure for sugar concentration. In order to generate an NIR (Near Infrared) prediction model, a calibration or training set must be created by collecting the spectra of samples of the fruit in interest using the F-750. The parameter(s) (i.e. dry matter, Brix, etc) are then collected from the same samples, often a wet chemical approach, and loaded onto provided software along with the training set to build the NIR prediction model. By scanning fruits with the F-750 loaded with this model, the user can use the information from the device to determine readiness for harvest, sale, or consumption. 2 1554 NE 3rd Ave, Camas, WA 98607, USA Phone: (360) 833-8835 [email protected] www.felixinstruments.com F-750 Instruction Manual 7/30/2015 F-750 Produce Quality Meter 1554 NE 3rd Ave, Camas, WA 98607, USA Phone: (360) 833-8835 [email protected] www.felixinstruments.com 3 F-750 Instruction Manual 7/30/2015 Features Portable, lightweight and easy to operate. -One button operation for recording new measurements Repeatable, precise, and non-destructive measurements. -Spectrometer standard deviation > 0.017% True sunlight readable transflective display. -Contrast of this display actually increases under brighter sunlight Removable, re-chargeable standard sized batteries. -Two sets of batteries included - Stand-alone battery charger included -Additional button-top 19670 (or protected 18650) batteries can be purchased from a preferred battery vendor 48 channel GPS -Allows spatial mapping of collected data 4 1554 NE 3rd Ave, Camas, WA 98607, USA Phone: (360) 833-8835 [email protected] www.felixinstruments.com F-750 Instruction Manual 7/30/2015 Specifications Spectrometer ZEISS MMS1 VIS-NIR Wavelength Range 285 – 1200 nm (+/- 10 nm) Spectral Sampling 3 nm Spectral Resolution 8-13 nm Accuracy Battery Life Expected: +/- 0.5oBrix RMSEP (root mean square error of prediction) 1600 scans (Variable) PC Interface USB and SD card Data Recorded with Each Measurement Temperature Range Raw Data Reflectance Absorbance Second & First Derivatives Second Derivative Absorbance 0-50OC Weight 1 kg Dimensions 7.1 x 4.75 x 1.75 inches ( 18 x 12 x 4. 5 cm ) 1554 NE 3rd Ave, Camas, WA 98607, USA Phone: (360) 833-8835 [email protected] www.felixinstruments.com 5 F-750 Instruction Manual 7/30/2015 Theory of Operation In order to generate an NIR model, create a training set using the F-750 to record 2nd derivative absorbance data. In order to make a strong model, training set samples must consist of the entire range of fruit development for the internal fruit quality parameter to be analyzed. Other sources of variability should also be considered when selecting training set samples and should include samples with any parameters that could affect spectral response. Next, using these same specimens, a property of interest (reference value) is collected from the scan location on the specimen. Typical specimens include produce such as apples, mangos, or grapes, and a variety of parameters can be measured such as brix or dry matter. The Training Set and Reference Values gathered are loaded into the supplied Model Builder software which identifies correlations between the Reference Values and 2nd derivative absorbance spectra from the Training Set. This is accomplished using non-linear iterative partial least squares (NIPALS) regression. The result is a prediction model which can be loaded onto the F-750 device and used to measure the parameters used to build the model. With a model loaded on the F-750 device, the user places a specimen on top of the scanner and presses the scan button to record a new measurement. 6 1554 NE 3rd Ave, Camas, WA 98607, USA Phone: (360) 833-8835 [email protected] www.felixinstruments.com F-750 Instruction Manual 7/30/2015 Figure 1: Interactance optical design; light rays illuminate an anulus on the sample. The light then interacts with the sample by internally scattering through the tissue. Light that undergoes remission normal to the collimating lens is collected and focused onto the fiber. While recording a new measurement, the device… a. Normalizes the spectrometer output using a reference shutter. b. Records darks scans to account for dark current and ambient light. c. Calculates diffuse reflectance by subtracting the light reflected from the reference shutter from the light reemitted by the subject. d. Calculates reciprocal absorbance: Log(1/Reflectance). e. Calculates first and second derivative spectra by applying Savitzky-Golay coefficients. The second derivative spectra is then processed by the prediction model, each wavelength is multiplied by the regression coefficient, and all of the wavelengths are added up. A final intercept coefficient is added, resulting in the predicted value which the F-750 displays on screen, 1554 NE 3rd Ave, Camas, WA 98607, USA Phone: (360) 833-8835 [email protected] www.felixinstruments.com 7 F-750 Instruction Manual 7/30/2015 and saves to the instrument’s SD card along with other information such as GPS location, battery status, and temperature. 8 1554 NE 3rd Ave, Camas, WA 98607, USA Phone: (360) 833-8835 [email protected] www.felixinstruments.com F-750 Instruction Manual 7/30/2015 Operating Instructions Unpacking the F-750 The F-750 will arrive in a carrying case with removable, rechargeable batteries, two battery chargers (one for the wall and a car charger), a white Teflon calibration disc, and a clip to attach the F-750 to a belt. In addition, an SD card is included along with a hand strap. There is a tripod mount located on the bottom of the F-750 Produce Quality Meter case. Also included is a USB cable which is used to update the firmware on the device. Loading the Battery The F-750 uses 18650 Li-ion 3.7V 3100mAh rechargeable batteries. The batteries must be removed from the F-750 to be charged. To remove the batteries, twist the battery compartment cap, located on the bottom of the device under the rubber bumper. The cap can be twisted with fingers or a screwdriver to tighten or loosen. Use caution when removing batteries, as the cap is spring loaded. Both batteries should be inserted into the unit positive (+) side first (towards lens side). Warning: Do not drop batteries, this may cause them to crack and rupture. 1554 NE 3rd Ave, Camas, WA 98607, USA Phone: (360) 833-8835 [email protected] www.felixinstruments.com 9 F-750 Instruction Manual 7/30/2015 Top View: Front View: Scan Button Power Button Directional Keys 10 1554 NE 3rd Ave, Camas, WA 98607, USA Phone: (360) 833-8835 [email protected] www.felixinstruments.com F-750 Instruction Manual 7/30/2015 Basic Operation The rubber bumpers on the top and bottom should always be installed when using the instrument as they prevent the device from water damage. If the lens becomes dirty, it can be cleaned with a soft cloth. The lens is made of extremely durable Gorilla Glass and should not become scratched with normal use. The strap should be tightened so that the device has a snug and secure fit around the hand. To take a measurement, power on the F-750 Produce Quality Meter. The current model will be displayed. To change the model refer to the Select Model section of the manual. Place the sample on the lens so that it makes contact with the perimeter of the bracket around the lens. Press the scan button to record a new measurement. During the measurement, the instrument will switch to the scan display, then collect and process the data. As the measurement is being collected, large blocks will appear at the bottom of the display screen. Keep the sample in place as the blocks progress until the measurement is complete. The measurement is being collected as the 1st block is displayed. The 2nd block is for processing data, and the 3rd block is for saving the measurement. A final screen will indicate that the data has been saved to the SD card before displaying the record to be reviewed. The data is stored to a removable SD card. To remove, press SD card into the unit and it will eject. To replace, insert metal side first with the label facing the back of the unit. 1554 NE 3rd Ave, Camas, WA 98607, USA 11 Phone: (360) 833-8835 [email protected] www.felixinstruments.com F-750 Instruction Manual 7/30/2015 If the instrument locks up or requires a hard shut-off for any other reason, hold down the power button for 10 seconds. This will force the F-750 power to turn off. Then, the instrument can be restarted. When the F-750 device is powered on, it will make a single beeping sound if it is working smoothly. If not, the device will issue more than one beep. The number of beeps can be used to diagnose several errors that the instrument is able to detect during start-up. The following table outlines the number of beeps and the associated errors. Please contact [email protected] if you are unable to bypass an error. Number of Beeps 2 3 5 6 7 8 9 10 13 15 16 20 30 12 Error Device in bootloader assist mode Battery low Settings corrupt Model missing Spectrometer error Lamp error Shutter error Keystroke error Graphics error SD card error Unhandled error Unknown board layout/version RAM (memory) error 1554 NE 3rd Ave, Camas, WA 98607, USA Phone: (360) 833-8835 [email protected] www.felixinstruments.com F-750 Instruction Manual 7/30/2015 Navigating Menus Use the power button to turn on the F-750. After the instrument powers on, the display will show the current model loaded on the unit and the battery life at the top of the display. Instructions in the middle of the display indicate to press the scan button to record a new measurement or press the right arrow to access the main menu. Once at the Main Menu, the left arrow can be used to go back or exit to the previous screen. The Main Menu consists of three options: Select Model, Browse Records, or Setup Instrument. Menu Navigation Controls Key Right Arrow Left Arrow Up or Down Arrow Hold Directional Arrow Power Button Scan Button Function Enter/engage Exit/go back/erase Scroll to select option Fast scroll to select number/letter and to scroll through measurements Power on/off Record a Measurement 1554 NE 3rd Ave, Camas, WA 98607, USA Phone: (360) 833-8835 [email protected] www.felixinstruments.com 13 F-750 Instruction Manual 7/30/2015 Menu Map 14 1554 NE 3rd Ave, Camas, WA 98607, USA Phone: (360) 833-8835 [email protected] www.felixinstruments.com F-750 Instruction Manual 7/30/2015 Select Model The device will come pre-loaded with demo models. Use the up/down arrows to highlight the desired selection. To make modifications to the model, press the right arrow when the model is highlighted to get to the model submenu. Load Model: When the right arrow is pressed while this is highlighted, the current model will be loaded, and the screen will return to the beginning display. -Collect Measurement: If the sub-menu of a model that is already loaded is entered, the first option will be Collect Measurement, rather than Load Model. Pressing on the right key with this highlighted will collect a measurement, similarly if the Scan button is pressed. Measurements Per Specimen: This option allows the user to set how many consecutive scans the device takes automatically after the scan button is pressed. Delay Between Measurements: If the measurements per specimen is more than one, the Delay Between Measurements option allows the user to set a pause of however many seconds desired in between the consecutive scans. The pause allows time for the device to cool off in between scans or may be used by the user to interrupt the consecutive scans by pressing any of the arrows and then pressing the left arrow to return to the Main Menu. 1554 NE 3rd Ave, Camas, WA 98607, USA Phone: (360) 833-8835 [email protected] www.felixinstruments.com 15 F-750 Instruction Manual 7/30/2015 Scans to Average: This option allows the user to select the number of scans (measurements) that are averaged together before a value is shown on the display. Advanced Options: Several options can be accessed using the model sub-menu, such as the Integration Time, Intercept Coefficients, Lamp Off Shutter Open, and Lamp Off Shutter Closed. The Auto Integration Time option allows the user to switch between auto integration time and manual integration time. When it is disabled, the integration time values can be set manually. Only when the Auto Integration Time is disabled are the options to adjust the integration time turning the lamp on and off will appear. Using the Intercept Coefficient 1 and Intercept Coefficient 2 options, a new value to use for the intercept coefficient can be entered. The intercept coefficient is from the regression vector. Press the left arrow to get back to the model sub-menu. If the left arrow is erasing characters on the display, keep pressing the left arrow to erase all the characters and then it will exit to the previous menu. Browse Measurements Once a measurement is taken, it will be saved onto the SD card and may be accessed by pressing the right arrow with Browse Measurements highlighted. Use the up/down arrows to highlight the desired measurement. Once it is highlighted, press the right arrow to access the measurement data. Each measurement has different parameters saved in it, depending on the model used 16 1554 NE 3rd Ave, Camas, WA 98607, USA Phone: (360) 833-8835 [email protected] www.felixinstruments.com F-750 Instruction Manual 7/30/2015 when taking the measurement. For example, a mango model may include values for dry matter, color, and chlorophyll. Press the right arrow while on the measurement data screen to enter the file menu. Change Lot #: This option allows the lot number of the measurement to be changed. Change Sample #: This option allows the sample number of the measurement to be changed. Delete Measurement: This option is used to remove a record permanently. Rename Measurement: This option is used to change the filename of the measurement. Measurement Details: This menu provides information like the model used to collect the measurement, timestamp, file size, collection details, and location of the scan. Setup Instrument The Setup Instrument menu houses the features and settings that are adjustable by the user. Lot & Sample #: The lot and sample numbers are used to help organize data so that the groups from which samples are taken from may be recorded. For example, if multiple boxes of apples had to be scanned, the lot number would be assigned to each box and the sample number would be assigned to each apple in a box. The lot and sample 1554 NE 3rd Ave, Camas, WA 98607, USA Phone: (360) 833-8835 [email protected] www.felixinstruments.com 17 F-750 Instruction Manual 7/30/2015 numbers are included in the filename of a measurement and increment with each scan. -Current Sample #: This option is used to change the sample number for the next scan. -Current Lot #: This option is used to change the sample lot number for the next scan. -Increment/Decrement Logic: This option is used to enable or disable the decrement if measurement deleted option, which if enabled will automatically decrease the sample number by 1 if the latest measurement is deleted. It also includes the Increment Lot # Every x Samples option which is used to set the number of scans before the lot number is increased by 1 and the sample number is reset to 1. The lot and sample number system may be enabled with the Append As Measurement suffix option, or disabled, upon which the first scan taken will be assigned the number 1 and increment for each scan after. Measurement Prefix: A prefix is the label placed on each measurement along with the lot and sample number that may help with organizing data. Within the Measurement Prefix option, a new prefix can be entered or a recently used prefix can be selected. The New Prefix option allows the user to choose a new prefix. The prefix has a maximum of 16 characters. The Select A Recently Used Prefix option will generate a list of recently used prefixes. Use the up/down arrows to highlight the desired prefix to be used, and the right arrow to select the desired prefix. 18 1554 NE 3rd Ave, Camas, WA 98607, USA Phone: (360) 833-8835 [email protected] www.felixinstruments.com F-750 Instruction Manual 7/30/2015 Archive Measurements: The Archive Measurements menu will store all data currently in the populating the list of measurements into an archive folder on the SD card. The data in the archive folder may now only be accessed through DataViewer. The Create Folder option will make a new archive folder with the timestamp as a default name. The name may be changed and upon confirming the name by pressing the right arrow at the end of the name, all data in the browse measurement menu will be transferred to the folder. The Select Folder option allows all data in the browse measurement menu to be transferred into a previously created archive folder by moving the cursor with the up and down arrow and pressing the right arrow when the cursor is highlighting the desired archive folder. Date & Time: The Date & Time option allows the timestamp on the F-750 to be adjusted. Training Sets: Creating a training set is the first step in creating a model. This menu is used when collecting spectra to use in the training set. -Create New Training Set: First, enter the name to use for this new training set. Next, enter the number of specimens that will be used to build this model. The minimum number of specimens required is 10 and the maximum number allowed is 5,000. Once a new training set is created the options are Browse Specimen Data and Delete Training Set. If the Browse Specimen Data option is chosen the user is prompted to choose from a temperature range (minimum, mid, and maximum). At each temperature, there is a numbered list 1554 NE 3rd Ave, Camas, WA 98607, USA 19 Phone: (360) 833-8835 [email protected] www.felixinstruments.com F-750 Instruction Manual 7/30/2015 of the specimens. Highlight a specimen by using the up/down arrows. When Specimen 1 is highlighted, press the right arrow to collect data for the training set. The instrument will indicate “Processing” and then “Creating Training Set”. Once it has completed, do not press the scan button to gather training set spectra. The scan button only initiates a measurement. The space next to Specimen #1 will change from (empty) to (timestamp). Repeat with each of the 20 specimens at each of the 3 temperatures. Specimens can be re-done if a mistake is made or the wrong specimen/temperature is selected. -Modify Existing Training Set: This menu produces a list of training sets on instrument. Press the right arrow on a desired training set edit, or delete a training set. GPS Receiver: The GPS receiver menu shows the state of the GPS sensor as enabled or disabled. If the GPS sensor is enabled, View Status will appear with the following parameters: latitude, longitude, satellites in view, whether there is a satellite lock or not, and Horizontal Dilution of Precision (HDoP). When taking a GPS reading, be sure to keep the unit upright and the top of the instrument free from obstruction. Keypad Sounds: This option allows the noises the instrument makes when the arrow are pressed to be changed. There are four options: Disabled, in which the device will make no sound when a key is pressed, and then Quiet, Default, and Loud. Diagnostics: This menu is intended for debugging and support. Within the Diagnostics>Manual Test menu, the 20 1554 NE 3rd Ave, Camas, WA 98607, USA Phone: (360) 833-8835 [email protected] www.felixinstruments.com F-750 Instruction Manual 7/30/2015 following options are available: Scans to Average, Integration Time, Lamp State, Shutter State, Number of Repetitions, Delay Between Repetitions, Measure Spectrometer Noise, and Collect Spectra. -Scans to Average: This option allows the user to select the number of scans (measurements) that are averaged together before a value is shown on the display. The integration time for the calibration-collect spectra can also be set. -Lamp state: This option is used to turn the lamp on or lamp off. Press the down or up arrows to turn the lamp off or on. The shutter state works similar to the lamp state. The options are shutter closed or shutter open (press down/up to open/close shutter). -Collect spectra: This option will use whatever values are set in the diagnostics menu to collect spectra. After rendering, the results will be saved to the SD card in .raw format. This data can be analyzed by inserting the SD card into a computer and extracting the data. Advanced Setup: If the advanced setup menu is selected, a warning will appear that calibration should only be performed by authorized users. Press right to continue. Press left to abort. Instruments should only be calibrated under direction of a Felix Instruments technician. The options in this menu allow the instrument to be specifically calibrated for optimum performance. Many of these values are instrument specific such as pixel coefficients and reference voltage. The pixel coefficients are the spectrometer calibration values given by manufacturer 1554 NE 3rd Ave, Camas, WA 98607, USA 21 Phone: (360) 833-8835 [email protected] www.felixinstruments.com F-750 Instruction Manual 7/30/2015 (C0, C1, C2, C3). The pixel coefficients influence what wavelengths of light the spectrometer is responding too. -Spectrometer Zero and Span: This option is used in conjunction with the white Teflon calibration standard. After the instrument has been placed in a cold environment for at least 30 minutes, place the white Teflon calibration standard over the lens and press the right arrow to take a scan. The display will flash “Saving…” and exit to the menu when the zero offset is complete. In addition to spectrometer settings, lamp, shutter, temperature, and auto integration time settings can also be fine-tuned under their corresponding menus. Factory reset: This option will erase the temporary cache files for the display screens and return to the default parameters from the manufacturer. 22 1554 NE 3rd Ave, Camas, WA 98607, USA Phone: (360) 833-8835 [email protected] www.felixinstruments.com F-750 Instruction Manual 7/30/2015 Warnings Do not drop! Dropping the instrument while it is turned on could cause the lamp bulb to break. Instrument will become warm with use, due to the lamp turning on. Do not drop F-750 batteries on hard surface, such as cement floor. Do not leave the lamp on for more than 30 seconds. If the lamp remains on, power off the instrument or remove the batteries. Dropping the batteries on a hard surface may cause them to crack the seal and rupture. The electrolyte in the battery will slowly leak out; the electrolyte is toxic and may cause burns. 1554 NE 3rd Ave, Camas, WA 98607, USA Phone: (360) 833-8835 [email protected] www.felixinstruments.com 23 F-750 Instruction Manual 7/30/2015 F-750 Data Data collected by the F-750 can be reviewed on the instrument by using the Browse Measurements option. The data is stored on the removable SD card. To remove, press the SD card into the unit and it will eject. To replace, insert metal side first with the label facing the back of the unit. It is best to eject and insert the SD card when the instrument is off to prevent file system errors on the SD card. In order to view the files on a computer, the F-750 Data Viewer software should be installed. This software can be found on the Felix Instruments webpage located at: http://felixinstruments.com/support/f-750support/software Individual or multiple training sets of measurement scans can be opened in the DataViewer by going to File>Open. 24 1554 NE 3rd Ave, Camas, WA 98607, USA Phone: (360) 833-8835 [email protected] www.felixinstruments.com F-750 Instruction Manual 7/30/2015 Once a file or files have been opened in DataViewer, data can be exported to be viewed. The File>Export menu gives four different options to export: Measurements, Measurements & Details, Raw Spectra, and Interpolated Spectra. To export the predicted values, select Measurements and choose to open the newly created .csv file. During the export, the software will prompt for a save location and again after the export is successful to open the newly created file. The Raw Spectra and Interpolated Spectra export features are mainly for use by technicians. The interpolated spectra menu will allow the spectra to be accessed. The Archive feature will extract all possible data from the selected files and save as CSV. 1554 NE 3rd Ave, Camas, WA 98607, USA Phone: (360) 833-8835 [email protected] www.felixinstruments.com 25 F-750 Instruction Manual 7/30/2015 After exporting, the .csv file can be opened as a spreadsheet. This .csv can be used in other software programs. Data such as model results, which contains GPS coordinates, dry matter, TSS, battery life, and raw readings can be viewed in the .csv file. Other relevant data includes the interpolated 2nd derivative absorbance data, which contains what the model is plotting and the value at each wavelength. 26 1554 NE 3rd Ave, Camas, WA 98607, USA Phone: (360) 833-8835 [email protected] www.felixinstruments.com F-750 Instruction Manual 7/30/2015 Instructions for Creating a Model Step 1: Creating a Training Set Step 2: Collecting Reference Values Step 3: Importing a Training Set and Reference Values into Model Builder Step 4: Creating a Model Step 5: Saving a Model to F-750 Step 6: Validating the Model Additional Instructions: Merging Training Sets in Model Builder Alternate Method for Training Set Creation: Manual Data Collection and Entry Building a Model to Measure Two Traits Using the Small Fruit Adaptor Step 1: Creating a Training Set For training set creation, use pieces of fruit across the full range of fruit maturity. In general, the more specimens used to make the model, the more accurate it will be at predicting values. Do not include any fruit that has suffered from heat stress, sun burn, is misshapen or otherwise physically damaged. Influence of Temperature on Spectra: The purpose of using multiple temperatures in training set creation is to compensate for the changing molecular response to light in relation to temperature. By scanning the same fruit at 2-3 temperatures, the program is able to ignore any spectral shifts or changes that do not relate to changes in the desired trait such as fructose or starch. By 1554 NE 3rd Ave, Camas, WA 98607, USA 27 Phone: (360) 833-8835 [email protected] www.felixinstruments.com F-750 Instruction Manual 7/30/2015 including variation of temperature for the same fruit in the model, the math can autocorrect for temperature. For some applications the need for temperature correction is small, such as in controlled storage where temperature is constant, but if the F-750 will be used on fruit which does not always remain a constant temperature, a training set will need to be created to accommodate for this potential temperature range. If, at any point during the training set creation process, you navigate away from the training set you are working on or turn the instrument off, you can navigate back to the training set by going to Setup menu > Training Sets > Modify Existing Training Set, then selecting the training set you wish to continue working on. The following instructions are for creating a model at three temperatures: 1. Select pieces of fruit with a wide range of maturity to be used in training set creation. 28 1554 NE 3rd Ave, Camas, WA 98607, USA Phone: (360) 833-8835 [email protected] www.felixinstruments.com F-750 Instruction Manual 7/30/2015 2. Label each piece of fruit with a specimen number. 3. Mark the area to be scanned on each fruit. Two sides of the same fruit are often scanned depending on the variability of the fruit (sun side and shade side). If this is the case, label both sides with separate specimen numbers. 1554 NE 3rd Ave, Camas, WA 98607, USA Phone: (360) 833-8835 [email protected] www.felixinstruments.com 29 F-750 Instruction Manual 7/30/2015 4. Determine the three temperatures to be used for the training set (Minimum, Mid, and Maximum). It is best to choose a range of temperatures encompassing the range which the measurements will be taken, for example, 10ºC, 20ºC and 30ºC. 5. Place the fruit in a temperature controlled area to bring the fruit to the first temperature; Minimum. 6. After the fruit has been given enough time to come to the pre-determined temperature (generally about one hour), it is now time to begin taking measurements for the training set. 7. Turn on the F-750 and navigate to the Setup Menu > Training Sets > Create New Training Set. 8. Enter a name to use for the new training set. Press the right arrow to enter. 9. Enter the number of specimens that will be used to build this model (minimum of 10 specimens, recommended ~200 specimens). Press the right arrow again to create the training set file. Be aware this step can take a few minutes, and very large training sets (5,000 specimen) can take up to an hour to process. 10. After the training set has been created, press right to enter the Browse Specimen Data menu. Navigate to the first temperature: Minimum. Now we will begin scanning each 30 1554 NE 3rd Ave, Camas, WA 98607, USA Phone: (360) 833-8835 [email protected] www.felixinstruments.com F-750 Instruction Manual 7/30/2015 pre-labeled specimen. Be careful not to remove too many specimens at a time from the temperature controlled environment, as you want the set temperature to remain constant across specimens. 11. Place the first specimen on the lens, and with Specimen 1 highlighted on the list, press the right arrow to collect the training spectra. The instrument will indicate “Processing”. Do not press the square/scan button to gather training set spectra. 1554 NE 3rd Ave, Camas, WA 98607, USA Phone: (360) 833-8835 [email protected] www.felixinstruments.com 31 F-750 Instruction Manual 7/30/2015 12. After each specimen has been scanned, you will see a date and time included in the specimen file name. This is how you know the data has been recorded. Specimens can be rerecorded if a mistake is made or the wrong specimen/temperature is selected. 13. Repeat for all specimens at minimum temperature. 14. After all specimens have been recorded at minimum temperature, place the specimens back in the temperature controlled area to bring the fruit to the next selected temperature; Mid Temperature. 15. After the specimens have reached the desired mid temperature, the next set of temperature data is ready to be collected. Always scan the same area of the fruit. 16. If you had turned the F-750 off while waiting for the specimen to reach their next temperature, navigate to the Setup menu > Training Sets > Modify Existing Training Set, and select the training set you created previously. 17. Within the training set file go to Browse Specimen Data and navigate to the Mid Temperature folder. Place the first specimen on the lens, and with Specimen 1 highlighted on the list, Press the right arrow to collect the training spectra. 32 1554 NE 3rd Ave, Camas, WA 98607, USA Phone: (360) 833-8835 [email protected] www.felixinstruments.com F-750 Instruction Manual 7/30/2015 18. Repeat for all specimens at mid temperature. (Note: You will be using the same specimens for all three temperature sets so the specimen must be scanned in the same order each time.) 19. After all specimens have been recorded at mid temperature, place the specimens back in the temperature controlled area to bring the fruit to the last selected temperature; Maximum. 20. See step 16 if you have turned the F-750 off while waiting for the 21. Wait for the specimen to reach their next temperature, then continue to next step. 22. Within the training set file go to Browse Specimen Data and navigate to the Maximum Temperature folder. Place the first specimen on the lens, and with Specimen 1 highlighted on the list, Press right arrow to collect the training spectra. 23. Repeat for all specimens at maximum temperature. 24. You are now finished creating your training set. The same specimen used for training set creation will now be used to collect reference values in Step 2 “Collecting Reference Values.” 25. It is recommended to import data into Model Builder software to verify scans are saved before destructive sampling of fruit. 1554 NE 3rd Ave, Camas, WA 98607, USA Phone: (360) 833-8835 [email protected] www.felixinstruments.com 33 F-750 Instruction Manual 7/30/2015 Step 2: Collecting Reference Values To collect Reference Values, the same fruit specimens used in training set creation will be measured. The Reference Values are those values determined by your reference method (i.e. a destructive measurement of TSS or DM). For example, if you intend to measure brix, Reference Values could be measured with a refractometer, or total acids could be measured through acid titration. Careful data management is paramount for this step, and extra care should be taken to keep specimens well organized and numbered. For the purposes of this example, we will describe the method for measuring dry matter. 1. First, slice off the fruit cheek section which was marked and scanned with the F-750. 2. Remove the fruit skin from the sample with a sharp knife or peeler. 3. Cut the sample into a small piece, skinless piece. An average piece would be about the size of a 2x2x2 cm cube or smaller, depending on the size of the sample. 4. Weigh the sample as soon as possible and record the weight to the nearest 0.001 grams. 5. Dry the samples in a dehydrator for 48 hours set at 63-65ºC. 6. After 48 hours, re-weigh the samples and record the values. Dehydrator times and temperatures may vary for different types of fruit. 7. Using these weights, dry matter (%) can be calculated for each specimen by dividing the dried 34 1554 NE 3rd Ave, Camas, WA 98607, USA Phone: (360) 833-8835 [email protected] www.felixinstruments.com F-750 Instruction Manual 7/30/2015 mass by the original mass. These dry matter values will be our Reference Values corresponding to the measurements taken in the creation of our training set. Step 3: Importing a Training Set and Reference Values into Model Builder After both training set data and Reference Values have been collected, we now have the necessary data to build a model. It is important to save your Model Builder file so that you can return to it at a later time and add additional data if desired. 1. Open the Model Builder software program. If you have not already downloaded this program onto your computer, please download at: www.felixinstruments.com/F750/ModelBuilder 2. Remove the SD card from the F-750 and insert it into your computer. 1554 NE 3rd Ave, Camas, WA 98607, USA Phone: (360) 833-8835 [email protected] www.felixinstruments.com 35 F-750 Instruction Manual 7/30/2015 3. First, we will import our training set. In Model Builder, navigate to the Import button on the right side of the software window. 4. You will be prompted for the location of the training set file. To select the desired training set, navigate to the SD card folder on your computer, click on training sets, and select the training set you created. Click Open. 5. You will be prompted with the message “Would you like to overwrite the existing training set?” Select Yes If interested in adding to an existing Model Builder project, please go to the Adding Data to an Existing Training Set instructions found on page 53. 6. When you created your training set, if any specimen files were left empty, they will automatically be excluded. 7. Model Builder will automatically populate the training set and the spectra should now be 36 1554 NE 3rd Ave, Camas, WA 98607, USA Phone: (360) 833-8835 [email protected] www.felixinstruments.com F-750 Instruction Manual 7/30/2015 displayed on screen. Specimen number, Spectra Name (Min, Mid, Max temp), and the pixel values can be found under the Training Set tab at the bottom of the screen. 8. Use the mouse wheel to zoom in/out on the graph. Click and hold the graph to pan. 9. To select a single specimen in the spectra, select the row in the training set list below, or hold the control key (Ctrl) and click to choose the line in the graph above. To select all specimen rows, click the empty cell to the left of the Exclude column header. This will select all specimens imported in the training set. To exclude a specimen, click the Exclude box to the far left of each specimen row. Multiple rows can be selected by holding down the shift key for a contiguous set or the ctrl key for individual rows. 1554 NE 3rd Ave, Camas, WA 98607, USA Phone: (360) 833-8835 [email protected] www.felixinstruments.com 37 F-750 Instruction Manual 7/30/2015 10. Next, we will import our Reference Values. If they are in CSV format, click the Import button. If they are not in CSV format, they can be manually entered or copied and pasted from Excel or similar spreadsheet programs as a column with no header. Specimen numbers are auto-populated starting at 1. 11. Be sure that all specimens included in the training set also have corresponding and matching Reference Values. To change the column headers, 38 1554 NE 3rd Ave, Camas, WA 98607, USA Phone: (360) 833-8835 [email protected] www.felixinstruments.com F-750 Instruction Manual 7/30/2015 double-click to rename them (e.g. Dry Matter or TSS). Model Viewer can detect if there are missing or multiple specimens. Step 4: Creating a Model Now that we have both our training set data and our Reference Values imported into Model Builder, we are ready to build or create the model. Model Builder illustrates spectra quality (noise). It is recommended that the user manually selects regions to include by choosing a spectra range, such as 729-975 nm. 1. Model Spectra Window Selection a. Generally, it is best to manually select a spectra range based on the known range of a particular fruit or constituent being measured. For example, choosing a range of 729-975 nm for sugar or starch. For additional ranges, see the “Supporting Science” section at the end of this manual. To manually select a region, enter the desired range under the Model Spectra tab located at the bottom of the window. 1554 NE 3rd Ave, Camas, WA 98607, USA Phone: (360) 833-8835 [email protected] www.felixinstruments.com 39 F-750 Instruction Manual 7/30/2015 b. Seeing a neatly layered rainbow effect with the colors (green-orange-red) in the selected range is optimal and indicates agreement of spectra and known results. 2. When all data are entered and modifications made, build the model by clicking the Build button in the toolbar near the top of the window. The application will indicate that the model has been successfully built and a new tab will appear at the bottom of the screen: Model Performance Analysis. Alternate method: The Model Builder software has a feature to suggest the useful region of spectra. This feature is based on univariate correlation per pixel. It is important to note that selecting only pixels with a high univariate correlation does not always translate into good multivariate regression and therefore a robust model. It is important to have enough points to define a curve and peaks are 20-50 nm wide. 40 1554 NE 3rd Ave, Camas, WA 98607, USA Phone: (360) 833-8835 [email protected] www.felixinstruments.com F-750 Instruction Manual 7/30/2015 1. To begin the model building process navigate to the Find Correlation button on the right side of the screen. 2. Model Builder will now highlight useful spectra regions. The red areas represent a detected correlation and the blue areas are the wavelengths currently included. a. Wavelengths to exclude can be entered into the box on the right side of the screen. This pane also allows you to select spectra range by associated Minimum R2 value. The R2 value represents the strength of the correlation. High R2 values typically indicate a strong correlation. Use caution, setting an R2 value too high could also eliminate potentially useful data. 1554 NE 3rd Ave, Camas, WA 98607, USA Phone: (360) 833-8835 [email protected] www.felixinstruments.com 41 F-750 Instruction Manual 7/30/2015 3. When all data are entered and modifications made, build the model by clicking the Build button in the toolbar near the top of the window. The application will indicate that the model has been successfully built and a new tab will appear at the bottom of your screen: Model Performance Analysis. Model Performance Analysis The Model Performance tab allows for the interpretation and optimization of the underlying mathematical regression used by the F-750. The various graphs in the drop down menu allow for analysis of different aspects of the multivariate data, including principle components (explained variance), root mean square error (RMSE), model linearity, prediction error, regression coefficients, error/deviation ratio, and scores plot. Analysis of regression coefficients and prediction error will indicate the fit of the model. The two major concerns when inspecting a model’s results for how the regression fits are: number of principle components and outliers. The optimum number of principle components to include will be selected by the program, but alternate numbers of principle components can also be selected to optimize data fitting. By selecting too few principle components there will not be enough representation, too many components and the correlation could be a coincidence because noise is included. 42 1554 NE 3rd Ave, Camas, WA 98607, USA Phone: (360) 833-8835 [email protected] www.felixinstruments.com F-750 Instruction Manual 7/30/2015 The prediction error graph is often the most useful; the closer the Reference Value is to the prediction, the lower the prediction error and the more accurate the model. Using the Model Performance Analysis Tab: The following outlines each screen or graph seen on the model performance analysis tab as an interactive walkthrough using the Grape Demo model that is included with the F-750 device. After the model is successfully built, the Model Builder software will show the Model Performance Analysis tab. Click on the tab and the first screen shown is the explained variance. The explained variance graph is useful for understanding how well the variation in the known value is spanned by the regression model. As the explained variance increases, the model is better incorporating the entire data set. The information is displayed in a line graph to show the contribution from each principle component (PC). Overfitting can occur if principle components are included in the model that do not incorporate more of the dataset. 1554 NE 3rd Ave, Camas, WA 98607, USA Phone: (360) 833-8835 [email protected] www.felixinstruments.com 43 F-750 Instruction Manual 7/30/2015 Navigate to the next graph in the drop down list, root mean square error (RMSE). The blue line indicates the root mean square error calibration (RMSEC), which represents the average error of the complete regression. The red line indicates the root mean square error of cross validation (RMSECV). This is the average error of a simulated independent data, either with full or leave-oneout cross validation. RMSECV is the average error and is considered to be the error within the first standard deviation or 68% of all readings. The Model Builder software determines the optimum number of principle components by looking for a minimum decrease of at least 5%. In the example below, 8 principle components have an RMSECV of 0.61, a 5% decrease in error would be 0.58. Because 9 principle components have an error of 0.59, Model Builder has determined that 9 and above principle components are an over fit. 44 1554 NE 3rd Ave, Camas, WA 98607, USA Phone: (360) 833-8835 [email protected] www.felixinstruments.com F-750 Instruction Manual 7/30/2015 The following graph in the model performance analysis tab is model linearity. Model linearity represents the goodness of fit of the regression. A model with an R2 less than 0.7 will likely not meet performance expectations. The Prediction Error graph displays the reference value vs. the predicted value for both the complete regression and the cross validation. This graph is useful for determining outliers or specimen that do not fit well within the regression. It is helpful to go back to the reference field and change the reference value for a scan to see how that influences RMSECV and the prediction error graph. 1554 NE 3rd Ave, Camas, WA 98607, USA Phone: (360) 833-8835 [email protected] www.felixinstruments.com 45 F-750 Instruction Manual 7/30/2015 After the prediction error is the Regression Coefficients graph. The regression coefficient values are applied in a dot product with spectra to determine the predicted value. Navigate to the Scores Plot graph, which is used to identify clusters or groupings in data. In the example below, the red table grapes form a small cluster below the green grapes. The figure below has a red and green circle indicating the red and green grape clusters. Additionally, spectra such as the single scan in the lower right quadrant may be considered a potential outlier as it is far from other points. 46 1554 NE 3rd Ave, Camas, WA 98607, USA Phone: (360) 833-8835 [email protected] www.felixinstruments.com F-750 Instruction Manual 7/30/2015 The Wavelength Influence graph shows how much each individual regression coefficient is contributing to the predicted value, essentially indicating the important pixels for prediction. Optimizing the Grape Demo Model: Now we will go back and optimize the grape demo model. To begin, navigate back to the Scores Plot and hover over the Potential Outlier scan in the lower right quadrant. We can see that this is specimen number 239 with the spectra name of r39. This stands for the 39th red grape scanned in the training set. 1554 NE 3rd Ave, Camas, WA 98607, USA Phone: (360) 833-8835 [email protected] www.felixinstruments.com 47 F-750 Instruction Manual 7/30/2015 To investigate if this specimen is an outlier, we need to go back to the training set tab and locate specimen 239. Next, check the Exclude box next to #239. Now that Specimen 239 is excluded, we can re-compute the model by pressing the Build icon. Then, explore the impact of removing specimen 239 from the training set. Because the RMSE and Model Linearity graphs show no change, it can be concluded that specimen 239 is not an outlier and should be included in the training set. Go back to the training set, include #239 and build the model again. Next, look at the Prediction Error graph. Here, you can see that specimen 260 is poorly predicted by the model. Repeating the steps above, Exclude specimen 260 and explore any changes to model performance in the RMSE and model linearity graphs. 48 1554 NE 3rd Ave, Camas, WA 98607, USA Phone: (360) 833-8835 [email protected] www.felixinstruments.com F-750 Instruction Manual 7/30/2015 After excluding specimen 260 and re-building the model, a decreased RMSE and slightly increased R2 value is seen. This indicates that specimen 260 is likely an outlier or at the very least a poor fit for the model. It is important to note that outlier removal must be done delicately and for sufficient reasons. It is inappropriate to simply remove specimen until you have a “perfect model.” Outliers can result from internal defects, human error in reference method, or insufficient sampling of real variance in fruit population. 1554 NE 3rd Ave, Camas, WA 98607, USA Phone: (360) 833-8835 [email protected] www.felixinstruments.com 49 F-750 Instruction Manual 7/30/2015 Additional Information from Scores Plot: The following shows the effect of temperature on the O-H peak (spectra) of a cherry. The upper curve in pink is room temperature and the lower blue curve is cold storage (min temp). Temperature alters the photoactive response of certain common chemicals, like fructose or starch and this can be seen in the gathered spectra. 50 1554 NE 3rd Ave, Camas, WA 98607, USA Phone: (360) 833-8835 [email protected] www.felixinstruments.com F-750 Instruction Manual 7/30/2015 Step 5: Saving a Model to F-750 1. To save the model, go to File > Save. Select a location to save the file on your computer. Now that the model is saved, you can return to it at a later time to add additional values or edit the model. 2. To save the model to an F-750 SD card, go to File > Save. Locate the SD card and save your new model in the Models folder. 3. Insert the SD card back into the F-750. Your new model is now ready to use! Step 6: Validating the Model After a new model has been created and loaded onto the F-750, it is important to validate that the model is working correctly. To do this, there are a number of different methods available. One of the simplest methods for on device validation is as follows: 1. Start the F-750 instrument. 2. Go to Models > select the model just saved to the device. 3. Press the right arrow and then select Set As Current Model. 4. Place a specimen on top of the F-750 and press the scan button. 5. Scan several specimens and measure to gauge the variance of the model. 6. You can then use your selected reference method (used to calculate Reference Values) to verify that these values are accurate. 1554 NE 3rd Ave, Camas, WA 98607, USA Phone: (360) 833-8835 [email protected] www.felixinstruments.com 51 F-750 Instruction Manual 7/30/2015 On Device Validation: 7 Days Turnaround This procedure allows for creating and validating a model for dry matter, titratable acid, or other reference values with a lengthy process. This procedure is specific for dry matter. Day 1: Training Set scans, prepare and weigh samples, load dehydrator Day 2: Dry (wait time) Day 3: Finish drying, final weigh and calculate dry matter. Build and optimize model in Model Builder software. Day 4: Load model onto F-750 device, take scans of validation fruit. Prepare and weigh samples, load dehydrator Day 5-6: Dry (wait time) Day 7: Finish drying, final weigh and calculate dry matter. Check predicted value vs. known value on device. The procedure for Brix is shorter, with day 1 consisting of the training set, reference values and creating the model. Day 2 consists of on device prediction and reference values. Notes: 52 The model’s margin of error is based on the training set, quality of reference method, and if 1554 NE 3rd Ave, Camas, WA 98607, USA Phone: (360) 833-8835 [email protected] www.felixinstruments.com F-750 Instruction Manual 7/30/2015 the region selected in the training set has a correlation. Specimens above or below the range of Reference Values used to create the model will not predict accurately. This is why it is so important to select a wide range of fruit at various stages of maturity when you are creating the initial training set. Model performance reflects how well the training set represents prediction subjects. Additional Instructions: Merging Training Sets in Model Builder Data can be added to an existing Model Builder file at any time to increase the accuracy of the model or increase the range of values. Once you have a pre-existing model, to add to the model you must collect more data with a new training set and Reference Values. To do this, follow the same steps outlined above in the Creating a Training Set (Step 1) and Collecting Reference Values (Step 2) instructions. We will assume for the following instructions that these data have already been collected. 1. Open the Model Builder file you wish to edit. You should see the previous training set and Reference Values are already loaded in the program. 2. Import the new training set you wish to include. In Model Builder, navigate to the Import button on the right side of the display. 3. You will be prompted for the location of the training set file. To select the desired training set, 1554 NE 3rd Ave, Camas, WA 98607, USA Phone: (360) 833-8835 [email protected] www.felixinstruments.com 53 F-750 Instruction Manual 7/30/2015 navigate to the SD card folder on your computer, click on training sets, and select the training set you created. Click Open. 4. You will be prompted with the message “Would you like to overwrite the existing training set?” Select No. 5. You will be prompted with another message “Would you like to increment specimen numbers automatically?” The answer here depends whether the training set is from the same population. See the following examples A and B: a. If the training set #2 is of the same fruit, click No. Example training set #1 has only the minimum temperature scans of population 1 (n=20) and training set #2 has only the middle temperature scans of population 1. Select No to align the specimen numbers: min temp fruit_1 should have the same specimen number as mid temp fruit_1 because they belong to the same population. This results in 40 total scans with two scans for each specimen number. b. If the training set #2 is of different fruit, click Yes. Example training set #1 has only the minimum temperature scans of population 1 (n=20) and training set #2 has only the middle temperature scans of population 2 (n=20). Select Yes because the specimen from population #2 should have unique specimen numbers. The 54 1554 NE 3rd Ave, Camas, WA 98607, USA Phone: (360) 833-8835 [email protected] www.felixinstruments.com F-750 Instruction Manual 7/30/2015 training set #1 will have specimen 1-20 ad training set #2 will have specimen number 21-40. 6. Any empty records will automatically be excluded. The new training set data should now appear in the rows beneath the original training set, and all spectra should be displayed. The new training set specimen number will start where the first training set specimen numbers ended. For example, if training set #1 contains specimens 1-50, when you import training set #2, the first specimen will start at 51. 7. Import the new set of Reference Values. You can also import data files (button scans) and training set (right arrow scans). If they are not in CSV format, they can be manually entered or copied and pasted from Excel. 8. Be sure that the Reference Value specimen numbers match with the training set #2 specimen numbers. As with the example from step 6, if your training set #2 specimen numbers begin at 51, Reference Value specimen numbers also need to begin at 51 for training set #2 Reference Values. Alternate Method for Training Set Creation: Manual Data Collection and Entry An alternate method for creating a training set is also available. This method involves taking measurements with the scan button (rather than using the training set feature), then importing the spectra from these 1554 NE 3rd Ave, Camas, WA 98607, USA Phone: (360) 833-8835 [email protected] www.felixinstruments.com 55 F-750 Instruction Manual 7/30/2015 measurements into Model Builder using copy and paste. This alternative method gives more flexibility in importing data, but extra care must be taken in data organization, and data entry into the Model Builder software. First we will collect the data using the manual method: 1. Follow steps from Part 1: Creating a Training Set, #1-6. 2. Turn on the F-750 and navigate to the Select Model menu. Select any model. For the purposes of this method of data collection, the model used does not make a difference in the spectra collected. 3. Change the measurement prefix name to keep the data organized. Go to Setup Instrument > Measurement Prefix > Enter New Prefix. 4. Now begin collecting data. Place the first specimen on the lens and press the scan button. 5. Repeat for all specimens at Minimum Temperature. 6. After all specimens have been recorded at the minimum temperature, place the specimens back in the temperature controlled area to bring the fruit to the next selected temperature; Mid Temperature. 7. After specimens have reached the desired Mid Temperature, the next set of temperature data is ready to be collected. 8. Change the measurement prefix to indicate you are now taking Mid Temperature data. Go to 56 1554 NE 3rd Ave, Camas, WA 98607, USA Phone: (360) 833-8835 [email protected] www.felixinstruments.com F-750 Instruction Manual 7/30/2015 9. 10. 11. 12. 13. 14. 15. Setup Instrument > Measurement Prefix > Enter New Prefix. Place the first specimen on the lens, and press the scan button to collect the measurement. Repeat for all specimens at Mid temperature. (Note: You will be using the same specimens for all three temperature sets so the specimens must be scanned in the same order each time.) After all specimens have been recorded at Mid temperature, place the specimens back in the temperature controlled area to bring the fruit to your last selected temperature; Maximum Temperature. Change the measurement prefix to indicate you are now taking Maximum Temperature data. Go to Setup Instrument > Measurement Prefix > Enter New Prefix. Place the first specimen on the lens, and press the scan button to collect the measurement. Repeat for all specimens at Maximum temperature. You are now finished creating your training set. The same specimen used for training set creation will now be used to collect reference values. Next, collect your Reference Values 1. Follow steps from part 2: Collecting Reference Values (See Step 2 above). Next, extract the F-750 specimen spectra data using Data Viewer software and import into Model Builder. 1554 NE 3rd Ave, Camas, WA 98607, USA Phone: (360) 833-8835 [email protected] www.felixinstruments.com 57 F-750 Instruction Manual 7/30/2015 1. Open the Data Viewer software program. This software can be found the on the Felix Instruments webpage located at: http://felixinstruments.com/support/f-750support/software 2. Remove the SD card from the F-750 and insert it into your computer. Locate the specimen measurements have taken for the training set. 3. Choose files to open in Data Viewer. 4. Go to the File>Export>Interpolated Spectra. Click on the menu and select 2nd Derivative. This is the spectra that we will use for our training set. 5. You will be prompted for a location to save the data. Select a location, and click save. 6. You will then be prompted with “Process complete. Would you like to open the created files?” Select yes. 7. You should now be viewing your data in an Excel worksheet. The first nine columns include the measurement prefix, time and date, model used, shutter open and closed integration time, and 58 1554 NE 3rd Ave, Camas, WA 98607, USA Phone: (360) 833-8835 [email protected] www.felixinstruments.com F-750 Instruction Manual 7/30/2015 pixel coefficients. The remaining columns include the spectra which we will use for training set creation (285-1200 nm). 8. F-750 scans taken with the scan button can be imported into Model Builder using the Import button. Alternatively, scan details can be copied and pasted into the program. To do this, exclude the headings in row one, copy all spectra information. (Be sure you are only copying spectra data, and that you are copying the entire spectra 285-1200 nm). 9. Open the Model Builder software program. Note that under the training set tab, the spectra begins at the same pixel; 285 nm. This is where we will paste our data. 10. Click to select the 285 nm cell for specimen # 1 in Model builder. Be sure that it his highlighted blue as shown in the image above. Now paste the spectra information copied from Excel. 11. You should see your data automatically populated for each specimen. 12. Enter the Specimen # and Spectra Name for each record. You can do this either by manually typing them into Model Builder, or to expedite this step 1554 NE 3rd Ave, Camas, WA 98607, USA Phone: (360) 833-8835 [email protected] www.felixinstruments.com 59 F-750 Instruction Manual 7/30/2015 for larger data sets, specimen numbers can be copied and pasted. 13. Next, we will import our Reference Values. If they are in CSV format, navigate to the Import button on the right side of the Model Builder screen. If the reference values are not in CSV format, they can be manually entered or copied and pasted from Excel. 14. Finally, now that training set and Reference Value data have been imported, you may proceed with model building as described in Step 4 “Creating a Model,” Step 5 “Saving a model to F750,” and Step 6 “Validating the Model” sections of this guide. 60 1554 NE 3rd Ave, Camas, WA 98607, USA Phone: (360) 833-8835 [email protected] www.felixinstruments.com F-750 Instruction Manual 7/30/2015 Building a Model to Measure Two Traits Building a model to measure more than one trait (such as dry matter, brix, or chlorophyll), is often a very useful and timesaving method. To do this, we will slightly alter our reference collection method to accommodate the collection of more than one parameter. To measure two traits we recommend using one of the following two methods: 1. Build one training set for one trait and another separate training set for the second desired trait. Each training set will use a different set of specimen. a. For example, use 100 apples in training set ‘a’ and collect dry matter reference values for these specimens. Use another 100 apples for training set ‘b’, but this time collect Brix reference values for these specimens. Combine these two training sets in Model Builder as discussed in the ‘Merging Training sets in Model Builder’ section of this user manual. 2. On fruit which has a large enough area, two cheeks of the same specimen can be used for two difference reference methods. To do this, create a training set by scanning two cheeks of each specimen. a. Each specimen should be scanned twice, once per side. Then, when collecting reference values, one cheek 1554 NE 3rd Ave, Camas, WA 98607, USA Phone: (360) 833-8835 [email protected] www.felixinstruments.com 61 F-750 Instruction Manual 7/30/2015 could be used to measure dry matter for example and the other cheek Brix. When building a training set with two scans per piece of fruit (left cheek and right cheek), care must be taken as to how the data is arranged in Model Builder software. When put into model builder with a single training set, appropriately assign the reference values to the spectra, as shown in the following figure, where the left cheek is assigned odd number specimen scans and the right cheek is even number specimen scans. 62 1554 NE 3rd Ave, Camas, WA 98607, USA Phone: (360) 833-8835 [email protected] www.felixinstruments.com F-750 Instruction Manual 7/30/2015 Using the Small Fruit Adaptor Accessories Small fruit adaptor accessories are included with the F750. These accessories are designed to maximize and focus the light when measuring small fruits such as grapes or cherries. Two reflector cone sizes are provided to accommodate a variety of small fruit, 11 mm and 19 mm, and a small fruit adaptor, which has three spokes and a central ring, similar to crosshairs or a target. Fig. Clockwise from Top Left: 11 mm reflector cone, 19 mm reflector cone, small fruit adaptor. For very small fruit there is a limited amount of light on the fruit and the reflector cone can change the angle and provide more light. For example, a blueberry looks brighter when placed on the F-750 with proper reflector cone, and looks very dark without it. 1554 NE 3rd Ave, Camas, WA 98607, USA Phone: (360) 833-8835 [email protected] www.felixinstruments.com 63 F-750 Instruction Manual 7/30/2015 Selecting a Small Fruit Adaptor Accessory: It is important to be consistent when taking scans for training sets and predictions: the accessory should be used for all samples or for none. If the fruit does not fit in the reflector cone, and protocol is to use the reflector cone, pick a different fruit specimen that fits, or re-scan all fruit samples without the reflector cone. Ensure that fruit samples are positioned with the same orientation or presentation when scanning (straight up or not leaning against the side of the reflector cone). If fruit touches side of reflector cone, it should touch the side of the cone for all measurements. Fruit should be centered using the guides on the small fruit adaptor. Some cherry varieties may be too large to use the 19 mm reflector cone, if this is the case, use only the small fruit adaptor. For cherry varieties, with a diameter typically larger than 25 mm, it is best not to use a reflector cone or small fruit adaptor base. Also, extra care should be taken for these large cherries to take the reference value from the area of the fruit that is scanned by the F-750. Keep in mind that consistency in model building is key, either use the reflector cone for all cherries scanned, or none. 64 1554 NE 3rd Ave, Camas, WA 98607, USA Phone: (360) 833-8835 [email protected] www.felixinstruments.com F-750 Instruction Manual 7/30/2015 To use the reflector cones, one quick changeover must first be made to the F-750 by installing the small fruit adaptor (black ring with central circle and 3 spokes). Using a #1 Phillips head screwdriver, swap this adaptor with the plain one currently on the F-750. Be sure the beveled or grooved edge is facing upwards and that the post lines up with the post of the lens, as shown in the following figure. After the small fruit adaptor is installed, center the small fruit specimen on the central ring. This small ring will hold the fruit specimen in the correct position for measurements to be taken. Now, place the reflector cone over the specimen. You will notice that there are magnets installed within the reflector cone to obtain a good fit. 1554 NE 3rd Ave, Camas, WA 98607, USA Phone: (360) 833-8835 [email protected] www.felixinstruments.com 65 F-750 Instruction Manual 7/30/2015 Cleaning and Maintenance Keep the lens of the F-750 clean and protected from dirt and scratches. If the lens is dirty, unscrew the cover plate and gently wipe the lens in a smooth straight motion with rubbing alcohol and a clean nonabrasive cloth. Then, reaffix the cover plate. With normal use, the durable Gorilla Glass lens should not scratch. If the lens requires rinsing with water, ensure that the rubber bumper (that protects water from leaking into the USB and SD card slot) is snugly installed. The rubber bumper and the case of the F-750 can be wiped clean with a cloth. 66 1554 NE 3rd Ave, Camas, WA 98607, USA Phone: (360) 833-8835 [email protected] www.felixinstruments.com F-750 Instruction Manual 7/30/2015 Firmware Update Procedure The firmware of the F-750 is updated by connecting the instrument to a computer using a USB cable and running the Firmware Update tool. The firmware update tool includes details instructions for updating the firmware. This firmware update tool is available online at http://www.felixinstruments.com/Software/F750/FirmwareUpdateTool/index.htm For questions concerning firmware updates, please contact [email protected]. Tip: If you experience any issues with the firmware updating process, “Bootloader Assist” mode can be accessed by pressing and holding the ‘down’ arrow while turning the device on. Follow the instructions displayed on screen, and continue the firmware updating process as usual. 1554 NE 3rd Ave, Camas, WA 98607, USA Phone: (360) 833-8835 [email protected] www.felixinstruments.com 67 F-750 Instruction Manual 7/30/2015 Supporting Science Fish Fat and Moisture Content Downey, G. (1996). Non-invasive and non-destructive percutaneous analysis of farmed salmon flesh by near infra-red spectroscopy. Food Chem. 55:305–311. NIR interactance range 700-1100 nm 6 sites on dorsal and ventral side of each fish (measurement through skin and scales). Total of 294 spectra from all different sites. Reference chemical values of fat and moisture were determined from excised flesh from the different NIR measurement sites. Fat range: 2.3–23.0% Moisture range: 57.9–74.7%. Spectral measurements on the dorsal surface gave lowest prediction errors (bias corrected) for fat 2.0% and moisture 1.45%. Lee, M. H., Cavinato, A. G., Mayes, D. M., and Rasco, B. A.(1992). Noninvasive short-wavelength near-infrared spectroscopic method to estimate the crude lipid content in the muscle of intact rainbow trout, J. Agric. Food Chem. 40:2178–2181. NIR interactance range 700-1050 nm 52 frozen and thawed rainbow trout, Oncorhyncus mykiss (measurement through skin). Weight range: 66.5–883 grams Local fat range: 2.0–13% Prediction error results for fat: 0.7 to 2.3%; correlation coefficients ranged from 0.73 to 0.90 68 1554 NE 3rd Ave, Camas, WA 98607, USA Phone: (360) 833-8835 [email protected] www.felixinstruments.com F-750 Instruction Manual 7/30/2015 and varied with measurement locations on the fish body. Wold, J. P. and Isaksoon, T. (1997), Non-Destructive Determination of Fat and Moisture in Whole Atlantic Salmon by Near-Infrared Diffuse Spectroscopy. Journal of Food Science, 62: 734–736. NIR interactance range 800-1100 nm (2 nm increments/steps) Intact whole farmed Atlantic salmon Determine crude fat and moisture The method could be used for classification of salmon into groups: o Very low fat (less than 8%) o Low fat (8–12%) o Medium fat (12–16%) o High fat (16–20%) o Very high fat (greater than 20%) Wine Grape Anthocyanin Content Cozzolino, D., Parker, M., Dambergs, R. G., Herderich, M. and Gishen, M. (2006), Chemometrics and visible-near infrared spectroscopic monitoring of red wine fermentation in a pilot scale. Biotechnol. Bioeng., 95: 1101–1107. NIR interactance range 400 -700 nm Began sampling on Day 0 of grape fermentation Samples taken after Day 0 showed a marked increase in anthocyanin absorption around 540 nm 1554 NE 3rd Ave, Camas, WA 98607, USA Phone: (360) 833-8835 [email protected] www.felixinstruments.com 69 F-750 Instruction Manual 7/30/2015 Demonstrates extraction of these phenolic pigments from grape skins into the wine during fermentation. Mango Model Optimal Wavelengths Subedi, P., Walsh, K., Owens, G. (2007) Prediction of mango eating quality at harvest using short-wave near infrared spectrometry. Postharvest Biology and Technology, 43: 326–334. Optimal wavelength range for DM modeling provides the lowest RMSE. o Start wavelength range of 700-880 nm and end range of 920-1100 nm. Optimal wavelength range for TSS modeling: o Start wavelength range of 740-850 nm and end range of 950-1100 nm. Optimal wavelength range for Hunter b (skin color) modeling: o Start wavelength range of 760–870 nm and end range of 1000-1100 nm. Optimal wavelength range for maturity score modeling: o Start wavelength range of 700-850 nm and end range of 1000-1100 nm. The optimal wavelength region was similar for the TSS, DM and Hunter b models, and different to that for the maturity score model. 70 1554 NE 3rd Ave, Camas, WA 98607, USA Phone: (360) 833-8835 [email protected] www.felixinstruments.com F-750 Instruction Manual 7/30/2015 Kiwifruit McGlone, V.A. (1998). Firmness, dry-matter and solublesolids assessment of postharvest kiwifruit by NIR spectroscopy. Postharvest biology and technology (09255214), 13 (2), 131. NIR interactance range for Dry Matter and TSS 800-1100 nm. Known important carbohydrate bands at 880, 900–930 and 970 nm. Strong water band at 958 nm. Apple Dry Matter McGlone, A., Jordan, R., Seelye, R., Clark, C. (2003). Drymatter – a better predictor of the post-storage soluble solids in apples? Postharvest biology and technology, 28: 431–435. NIR interactance range for apple dry matter: 800-1000 nm. Instrument Precision Optimization Greensill, C., Walsh, K. (2000) Optimization of Instrumentation Precision and Wavelength Resolution for the Performance of NIR Calibrations of Sucrose in a WaterCellulose Matrix. Appl. Spectrosc. 54: 426-430. NIR interactance range sucrose in water 7001050 nm 1554 NE 3rd Ave, Camas, WA 98607, USA Phone: (360) 833-8835 [email protected] www.felixinstruments.com 71 F-750 Instruction Manual 7/30/2015 Publications Cozzolino, D., Parker, M., Dambergs, R. G., Herderich, M. and Gishen, M. (2006), Chemometrics and visible-near infrared spectroscopic monitoring of red wine fermentation in a pilot scale. Biotechnol. Bioeng., 95: 1101–1107. Downey, G. (1996). Non-invasive and non-destructive percutanous analysis of farmed salmon flesh by near infrared spectroscopy. Food Chem. 55:305–311. Greensill, C., Walsh, K. (2000) Optimization of Instrumentation Precision and Wavelength Resolution for the Performance of NIR Calibrations of Sucrose in a WaterCellulose Matrix. Appl. Spectrosc. 54: 426-430. Lee, M. H., Cavinato, A. G., Mayes, D. M., and Rasco, B. A. (1992). Noninvasive short-wavelength near-infrared spectroscopic method to estimate the crude lipid content in the muscle of intact rainbow trout, J. Agric. Food Chem. 40:2178–2181. McGlone, V.A. (1998). Firmness, dry-matter and solublesolids assessment of postharvest kiwifruit by NIR spectroscopy. Postharvest biology and technology (09255214), 13 (2), 131. McGlone, A., Jordan, R., Seelye, R., Clark, C. (2003). Drymatter – a better predictor of the post-storage soluble solids in apples? Postharvest biology and technology, 28: 431–435. 72 1554 NE 3rd Ave, Camas, WA 98607, USA Phone: (360) 833-8835 [email protected] www.felixinstruments.com F-750 Instruction Manual 7/30/2015 Savitzky, A., Golay, M. (1964) Smoothing and Differentiation of Data by Simplified Least Squares Procedures. Analytical Chemistry, 36(8) 1627–1639. Sjostrom, M., Wold, S. (1983) A multivariate calibration problem in analytical chemistry solved by partial leastsquare models in latent variables. Analytica Chimica Acta, (150) 61-70. Subedi, P. (2007) Prediction of mango eating quality at harvest using short-wave near infrared spectrometry. Postharvest biology and technology, 43 (3), 326. Subedi, P., Walsh, K. (2011) Assessment of sugar and starch in intact banana and mango fruit by SWNIR spectroscopy. Postharvest Biology and Technology Subedi, P., Walsh, K. (2009) Technologies for assessing fruit quantity and quality: maturity, pigmentation, dry matter content, firmness. Mango Encylopaedia, 2(10): 139. Subedi, P., Walsh, K., Hopkins, D. (2012) Assessment of titratable acidity in fruit using short wave near infrared spectroscopy. Part A: establishing a detection limit based on model solutions. Near Infrared Spectrosc., (20) 449457. Subedi, P., Walsh, K., Hopkins, D. (2012) Assessment of titratable acidity in fruit using short wave near infrared spectroscopy. Part B: intact fruit studies. Near Infrared Spectrosc., (20) 459-463. 1554 NE 3rd Ave, Camas, WA 98607, USA Phone: (360) 833-8835 [email protected] www.felixinstruments.com 73 F-750 Instruction Manual 7/30/2015 Subedi, P., Walsh, K., Owens, G. (2007) Prediction of mango eating quality at harvest using short-wave near infrared spectrometry. Postharvest Biology and Technology, 43: 326–334. Subedi, P., Walsh, K., Purdy, P. (2010) Determination of Optimum Maturity Stages of Mangoes Using Fruit Spectral Signatures, China Int Mango Conf 1-12. Walsh, K., Guthrie, J., Burney, J. (2000) Aust. J Application of commercially available, low-cost, miniaturized NIR spectrometers to the assessment of the sugar content of intact fruit. Plant Physiol, 27: 1175-1186. Walsh, K., Long, R., Middelton, S. (2007) Use of near infrared spectroscopy in evaluation of source-sink manipulation to increase the soluble sugar content of stonefruit. Journal of Horticultural Science & Biotechnology, (82:2) 316–322. Wold, J., Isaksoon, T. (1997) Non-Destructive Determination of Fat and Moisture in Whole Atlantic Salmon by Near-Infrared Diffuse Spectroscopy. Journal of Food Science, 62: 734–736. 74 1554 NE 3rd Ave, Camas, WA 98607, USA Phone: (360) 833-8835 [email protected] www.felixinstruments.com F-750 Instruction Manual 7/30/2015 F-750 Vocabulary Definitions Aroma: Comes from volatiles given off by the fruit as they are detected by olfactory receptors when fruit is chewed and swallowed. Dry Matter (DM): The ratio of the water content to the dry weight of the fruit. Dry matter is a function of the solids and water the fruit has accumulated while growing on the plant, and is used as an indicator of both taste and texture. Explained Variance: Share of total variance which is accounted for by the model. For example, an explained variance of 90% implies that the model accounts for 90% of variance in the data. Flavor: is a combination of taste and aroma Horizontal Dilution of Precision (HDoP): The HDoP represents an estimate of how much error is introduced to GPS readings by the relative position of the satellites to the user. HDoP is measured on a scale from 1 to 20, with one being the best, and therefore most accurate, and 20 being the worst, with around 300 meters of error in any direction. An HDoP of 1 to 4 is recommended if GPS readings are going to be taken in the field. Interactance Spectroscopy: A mode of NIR spectroscopy where the light is directed into the specimen, interacts with the sample, and is remitted from another location on the specimen which is not receiving light itself. This method is ideal for providing information on the internal composition of the sample (see figure in Theory of Operation section page 6). 1554 NE 3rd Ave, Camas, WA 98607, USA Phone: (360) 833-8835 [email protected] www.felixinstruments.com 75 F-750 Instruction Manual 7/30/2015 Model Builder File: The type of file used by the Model Builder software which includes the Training Set, Reference Values and ranges of spectra to build the model used by the device. Model Linearity: ‘Goodness of fit’ for the selected number of principle components. NIPALS (Non-linear Iterative Partial Least Squares): Iterative computer implementation of PLS. PLS is a method used by the F-750 to generate a mathematical model of regression coefficients. PLS1 only predicts a single trait with a single regression vector. PLS2 can be used to predict multiple traits with a single regression vector. The F-750 will do PLS1 multiple times to predict multiple traits. Prefix: This is a label placed on each measurement along with the lot and sample number that may help with organizing data. Prediction Error: Reference values versus predicted values for each specimen. Cross validation uses ‘leave one out’ grouping by specimen number to simulate an independent data set. Reference Value: The known concentrations or value of constituent (i.e. trait, quality, or property of interest). This could be the use of a refractometer for total soluble sugar or a scale to determine dry matter content. Regression Coefficients: Mathematical significance of each pixel, selected in spectra selection, which is used to make predictions. Regression coefficients are a series of 76 1554 NE 3rd Ave, Camas, WA 98607, USA Phone: (360) 833-8835 [email protected] www.felixinstruments.com F-750 Instruction Manual 7/30/2015 weighted values generated by PLS. When these are applied to a scan of an unknown sample, a prediction of concentration is made. These values are the core of the mathematical model. PLS takes multiple scans and combines it with Reference Values to generate a regression vector specific to a single property (such as dry matter). By taking the dot product of the regression vector and a scan of an unknown sample, a concentration can be determined. These are stored in a single row wise vector, there is 1 element in the vector for every pixel used the regression. Root Mean Squared Error (RMSE): Average or percent uncertainty (error) of any individual measurement. For example, a dry matter model with a RMSE of 0.0123 has an error of 1.23%DM or a 1.23% prediction error. An acceptable amount of error is determined by the type of property being predicted and the user application. It also depends on the uncertainty of the reference method. RMSE is treated as expected error with first standard deviation or 68% of measurements. Root Mean Squared Error Calibration (RMSEC): Measurement of goodness of fit between data and calibration model (training set). This is essentially the calibration for training set error prediction. Root Mean Squared Error Cross Validation (RMSECV): The error of cross validation of training set prediction. One specimen is taken out, the model rebuilt and that specimen is predicted using the model. 1554 NE 3rd Ave, Camas, WA 98607, USA Phone: (360) 833-8835 [email protected] www.felixinstruments.com 77 F-750 Instruction Manual 7/30/2015 Root Mean Squared Error Prediction (RMSEP): A measure of true prediction, measured on real fruit and compared to reference values of an independent data set. Savitzky–Golay Coefficients: A mathematical tool used to smooth spectra and to generate first or second derivatives. This is useful as it removes noise and the derivative removes baseline offset error. Refer to Savitzky and Golay (1964) for more information. Scores Plot: Displays how close each spectra is to the principle components used to create the model. Distinct groups of points indicate “like” specimen, such as when viewing two different temperatures. SSC: Soluble sugar content Taste: The amount of sugars and acids in the fruit, as they are detected by taste buds on the tongue. Training Set: The set of all of scans that will be used for the PLS regression. X population: All of the spectra stored in a row rise matrix. Y population: The Reference Values determined by a reference method stored in a single column vector. 78 1554 NE 3rd Ave, Camas, WA 98607, USA Phone: (360) 833-8835 [email protected] www.felixinstruments.com F-750 Instruction Manual 7/30/2015 Technical Support If you have a question about the F-750, first look in the F750 Instruction Manual. There is also online support available for the F-750 at http://felixinstruments.com/support. If you cannot find the answer, you can contact a Technical Support Representative located in your country. Felix Instruments is committed to provide customers with high quality, timely technical support. Technical support representatives are to answer your technical questions by phone or by e-mail at [email protected]. Felix Instruments’ contact information: Felix Instruments 1554 NE 3rd Ave Camas, WA 98607 USA Phone: 800-767-0119 (U.S. and Canada) 360-833-8835 Fax: 360-833-1914 Website: http://www.felixinstruments.com E-mail: [email protected] 1554 NE 3rd Ave, Camas, WA 98607, USA Phone: (360) 833-8835 [email protected] www.felixinstruments.com 79 F-750 Instruction Manual 7/30/2015 Customer Service Customer Service Representatives answer questions about specifications and pricing, and sell all of the Felix Instruments products. Customers sometimes find that they need Felix Instruments to upgrade, recalibrate or repair their system. In order for Felix Instruments to offer these services, the customer must first contact us and obtain a Return Merchandise Authorization (RMA) number. Please contact a customer service representative for specific instructions when returning a product. 80 1554 NE 3rd Ave, Camas, WA 98607, USA Phone: (360) 833-8835 [email protected] www.felixinstruments.com F-750 Instruction Manual 7/30/2015 Frequently Asked Questions 1. What can the F-50 Produce Quality Meter measure? The F-750 Produce Quality Meter is typically used to measure the concentration of dry matter, total soluble solids, chlorophyll, titratable acids, etc. in fruits and other produce. However, the F-750 can be used to measure any substance with a distinct correlation to light in the 285-1200 nm range. This includes everything from steel quality to the liquid content of fish or dry matter in cheese. 2. How do I recharge the batteries of the F-750? To recharge the batteries, peel off the rubber bumper from the F-750. Then twist to remove the battery compartment cap (located on the bottom of the F-750). Next, remove the batteries from the F-750 to place them in the battery charger. Charged batteries should be inserted into the F750 positive (+) side first. 3. If the instrument locks up can I reset it without removing the batteries? Yes, press and hold the power button until you hear a beep. This will cause the instrument to reset. If you have held the power button for longer than ten 10 seconds, and the instrument will not restart, you may need to remove, then re-insert the batteries. 4. When I power on my F-750, I receive a message which reads “SD Card Corrupted,” What should I do? 1554 NE 3rd Ave, Camas, WA 98607, USA Phone: (360) 833-8835 [email protected] www.felixinstruments.com 81 F-750 Instruction Manual 7/30/2015 This message indicates that an error has occurred with the SD card. To check this, insert the SD card into your computer. Go to your computer folder, then right click on the SD card icon, and click on properties. Click on the tools tab, and then the option for check drive for errors. Click Check Now and if you are given disk options, check both boxes to fix errors, and to recover bad sectors. Your SD card should now work if re-inserted into your F750. 5. I started a scan and it will not stop taking scans. How do I stop it? If you want to stop the device from taking consecutive scans during the process, the opportunity to stop the next scan comes after the measurement data screen displays. When the screen displays after the measurement data screen, press any arrow key. If you have the Delay Between Measurements set to 0, you can hold down any arrow key once the measurement data screen displays until it disappears. After the measurement data screen displays and an arrow key is pressed, you will get a display that gives you the option to press the left arrow to abort or the right arrow to continue taking continuous scans. 6. I am having trouble updating the firmware on my device, what can I do? If you experience any issues with the firmware updating process, “Bootloader Assist” mode can be accessed by pressing and holding the ‘down’ arrow while turning the device on. Follow the instructions displayed on screen, and continue the firmware updating process as usual. 82 1554 NE 3rd Ave, Camas, WA 98607, USA Phone: (360) 833-8835 [email protected] www.felixinstruments.com F-750 Instruction Manual 7/30/2015 7. How many specimen should I use to create a model? As a general rule, we recommend a minimum of 200 specimen to build a model. The upper limit for number of specimen in a model can be detected by monitoring the RMSECV. When there is no longer a change in RMSECV by addition of more samples, the upper limit is reached. As the number of samples increased, the RMSECV should decrease until you see diminishing returns. At this point you have sufficiently sampled the variance in the population. For a proof of concept model, 2030 specimen should be sufficient. 8. How do I change the name of a model after I have already saved it to my F750? The only way you can set the name of the model is when you Save As… to the SD card from Model Builder. If you would like to change the name of a model, you would have to load the model into Model Builder and Save As… with the desired name. 9. Why is the scale of the Savitzky–Golay second derivative off by a factor of 2 in intensity? The F750 and Model Builder software were designed to be compatible with the original NIRvana. As such, the coefficients are identical to unscrambler V8 and below. 10. I am having a problem. I have read the manual and the FAQ’s and I still don’t know what to do. What do I do now? If you have a question about the F-750, first look in the F-750 Instruction Manual. There is also online support available for the F-750 at 1554 NE 3rd Ave, Camas, WA 98607, USA 83 Phone: (360) 833-8835 [email protected] www.felixinstruments.com F-750 Instruction Manual 7/30/2015 http://felixinstruments.com/support. If you cannot find the answer, you can contact a Technical Support Representative located in your country. Felix Instruments is committed to provide customers with high quality, timely technical support. Technical support representatives are to answer your technical questions by phone or by email at [email protected]. 84 1554 NE 3rd Ave, Camas, WA 98607, USA Phone: (360) 833-8835 [email protected] www.felixinstruments.com F-750 Instruction Manual 7/30/2015 Felix Instruments Hardware Warranty Important: Please Read! Seller’s Warranty and Liability: Seller warrants new equipment of its own manufacturing against defective workmanship and materials for a period of one year, of a single shift operation, from date of receipt of equipment the results of ordinary wear and tear, neglect, misuse, accident and excessive deterioration due to corrosion from any cause is not to be considered a defect. Any defect must be called to the attention of Felix Instruments, Camas, Washington, USA, in writing, within 90 days after receipt of the unit. Seller’s liability for defective parts is limited to the repair or replacement of any part of the instrument without charge, if Felix Instruments’ examination discloses that part to have been defective in material or workmanship, and in no event shall exceed the furnishing of replacement parts F.O.B. the factory where originally manufactured. No equipment may be repaired or altered by anyone not authorized by Felix Instruments. Material and equipment covered hereby, which is not manufactured by Seller, is to be covered only by the warranty of its manufacturer. Seller shall not be liable to the Buyer for loss, damage, or injury to persons (including death), or to property or things, whatsoever, including, but without limitation, products processed by the use of the equipment; or for damages of any kind or nature (including, but without limitation, loss of anticipated profits), occasioned by or arising out of installation, operation, use, misuse, nonuse, repair, or replacement of said material and equipment, or out of the use of any 1554 NE 3rd Ave, Camas, WA 98607, USA 85 Phone: (360) 833-8835 [email protected] www.felixinstruments.com F-750 Instruction Manual 7/30/2015 method or process for which the same may be employed. The purchaser is to pack, ship, or deliver the instrument to Felix Instruments, in Camas, Washington, USA, within 30 days after Felix Instruments has received written notice of the defect at the customer’s expense. No other arrangements may be made unless otherwise approved in writing by Felix Instruments. The use of this equipment constitutes Buyer’s acceptance of the terms set forth in this warranty. There are no understandings, representations, or warranties of any kind, express, implied, statutory, or otherwise (including, but without limitation, the implied warranties of merchantability and fitness for a particular purpose), not expressly set forth herein. 86 1554 NE 3rd Ave, Camas, WA 98607, USA Phone: (360) 833-8835 [email protected] www.felixinstruments.com F-750 Instruction Manual 7/30/2015 Appendix I: Mango Model Building Standard Operating Procedure (SOP) The following procedure outlines the process of creating a model on the F-750 device for dry matter and TSS (brix) with mangos. I. Getting prepared for model building Equipment needed: Environmental chamber at temperature Fruit Permanent Marker(s) 1. Select specimen of fruit with a wide range of maturity to be used in training set creation and label with a specimen number. (Note: if both sides of the fruit are to be scanned label each side as their own sample #, i.e.; mango 1 will be samples 1 and 2, mango 2 will be samples 3 and 4 and so on.) 2. Determine the three temperatures to be used for the training set (Minimum, Mid, and Maximum.) It is best to choose a range of temperatures encompassing the range which the measurements will be taken in the field, for example, 10°C, 20°C, 30°C. 3. Place the fruit in a temperature controlled environmental chamber (a temperature controlled room will work.) 4. After the fruit has been given enough time to come to the pre-determined temperature (generally about one hour.) It is now time to begin taking measurements for the training set. 1554 NE 3rd Ave, Camas, WA 98607, USA Phone: (360) 833-8835 [email protected] www.felixinstruments.com 87 F-750 Instruction Manual 7/30/2015 II. Preparing the F-750 Equipment needed: F-750 1. Turn on the F-750 and navigate to the Setup Menu > Training Sets > Create New Training Set. 2. Enter a name to use for the new training set using the up and down arrows to select characters and press the right arrow to enter (pressing the right arrow twice moves to the next menu.) 3. Enter the number of specimens that will be used to build the model (minimum of 10 specimens.) Press the right arrow again to create the training set file. Be aware this step can take a few minutes, and very large training sets (5000+) can take up to an hour to process. 4. After the training set has been created, press right to enter the Browse Specimen Data menu. Navigate to the first temperature: Minimum. Now we will begin scanning each specimen. Be careful not to remove too many specimens at a time from the temperature controlled chamber as you want the set temperature to remain constant across the specimens. 88 1554 NE 3rd Ave, Camas, WA 98607, USA Phone: (360) 833-8835 [email protected] www.felixinstruments.com F-750 Instruction Manual 7/30/2015 III. Scanning Fruit Equipment needed: Permanent Marker(s) F-750 1. Place the first specimen on the fruit adaptor of the F-750 and use a permanent marker to mark the area to be scanned. 2. On the F-750 with Specimen 1 highlighted on the list, press the right arrow to collect the training spectra. The instrument will indicate “Processing”. Do not press the scan button to gather training set spectra. 3. After each specimen has been scanned, you will see a date and time included in the specimen file name. (Note: Specimens can be re-recorded if a mistake is made or the wrong specimen/temperature is selected.) 4. Repeat for all specimens at the Minimum Temperature. 5. After all specimens have been recorded at the Minimum Temperature, place the specimens back in the temperature controlled area to bring the fruit to your next selected temperature: Mid temperature. 6. After specimens have reached the desire Mid temperature, the next set of temperature data is ready to be collected. 7. If you have turned off the F-750 while waiting for the specimens to reach their next temperature, navigate to the Setup Menu > Training Sets > Modify Existing Training Set and select the training set you created previously. 1554 NE 3rd Ave, Camas, WA 98607, USA Phone: (360) 833-8835 [email protected] www.felixinstruments.com 89 F-750 Instruction Manual 7/30/2015 8. Within your training set file go to Browse Specimen Data and navigate to the Mid Temperature folder. Place the first specimen on the fruit adaptor and align with pervious san location markings, and with Specimen 1 highlighted on the list press the right arrow to collect the training spectra. 9. Repeat for all specimens at Mid temperature. (Note: You will be using the same specimens for all three temperature sets so the specimen must be scanned in the same order and at the same location as was done for the Minimum Temperature.) 10. Repeat the previous steps for the Maximum Temperature when the specimens are at the selected temperature. You are now finished creating your training set. The same specimens used for training set creation will now be used to collect reference values for building a predictive model. 90 1554 NE 3rd Ave, Camas, WA 98607, USA Phone: (360) 833-8835 [email protected] www.felixinstruments.com F-750 Instruction Manual 7/30/2015 IV. Collecting Dry Matter Reference Data Equipment Needed: Paring knife Cutting board Circular corer Microbalance Food dehydrator(s) 1. Remove the fruit skin from the area which was marked and scanned with the F-750 with a sharp knife being careful to both fully remove the skin, but also to remove as little meat as possible. 2. Push the 26mm circular corer to the seed of the mango in the prepared area. 3. Remove the corer and slice the mango close to the seed removing the core of sampled mango. 4. Trim the mango core on the seed side, so the total height of the cylinder is 2cm. 5. Weigh the sample in a microbalance as soon as is possible and record the weight to the nearest .001 grams. The expected wet mass should be around 10-12 g. 6. Dry the samples in a dehydrator for 48 hours set at 63-65°C. 7. After 40 hours, re-weigh a few of the samples and record the values. Replace the samples back into the dehydrator. 8. Re-check the same samples a couple of hours later and see if they have changed in weight, if they have not you can assume they are fully dehydrated. 9. Measure all samples one at a time in a microbalance and record the values. 1554 NE 3rd Ave, Camas, WA 98607, USA Phone: (360) 833-8835 [email protected] www.felixinstruments.com 91 F-750 Instruction Manual 7/30/2015 10. Divide the final (dry) weight from the initial (wet) weight for each sample to determine the Dry Matter. IV. Collecting Brix/SSC Reference Data Equipment Needed: Paring knife Cutting board Circular corer Digital Refractometer Garlic Press/cheese cloth 1. Ensure fruit and refractometer have equilibrate to the same temperature. 2. Remove the fruit skin from the area which was marked and scanned with the F-750 with a sharp knife being careful to both fully remove the skin, but also to remove as little meat as possible. 3. Push the 26mm circular corer to the seed of the mango in the prepared area. 4. Remove the corer and slice the mango close to the seed removing the core of sampled mango. 5. Trim the mango core on the seed side, so the total height of the cylinder is 2cm. 6. Load the sample core into the garlic press or cheese cloth 7. Holding the press over the refractometer, apply pressure until several drops of juices have covered the quartz optical sensor of the refractometer. 8. Press the scan button and record the value 92 1554 NE 3rd Ave, Camas, WA 98607, USA Phone: (360) 833-8835 [email protected] www.felixinstruments.com F-750 Instruction Manual 7/30/2015 9. Press the scan button again to ensure the refractometer has given a stable reading 10. Wipe and dry the refractometer 11. Repeat process with the next specimen. 12. It is useful to occasionally check the zero of the refractometer with DI water. 1554 NE 3rd Ave, Camas, WA 98607, USA Phone: (360) 833-8835 [email protected] www.felixinstruments.com 93 F-750 Instruction Manual 7/30/2015 F-750 Production Test Check Sheet Date: ___________________ Technician Name: ___________________ Serial #: ___________________ Spectrometer #: ___________________ Firmware Version: ___________________ Spectrometer Pixel Coefficients C0: C1: C2: C3: Spectrometer ADC Gain: Reference Voltage: 94 1554 NE 3rd Ave, Camas, WA 98607, USA Phone: (360) 833-8835 [email protected] www.felixinstruments.com F-750 Instruction Manual 7/30/2015 1554 NE 3rd Ave, Camas, WA 98607, USA Phone: (360) 833-8835 [email protected] www.felixinstruments.com 95 F-750 Instruction Manual 7/30/2015 Warranty Registration Card 1554 NE 3rd Ave, Camas, WA 98607, USA Phone: (360) 833-8835 Fax: (360) 833-1914 e-mail: [email protected] Web: www.felixinstruments.com PRODUCT REGISTRATION CARD Please complete and return this form to Felix Instruments within 30 days to validate your Warranty on Parts & Labor. Registration Information: Your Name:____________________________________ Title:__________________ Company/University:___________________________________________________ Address:_____________________________________________________________ City:____________________________ State:__________ Zip:__________________ Country:__________________________Email_______________________________ Phone:______________________________ Fax:____________________________ Felix Instruments Serial Number(s):__________________________________________________ Purchase Date:_____________________Purchase Price:_____________________ -----------------------------------------------------------------------------------------------------------------FOLD ON DOTTED LINE Your opinions will help improve our service. Please answer the following questions. 1. What was the basis of your product selection? □ Representative Recommendation □ Product Features □ Technical Specifications □ Warranty □ Other _________________________________________ □ Price □ Product Design □ Brand Name □ Service 2. What other competing brands did you consider? __________________________ 3. Where did you first learn of this product? □ Advertisement in ________________________________ □ Friend/Colleague □ Other _________________________________________ □ Representative □ Exhibit 4. Who selected this product? □ I did □ University Department □ Other _________________________________________ □ Research Group □ Purchasing 5. Comments/Suggestions: ______________________________________________________________________ ______________________________________________________________________ 96 1554 NE 3rd Ave, Camas, WA 98607, USA Phone: (360) 833-8835 [email protected] www.felixinstruments.com