1
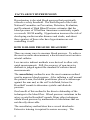
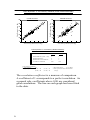
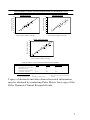
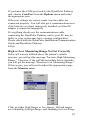
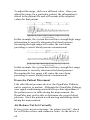
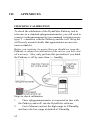
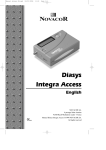
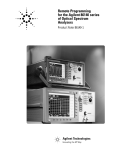
Copyright 1992-2007 by Pulse Metric, Incorporated All rights reserved. All Pulse Metric products are covered by patents and/or pending patents from the United States and other governments. Trademarks: Pulse Metric is a registered trademark of Pulse Metric, Inc. General notice: Other product names used herein are for identification purposes only and may be trademarks of their respective companies. 2100 Hawley Drive Vista, CA 92084 USA Phone: Fax: Email: Website: (760) 842-8278 (760) 758-9425 [email protected] www.DynaPulse.com April 2007 Table of Contents Pathway Software Guide INTRODUCTION..................................................................1 Facts About Hypertension.....................................................2 How is Blood Pressure Measured?........................................ 2 The Next Step..................................................................3 Accuracy of the Pathway Systems...................................5 Interpreting the Results....................................................5 I. INSTALLATION.............................................................. 8 System Requirements.............................................................8 Installing the DynaPulse Pathway Hardware .....................10 Install the Batteries or Plug in the DC Adapter.............10 Connect the Communication Cable ..............................11 Plug the Cuff Assembly into the DynaPulse Pathway Unit.......................................................................11 Install The Dynapulse Pathway Software ........................... 11 Setting Up The Software......................................................12 II. GETTING STARTED WITH THE DYNAPULSE PATHWAY .........................................................................13 Add a New Patient............................................................... 13 Take a Test Measurement.................................................... 15 Take and Save Several Measurements.................................18 Guidelines for Blood Pressure Measurement.......................19 Position the Patient Correctly........................................19 Use the Correct Cuff......................................................20 Patient List........................................................................... 21 III. BASIC OPERATION.................................................. 22 Measurement Result.............................................................22 Blood Pressure Estimation............................................ 22 Measurement Display....................................................24 Trending and Statistical Analysis ........................................30 The Trend window........................................................ 30 Statistical Analysis........................................................ 31 Editing the Trend Display to Validate Results .............33 Managing the Displays.........................................................35 Cascade and Tile............................................................35 Arrange Icons and Close All windows..........................36 Printing.................................................................................37 Print Header Set-up and Print with Report....................37 IV. ADVANCED OPERATIONS......................................38 Blood Pressure (BP) Mode ..................................................38 Guest Mode.......................................................................... 39 The Measurement Table.......................................................39 Export Data in ASCII Format.............................................. 41 AutoMeasure (Cycle)...........................................................42 The Tool Window................................................................ 43 Manage your Patient Data into Different Directories..........44 Patient – Move to New Directory..................................44 Backup, Archive, and Restore Patient Data.........................45 Patient – Backup/Archive..............................................46 Patient – Restore............................................................47 Control Via the DynaPulse Pathway Unit ...........................49 Using the Buttons On the DynaPulse Pathway Unit ....49 Comparing DynaPulse Pathway Unit Buttons to Mouse and Keyboard........................................................49 Patient Profile ......................................................................50 DynaPulse Analysis Center (DAC)......................................51 Access the DAC Service................................................51 Register Patient..............................................................53 Measurement Data Upload............................................ 54 V. OPERATION REFERENCES..................................... 55 The Main Menu....................................................................55 VI. TROUBLESHOOTING ..............................................58 Communication Error....................................................58 High or Low Measuring Range Not Set Correctly........59 Excessive Patient Movement.........................................60 Air Release Not Set Correctly....................................... 60 Measurement Error........................................................61 VII. APPENDICES.............................................................62 Checking Calibration........................................................... 62 COM Port Configuration: Windows 98/ME/NT/2000/XP. 64 DynaPulse Pathway and Multimedia...................................65 Specifications....................................................................... 66 Warranty Information...........................................................67 Software Licensing Agreement............................................69 Company Information ......................................................... 71 INTRODUCTION The DynaPulse Pathway is a non-invasive blood pressure system based on a unique oscillometric technique known as Pulse Dynamics. This technology allows you to obtain clinically accurate measurements quickly and easily. The DynaPulse customer support team is committed to ensuring your continued satisfaction. You are welcome to call us with questions or comments at (760) 842-8224. Indicator Used in this Manual to call your attention to an important feature 1 FACTS ABOUT HYPERTENSION Hypertension is elevated blood pressure that persistently exceeds a safety threshold. The Sixth Report of the Joint National Committee on Prevention, Detection, Evaluation, and Treatment of High Blood Pressure estimates that the blood pressure of 50 million Americans consistently equals or exceeds 140/90 mmHg. Hypertension increases the risk of developing cardiovascular diseases and stroke, and about three quarters of those who have hypertension are not controlling it well. HOW IS BLOOD PRESSURE MEASURED? There are many ways to measure blood pressure. To achieve the most accurate measurement, a doctor must insert an intraarterial catheter. Less invasive indirect methods were devised to allow safe, quick measurements. Still, the accuracy of non-invasive methods is judged against the standard of catheter-based measurements. The auscultatory method is now the most common method used to measure blood pressure. After inflating a cuff around the patient's arm, the health practitioner places a stethoscope against the arm and, as the cuff is deflated, listens for Korotkoff sounds to determine systolic and diastolic pressure. One benefit of this method is the direct relationship of the technique to the blood flow. Blood pressure variations in the artery create the Korotkoff sounds. Many other techniques obtain blood pressure by mathematical calculations that are not directly observable. The auscultatory method does have several drawbacks. Extensive training is required to ensure accuracy. The 2 human ear may effectively respond to frequencies between 20 and 20,000 Hz, but the ear hears best between the range of 200 and 4000 Hz. The Korotkoff sounds heard through an acoustic stethoscope range from 18 to 26 Hz at systolic cuff pressures and 40 to 60 Hz at diastolic pressures. These frequencies are not in the range at which humans are most sensitive. Measurements taken by different people on the same patient can vary due to differences in hearing ability, even if the measurements are taken at the same time! This method also encounters difficulty with patient conditions, such as hypotension, mute or dampens the Korotkoff sounds. Other automated blood pressure monitors are designed to solve the hearing variability problem by using microphones with sound-based algorithms to estimate systolic and diastolic blood pressure. Unfortunately, by removing the human element, these devices lose the advantage of professional validation. They have problems estimating blood pressure in patients with muted Korotkoff sounds. A noisy environment will also influence the determination of blood pressure. These difficulties prompted the development of the Oscillometric technique. Instead of listening for characteristic sounds, the Oscillometric technique uses a cuff and a pressure sensor. These devices estimate blood pressure by examining the pressures generated by the cuff and the arterial pulsation. The estimations are based on large amounts of data and are usually accurate, but they are still estimations. The algorithms are not based on arterial flow or pressure. These devices determine mean arterial pressure, and then estimate systolic and diastolic pressures. The Next Step What is needed is a technology that combines the best of the auscultatory and oscillometric techniques. 3 • A technique that, like the auscultatory method, is based on blood flow properties. • A technique that also offers validation capabilities, like the manual auscultatory method. • A technique that, like the oscillometric method, works on a broad range of patients, including those whose cardiovascular problems may make their blood pressure difficult to measure. Above all, the technique must be accurate. The DynaPulse blood pressure monitor meets all of these criteria. Pulse Dynamics, the patented technology used with the DynaPulse Pathway, also measures the pressures generated by the cuff and the arterial pulsation. However, it is the only oscillometric method to measure blood pressure based on physical phenomena, much like the auscultatory method. Instead of estimating blood pressure, Pulse Dynamics uses pattern recognition to determine systolic, diastolic, and mean arterial pressure, each of which is measured independently from the Pulse Dynamic pressure waveform. This pattern recognition technique is possible due to the effect that blood flow has on the measured pressures at the brachial artery. Pulse Dynamics measurements have been found to agree extremely well with catheter-based measurements. Measurement values based on these standard oscillometric techniques have been provided in the DynaPulse software for your convenience. Several clinical studies have shown that these values for systolic and diastolic pressures, based on the presence of Korotkoff sounds (K1 systolic, K4 diastolic), tend to underestimate the true intra-arterial systolic blood pressure and overestimate the diastolic blood pressure. The diastolic blood pressures based on K5 sounds are often difficult to hear, while more closely resembling end-diastolic 4 blood pressures. However due to popular usage and publication of hypertension guidelines based on these auscultatory techniques, measurement of blood pressure by auscultation has been the standard for clinical practice in the health care community. As a guideline for use of the DynaPulse, for measurements of blood pressure based on use of the auscultatory equivalent algorithms to provide a reasonable comparison with auscultated mercury sphygmomanometer measurements. For measurement of end-systolic and end-diastolic blood pressures more closely related to invasive hemodynamics of the central arterial system, use the central blood pressure measurement mode. The power of using the Pulse Dynamics central blood pressure measurement techniques are described in the following sections. Accuracy of the Pathway Systems To obtain FDA 510K registration for the DynaPulse, Pulse Metric (PMI) validated Pulse Dynamics accuracy relative to both auscultatory and invasive catheter measurements. A 132-patient study compared the monitor to the auscultatory method, in accordance with Association for the Advancement of Medical Instrumentation (AAMI) 10-1987 guidelines. The DynaPulse achieved correlations of 0.96 and 0.89 for systolic and diastolic pressures, respectively. When the DynaPulse was compared to invasive, intra-arterial measurements (a 36-subject study), correlations of 0.94, 0.91, and 0.95 were found for systolic, diastolic, and mean arterial pressures, respectively. Summaries of these two validation studies are presented on the following pages. Interpreting the Results In all cases, the graphs compare Pulse Dynamics to either invasive measurements (using a catheter) or auscultatory measurements. 5 Pulse Dynamics vs. Auscultatory Method (ANSI/AAMI SP10-1987) Diastolic Pressure 100 180 90 Pulse Dynamics (mm Hg) Pulse Dynamics (mm Hg) Systolic Pressure 200 160 140 120 80 70 60 50 100 80 80 100 120 140 160 180 Auscultatory Method (mm Hg) 40 40 200 50 60 70 80 90 Auscultatory Method (mm Hg) 100 Pulse Dynamics vs. Auscultatory Method Summary Systolic Diastolic Mean Difference (Ausc. - PD) -5 1 Standard Deviation 6 5 Standard Error of Estimation Correlation Coefficient 5 0.96 5 0.89 Experimental Conditions: 1. Total Subjects: 132 2. Age Groups: (11-24) = 28 (45-64) = 28 (25-44) = 38 (65-85) = 38 3. Heart Rate Range: 45-115 BPM 4. Data represents a three measurement average. The correlation coefficient is a measure of comparison. A coefficient of 1 corresponds to a perfect correlation. As a general rule, coefficients above 0.80 are considered good correlations. The line on each graph has been fitted to the data. 6 Pulse Dynamics vs. Intra-Arterial Catheterization (UCSD Medical Center) Systolic Pressure Diastolic Pressure 110 Pulse Dynamics (mm Hg) Pulse Dynamics (mm Hg) 220 200 180 160 140 120 100 80 60 100 90 80 70 60 50 40 60 80 100 120 140 160 180 200 220 40 Intra-Arterial Catheter (mm Hg) 50 60 70 80 90 100 110 Intra-Arterial Catheter (mm Hg) Mean Arterial Pressure Pulse Dynamic (mm Hg) 130 120 110 100 90 80 70 60 60 70 80 90 100 110 120 130 Intra-Arterial Catheter (mm Hg) Pulse Dynamics vs. Intra-Arterial Catheterization Summary Mean Difference (Cath. - PD) Standard Deviation Standard Error of Estimation Correlation Coefficient Experimental Conditions: 1. Total Subjects: 2. Invasive Pressure Site: Systolic Diastolic Mean Arterial -2 9 9 0.94 -4 6 6 0.91 -1 5 5 0.95 36 Descending Thoracic Aorta 3. Data represents a three measurement average. Copies of abstracts and other clinical research information may be obtained by contacting Pulse Metric for a copy of the Pulse Dynamic Clinical Research Guide. 7 I. INSTALLATION System Requirements Installing the DynaPulse Pathway Unit Installing the DynaPulse Pathway Software Setting Up the DynaPulse Pathway Software SYSTEM REQUIREMENTS To install the DynaPulse Pathway, you will need the following equipment: • • • • IBM PC or compatible computer with at least 486x/66 processor, 16 Mb of RAM, a hard drive, and a floppy disk drive. Windows 98/ME/NT/2000/XP. An RS-232 serial communications port, independent of ports incorporated by other serial devices, like mouse pointer or serial printers (see Appendix). The DynaPulse Pathway package. The DynaPulse Pathway package comprises the following: 1. The DynaPulse Pathway unit 2. Standard Large, Medium, Small Adult Cuffs 8 3. Communication cable 4. DC adapter 5. DynaPulse Pathway software 9 INSTALLING THE DYNAPULSE PATHWAY HARDWARE Install your DynaPulse Pathway unit in just a few steps. • Install the Batteries or Plug in the DC adapter • Connect the Communication Cable to both the unit and computer. • Plug the cuff assembly into the DynaPulse Pathway unit EQUIPMENT LAYOUT Pathway measuremen t unit Pressure Cuff, Hose and Connector Install the Batteries or Plug in the DC Adapter The DynaPulse Pathway unit either operates on four AA batteries or it draws power from a DC adapter. The battery compartment is located below the LCD screen. 10 Connect the Communication Cable Connect the communication cable to both the unit and computer. You will find a cable in your DynaPulse Pathway package with a nine-pin serial connector on one end, and a circular connector on the other. The nine-pin connector plugs into a serial port on your computer, and the circular connector plugs into the left side of the DynaPulse Pathway unit. Should your computer have a twenty-five pin serial port, you will need to purchase a nine to twenty-five pin adapter from your computer dealer. This should be an inexpensive item. Note: If your computer does not have an empty serial port, (most computers come with at least two serial ports), you will need to install an additional serial port. This should be relatively inexpensive. The alternative is to use an A-B switch box, which allows you to alternate between serial devices (for example, the Pathway and an external modem). Plug the Cuff Assembly into the DynaPulse Pathway Unit The cuff assembly plugs into the right side of the DynaPulse Pathway unit. Large and small cuffs are interchangeable with the medium adult cuff assembly. INSTALL THE DYNAPULSE PATHWAY SOFTWARE We strongly recommend that you make a backup of the DynaPulse Pathway software diskette and use the backup to install the program if the software package is provided with a floppy disk. Please refer to the Windows User's Guide for instructions on copying diskettes. If you have a previous version of DynaPulse product (Pathway or 200M or 2000A) installed on your hard disk and want to maintain the same patient data files created with that version, enter the drive and directory path where the original 11 program files are stored when the installation utility asks for the installation path. Do not delete the previous files. In Windows, click on Start, then Run, and type in A:\setup. Once the software is installed, you will see the DynaPulse Pathway icon on the screen. After installation is complete, start the DynaPulse Pathway software by double-clicking on the DynaPulse Pathway icon. If your DynaPulse Pathway package comes with a CD, just insert the CD into your CD-ROM drive and windows will guide you through the installation steps. SETTING UP THE SOFTWARE The first time you execute the DynaPulse Pathway software, it will run an automatic communications port checker to find which port the DynaPulse Pathway unit is attached to. To run the communications port checker manually, follow the procedure below: 1. Connect the DynaPulse Pathway unit to the COM port of the computer via the communications cable. 2. From the Options menu, select Com Check. 3. 12 Com Check will automatically detect and record the communications port used by the DynaPulse Pathway unit. II. GETTING STARTED WITH THE DYNAPULSE PATHWAY The best way to get started is to add a new patient (you) and take a few measurements. As you use the DynaPulse Pathway unit repeatedly, you will find that efficient operations quickly become second nature. The following steps will get you started: Add a New Patient Take a Test Measurement Take and Save Multiple Measurements ADD A NEW PATIENT 1. Select Add from the Patient menu. You will be prompted to enter an identification number (ID). Using medical record or social security numbers is often helpful. 2. 3. Enter the patient’s ID and select OK. This will open a text box where you can enter additional details. Enter the patient’s name and if the default 13 location (or path) where the patient's data will be stored is missing or incorrect, enter the directory and select a drive. Note: Do not store measurement information in the root directory. Use the default subdirectory C:\Dppathway, or an alternative subdirectory such as C:\DpData. The drive or directory can be on a hard drive. Diskette is not recommended because of limited space. Once you have added a patient, the name will appear on the patient list, and the patient will be automatically activated. A Trend window will then appear on top of this window. A "No Trend data available" box should appear like the one below. 14 You are now ready to take measurements and store them in your own patient data file. TAKE A TEST MEASUREMENT 1. Activate a patient on the patient list by doubleclicking on the name of a patient. The activated patient name will appear in the Patient List title bar. 2. Select Start from Measure menu. the 15 You will be prompted to place the cuff on your arm. Note: You can set the cuff size by clicking on Cuff Size under the Measure menu. 3. Slide the cuff over your arm with the air hose pointing toward your hand. Position the cuff slightly above your elbow with the air hose aligned with the inside of your elbow. Tighten the cuff so it is snug but does not cut off circulation and attach the Velcro. Place the cuff with the air hose positioned over the brachial artery. Ideally, the cuff should be placed on the bare arm. If there is a constricting garment, such as a tight, longsleeve blouse or shirt, it is preferable to place the cuff over the top of the garment rather than to restrict circulation by rolling up the sleeve. 4. 16 Click OK to continue. 5. A mercury-type column will appear. 6. The Measuring message appears while the measurement is taken. You will see the heart beating just as you would with a standard mercury column. Keep the patient from talking or moving while the Measuring message is displayed. 7. Once the cuff pressure reaches the post diastolic point, the Pathway will release the remaining air pressure. When the measurement ends, the results will appear on the screen and LCD of the DynaPulse Pathway unit along with other data. Note: If you experience problems taking a measurement, see the Troubleshooting section. For maximum accuracy, adjust the air release valve such that the measurement time is between 20 and 30 seconds. 17 Arterial pulse display Systolic icon Blood Pressure Systolic Diastolic Cursor position Mean icon Mean Heart Rate Diastolic Cuff pressure icon at cursor position Measurement Timeline (20-30 sec) TAKE AND SAVE SEVERAL MEASUREMENTS Activate a patient before taking a measurement. At this point, take several measurements and save them to your hard drive by clicking on Save from the File menu. This will build your patient data file to the point where you can use the patient management features of the software effectively. When you save a measurement, you will be prompted to add comments such as patient position (seated, standing, etc.), medication, or anything else you feel is pertinent. 18 Your comments will be saved with the measurement. The comment will appear on the Measurement Table, and on the Trend window when the cursor is placed on the measurement. Once you have saved a number of measurements, you are ready to begin using software features such as the Trend Display and the Statistical Analysis. GUIDELINES FOR BLOOD PRESSURE MEASUREMENT Position the Patient Correctly Gravity and body position both affect blood pressure. Standard measurement protocols suggest that: • The patient should be seated comfortably and relaxed for 5-10 minutes before taking measurements. The idea is to get a measurement that is most representative of the patient’s "resting" blood pressure. By sitting, the patient is more relaxed, and movement can be kept to a minimum. • Both feet should be flat on the floor with the legs uncrossed. • The upper arm should be resting at the level of the heart. Keeping the arm at heart level minimizes the gravitational effect on blood pressure as the blood travels from the heart to the arm. 19 Measurements may also be taken in the standing position with the arm elevated and rested at heart level. Use the Correct Cuff Cuffs come in three sizes: Small, medium, and large. Before taking a measurement, determine the correct cuff size for the patient. American Heart Association (AHA) guidelines recommend that the rubber bladder inside the cuff should encircle 80% of the arm in adults and 100% of the arm in children less than 13 years of age. Correct Cuff for Various Arm Circumferences (Measured in Inches at the Bicep) Small cuff for children and small adults 7” to 10.5” Standard (medium) cuff for adults 10” to 13.75” Large cuff for adults 13” to 18.5” If you cannot decide between the cuffs, use the medium cuff. To setup cuff size, click on Cuff Size from the Measure menu. 20 PATIENT LIST The Patient List is the first screen to appear when you open the DynaPulse Pathway program. It normally remains open in the background when other screens are open, but you can use the Tile function to view it while other screens are open or reduce it to an icon at the bottom of the screen. 21 III. BASIC OPERATION Measurement Result Trending and Statistical Analysis Managing the Displays Printing MEASUREMENT RESULT Blood Pressure Estimation The DynaPulse Pathway can estimate either systolic (SBP) or diastolic (DBP) blood pressure values from accurate measurements of Mean Blood Pressure (MAP) and either SBP or DBP. An asterisk after the blood pressure indicates estimated value. Although these measurements can be useful, they are not as reliable as a direct measurement without estimation. Systolic Estimation An asterisk indicates estimated value. 22 Diastolic Estimation The arterial waveform display will be skewed to one side when estimation occurs. Systolic estimation is to the left, and right for diastolic estimation. The pressure icon may not be present for the estimated value. Estimation occurs when the normal resting pressures of the patient are outside of what is set for the high/low range of the DynaPulse software. 23 Measurement Display The Arterial Waveform Cursor The arterial waveform represents the pressure signal produced by the interaction between the restrictive cuff and the pressures generated by the cardiac cycle. A pressure sensor in the DynaPulse unit measures this signal at the brachial artery. There are two scales for the arterial waveform. The bottom scale is cuff pressure in mmHg. The upper scale measures time in seconds. The amplitude (height of each individual spike or pulse) indicates the arterial pressure of a particular pulse relative to the cuff pressure and blood flow. Each spike is equivalent to a heart beat. The box at the extreme right of the waveform displays the cuff pressure at the current cursor position to give you an idea of the pressures related to that waveform and at that time during the blood pressure measurement. Starting from the left, blood flow is restricted by the cuff. As cuff pressure falls, the blood’s counter pressure is detected at the edge of the cuff and displayed as a rise in amplitude. As 24 the cuff pressure declines, renewed blood flow allows each pulse to strike the entire width of the cuff, causing the pulse amplitude to increase until it reaches its maximum height on the waveform. Beyond that point the amplitude declines. Pressure icons (markers located below the pressure waveform) indicate the points where the cuff pressure equaled the patient's systolic, mean, and diastolic blood pressures. The point where blood flow is initially detected is noted by the left-most pointer and referred to as systolic blood pressure (SPB). The period of maximum amplitude, noted by the middle pointer, is called mean arterial pressure (MAP). The third pointer indicates the diastolic blood pressure (DBP) point. Note that the systolic and diastolic points in the Pulse display (Figure 1 and Figure 2) refer, respectively, to the top and bottom of the wave. The DynaPulse measurement process relies on pattern recognition to detect changes in the shape of the pressure wave as it moves from systolic to diastolic pressure. It is not dependent on the pulse amplitude, or strength. The Arterial Pulse Display The Arterial Pulse Display is the smaller graph at the top left corner of the Measurement Display. It shows a magnified single heartbeat marked by the cursor in the waveform below. As you move the cursor from one heartbeat to the next, the Arterial Pulse Display changes to show the heartbeat to the left of the cursor position. The pressure wave shown in this display corresponds to the heartbeat marked by the cursor on the arterial waveform. The pulse wave is displayed in units of mmHg and onehundredths of a second. You can identify the systolic (SBP) and diastolic (DBP) points of individual heartbeats, as well as specific cardiovascular events such as pressures corresponding to the opening and closing of the aortic valve. This display is often used for educational purposes. 25 Systolic Point Diastolic point Millimeters of Mercury (mmHg.) .01 second intervals Aortic Valve Opens Aortic Valve closes Figure 1 Accuracy Validation and Irregular Heartbeats The arterial pressure waveform can be used for validating measurement accuracy and detecting irregular heartbeats. Features of the waveform that are used for accuracy validation are: • Waveform Quality • Pressure Icon Position Waveform Quality Examine the characteristic shape of the arterial waveform. Figure 2 An ideal waveform has the following characteristics. • • • 26 The waveform is 20-30 seconds in length. The waveform is symmetrical and has a waxing and waning pattern. Pressure limits are set correctly • No motion artifact is present • Arrhythmias are minimal Any disruption of the pressure wave caused by irregular heartbeats or by patient movement (arm movement, talking, coughing, etc.) can potentially compromise the accuracy of the measurement. These disruptions in the pressure wave are typically referred to as "artifact." In a normal waveform display, the heartbeats will occur at regular intervals and will have uniform width and shape. Poor quality measurements often have jagged and unevenly spaced heartbeats. Pressure Icon Position The position of the pressure icons relative to the position of the artifact will indicate whether the measurement has been compromised. If an irregularity in the pulse waveform occurs close to one of the blood pressure icons or if there is significant patient movement at one of the blood pressure indicators, you may have a poor quality measurement. As you use the DynaPulse, you will notice that individual patients will display characteristic waveform patterns. Some patients will have a shorter, fatter waveform, some a thinner, more elongated waveform. Some waveforms will have a high amplitude, some a low amplitude with differences in the air release time. Waveform patterns may vary due to various physiological differences, specifically in the composition of patient arms. For example, an individual with a muscular arm has little in the way of fat tissue to impede the pressure signal acquired by the DynaPulse. An obese arm has significant amounts of fat tissue, which will tend to damp the pressure signal. These physiological differences will be reflected in the appearance of the pressure waveform. 27 Let us assume that you keep the air release time within the normal limits of 20-30 seconds, then measurements should be always obtainable; assuming no movement artifacts are introduced. What happens if your measurements are taken with air release times outside this range? Shorter air release times produce individual heartbeats that are spread farther apart. With a longer release time, heartbeats will be close together. This holds true for heart rate as well. With a slow heart rate, the heartbeats will be spread farther apart. With a fast heart rate, the heartbeats will be closer together. With practice, you can become familiar with how a good measurement should appear. You will discover how the differences in air release rate will cause differences in the appearance of the DynaPulse pressure waveform. The following waveform examples illustrate how pressure waveforms might differ from one patient to the next. In this example, blood pressure measurements were taken on the same individual. Even with the blood pressures and heart rate being similar, the difference in air release time caused the waveforms to appear quite different. Retrieving the Measurement Display Measurement data can be quickly recalled from the Trend screen by either double-clicking on the cursor at the 28 measurement point or choosing the measurement and pressing the Enter key. You can also retrieve a Measurement Display by selecting the measurement and choosing Measurement from the Trend menu. 29 TRENDING AND STATISTICAL ANALYSIS The Trend window Disease management requires that the patient be managed over the lifetime of the disease state. With hypertension, this often requires blood pressure information to be accumulated and analyzed over the remaining lifetime of a patient. DynaPulse trending allows you to save the patient's blood pressure information in an attractive, graphical format. Line graphs of the blood pressure and pulse measurements will indicate in an intuitive manner the patient's response to the treatment regimen. Measurement results at cursor position Blood pressure in mmHg Guidelines of BP Threshold (140/90) Heart rate in Measurement comment beats per minute at cursor position Isolated measurements have a limited benefit. However, a series of measurements over time fulfills the purpose of 30 blood pressure monitoring by providing you with a representative average of your patient's blood pressure. Your DynaPulse Pathway allows you to track an unlimited number of patients in this manner. When you activate a patient from the Patient List, the Trend Display will appear. You can access the Trend feature by clicking on Options and Show Trend Window. Statistical Analysis DynaPulse software offers a built-in statistical analysis feature that provides a complete statistical report including maximum, minimum, average, and standard deviation for each of the measured parameters and a histogram showing the measurement distributions. The Statistics feature may be used to compare the analysis data from before and after changes in therapy. A concise report can be printed that gives an excellent overall view of the patient's condition. You can run a statistical analysis on all measurements recorded for the individual patient or on a series of measurements selected by date and time. The date and time indicator for each measurement is bolded on the upper right corner of the Trend window. Note the current date and time are in the top right hand area of the DynaPulse Pathway screen. To select a specific series of measurements for statistics: 1. Press and hold your left mouse button on the first measurement and drag to the last measurement. If you do not select a series of measurements, the default is an analysis of all of the individual patient's data. 31 2. 3. Select Trend, then Statistics. Select any combination of the blood pressure measurement parameters you would like displayed, and they will be plotted on a histogram. Pulse rate can be plotted independently. Number of samples of a particular value occurring in distribution Number and date range of measurements Click to select measurement parameters you want displayed 32 Systolic, diastolic, and mean blood pressure distributions Analysis results for selected measurement data. Scale in mmHg The average value is the arithmetic average of the analyzed measurements. The standard deviation is a range around the average value within which 67% of the measurements will fall. The larger the standard deviation, the wider the range. This is visually represented by the histograms. Editing the Trend Display to Validate Results When reviewing measurement data, you can remove suspect measurements from the Trend by selecting the measurement on the Trend Graph and choosing Mask from the Trend menu. The Mask dialog box appears. It allows you to "mask" the suspect measurement so it is ignored by the Trend and Statistics features. Click on Mask measurement at cursor to mask the measurement. The Mask feature is a validation tool that allows you to obtain data that is more representative of your patient's condition. The measurement is not deleted. The measurement still appears in the Measurement Table, and may be distinguished from unmasked measurements by the presence of “ERR” for each column. Although the measurement points disappear from the Trend, you can still scroll to the measurement location and retrieve the arterial waveform. 33 When a masked measurement is highlighted on the Trend, measurement values will appear as "ERR". Masked measurements also appear as ERR in the Measurement Table. Measurements should not be "masked" without due cause. Masking decreases the amount of data available for statistics. A pressure waveform does not have to be perfect to yield clinically sound data. To ensure that all the data is evaluated uniformly, we suggest that you create your own criteria for masking a measurement. The measurement may be "unmasked" at any time. 34 1. Move the cursor to the masked measurement on the trend screen. 2. Select Trend and Mask to open the Mask dialog box (shown above). 3. Select Unmask measurement at cursor to unmask the measurement. MANAGING THE DISPLAYS Cascade and Tile The DynaPulse Pathway allows you to display multiple measurements on the screen. This feature is useful if you wish to compare data from different measurements. Features like the Cascade and Tile options (accessed from the Window menu) help organize open windows. Selecting the Tile option produces a display as seen below. 35 Choosing the Cascade option causes each window to overlap so only title bars are visible. The Window menu also lists the open displays. Choosing any listed display from the screen or menu list brings that display to the foreground. Arrange Icons and Close All windows You may also "clean up" the display screen and still have several measurements available for your review by using the Arrange Icons option from the Window menu. Any Measurement, Trend, Measurement Table, or Patient List may be minimized and arranged by selecting this feature. 36 Choosing the Close All option will clear off all measurement screens and reduce the Patient List and Trend windows (if open) to icons. The icons will indicate the time and date of the measurement associated with the icon. PRINTING Print Header Set-up and Print with Report You can customize your reports to display a stored header. Unless you wish to change the header, you need to enter it only once. Click on File. You will notice that there is a Print command and a Print with Report command. The Print command prints the active DynaPulse screen with the customized header on top. The Print with Report feature gives you the header, active screen, and last few measurements from the Measurement Table. Measurement, Trend, and Measurement Table displays may be printed by selecting File and then Print. Remember that only the current selected display is printed. For example, if several selections are on the screen at the same time, only the highlighted screen is printed. This is also true for selections arranged using the Cascade or Tile feature. Print quality is directly related to the printer used and the printer driver selected. 37 IV. ADVANCED OPERATIONS BP Mode Move to a New Directory Guest Mode Backup/Archive/Restore The Measurement Table Pathway Unit Control Export Data Patient Profile Automeasure (Cycle) DynaPulse Analysis Center The Tool Window BLOOD PRESSURE (BP) MODE For convenience of physicians, DynaPulse Pathway also provides auscultatory equivalent blood pressure readings K1 and K4, in addition to the central end blood pressure. To understand the difference between the two methods, please refer to the Introduction (see pages 4-5). The default BP Mode is set to Auscultatory eq. BP Mode. The DynaPulse Pathway provides you the option of switching from Auscultatory eq. BP to Central End BP. To switch to Central End BP Mode, click on BP Mode from the Options menu. Then choose Central End BP. If you would like to switch back to Auscultatory eq. BP, follow the instructions above and make sure that “Auscultatory eq. BP” is checked. If you switch from one BP mode to the other, all windows with blood pressure information will be changed accordingly. These windows include the Trend window, Measurement window, Statistics, Measurement Table, etc. 38 Note: DynaPulse will automatically save the BP Mode setting that you choose. GUEST MODE Guest Mode allows you to take a patient’s blood pressure measurement(s) without having to add a patient. Note: You will not be able to save measurements that are taken in Guest mode. To switch to Guest mode, click on Guest from the Patient menu. Notice that the Activated Patient now says: “Guest”. THE MEASUREMENT TABLE The Measurement Table lets you view trend data such as systolic and diastolic blood pressures in tabular form. Use the following procedure to open a patient’s Measurement Table. 1. Activate a patient on the patient list by doubleclicking on the name of the patient. 2. Select Measurement Table from the Trend menu. This will display the dialog shown below. 39 The Measurement Table also allows you to add/edit comments. You can use the mouse to move the cursor to the comment box of each measurement and edit the comment. Press the ENTER key to confirm the changes. Using the Edit menu, you may cut or copy comments into other Window applications. When measurement data is saved, the systolic, mean arterial and diastolic pressures along with heart rate are automatically entered into the Measurement Table. Any comments you add in the text boxes will be displayed with the measurement data. Choosing the Print option from the File menu allows you to print either the entire Measurement Table or the current page. 40 EXPORT DATA IN ASCII FORMAT This feature allows you to copy the measurement table into an external spreadsheet program to produce your own graphs. To use this feature activate the patient whose data you want, choose Export/Save as ASCII from the Trend menu. Deselect the "Include comment" box if you wish. Additionally, you can choose to use all of the measurements or just a portion of them. To select the last few measurements you need to click on Last and then type in the number of measurements that you wish to use. When you click on OK, you will be asked how you want to store this new data text file. Suggestion: Save the file directly to the spreadsheet file folder, and name it as simply as possible. The next step is to open your spreadsheet program and open the file that you just saved. You will find that the DynaPulse has given you the Date, Time, Systolic, Diastolic, Mean Pressure, Heart Rate, and Comments (if selected). 41 AUTOMEASURE (CYCLE) The DynaPulse Pathway software has a continuous interval monitoring feature that allows the DynaPulse Pathway unit to take a fixed number of measurements at set intervals. To enable the cycle function, click Cycle on the Measure menu. When Automeasure (Cycle) is turned on, any measurements after the first measurement will be taken automatically. To turn off Cycle, click the Cycle option again. When you use the cycling (automeasure) function, you should set the Time between measurements and the Number of measurements per cycle. Select Setting from the Measure menu to open the dialog to the right. Enter your desired time between measurements and the number of measurements per cycle in the text boxes. The Measurement window can be automatically closed if you check the box for Close window after auto-save. When you finish, select OK. If the Cycle function (automeasure) on the Measure menu is checked (turned on), all measurement results will be autosaved. Follow the normal procedures for taking the patient’s pulse, as described in the section Getting Started with the DynaPulse Pathway, but have the patient remain seated with the arm band in place until the cycle completes and all the measurements have been taken. 42 THE TOOL WINDOW Selecting Show Tool Window from the Options menu is a convenient way to operate the DynaPulse system. The Tool window contains controls that you use the most. Once selected, the Tool window will remain in the display area for easy access. You may remove the Tools window by clicking the button marked X at the upper right corner of the Tool Window. Activate a patient Starts the measurement sequence Stores patient measurement data Displays the trend window Displays the measurement table Prints the current selected display Quits the DynaPulse program 43 MANAGE YOUR PATIENT DATA INTO DIFFERENT DIRECTORIES When your patient list grows larger, sometimes it is better to arrange your patients in different directories such as gender. The DynaPulse Pathway provides you with a function (Move to New Directory) that will help you to achieve this goal. Patient – Move to New Directory Start the move to new directory function by selecting the patient(s) that you would like to move. If you want to move all of the patients, use the Select All feature in the Patient menu. Choose Move to New Directory from the Patient menu. The screen to the right appears asking where you want the data to be moved. You can select an existing directory or create a new one. 44 BACKUP, ARCHIVE, AND RESTORE PATIENT DATA The DynaPulse Pathway software provides utilities to help you protect patient data files from accidental loss due to hardware or storage media failure. In general, never move Pathway data files by software other than Pathway software features provided in menu item Patient. Pathway data files must be either 1) created within Pathway by adding Patients, taking measurements, and editing Patient's profile, or 2) "Restored” to active use by Pathway from folders currently not used within Pathway. Data files "Restored" to active use by Pathway may have in the past been 1) "Archived" (using Pathway software) to folders for safe keeping and deleted from use by Pathway, 2) "Backed up" (using Pathway software) to folders for safe keeping and still in use by Pathway, or 3) with caution, files that have been "copied" to other folders or media using non-Pathway software such as Windows Explorer or some Backup facility. Never use non-Pathway software such as Windows Explorer or some Backup/Restore facility to move or copy data files directly into currently used Pathway data file folders. You must first move or copy the data files to a folder not currently in use by Pathway and then use Pathway's Restore feature. 45 Patient – Backup/Archive Backup makes a copy of the selected patient data files to a secondary storage such as a diskette or another directory. Archive will move the selected patient data files to secondary storage and remove the selected patient(s) from the Patient List. To backup/archive patient data files, first select patient(s) which you want to backup from the patient list. Choose Backup/Archive from the Patient menu. 46 The screen to the right appears asking where you want the data to be copied/archived. You can select an existing directory or create a new directory under the current destination directory by typing the new directory name in the text box. Check the Delete selected patient(s) box if you want to archive patient(s) (remove the selected patient(s)) to secondary storage. Note: Do not backup/archive patient data files to the root directory; use a directory similar to C:\dpbackup or on a floppy disk A:\dpbackup. Patient – Restore The restore function restores patient(s) from secondary storage to the Patient List; this operation will not influence the original copy of your patient data files in secondary storage. Note: The DynaPulse Pathway identifies patients by ID. 47 To restore backup/archived data, choose Restore from the Patient menu. The Restore dialog (shown to the right) will appear on your screen. Select the directory path with the backup/archived patient data files. The next screen (shown below) will tell you how many patients are in that directory path. Uncheck the “Restore patient(s) to..” box if you want to leave the data in the backup/archived directory. If you want to transfer particular patient(s), click the second box to be prompted for each patient. Note: If you want to restore patient(s) from backup spanned among multiple floppy disks, you must first copy all the floppy disks to one directory in your hard drive. Then restore from that directory. 48 CONTROL VIA THE DYNAPULSE PATHWAY UNIT Using the Buttons On the DynaPulse Pathway Unit Four buttons are located on the DynaPulse Pathway unit. They have the following functions: ON/OFF ( ) – turns the DynaPulse Pathway unit on or off START/STOP ( / ) – starts taking a measurement Up arrow ()– scrolls up the patient list Down arrow ()– scrolls down the patient list Use these buttons before taking measurements. During a measurement, pushing / , , or aborts the measurement and displays an "Abort by user" message on the DynaPulse unit LCD screen. If the button is pushed while taking a measurement, the DynaPulse Pathway unit turns off, and a "Communication Error" message pops up. After you take a measurement, the DynaPulse Pathway unit LCD screen displays the measurement result. If the measurement is not successful, it displays warning or messages. You can scroll through the warning/error message by pushing any of the buttons other than the button. After you have advanced to the patient name/ID screen, you are ready to take another measurement. To take another measurement, push the / button. Comparing DynaPulse Pathway Unit Buttons to Mouse and Keyboard Error and Warning Message Displays If you start a measurement using the mouse and keyboard, all error and warning messages will be displayed on both 49 the LCD screen and the computer monitor. If a measurement is taken using the START/STOP button, all error and warning messages will appear only on the LCD screen except for the “Safety Time-out Check PC Message.” Saving the Measurement Result The procedure for saving a measurement can change depending on whether the measurement was initiated from the DynaPulse Pathway unit or the mouse and keyboard. The following chart describes the differences: Initiate from DP Unit Successful measurement Auto save.1 Mouse or keyboard Always prompt2 to save Unsuccessful measurement Auto discard, no further prompt If waveform is displayed, user is prompted2 to save PATIENT PROFILE The Patient Profile dialog allows you to view or edit personal information for an activated patient. This dialog has sections for entering or viewing such information as patient name, birth date, weight, height, etc. Use the following procedure to open and use the Patient Profile dialog for a patient. 1 2 1. Activate a patient on the patient list by doubleclicking on the name of the patient. 2. Select Edit Profile from the Patient menu. This will display the dialog shown below. If you need to enter a comment, use the Measurement Table Prompt comes up when another patient is activated or when another measurement is initiated from either the mouse and keyboard or the DP unit. 50 3. Verify or edit information for each field. Select OK to save updated patient information before you exit the dialog. Note: Patient Profile needs to be completed for DAC upload. DYNAPULSE ANALYSIS CENTER (DAC) DAC stands for DynaPulse Analysis Center, a Pulse Metric website for hemodynamic analysis based on the measured waveform. Access to the DAC website is available by subscription only. If you have a DAC subscription, use the following procedure to use the DAC analysis service. Access the DAC Service Select Analysis from the DAC menu. The Login screen will appear. 51 Select a host name, cDAC, eDAC or one explicitly provided by Pulse Metric, Inc. Enter your username and password. Then click the Login button. Your local patient list will appear. The registered column in the Patient List shows if the patient has been previously registered on the DAC server. 52 Register Patient To register patient(s) on the DAC, select patient(s) and click on the Profile button. A Patient Profile window will appear as shown below. The Patient Profile screen will display your local patient profile if you have never registered the patient. Otherwise, the Patient Profile screen will display your patient profile from the DAC server. Verify or edit information for each field. Then click the Update Local button to update the patient(s) profile on your hard drive. Next, click on Update Server to update the patient(s) profile on the DAC server; this will also register the patient on the DAC server. Hit the close button to exit the patient profile screen. 53 Note: You will only be able to upload data for registered patients. Measurement Data Upload Select the registered patient(s) for upload and click on the Upload Data button on the DAC patient list. Your patient(s) data should now be uploaded to the DAC server. To view uploaded patient(s) reports, see your DAC Manual. 54 V. OPERATION REFERENCES THE MAIN MENU Save measurement result (pg. 17) Prints the active window (pg. 36) Print the current page of the measurement table (pg. 36) Print with a report (pg. 36) Set personalized header for report (pg. 36) Exit the program Cancel the previous edit operation Remove to buffer Copy to buffer Recall from buffer Erase selected text 55 Activates a patient (pg.14) Enter guest mode (pg. 38) Find a patient by ID Sort patient list by patient ID or name Add a new patient to the patient list (pg.12) Edit an activated patient profile (pg. 49) Remove a patient from the patient list Select all listed patients (pg. 43) Set the default directory for patient data files Move selected patient data to another directory (pg. 43) Backup selected patient data files (pg. 45) Restore patients to the patient list (pg. 46) Begin measuring using current settings (pg. 14) Turn on cycle function (pg. 41) Set the cycle parameters (pg. 41) Set high range (pg. 58) Set low range (pg. 58) Select cuff size for patient (pg. 19) Toggle the display of specific pressure at selected point in the pulse cycle (pgs. 25-26) Retrieves measurement display (pg. 27) Mask measurement (32) Displays table of BP measurements (pg. 38) Export and save trend data to a text file (pg. 40) Run trend statistical analysis (pg. 30) Login to the DynaPulse analysis center (pg. 50) Open Internet Explorer Open Netscape 56 Select a BP Mode (pg. 37) Select a COM port (pg. 59) Check COM ports to find the Pathway device (pg. 58) Display/hide the Trend window (pg. 29) Display/hide the Tool window (pg. 42) Overlap all open windows (pg. 34) Fit all open windows on screen (pg. 34) Arrange displayed icons (pg. 35) Close all open windows (pg. 35) List of active windows On-Line help DynaPulse Pathway Software Version 57 VI. TROUBLESHOOTING Most errors occur during measurements early on when the patient is unfamiliar with the DynaPulse or the first time a measurement is taken for a new patient. The following information should help you solve most problems. To get help for recurring errors or problems that refuse to go away, please check the online help section titled “Troubleshooting”. Communication Error This message indicates the DynaPulse software was not able to keep the communication channel open between the DynaPulse Pathway unit and your computer. If you have a communication problem, you will not be able to take a measurement. You will receive this error before you get a chance to inflate the cuff. It is usually caused by improper serial port configuration. If you have taken measurements before with the current system settings and are now receiving this error, install a fresh set of batteries or check the DC adapter connection and try again. If you are using the DynaPulse for the first time, run Com Check from the Options menu. This utility will check your system to determine which COM port is connected to your DynaPulse Pathway unit. On-screen instructions will show you how to proceed. 58 If you know the COM port used by the DynaPulse Pathway unit, choose Com Port from the Options menu and select the appropriate port. If the port settings are correct, make sure the cables are connected properly. You will also get a communication error if the batteries are dead, improperly installed, or if the DC adapter is connected improperly. If everything checks out, the communications cable connecting the DynaPulse Pathway unit to your PC may be faulty or your system may have a unique configuration. Please check both the DynaPulse Installation/Communication Guide and DynaPulse Pathway FAQs. High or Low Measuring Range Not Set Correctly If the cuff was not inflated above the patient's systolic pressure, you will get the message "Increase High Measuring Range." Likewise, if the cuff did not inflate below diastolic, you will get the message "Decrease Low Measuring Range." If this occurs, you will need to adjust the appropriate range from the Measure menu. Click on either High Range or Low Range. Default ranges are 160mmHg for High Range, and 50mmHg for Low Range. 59 To adjust the range, click on a different value. Once you adjust the range for a particular patient, the information is stored in the patient file and will remain at the adjusted values for that patient. In this example, the system does not have enough high range information to correctly determine the blood pressure. Increasing the high range will center the waveform, providing a correct blood pressure measurement. In this example, the system does not have enough low range information to correctly determine the blood pressure. Decreasing the low range will center the waveform, providing a correct blood pressure measurement. Excessive Patient Movement Like other blood pressure devices, the DynaPulse Pathway unit is sensitive to motion. Although the DynaPulse Pathway uses signal conditioning and artifact rejection algorithms, if the patient moves or talks during the measurement, the DynaPulse may not be able to determine the correct blood pressure. Have the patient avoid moving and talking while taking the measurement. Air Release Not Set Correctly If you receive an error message "air release too fast", check for cuff leaks or hose and connector leaks. As the device is 60 inflating the cuff during measurement, there should be no hissing sounds until the air is released. If the cuff connection is good, check the release valve setting. The release valve is the wheel dial located on the right side of the DynaPulse Pathway unit labeled with up and down arrows. The air release setting should be around 20 to 30 seconds using the default pressure range settings of 160mmHg to 50mmHg. In other words, the measurement period should last about 25 seconds before the device is set to release. To slow the air release and increase the length of the measurement period, turn the release valve dial towards up arrow. To decrease the measurement time, turn the dial towards the down arrow for a faster release time. If the pumping action takes longer than 55 seconds, you will receive a “safety-time out” error message. In that case, you may need to increase the air release rate (which decreases air release time). Measurement Error The most common reason for this type of error is excessive cuff movement. Excessive arm or cuff movement can cause pressure changes on the cuff and faulty blood pressure readings. The unit interprets the movement as part of a heartbeat pressure wave and cannot correctly determine the blood pressure. For the best results, rest the patient’s arm on a table or similar surface, keeping the cuff and hose free from obstructions that might cause the air pressure to change unexpectedly. The pressure cuff is normally placed on the left arm on the same side as the heart. 61 VII. APPENDICES CHECKING CALIBRATION To check the calibration of the DynaPulse Pathway unit in reference to a standard sphygmomanometer, you will need to connect a sphygmomanometer (recommend vertical mercury type) T - connector with the Pathway and the cuff. Wrap the cuff loosely around a bottle that approximates an arm size (non-crushable). Before you continue, be aware that you should not open the Pathway to adjust the calibration of the unit or you will void all warranty. Also, only perform this procedure if you think the Pathway is off by more than +/- 3mmHg. Steps to check calibration: 1. Once sphygmomanometer is connected in line with the Pathway and cuff, run the DynaPulse software. 2. Go to Measure and set the high range to 220mmHg and leave the low range at default of 50mmHg. 62 3. Set the top of the speed knob on the Pathway to ↑. This is the slowest bleed rate possible. 4. Go to Measure and Start. Select three measurement points such as 200, 160, 80 mmHg to compare the sphygmomanometer with what you see on screen. 5. Once the measurement begins, record the values you get from the sphygmomanometer and the computer screen as the air slowly leaks from the system. 6. If there is greater than +/- 3 mmHg difference between the values, contact Pulse Metric to schedule a calibration of your Pathway. Again, do not try to calibrate the Pathway yourself. 63 COM PORT CONFIGURATION: WINDOWS 98/ME/NT/2000/XP For technical problems with the COM port configuration, please refer first to the online help section titled “Troubleshooting”. If you still have problems, call Technical Support at 842-8224, or E-mail [email protected] 64 (760) DYNAPULSE PATHWAY AND MULTIMEDIA The DynaPulse Pathway software incorporates a unique switchless design which allows the unit to turn itself on and off via the operating software. Multitasking capabilities may not be utilized when running the DynaPulse Pathway in a Windows environment. The substitution of .MOD, .WAV, or any other type of sound playback file for a standard system sound may cause the DynaPulse Pathway to terminate operation. To ensure that no .WAV files are in use, do the following: 1. From the Program Manager, open Main. 2. From Main, open the Control Panel and choose the Sound icon. 3. There are two dialogue boxes, one titled "Events" and the other "Files". From the Events list highlight "System Default" (sometimes called "System Default Beep"). 4. Look in the Files dialogue box and confirm that the file highlighted is "none". If it is not, select "none" from the files list and click OK. If you are using a third-party sound event organizer, please refer to the program documentation that came with the software. 65 SPECIFICATIONS Measurement accuracy: ± 2 mmHg. or ± 2% whichever is greater. Measurement Range: Blood pressure- 20 to 300 mmHg. Pulse- 30 to 200 bpm. Deflation method: Air release valve Inflation method: automatic Power Consumption: 60mW when measuring Operating temperature: 0°C to 45°C (32°F to 113°F) Power Supply: Four (4) 1.5 Volts AA batteries or DC adapter 66 WARRANTY INFORMATION Pulse Metric, Inc. warrants that the DynaPulse Pathway system unit will be free from defects in workmanship and materials for a period of one year from the date of purchase. This one year warranty extends only to the original purchaser. All other accessories (pressure cuff, communications cable, etc.) will be warranted for 90 days. Pulse Metric, Inc. will repair or replace at its option any defective parts or product when shipped to the initial purchaser. This limited warranty DOES NOT cover damages or losses due to: improper environment, temperature extremes, or other misuse or negligence such as adjustment or repair by personnel not authorized by Pulse Metric, Inc., improper installation, failure to follow the installation instructions, or shipment to or from the distributor or customer. Pulse Metric, Inc.’s liability shall not exceed the price of the defective product itself, which is the basis of the claim. Tampering with the unit voids this warranty. In no event shall Pulse Metric, Inc. be liable for any loss of profits, loss of use of facilities, loss of other equipment, or any incidental or consequential damages, even if Pulse Metric, Inc. has been advised of the possibility of such damages. Some states do not allow the exclusion or limitation of incidental or consequential damages, or allow limitations on how long an implied warranty lasts, so the above limitations or exclusion may not apply to you. This warranty gives you specific legal rights, and you may have other rights, which vary from state to state. Technical Support and Service: Phone: (760) 842-8224 Fax: (760) 758-9425 E-mail: [email protected] Technical support representatives are available between 10:00 a.m. to 4:00 p.m. Pacific Time, Monday through Friday. 67 All products returned to Pulse Metric, Inc. must be accompanied by a Return Material Authorization (RMA) Number and the original (or a copy) of the dated sales slip as proof of warranty. An RMA Number can be obtained by calling Technical Support at (760) 842-8224. Packages sent without an RMA Number marked on the outside of the shipping container will be refused. Please also include a letter with your name, address, telephone number, and brief description of the problem(s). 68 SOFTWARE LICENSING AGREEMENT This is a legal Agreement between you (the end user, being either an individual, or legal entity such as a corporation), and Pulse Metric, Inc. (PMI). By clicking the "Accept" button that appears after you see this Agreement when you install your software, you are agreeing to be bound by the terms of this software agreement. If you do not agree to the terms of this Agreement, immediately remove all traces of the PMI software product from your computer and disk archives and promptly return the disk package and the accompanying items (manuals, DynaPulse unit, and all accessories) to the place you obtained them for a full refund. Part I - Grant of License PMI grants you the right to use one copy of the enclosed DynaPulse software program (SOFTWARE) on a single computer at a time. You may not rent or lease the SOFTWARE, but you may transfer the SOFTWARE and accompanying written material provided you do not retain copies and the recipient agrees to the term of this Agreement. You may not reverse engineer, recompile, or disassemble the SOFTWARE. The agreement is effective from the day you open the sealed package until terminated. You may terminate this Agreement by returning to PMI the original disks and any backup copies. If you breach this Agreement, PMI can terminate this license upon written notification to you. Part II - Copyright The SOFTWARE is owned by PMI and is protected by United States copyright laws and international treaty provisions. Therefore, you must treat the SOFTWARE like any other copyrighted material except that you may either: 69 (a) make one copy of the SOFTWARE solely for backup or archival purposes -or(b) transfer the SOFTWARE to a single hard disk provided you keep the original solely for backup purposes. You may not copy the written material accompanying the SOFTWARE. Part III - Controlling Law This Agreement shall be governed by and construed in accordance with the laws of the State of California. 70 COMPANY INFORMATION Pulse Metric, Inc. (PMI) was incorporated in 1990 to develop and market instrumentation and software for the diagnosis and management of hypertension, and to develop technology and instrumentation for arterial pressure and waveform analysis. PMI’s non-invasive blood pressure waveform technology, Pulse Dynamics, is patented in the United States and worldwide. Several different DynaPulse products are available including systems for clinical hypertension management, home blood pressure monitoring, and ambulatory monitoring. If you have any questions or require additional information, you can reach us between 10:00AM and 4:00PM Pacific Time. Address: Pulse Metric, Inc. 2100 Hawley Drive Vista, CA 92084 U.S.A. Order Lines: Phone: Fax: Web order: Facsimile: (760) 758-9425 Web Site: http://www.dynapulse.com (760) 842-8278 (760) 758-9425 [email protected] or [email protected] Technical Support: Voice: (760) 842-8224 E-Mail: [email protected] 71