1
Real-Time Wireless Data Streaming in a PDA-Based
Geographic Information System
By
Russell Lee Spieler
BS. Civil Engineering
Massachusetts Institute of Technology, 2001
SUBMITTED TO THE DEPARTMENT OF
CIVIL AND ENVIRONMENTAL ENGINEERING
IN PARTIAL FULFILLMENT OF THE REQUIREMENTS FOR THE DEGREE OF
MASTER OF ENGINEERING IN INFORMATION TECHNOLOGY
AT THE
MASSACHUSETTS INSTITUTE OF TECHNOLOGY
JUNE 2002
©2002 Massachusetts Institute of Technology
All rights reserved
....-...........................-.......
Department of Civil and Environmental Engineering
May 9, 2002
Signature of A uthc
Certified by............................................................
Ismail Chabini
Pr essor of Civil and Environmental Engineering
Thesis Supervisor
Accepted by ................................-
.-----
_
_--.
Accepted------
bOral Buyukozturk
Professor of Civil and Environmental Engineering
Chairmen, Departmental Committee on Graduate Studies
MASSACHUSETTS INSTITUTE
OF TECHNOLOGY
JUN
3 2002
LIBRARIES
Real-Time Wireless Data Streaming in a PDA-Based
Geographic Information System
By
Russell Lee Spieler
Submitted to the Department of Civil and Environmental Engineering
On May 10, 2002 in partial fulfillment of the requirements
for the Degree of Master of Engineering in
Information Technology
ABSTRACT
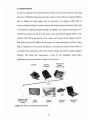
A geographic information system for mobile data collection and wireless data distribution system
was designed, developed, tested, and analyzed. The system allows field researchers to collect
environmental data automatically from instruments and manually into a handheld computer. The
system integrates this environmental data with geospatial data collected by an integrated GPS
receiver. The data collected by this system is distributed wirelessly to a central location for realtime data sharing and access among users of the system, who may be at different geographic
locations. The data is also distributed wirelessly to sponsors and the world via the Internet.
Field testing of this system as an environmental data collection tool lead to revisions and
improvements. The system was compared to similar systems available in the market place. An
analysis of this system's applications in fields other than environmental research was completed.
Thesis Supervisor: Ismail Chabini
Title: Professor of Civil and Environmental Engineering
Table of Contents
B iographical N ote...........................................................................................
5
List of Tables................................................................................................
7
List of Figures..............................................................................................
8
1. INTRODUCTION........................................................................................10
10
Problem atic...............................................................................
1.1.
1.2.
Background on the ENVIT (Environmental Information Technology)
10
Student Group ..............................................................................
Motivation of the STEFS (Software Tools For Environmental Field Studies)
1.3.
.... 11
P roject...................................................................................
Overview of STEFS........................................................................12
1.4.
Organization of STEFS Project Team................................................12
1.5.
1.6.
History of ENVIT and STEFS............................................................13
Overview of Thesis......................................................................13
1.7.
1.8.
More Information........................................................................14
2. WIRELESS
2.1
2.2
2.3
2.4
2.5
2.6
2.7
2.8
2.9
LOCAL AREA NETWORK.............................................................16
Introduction ...............................................................................
M otivation ...................................................................................
A lternatives...............................................................................
Selection..................................................................................
Implementation..........................................................................21
PDA Teams and iRDa Integration.......................................................22
Cambridge Field Test...................................................................24
Newcastle (Australia) Field Test.....................................................26
Enhancem ents..............................................................................28
3. GLOBAL WIRELESS NETWORK.................................................................29
3.1
Introduction...............................................................................29
3.2
M otivation ...................................................................................
A lternatives...............................................................................30
3.3
3.4
Selection ..................................................................................
Implementation..........................................................................32
3.5
3.6
Cambridge Field Test...................................................................33
Newcastle, Australia Field Test.......................................................33
3.7
3
16
17
18
20
29
31
4. DATA COLLECTION, MAINTENANCE, AND DISTRIBUTION ............................. 35
4.1
Introduction...............................................................................
35
4.2
D evelopm ent................................................................................36
4.3
Early Revisions..........................................................................37
4.4
System Integration........................................................................38
4.5
Database Finalization...................................................................38
4.6
Pre-Configuration Through Windows Visual Basic Application.................44
4.7
Data Entry Through PocketPC Embedded Visual Basic Application...............47
4.8
Data Transmission.........................................................................55
4.9
Cambridge Field Test...................................................................58
4.10 Newcastle, Australia Field Test..........................................................58
4 .11
Revision s....................................................................................59
4.12 Integration of Post Processed Data....................................................60
4.13 C onclusions...............................................................................63
5. GEOSPATIAL DATA INTEGRATION...............................................................64
5.1
Introduction ...............................................................................
64
5.2
Teletype GPS............................................................................
65
5.3
E arly D esign.............................................................................
67
5.4
D ata Selection ..............................................................................
69
5.5
Creation of Output Table...............................................................69
5.6
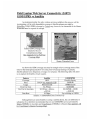
Display through GIS Web Services..................................................
71
5.7
Display through ESRI ArcPad.........................................................72
5.8
Newcastle, Australia Field Test.......................................................73
5.9
Revisions...................................................................................74
5.10 C onclusions...............................................................................75
6. COMPARISON OF STEFS TO SIMILAR SYSTEMS.............................................76
6.1
Introduction ...............................................................................
76
6.2
Benefits of STEFS.........................................................................76
6.3
Costs of Development and Deployment.............................................
77
6.4
C om petition...............................................................................79
6.5
Alternative Uses..........................................................................81
ACKNOWLEDGEMENTS.............................................................................
82
REFERENCES............................................................................................86
G LO SSA RY ................................................................................................
Appendix:
Wireless Funding Proposal...............................................................91
4
88
Biographical Note
As the author of this thesis, I like to provide the reader with information on where I draw my
knowledge for this thesis and on where I may have short comings. As an undergraduate, I studied
civil engineering with an emphasis on systems. As a result I took numerous courses which
explored the use of computers and software in civil engineering projects. I also took a breadth of
courses addressing civil and environmental engineering issues.
I believe that my extensive undergraduate course work in design provided a needed depth to
carry out the work of this thesis. I designed civil systems, urban layouts, mechanical systems,
and computer systems as a regular part of my coursework. I also completed a few courses that
dealt specifically with transportation. This supported my work on adapting the STEFS system to
transportation monitoring, as described in Chapter 9. In addition, I have completed an internship
at Trimble Navigation, where I worked on the design of an automated GPS reporting unit for
trucking logistics. Therefore, I have explored both wireless and GPS technologies prior to the
project documented in this thesis.
Prior to my work on the project described in this thesis, my exposure to PDA's, mobile
computing, wireless systems, databases and GIS (Geographic Information Systems) was limited
to reading "Mobile Computing Magazine," and various articles on the Internet. I learned most of
what I relate in this Thesis during my Masters of Engineering studies and effectively through the
duration of the STEFS project. Therefore, I do not intend to be able to explain the intricacies of
all of the alternatives I explored. Please assume that while the alternatives explored were likely
5
the most popular and readily available at the time of design of this system, they are by no means
an exhaustive list of alternatives.
Please keep in mind that all of this was designed within a relatively constraining project budget
and that all of it was part of a project organized as part of 25 students educations. These two
factors often played a roll in selection of alternatives and design of the system. Finally,
remember that the technologies and prices used in this thesis are rapidly progressing and the
model numbers and prices quotes will probably be out of date even before this thesis is bound.
6
List of Tables
2.1:
Wireless Technologies Features Comparison Chart........................................20
3.1:
Long Range Wireless Technologies Features Comparison Chart............................31
4.1:
Pull Data From Pre-Configured Database.......................................................48
4.2
Fill a Pull Down Menu From Pre-Configured Database.......................................49
4.3:
GPS Automated Entry..............................................................................50
4.4:
Sub-Section Data Entry..........................................................................51
4.5:
Push Data From Updated Tables.................................................................56
6.1:
STEFS Development Costs.....................................................................78
6.2:
STEFS Deployment Costs......................................................................79
6.3:
STEFS Comparison to FDR.....................................................................80
7
List of Figures
1.1:
ST EFS C oncept.....................................................................................11
2.1:
Data Transmission Between Mobile PDAs and Laptop....................................16
2.2:
802.1lb Implementation Diagram................................................................21
2.3:
iRDa Data Entry and Transmission Set-up....................................................23
2.4:
Three-Team 802.1 lb Data Transmission with iRDa Data Entry
and Transmission Set-Up........................................................................23
2.5:
802.1lb and iRDa Data Entry and Wireless Transmission Schema
Courtesy of E. Vivoni, pers. comm., 2002.............................................24
2.6:
Cambridge Field Test Map.....................................................................25
2.7:
Field Van with 802.1 lb Router and Antenna During Cambridge Field Test..............26
2.8:
(a) An 802.1 lb Equipped PocketPC Sending Data.............................................27
(b) The 1100 Square Kilometer Williams River Watershed in Newcastle, Australia
(c) The Roving Field Van Equipped with 802.1 lb Router,
15dB High-Gain Antenna, and 1 Watt Amplifier
3.1:
Data Transmission Between Mobile Laptop and Fixed Web Server......................29
3.2:
GPRS Implementation Diagram................................................................33
4.1:
Entire STEFS Database..........................................................................41
4.2:
User, Location, and Login Tables..............................................................42
4.3:
GPS Record, UI Record, and Instrument Record Tables....................................42
4.4:
GPS ID, Kit Type and Kit ID, and Instrument Type and Instrument ID Tables...... 43
4.5:
Kit Measurement and Instrument Measurement Tables....................................43
4.6:
Calibration Info and Calibration Record Tables.............................................44
4.7:
ENVIT Configurator Main Menu..............................................................46
4.8:
ENVIT Configurator General Project Information Form......................................46
4.9:
ENVIT Configurator Kit Measurement Form...................................................47
8
4.10:
(a) Welcome Screen of ENVITNote..............................................................52
(b) Login Screen of ENVITNote
(c) Equipment ID Screen of ENVITNote
4.11:
(a) Automatic GPS Screen of ENVITNote......................................................53
(b) HydroLab Manual Entry Screen of ENVITNote
4.12:
(a) Biology Manual Entry Screen of ENVITNote...........................................54
(b) Chemistry Manual Entry Screen of ENVITNote
(c) Flow Meter Manual Entry Screen of ENVITNote
4.13:
SQL Server CE Push Pull Model - Courtesy of C. Tsou, unpublished, 2002...............57
4.14:
Modified Data Entry Screen for Lab Data.......................................................61
4.15:
Data Entry Screen to Replace Serial Numbers with Data...................................62
5.1:
Logged Positions..................................................................................66
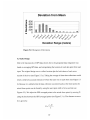
5.2:
Histogram of Deviations...........................................................................67
5.3:
(a) GPS Data Collection..........................................................................68
(b) GPS Data Averaging
(c) Re-Adjustment of Shore Based On User Input
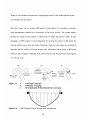
5.4:
Cross-Section of River Divided Into Sub-Sections.........................................
5.5:
GIS Web Service, Australia Field Study.....................................................72
5.6:
Display of Data Using ESRI ArcPad...........................................................73
9
68
CHAPTER 1: INTRODUCTION
1.1 Problematic
This thesis explores how to wirelessly transmit geographic information systems data from remote
handheld computers to a distant fixed web server for processing and distribution on the Internet.
It seeks to answer the question of how to transmit data from many handheld computers to a
mobile field server. It also seeks to answer how to transmit data from the field server to a fixed
web server thousands of miles away. It explores what software and data structures are required
for this type of data distribution. It also explores how to associate location data with other data
collected on the handheld computers and how to display that data on electronic maps. Finally, it
seeks to explore how this solution compares with other solutions.
1.2 Background on the ENVIT (Environmental Information Technology) Student Group
The ENVIT (Environmental Information Technology) Student Group was formed at MIT (The
Massachusetts Institute of Technology) in June 2001. The group's first project is a tool that
allows environmental field researchers to enter data into a PDA (Personal Digital Assistant) both
manually and automatically while taking readings in the field. This project called STEFS
(Software Tools For Environmental Field Studies) was developed under a grant from Microsoft's
I-Campus Project. ENVIT is an MIT ASA (Association of Student Activities) Recognized
Group. ENVIT has program support from PEER (The Program on Environmental Education and
Research) and financial support from the CET (Center on Educational Technology). This thesis
investigates STEFS's hardware and software issues which allow for wireless transmission of data
from the PDA's to servers and eventually to the Internet.
10
1.3 Motivation of STEFS (Software Tools For Environmental Field Studies) Project
The motivation behind STEFS is to allow environmental researchers to collect data using a PDA,
integrated with automated sensors, and transmit that data live to the Internet. The idea is to move
from the traditional field study where measurements are read by human eyes and reported
manually, by recording data by hand on paper, to be later transcribed to a computer system and
analyzed. Instead, STEFS seeks to automatically measure and log data into a handheld computer,
transmit that data live to be processed, shared between researchers, and displayed live on the
Internet.
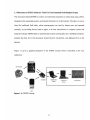
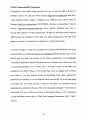
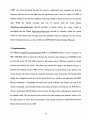
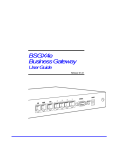
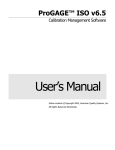
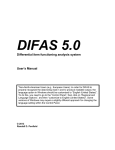
Figure 1.1 gives a graphical depiction of the STEFS concept which is described in the next
subsection.
Researcher
Environment
____
PocketPC
Mobile Field
Laptop
GPS
Figure 1.1: STEFS Concept
11
Fixed Web
Server
The Internet
1.4 Overview of STEFS
Figure 1.1 depicts the concept of STEFS. It is a PDA based integrated wireless system. As
shown, it allows field researchers to collect environmental and geospatial data and enter it into a
handheld computer automatically or through a graphical user interface. The figure breaks the
STEFS project into modules:
1. Sensors that collect environmental and location data automatically from the environment.
2. A graphical user interface (GUI) that allows the user to enter data manually.
3. The core of the system is a PDA which integrates the sensors and GUI.
4. Integrated with the PDA is both hardware and software that allows for wireless
transmission of the collected data to a field laptop server.
5. The laptop field sever processes the data.
6. Integrated with the laptop is both hardware and software that allows for wireless
transmission of the collected data to a fixed web server for display on the Internet.
This paper focuses on modules 4, 5, and 6 and explores how data is transmitted wirelessly to a
field laptop where it is processed and transmitted back to the handheld computers for near realtime analysis as well as to a web server to share it with the outside world. This thesis documents
the design, implementation, testing, and revisions to the core of this system.
1.5 Organization of STEFS Project Team
STEFS was designed as part of an Undergraduate Seminar and Masters of Engineering Project
under the coordination of doctoral students, Enrique Vivoni and Richard Camilli. Four
Professors and Staff, two doctoral students, six Masters of Engineering students, and thirteen
12
undergraduate students were involved in the design and implementation of this system. Together
they spent over 6600 hours over thirteen weeks to create the system.
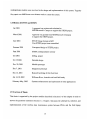
1.6 History of ENVIT and STEFS
Jan 2001
A proposal was written and submitted to
MIT/Microsoft I-Campus to support the STEFS project.
March 2001
Approval was granted from MIT/Microsoft I-Campus
to support the STEFS project.
June 2001
ENVIT Group formed at MIT
Core STEFS project team assembled
Summer 2001
Conceptual design of STEFS project.
Sept 2001
STEFS, undergraduates seminar
Oct 2001
M.Eng. project
Oct 19 2001
Detailed design
Nov 30, 2001
Module prototype
Dec 7, 2001
Integration prototype
Dec 14, 2001
Boston/Cambridge (USA) field trial
Jan 14-18, 2002
Williams River, Australia trial and field study
February-May, 2002
Systems enhancements and exploration of other applications
1.7 Overview of Thesis
This thesis is organized by the project modules described in Section 3 of this chapter in order to
answer the questions outlined in Section 1.1. Chapter 2 discusses the alternatives, selection, and
implementation of the wireless data transmission system between PDAs and the field laptop
13
server. Chapter 3 discusses the alternatives, selection, and implementation of the wireless data
transmission system between the field laptop server and a fixed web server. Chapter 4 discusses
the design, implementation, and testing of software systems used to collect, organize, and
transmit data in the STEFS system. Chapter 5 discusses the design, implementation and testing
of the methods and software for integrating measured data with geospatial coordinates and
displaying that data on an electronic map. Chapter 6 compares the system with similar systems
on the market and investigates costs of development and of future enhancements and
implementations.
1.8 More Information
For more information on the STEFS concept, refer to "Development of mobile computing
applications for hydraulics and water quality field studies," Camilli, et all, 2002. For more
information on the development of the STEFS project, refer to "EnviroCom Final Report
(2002)," Agarwal, et al; "EnviroCom Project Proposal (2001)," Agarwal et al; and "Software
Tools For Environmental Field Studies Final Report (2002)," Agarwal et al. Also refer to
"EnviroCom Project Proposal Presentation, M.I.T., 2001," Agarwal et al; "EnviroCom Final
Presentation, M.I.T., 2002," Agarwal et al; and "EnviroCom Presentation to Environmental
Systems Research Institute (ESRI), Inc., Redlands, CA, 2002," Agarwal et al. Finally, refer to
the web sites of http://envitweb.mit.edu and http://web.mit.edu/envit/www for the most up to
date information on the ENVIT Student Group and STEFS project.
For a detailed look into how the data collected from the STEFS field study in Newcastle,
(Australia) was used, refer to "Hydrologic Modeling of the Williams River with tRIBs:
14
Development and Testing of a Novel User Interface for the TIN-Based Hydrologic Model," Lau,
2002 and "Hydrologic and Water Modeling with HSPF: Utilization of Data from a Novel Field
Data Collection System and Historical Archivess," Richards, 2002.
15
CHAPTER 2: WIRELESS LOCAL AREA NETWORK
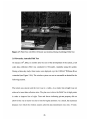
2.1 Introduction
This chapter seeks to answer the question of how to transmit data from many handheld
computers to a mobile field server. It describes the WLAN (Wireless Local Area Network) used
by STEFS to transmit data between Mobile PDAs and a Mobile Field Laptop (as shown in
Figure 2.1). Section 2.2 describes the motivation for having wireless transmission. Section 2.3
describes some of the alternatives available for this type of data transmission. Section 2.4
explains why 802.11b was selected. Section 2.5 explains the complexities of implementing
802.1 lb into this system and the use of IrDa (Infra Red Data Association) in allowing field teams
to transmit their data from remote locations. Sections 2.5 and 2.6 describe the field testing of this
module and Section 2.7 describes the revisions to this module as a result of the field testing.
Figure 2.1: Data Transmission between Mobile PDAs and Laptop
Before this author joined the STEFS project, there had been a number of technological choices
that had been made and were not subject to change. This chapter and this thesis assume that these
choices are design constraints, and alternatives will not be explored in this thesis. Some of these
constraints include choosing Compaq (http://www.compaqi.com) iPaqs running Microsoft
PocketPC Operating System as the PDAs for the STEFS system and the platform for design on
the PocketPC to be Embedded Visual Basic (eVB). Throughout this Chapter, we then assume
16
that iPaq with PocketPC running an Embedded Visual Basic Application is a fixed criterion in
the selection of other components in the wireless system. For more information on 802.1 lb refer
to "GPS and Wireless Presentation, M.I.T., 2001," Spieler, Russell.
2.2 Motivation
The wireless data collection system module of STEFS is designed to allow data to pass from the
handheld PocketPC to the field laptop, where it is processed for distribution back to the other
PocketPCs as well as to web servers for publishing on the Internet. Goals considered for the data
collection module are:
" Seamless integration with an Embedded Visual Basic Application running on a
PocketPC;
*
The ability for multiple PocketPCs to transmit information simultaneously;
" A form factor that matches the handheld nature of the PocketPC
" A system compatible with the PocketPC and the iPaq 3670;
*
The ability to transmit data over multiple miles from the mobile PocketPCs to a
centrally located laptop;
*
A mobile form factor for the central data collection station;
*
A central data collection station compatible with a Windows laptop;
*
Low cost hardware;
* Low costs of data transmission;
* High rates of data transfer; and
* Low power consumption
17
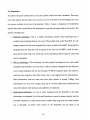
2.3 Alternatives
To achieve the goals outlined above, four main options could have been considered. There may
exist other options that the author was not aware of, but to the best of his knowledge, they were
the options available at the time of development. Table 2.1 gives a comparison of the different
options and numeric justifications for assumptions on pricing and range made in this section. The
options considered are:
1. Bluetooth technology: This is a rapidly developing wireless data technology that is
actually being integrated directly into newer iPaq models such as the iPaq 3870. It is the
cheapest option with the most integrated form factor at both the PocketPC (being directly
integrated into the iPaq unit) and the laptop (in the form of a PCMCIA card). Its drawbacks are the short range over which data can be transmitted, and the speed at which data
can be transmitted.
2. 802.1 lb technology: This technology has been greatly developed for use with mobile
computers and PocketPCs. Its form factor, while not directly integrated into the iPaq unit,
can be easily integrated with the unit through a PCMCIA expansion pack. The system is
relatively more expensive than other options, but is well supported by the manufacturers.
Data transmission rates are faster than most other options at around 11Mbps. Data
transmission can occur over a longer range (up to 16 miles under ideal conditions) than
most other options when antennas and amplifiers are employed.
3. Radio-based technology: It is not as easily integrated into the PocketPC as the other
technologies investigated. No off-the-shelf hardware is suited to interact directly with the
PocketPC. Benefits of a radio-based system include longer range than most other systems
(up to thousands of miles). Form factors on the PocketPC end are likely to be
18
unacceptably large, and data transmission rates are unacceptably small (about 4200bps).
While initial hardware costs might be lower than other systems, time and effort in
modifying and maintaining the system would likely cancel out the cost advantages of this
technology.
4. Cellular technologies: These technologies, especially Cellular Digital Packet Data
(CDPD), have extensive networks, readily available hardware that can integrate with
PocketPC, and plenty of customer support to ensure success. Unfortunately data rates are
not cost effective and transmissions are still relatively slow at 19200bps. In addition,
coverage areas in remote environmental data collection sites can be quite poor, if existent
at all.
19
2.4 Selection
Bluetooth
Feature
Embedded Visual
Easy
Basic Integration
Simultaneous
Up to 10
Transmission
Form Factor for
Integrated
PocketPC
PocketPC iPaq
Compatibility
Range
Form Factor for
Laptop
Windows Laptop
Compatibility
Hardware Cost (3
units)
802.11b
Easy
Infinite
PCMCIA
Expansion
Radio
Hardware
Adaptation
Cellular
Software
Adaptation
Only One
Only One
External Cable
External Cable
Not Easily
Yes
Up to 16 miles Up to thousands
of miles
10 meters (amplified)
External
External
Antenna +
Antenna +
Transmitter
Router
PCMCIA
Yes
Yes
Limited by
Coverage
PCMCIA
Yes
Yes
Not Easily
Yes
$400
$2,000
$1,000
$2,000
0
10Mbit/sec
0
56kbits/sec
Relatively High
19kbits/sec
Low
Very High
Low
0
Transmission Costs
IMbit/sec
Speed
Energy
Very Low
Consumption
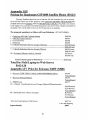
Table 2.1: Wireless Technologies Features Comparison Chart
The 802.1 lb system was chosen primarily for its large range, fast data transmission rate, small
form factor, and relative ease of integration into an Embedded Visual Basic Application running
on a Compaq iPaq PocketPC (http://www.compaq.com). The Orinoco
(http://www.orinocowireless.com) COR- 1100 Router and the Orinoco Silver PCMCIA Cards
provided the necessary capabilities in an affordably priced system (see APPENDIX Wireless
Funding Proposal) for around $2000. With the addition of a high-gain 15dB omni-directional
antenna and a 1-watt amplifier, the system has a theoretical range of around 16 miles.
20
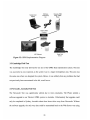
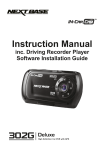
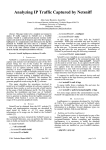
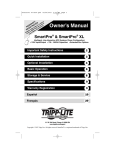
2.5 Implementation
In order to implement the selected Wireless Wide Local Network (WLAN), each iPaq
must have a PCMCIA expansion pack with an Orinoco Silver 802.1 lb wireless PCMCIA
card. In addition the field laptop must be connected to an Orinoco COR-1100 via
crossover Ethernet cabling. In order to achieve the 16-mile range, the Orinoco COR-1 100
is connected to a high-gain antenna through an amplifier. The system communicates over
TCP/IP. The laptop is the server in the system, and is given the IP Address 10.0.0.1. The
Orinoco COR-1100 is the gateway in the system, and is given the IP Address 10.0.0.2.
Each iPaq is given an IP Address in the range of the server and gateway 10.0.0.X. Each
iPaq is initialized to use the server and gateway. The iPaqs use Orinoco Client Software
to maintain their connection to the system while the laptop uses Orinoco Router Manager
Software. The actual data transmission is done by the Embedded Visual Basic
Application, which is described in Chapter 4 of this thesis.
PocketPC
PCMCIA
Expansion
Orinoco Silver
Wireless
PCMCIA Card
16
Miles
High Gain 15dB
Ont-Direconal
1 Watt
Amplifier
Orinoco
COR-1100
Figure 2.2: 802.1 lb Implementation Diagram
21
Cross-Over
Ethernet
Mobile Field
Laptop
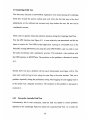
2.6 PDA Teams and iRDA Integration
Unfortunately, form factor issues prevented the use of both the GPS and 802.1 lb
PCMCIA cards in the same unit. While Compaq (http://www.compaq.com) does sell a
"Dual Expansion Pack" capable of integrating two PCMCIA cards with the iPaq, the
Teletype (http://www.teletype.com) GPS PCMCIA card does not physically fit with the
Orinoco (http://www.orinocowireless.com) Silver 802.1 lb PCMCIA card. This is
because both cards have a bulky external piece. No 802.1 lb cards that could fit with the
GPS card, and are compatible with the iPaq were being manufactured at the time of the
design. As a result, it was necessary to implement a two iPaq team system.
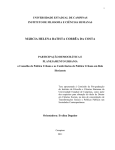
As shown in Figure 2.3, iPaq one is equipped with a Teletype GPS PCMCIA card via the
expansion pack, and a Hydrolab (http://www.hydrolab.com) Water Quality Sensor via the
RS-232 port. This data is all entered into the system automatically via the Embedded
Visual Basic application. Because iPaq does not have a wireless card, it must travel with
a second iPaq equipped with a wireless card. It will pass its data via the iRDA port
(standard on the iPaq) to iPaq two. This second iPaq, which is equipped with a wireless
card, sends its own data (entered through the Embedded Visual Basic application's
Graphical User Interface) as well as iPaq one's data over the 802.1 lb to the field laptop
(see Figure 2.4). As a result, any data on iPaq two will need to be associated with the
geospatial data collected by iPaq one. This will be discussed in Chapter 5 of this thesis in
more detail. The over all three-team system is illustrated in Figure 2.5. For information
on this three-team system refer to "Field Data Streaming Presentation. M.I.T., 2002,"
Vivioni.
22
I
I
iPaq 1
iPaq 2
Figure 2.3: iRDa Data Entry and Transmission Set-up
U-7
yi_
I 'El-m
I
0
V fiCC
Figure 2.4: 3 Team 802.1 lb Data Transmission with iRDa Data Entry
and Transmission Set-Up
23
U
I
wireless
wireless
sensor 1
Local
database
*N
sensor 2
f
Local
database
Roving
Station
IR
Master
database
Local
database
_
eso
sensor 3
Figure 2.5: 802.1 lb and iRDa Data Entry and Wireless Transmission Schema
Courtesy of E. Vivoni, pers. comm., 2002
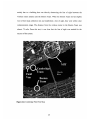
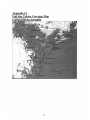
2.7 Cambridge Field Test
On December 14th, 2002, three months after the start of development on the system, a
field test was run in Cambridge and Boston, MA, USA As shown in Figure 2.6, teams
were deployed in Cambridge and Boston to take measurements in the Charles River
along side MIT. Each team had a PocketPC equipped with the 802.1 lb PCMCIA cards.
The 802.1 lb Wireless Router and Laptop were positioned in a field van a few hundred
feet from the Cambridge team (shown in Figure 2.7). During this field test the laptop was
constantly pinging both PocketPCs in order to determine whether or not they were within
communication range. This test showed partial success for the 802.1 lb wireless System.
The PocketPC in Cambridge was within communication range throughout the entire field
test. The PocketPC in Boston was not within range for most of the field test. This was
24
mainly due to a building that was directly obstructing the line of sight between the
wireless router antenna and the Boston Team. When the Boston Team moved slightly
west of their data collection site and established a line of sight, they were within clear
communication range. The distance from the wireless router to the Boston Team was
almost .75 mile. From this test, it was clear that the line of sight was needed for the
success of the system.
Figure 2.6: Cambridge Field Test Map
25
Figure 2.7: Field Van with 802.1 lb Router and Antenna During Cambridge Field Test
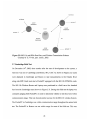
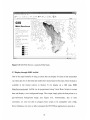
2.8 Newcastle, Australia Field Test
On January
16 th,
2002, six months after the start of the development of the system, a full
scale data collection effort was conducted in Newcastle, Australia using the system.
During a three-day study, three teams were deployed over the 1100 km2 Williams River
watershed (see Figure 2.8 b). The wireless system was not as successful as desired for the
following reasons.
The terrain was uneven and the river was in a valley. As a result, line-of-sight was not
achieved at most data collection sites. The plan was to drive the Field Van to high points
in order to improve line of sight. Time and fences indicating private property did not
allow for the van to travel very far to look for higher positions. As a result, the maximum
distance over which the wireless system achieved data transmission was only .75 mile.
26
To collect data from all groups, the van was required to drive from site to site, collecting
data as we drove by (see Figure 2.8 c).
In addition to testing the 802.11b wireless system, the Australia field test was the first
time the iRDa system was tested. It was also found to be substandard for many reasons.
Primarily, the transfer of data over iRDa required the user to exit out of the Embedded
Visual Basic application and go through some rather not intuitive steps to transmit data.
This resulted not only in a lot wasted of time and effort by the field researchers, but also
in a high risk for loss of data. A secondary issue was ambient light and the protective
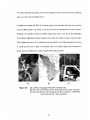
pouch, shown in Figure 2.8 a, obstructing the iRDa data transfers.
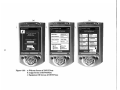
(a)
Figure 2.8:
(b)
(C)
(a) An 802.1 lb Equipped PocketPC Sending Data
(b) The 1100 km 2 Williams River Watershed in Newcastle, Australia
(c) The Roving Field Van Equipped with 802.1 lb Router, 15dB HighGain Antenna, and 1 Watt Amplifier
27
2.9 Enhancements
As mentioned above, the primary shortcoming of the wireless system was the use of
iRDa. As a result, it was desirable to remove iRDa from the system. In order to do this, it
was necessary to incorporate both the GPS PCMCIA sensor and the 802.1 lb wireless
PCMCIA cards into the same PocketPC. This was previously impossible because both
PCMCIA cards had a bulge on their external end, making it impossible for them to fit
into
the
Dual-PCMCIA
expansion
pack
together.
Fortunately,
Compaq
(http://www.compaq.com) now makes a "slim" 802.1 lb PCMCIA card, that does not
have a bulge on their external end. Using this card, both GPS and Wireless can be
incorporated into a single PocketPC eliminating the need for iRDa as well as the need for
two PocketPCs in a team.
28
CHAPTER 3: GLOBAL WIRELESS NETWORKS
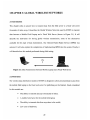
3.1 Introduction
This chapter seeks to answer how to transmit data from the field server to a fixed web server
thousands of miles away. It describes the Global Wireless Networks used by STEFS to transmit
data between a Mobile Field Laptop and a Fixed Web Server (shown in Figure 3.1). It will
describe the motivation for having global wireless transmission, some of the alternatives
available for this type of data transmission, why General Packet Radio Service (GPRS) was
selected. It will also explain the complexities of implementing GPRS into this system. Finally, it
will describe how this module performed during field testing.
Figure 3.1: Data Transmission between Mobile Laptop and a Fixed Web Server
3.2 Motivation
The wireless data distribution module of STEFS is designed to allow processed data to pass from
the mobile field laptop to the fixed web server for publishing on the Internet. Goals considered
for this module are:
" The ability to transmit data up to thousands of miles;
" A mobile form factor for the mobile field laptop
" The ability to transmit data from anywhere in the world;
"
Low costs of hardware;
29
"
Low costs of data transmission;
" High rates for data transfer;
" Low power consumption; and
" The ability to automate the transmissions using the Windows operating system.
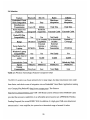
3.3 Alternatives
To achieve the goals mentioned above, three options were considered. There may exist other
options that the author was not aware of, but to the best of his knowledge, there were the options
available at the time of development. Refer to Table 3.1 for a comparison of the different options
and numeric justifications for assumptions on pricing and coverage made in this section. The
options considered were:
1. GlobalStar Satellite Phone technology: It allows for coverage from anywhere on the
globe. This allows the STEFS system to operate from any area during an environmental
field study, including remote and isolated areas. The costs of hardware and data
transmission can, however, be relatively high.
2. Global System for Mobile Communications (GSM) technology: This technology has
been around in Europe for more than a decade, where it has nearly ubiquitous coverage.
While it is relatively new to the US and where it has primarily urban coverage, it is
becoming the international standard for wireless phones. GSM makes use of SIMM cards
which carry the identification for a specific account on a specific network. With the use
of these SIMM cards, the same phone can be used on one network in the US and another
network in a foreign country, by switching the SIMM card.
30
3. GPRS technology: This is an extension of the GSM technology. GPRS phones have all
the features of GSM only phones, with additional benefits. GPRS allows direct
connection to the internet with out dialing out to a server. Compared to GSM, GPRS
offers much faster data rates and charges per kilobyte (as opposed to per minute). Its
coverage areas are currently less extensive than GSM. Because all GPRS phones have
GSM capability, if the phone is outside of GPRS coverage, it can still transmit data over
GSM.
3.4 Selection
All three options are almost identical in their ability to transmit data across the world over a
global network and both use a mobile telephone for hardware. Table 3.1 summarizes the
attributes of each alternative for the goals for this module.
Feature
Coverage Area in the
Globe
Hardware and Basic
Service Costs
Satellite
100%
GSM
Primarily Urban
GPRS
Less than GSM
$1,624
$500
$1,096.90
Included with Basic
Service
Costs for Use Over
Included Service
50 mins / month
500 mins / month
10 MB / month
$1.39 / min
$.30 / min
$4.00 / MB
Use Costs Outside US
$2.39 / min
$.44 / min
$10.00 / MB
Data Rate
19.2 Kbps
9.6 Kbps
64 Kbps
Windows Laptop
Compatibility
Dial out Modem
Is Cumbersome
Dial out Modem
is Cumbersome
GPRS Direct
Connection to the
Internet
Table 3.1: Longer Range Wireless Technologies Features Comparison Chart
31
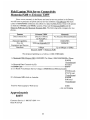
GPRS was chosen primarily because the system is significantly less expensive for both the
hardware and the service, the data rates are significantly faster, and the feature of GPRS to
directly connect to the internet as opposed to having to dialup to the fixed web server to transmit
data.
While
the
limited coverage
area
was
of concern,
both the
Voice
Stream
(http://www.voicestream.com) network available in Boston (where the system would be
developed) and the Telstra (http://www.telstra.com) network in Australia (where the system
would be field tested) had coverage areas that appeared would be sufficient for the systems
needs. Total proposed cost, is about $1100 (see APPENDIX Wireless Funding Proposal).
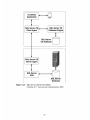
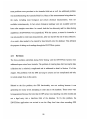
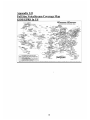
3.4 Implementation
The Motorola (http://www.motorola.com) P280 is a GSM/GPRS phone. It uses a frequency of
900 / 1800 MHz when on networks in Europe and Australia, and a frequency of 1900MHz when
on networks in the US. The P280 connects to the laptop using a USB data connectivity kit and
software provided by the carrier. The phone can connect the laptop to the Internet giving it a
temporary IP Address on the GPRS network. Theoretically, because billing is per kilobyte and
not per minute, the phone should be connected during the entire field study. The Mobile Field
Laptop has a mapped network drive on the Fixed Web Server, which is activated when the GPRS
phone is connected. VoiceStream was used as the carrier in Boston and Telstra was used as the
carrier in Australia. Once the data travels across these networks to the Internet, the Web Server,
which is connected to MIT Ethernet, stores the data. The data is then available upon request from
the outside world. The web services site provides up-to-date images upon requests, based on the
live data. Figure 3.2 shows how the hardware in this module connects to transmit data from the
field to the fixed web server at MIT.
32
USB Data
Connectivity
Kit
Mobile Field
Laptop
Motorola P280
GSM / GPRS
Phone
0-~
GSM / GPRS
Carriers
0000000'
AO
Fixed Web
Server
MIT Ethernet
Figure 3.2: GPRS Implementation Diagram
3.5 Cambridge Field Test
The Cambridge Test only allowed for one test of the GPRS Data transmission system. This test
was successful as was expected, as the system was in a major metropolitan area. This area was
the same area where we designed the system. Hence, it was unlikely that any problems that had
not previously been encountered in the lab, would occur.
3.6 Newcastle, Australia Field Test
The Newcastle Test was significantly alerted due to time constraints. The Phone needed a
software upgrade to use Telstra's GPRS system in Australia. Unfortunately that upgrade could
only be completed in Sydney, Australia about three hours drive away from Newcastle. Without
the software upgrade, the only way data could be transmitted back to the Web Server was using
33
the GSM voice capabilities of the phone, a regular modem, and MIT's Dial-Up Internet Service
Provider Tether. The results were significantly slower data transmissions at extremely higher
cost. To complete updates of the Web Server took hours instead of minutes and cost hundreds of
dollars for the trip as opposed $50-$100.
In addition, the coverage in the remote areas where the field testing was being conducted was
quite poor. The phone received GSM coverage at roughly 20% of the field sites. This suggests
that a more ubiquitous system such as Satellite Phone might be necessary for use in remote areas.
34
CHAPTER 4: DATA COLLECTION, MAINTENANCE, and
DISTRIBUTION
4.1 Introduction
This Chapter explores what software and data structures are required for this type of data
distribution. It describes how a relational distributed database is updated locally on PocketPCs
and integrated on a mobile laptop computer. The chapter describes the methods used by STEFS
to collect, maintain, and distribute data. Section 4.2 explains how the database was originally
developed. Section 4.3 describes the early revisions to the database. Section 4.4 discusses how
the database integrated all of the other modules of the project. Section 4.5 describes the finalized
database. Section 4.6 describes how the database is pre-configured using a Windows Visual
Basic .NET Application. Section 4.7 explains how that pre-configured database is used by an
Embedded Visual Basic Application on the PocketPC to enter field data. Section 4.8 describes
how that Embedded Visual Basic Application uses the 802.1 lb wireless system to transmit data
from the PocketPC's local database to the master database on the Field Laptop. Sections 4.9 and
4.10 address the field testing of this module and Sections 4.11, 4.12, and 4.13 discuss the
revisions and conclusions that resulted from that testing.
As explained in Chapter 2, before this author joined the STEFS project, there had been a number
of technological choices that had been made and were not subject to change. This chapter and
this thesis assume these choices are design constraints that will not be explored in this thesis.
Throughout this chapter, we then assume that iPaq with PocketPC running an Embedded Visual
Basic Application is a fixed criterion in the selection of other components in the wireless system.
35
This chapter and the software it discusses could not have been written without guidance from
references. Please refer to Reference 10 for assistance in programming in C#.NET; References
13 and 14 for assistance in programming Visual Basic; Reference 8 for assistance in
programming in SQL Server and SQL Server CE; Reference 11 for assistance in programming
Microsoft Access; and References 7, 12, 17, 18, and 20 for assistance in programming in
Embedded Visual Basic and other programming for Windows CE devices. Also refer to
http://msdn.microsoft.com and http://www.microsoft.com for assistance in coding for the
Microsoft .NET platform and for PocketPC.
4.2 Development
The STEFS database was designed to allow multiple sensors on multiple PocketPCs to record
data such that the roving field laptop could collect and process that data. The goal was for the
laptop to easily produce an output table of GIS data. This data should be readable by display
media including Geographic Information Systems (GIS) web services over the Internet, an
Environmental Studies Research Institute (ESRI) ArcIMS server over the Internet, and ESRI
ArcPad back on the PocketPC (see Chapter 5). Goals considered in design of this module are:
"
The Embedded Visual Basic Application should automatically record spatial data
from the GPS sensor;
"
The Embedded Visual Basic Application should automatically record water
quality data from the Hydrolab sensor;
"
The Embedded Visual Basic Application should record data entered manually into
the PocketPC;
36
"
The Embedded Visual Basic Application should record data for a cross section of
a river as well as for an individual point in that cross section;
*
The Embedded Visual Basic Application should should record and store all data
collected;
" The STEFS system should filter out or average data to aggregate the most useful
data collected for use in the GIS output table;
*
The STEFS system should associate all data with the site it was collected at, the
date and time it was collected, the equipment it was collected with, the person
who collected it, and the PocketPC it was recorded on;
" The STEFS system should associate a specific GPS location with each data
collection site;
*
The Embedded Visual Basic Application should validate data to ensure that it is
within a specified range for each measurement; and
*
The STEFS system should pre-populate the database with all equipment and user
information using a Windows Visual Basic .NET Application.
4.3 Early Revisions
Early revisions of the database allowed for collection of data from specified sensors without the
intention of integration or display. The database carried no information about the equipment
itself and only allowed for the measurements from a specific instrument to be logged and stored
for future analysis. While this was useful, it was not robust enough to manage the different data
types that STEFS would need to collect.
37
The system needed to allow the user to track what equipment was used to collect data, who
collected it, and where they collected it from. It was also desirable to have a system that could
collect data from any equipment, not just the equipment owned by the ENVIT team. This would
allow for the system to be expandable to other field studies in the future. Finally, the system
needed to have the capability of presenting the data in GIS format, relating the GPS location data
to the measurements collected at that location (see Chapter 5). The original database design did
not allow for this type of data integration.
4.4 System Integration
There were many different goals in mind while developing the database. The Embedded Visual
Basic Application needed to be able to easily read and write equipment choices and login
information. It also needed to easily enter measurement data into the database. The GPS needed
to be able to automatically enter positional data and the automated instruments (in this case
Hydrolab) needed to be able to automatically enter data. The database needed to also be
expandable to carry more instruments and measurements easily. Finally, the database needed to
be able to convert the data into GIS readable format (see Chapter 5), so that the different GIS
displays could easily read the data. Finally, the database needed to be able to show instrument
calibrations, validate measurements, and keep track of who entered data and with what
equipment. The resulting system was relatively complex.
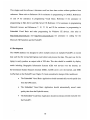
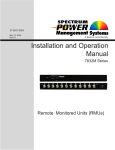
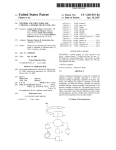
4.5 Database Finalization
The database in its entirety can be seen in Figure 4.1. It was determined that there were eight
distinguishable data categories that would be entered into the system. These are: Data about the
38
equipment being used, data about the log-in, data used for calibration, data used to validate
measurements, location data from a GPS sensor, data to be entered by hand from a data
collection kit or external sensor, and data to be entered automatically from an attached sensor.
Maintenance of log-in data requires pre-configured user and location information through a
Windows application (see Section 4.6). This data can then be retrieved by the log-in form in the
PocketPC application and entered into the log-in table when selected through that application
(see Figure 4.10 a and b). See Figure 4.2 for the User, Location, and Log-In data tables.
Location data from the GPS sensor, hand-entered data from a data collection kit or external
sensor, and data entered automatically are each stored in a separate table. Respectively, GPS
Record, Kit Record, and Instrument Record (see Figure 4.3).
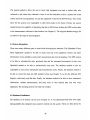
All of the data about the equipment, needed to be entered before the data collection effort
through a Windows application (see Section 5 of this Chapter). The equipment being used for
that particular session could then be selected at log-in (see Figure 4.10 b and c). Therefore, each
of the three tables mentioned above has a respective equipment table GPS ID, Kit Type and Kit
ID, and Instrument Type and Instrument ID (see Figure 4.4). These tables allow the user to store
general data such as make, model, and manufacture date, about all the equipment being used.
Each measurement needs to be validated to be sure the data entered is within the possible values
for that measurement. Validation information for each measurement that each of these sensors
39
and kits is capable of measuring, needs to be entered by the Windows application into the
database. The embedded Visual Basic Application can then ensure all data being entered is
within the valid range for that measurement by comparing with these values in the database.
With this in mind the Kit Measurement and Instrument Measurement tables (see Figure 4.5)
were made to check each measurement before it is entered into the Kit Record and Instrument
Record tables, to ensure they are valid.
Finally calibration information needs to be entered for certain sensors to ensure that they are
taking accurate readings. This information needs to be entered before the use of any sensor
requiring such calibration. The Calibration Table is filled in using the Windows application and
the Calibration Record table (see Figure 4.6) is validated against it when Calibration is
performed in the field using the PocketPC application.
40
KWID
...........
Departments
Users
UlRecord
Logi
CalbrationRecord
Project
KitType
InstrumentRecord
UlTypeMmaurement
Location
I
LocationCalc
f
EUI easurement........--I
fq
GPSRecord
Shore
Card
GPSConnection
GPSID
ExtamalBattery
Instr
CalibrationInfo
entID
InstrumentConnection
InstrumentType
Figure 4.1: Entire STEFS Database
InstrumenATypeMeasurcment
Ins t
men
LocationiU
ProjectlD
Longitude
Latitude
Name
Description
Width
LoginName
StartTime
EndlTime
SLocationID
SUserID
SiPaqIPaddress
Figure 4.2: User, Location, and Login Tables
KtType
iPaqIPaddress
Val
Units
WidthInterval
DepthInterval
Latitude
Longitude
Altitude
Depth
SUserID
instrUmentRecord
Tstamp
Val
iPaqIPaddress
Outof Range
InstrumentSerialNum
UserID
LocationID
MeasurementID
InstrumentType
7 UMT
Latitude
Longitude
Altitude
V ShoreID
GPSSerialNum
SLocationID
StartTime
-
-
LocationID
Kit5erialNum
MeasurementID
StartTime
Figure 4.3: GPS Record, UI Record, and Instrument Record Tables
42
ti
Intrumentbre
9 Instrument5erialNum
InstrumentName
LoggingMemory5ize
MaxNumLogFiles
InstrumentAbrev
Sof twareVersion
~~ ConnectionlD
~
Vendor
DateManuf
InternalBattery
ConnectionID
ExternalBattery5erialNumn
InstrumentType
Kt
n
KitSyp
Description
l
GP___ri
___um
GPSName
5m
oftwareVersion
PCnctnD
Vendor
DateManufacture
InternalBattery
GP5Connection1D
KitType
Kit
Kit5erialNum
Kit5pecs
KitType
Manuf acturer
DateManuf
.............
Figure 4.4: GPS ID, Kit Type and Kit ID, and Instrument Type and Instrument ID Tables
MeasurementName
SUnits
MaxValue
MinValue
MeasurementID
Units
MaxValue
MinValue
MeasurementDescriptionMeasurementID
MeasurementName
Figure 4.5: Kit Measurement and Instrument Measurement Tables
43
Mai
Instrument5erialNum
InstrumentType
iPaqIPaddress
a
atMeasurementlD
C
VInstrument~erialNum
2 InstrumentType
MeasurementID
Name
CalibrationID
UserID
U UerID
LocationID
M
Name
'XVal
5tartTime
CalibrationID
Figure 4.6: Calibration Info and Calibration Record Tables
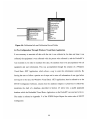
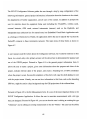
4.6 Pre-Configuration Through Windows Visual Basic Application
It was necessary to associate all data with the site it was collected at, the date and time it was
collected, the equipment it was collected with, the person who collected it, and the PocketPC it
was recorded on. In order to maintain this data, the database had to be pre-populated with all
equipment and user information. This was accomplished through the creation of a Windows
Visual Basic .NET Application, which allows a user to enter this information correctly. By
forcing the user to follow a precise set of steps and to enter all information of one type before
moving on to the next, the Windows Visual Basic .NET Application, here-in referred to as the
ENVIT Configurator Software, ensures that the database integrity is preserved. It effectively
transforms the shell of a database, described in Section 4.5 above into a usable populated
database which the Embedded Visual Basic Application on the PocketPC can read and write to.
The reader is referred to Appendix V of the STEFS Project Report for entire code of ENVIT
Configurator.
44
The ENVIT Configurator Software guides the user through a step by step configuration of the
following information: general project information, information about the locations to be visited,
the departments of his/her organization, and all users of the system. In addition it prompts the
user for statistics about the equipment being used including the: PocketPCs, wireless cards,
external batteries, GPS cards, external instruments (sensors) such as the Hydrolab, and
independent data collection kits for manual entry into Embedded Visual Basic Application such
as a biology or Chemistry kit. Finally, the application allows the user to specify the way that the
PocketPC connects to these instruments (sensors). The main menu of these forms is shown in
Figure 4.7.
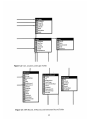
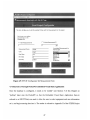
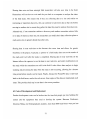
A user manual could be written about the Configurator software, but would be irrelevant to this
thesis. As a result, only a few primary screens will be shown here to demonstrate the purpose and
use of the STEFS project. Pictured in Figure 4.8 is the general project information form. It
allows the user to name a project, gives some information about the purpose and client of the
project, indicate relevant dates of the project, and create a bounding box of GPS coordinates
where the project occurs. Successful completion of this form will copy the shell database to one
with the project name. Already, one can see how information in this form, such as the bounding
GPS box, might be used to clip a background map for GIS projections of the collected data.
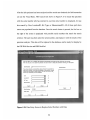
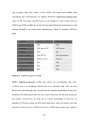
Pictured in Figure 4.9 is the Kit Measurement form. It is one of the most important forms in the
ENVIT Configurator Application. It allows the user to associate measurements with a kit type
they just designed. Pictured in Figure 4.9, you can see that the user is editing an existing kit type
"Chemistry" and is editing an existing measurement in that kit "Nitrite". The user has the ability
45
to choose the valid range of values for the measurement as well as the accuracy of this kit in
taking this measurement. After using the Configurator, the database should be ready for the
PocketPC application to read and select pre-configured users, and equipment. The PocketPC
application can associate each measurement to the equipment and user involved with collecting
it. It will also validate each measurement to ensure it is in the range of possible values for that
measurement type.
Figure 4.7: ENVIT Configurator Main Menu
This
form will allow you to edit the project information.
/2001 12:00:00 AM
Project X
14
N ame1
_
JAU
1/2001
4
14AM
12:00
No Records
Figure 4.8: ENVIT Configurator General Project Information Form
46
Figure 4.9: ENVIT Configurator Kit Measurement Form
4.7 Data Entry Through PocketPC Embedded Visual Basic Application
Once the database is configured, it needs to be "pulled" (see Section 5 of this Chapter on
"pulling" data) onto the PocketPC so that the Embedded Visual Basic Application (here-in
referred to as ENVITNote) can read it, allow the user to select equipment and user information
on it, and begin entering data into it. The reader is referred to Appendix II of the STEFS Project
47
Report for entire code of ENVITNote and Appendix VI of the STEFS Project Report for a User
Manual of ENVITNote.
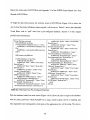
To begin the data entry process, the welcome screen of ENVITNote (Figure 4.10 a) allows the
user to enter the project (database) name and pull it off the server. Table 4.1 shows the embedded
Visual Basic code to "pull" data from a pre-configured database. Section 5 of this chapter
provides more information.
Private Sub formactivateO
Dim myDBName As String
If (welcomeform.txtDatabase.Text <> "") Then
myDBName = welcomeform.txtDatabase.Text
Else
myDBName = welcomeform.DBCombo.Text
End If
DBConnection myDBName
If (isNewDatabase = True) Then
'Pull read-only data tables
myRDA.Pull "users", "Select * From users",
RemoteConn, 0
myRDA.Pull "iPaq", "Select * From iPaq",
RemoteConn, 0
myRDA.Pull "Location", "Select * From
Location", RemoteConn, 0
myRDA.Pull "GPSID", "Select * From
GPSID", RemoteConn, 0
myRDA.Pull "GPSConnection", "Select *
From GPSConnection", RemoteConn, 0
myRDA.Pull "InstrumentID", "Select * From
InstrumentID", RemoteConn, 0
myRDA.Pull "InstrumentConnection", "Select
* From InstrumentConnection", RemoteConn, 0
myRDA.Pull "KitID", "Select * From KitID",
RemoteConn, 0
myRDA.Pull "KitType", "Select * From
KitType", RemoteConn, 0
myRDA.Pull "Card", "Select * From Card",
RemoteConn, 0
myRDA.Pull "ExternalBattery", "Select *
From ExternalBattery", RemoteConn, 0
myRDA.Pull "InstrumentTypes", "Select *
From InstrumentTypes", RemoteConn, 0
'Pull writable data tables
myRDA.Pull "InstrumentRecord", "Select *
From InstrumentRecord", RemoteConn, 1
myRDA.Pull "UIRecord", "Select * From
UIRecord", RemoteConn, 1
myRDA.Pull "Login", "Select * From Login",
RemoteConn, 1
myRDA.Pull "GPSRecord", "Select * From
GPSRecord", RemoteConn, 1
myRDA.Pull "Shore", "Select * From Shore",
RemoteConn, 1
myRDA.Pull "ENVITOutput", "Select * From
ENVITOutput", RemoteConn, 1
End If
End Sub
Table 4.1: Pull Data From Pre-Configured Database
With the database loaded, the next screen (Figure 4.10 b) allows the user to login to the database
with his name, password, which PocketPC he is using, which location site he is studying, and
what equipment (and consequently which parts of the application) he will be using. The data to
48
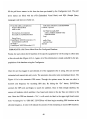
fill the pull down menus in this form has been pre-loaded by the Configurator tool. The pull
down menus are filled with the eVB (Embedded Visual Basic) and SQL (Simple Query
Language) code shown in Table 4.2.
Private Sub cmbLocDropDown()
On Error Resume Next
cmbLoc.clear
Dim myConn As Connection
Dim myRs As ADOCE.Recordset
Set myConn =
CreateObject("ADOCE.Connection.3. 1")
myConn.Open LocalConn
Set myRs =
CreateObject("ADOCE.Recordset.3. 1")
myRs.Open "SELECT LocationID FROM
Location", myConn
Do While Not myRs.EOF
cmbLoc.AddItem myRs(O).Value
myRs.MoveNext
Loop
myRs.Close
myConn.Close
End Sub
Table 4.2: Fill a Pull Down Menu From Pre-Configured Database
Finally, the user selects the ID numbers of the specific equipment he will be using to collect data
at this site and date (Figure 4.10 c). Again, all of this information is made available by the prepopulation of the database using the Configurator.
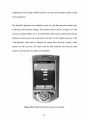
Once the user has logged in and selected all of the equipment s/he is using, s/he can use both
automated and manual data entry tools. The automatic data entry tools are displayed above. The
Figure 4.11a is the automatic GPS screen. Through the options menu, the user can select a
duration and frequency for recording GPS data. By hitting the "Go" button, ENVITNote
accesses the GPS unit and begins to search for satellites. Once it finds enough satellites, the
screen will indicate which satellites it has found and where in the sky they are relative to the
user. Once the GPS has obtained a "fix", it will switch its label in the upper right hand corner
from "Awaiting Fix" to "GPS OK". ENVITNote will then begin recording GPS locations at the
selected frequency. A timer will indicate the amount of time remaining to record GPS locations.
49
The user may switch screens and enter data into other screens while the GPS is recording data in
the background. Once the timer has run out, ENVITNote will cease recording data and begin
averaging the data it just recorded. Table 4.3 contains the embedded Visual Basic Code for
automatic GPS data entry.
Private Sub Timer2_Timero
Dim s4 As String
Counter = Counter + 1
On Error Resume Next
If lblStatus.Caption = "SATS OK" Then
EnterGPSRec
'Label6.Caption = Counter
'curlat = CDbl(curlat)
'curing = CDbl(curlng)
'curAlt
End Sub
CDbl(curAlt)
'MsgBox "1"
si = "INSERT INTO GPSRecord (UMT, Latitude,
Longitude, Altitude, ShorelD, GPSSerialNum,
LocationID) VALUES (' + lblUTC.Caption + "',"
'MsgBox si
Private Sub EnterGPSRec(
Dim myConn As Connection
Dim myRs As ADOCE.Recordset
Dim mySQL1 As String
's2 = curlat + "," + curing + "," + curAlt
s2= lblLat.Caption + "," + lblLong.Caption + "," +
iblAlt.Caption
'MsgBox s2
Set myConn =
CreateObject("ADOCE.Connection.3. 1")
myConn.Open LocalConn
s3 =
+ gShoreID +
+ gLocationID + ")"
"','"
+ gGPSSerialNumber +
'MsgBox s3
mySQLl = sl + s2 + s3
Set myRs =
CreateObject("ADOCE.Recordset.3. 1")
'MsgBox mySQL1
'curUMT = lblUTC.Caption
'curUMT = "01/01/01"
myRs.Open mySQL1, myConn
Dim sI As String
Dim s2 As String
Dim s3 As String
I
=
myRs.Close
'Set myRs = Nothing
I
myConn.Close
Table 4.3: GPS Automated Entry
The Figure 4.1 lb is the Hydrolab manual entry screen. ENVITNote can record from the
Hydrolab water quality sensor automatically. It simply records all measurements that it can sense
upon request once. You may also use the manual entry screen to enter data by hand directly from
the Hydrolab.
50
ENVITNote also has many manual inputs for external measurements a user might take. There
are separate screens for Biology (Figure 4.12 a), Chemistry (Figure 4.12 b), and Flow (Figure
4.12 c). The embedded Visual Basic code which controls the data entry from these screens can
be seen in Table 4.4. All three screens cannot be accessed until the user enters the width of the
river and the number of subsections the user wants to record at this cross section. Next, the user
selects a parameter to record. On the Biology screen the user can enter Bacteria (E. Coli and
Total Coliform) and Algae (Chlorophyll and Blue-Green Algae). On the Chemistry screen, the
user can enter Nitrogen (Nitrate N03-, Nitrite N02-, and Ammonia NH4+), Phosphorous
(Phosphate P04+2), and Metals (Aluminum Al+3, Cadmium Cd+2, Copper Cu+2, and Silica
Si). The Flow screen simply allows the user to enter the flow. After the parameter is selected, the
user is taken to a Cross-Section Screen (Figure 4.12 c shows the cross section screen for flow
records). The user may click anywhere on this cross section and enter data for that subsection.
The user will be prompted for the depth measurement. The user will also be prompted for a value
taken at 20% depth of the measurement being recorded as well as a value at 80% depth. This
data is recorded directly into the database. It is also averaged (with all other data ever collected
in the database) for this cross-section.
gUserID + "'," + gLocationID +
If (DataEntered2 = True) Then
","
gMeasurementID = "7"
mySQL2 = CStr(gMeasurementID) +
'For depth 20%
mySQL1 = "INSERT INTO UIRecord
",'
gKitType +
ionID,MeasurementID,KitType,Widthlnterval,
txtFlow20.Text + ",'m/s'," + CStr(Latitude) +
DepthInterval, Val, units, Latitude, Longitude,
Altitude, Depth) VALUES (" + _
CStr(Longitude) + "," + CStr(Altitude) +
txtDepth.Text + ");"
"'" + CStr(gTstamp) +
gIPaqlPaddress +
"','
,
SubmitSQL (mySQL1 + mySQL2)
+
+ gKitSerialNum +
"',"
"','
+
End If
Table 4.4: Sub-Section Data Entry
51
+
+ CStr(SelSec) + ",1," +
(Tstamp,iPaqlPaddress,KitSerialNum,UserID,Locat
"," +
"," +
(b)
(a)
(c)
Veum i
tprty
.0Noeo
'ht "J"I
cr
t I it
Enter Password
itbaae-t
c baseChooft
t xistingDat
Indtrum
Wkeless
Figure 4.10:
a: Welcom Screen of ENVITNote
b: Logjn Screen of ENVITNote
c: Equipment ID Screen of ENVITNote
_____
j
(a)
Figure 4.11:
a: Automatic GPS Screen of ENVITNote
b: Hydrolab Manual Entry Screen of ENVITNote
(b)
(a)
(b )
Figure 4.12: a: Biology Manual Entry Screen of ENVITNote
b: Chemistrey Manual Flow Entry Screen of ENVITNote
c: Flow Meter Manual Entry Screen of ENVITNote
(C)
4.8 Data Transmission
The ENVITNote Application has the capability of "Pushing" data to and "Pulling" data
from the laptop mobile field server. The process is shown in Figure 4.13. When the user
completes the welcome screen (Figure 4.10 a) the Windows CE Application running on
the PocketPC (ENVITNote) signals to the SQL Server CE Client Agent (also running on
the PocketPC) to request the database from the Field Laptop. After the PocketPC detects
that it is within range of the wireless network and that the IP Address of the Field Laptop
(the SQL Server CE Server Agent which it wishes to pull the database from) is reachable,
it sends a request to the SQL Server CE Server Agent (on the Field Laptop) to transmit
the data. The Server Agent accesses the SQL Server CE Database via the SQL Server
ADO and retrieves the data to be sent. The data is then packetized and transmitted
through the wireless network to PocketPC and the SQL Server CE Client Agent. The
Client Agent then enters the data into its local database via the local Database Engine.
See Table 4.1. The data is now available on the PocketPC for entry, viewing, and
manipulation, as described in Section 4 of this chapter. Every time a record is changed or
added to the local database, a note is also made in the database that this record needs to
be updated in the server database.
Once the user has finished entering and manipulating data on the PocketPC, s/he can
"Push" the data back to the Field Laptop using the ENVITNote Application. See Table
4.5.
55
Case "mnuDataSubmit"
Dim myConn As ADOCE.Connection
Set myConn =
CreateObject("ADOCE.connection.3. 1")
myConn.ConnectionString = RemoteConn
myRDA.Push
RemoteConn
myRDA.Push
myRDA.Push
myRDA.Push
'Push the databse back to the laptop
myRDA.Push "Login", RemoteConn
"InstrumentRecord",
"UIRecord", RemoteConn
"GPSRecord", RemoteConn
"Shore", RemoteConn
MsgBox "Data Transfer Completed.",
vbOKOnly, "Message"
End Select
Table 4.5: Push Data From Updated Tables
The application initiates its SQL Server CE Client Agent to gather data to be pushed from
the local database via the local Database Engine. The PocketPC once again detects that it
is on the wireless network and that the Field Laptop is on the wireless network as well.
The Client Agent then packetizes the data and sends it to the Server Agent on the Field
Laptop. The Server Agent then enters the data into the Field Laptops database via its SQL
Server ADO. This data is now available to be pulled by other users or transmitted to the
Web Server for viewing over the Internet.
56
EvnitNote
Application
SQL Server CE
Database Engine
SQL Server CE
Client Agent
SQL Server
CE Database
SQL Server CE
Server Agent
SQL Server
ADO
SQL Server
Database
Figure 4.13:
SQL Server CE Push Pull Model
Courtesy of C. Tsou, private communication, 2002
57
4.9 Cambridge Field Test
The data entry functions of ENVITNote Application were tested during the Cambridge
Field Test. Overall the system worked quite well. Given the fact that most of the final
preparations on the software had occurred only days before this test, the test can be
considered a success.
There were two specific items that called for attention during the Cambridge Field Test.
First the GPS functions (see Figure 4.11 a) were relatively non-operational and did not
obtain a location fix. The ESRI Arcpad application, running on a PocketPC next to the
PocketPC running ENVITNote and using the same GPS PCMCIA card was able to track
the teams movements with a satisfactory accuracy. This indicated a clear problem with
the GPS functions in ENVITNote. The resolution to this problem is discussed in section
4.11.
Second, there was also a problem with the log-in functionality (see Figure 4.10 b). The
same user could not log in twice using the same iPaq at the same location. This was a
problem, especially during the preliminary testing when logging out and logging back in
to the system was a frequent occurrence. The resolution to this problem is discussed in
section 4.11.
4.10
Newcastle, Australia Field Test
Unfortunately, due to time constraints, relatively little was doable to correct problems
identified in the Cambridge Field Test before the Australia Field Test. As a result, the
58
same problems were prevalent in the Australia field test as well. An additional problem
was identified during the Australia Field Test. Many of the measurements being taken for
the study, including most biological and certain chemical measurements, were not
available instantaneously. In fact certain biological readings were not available until 24
hours after samples were taken. As a result, both the live data entry and live data sharing
capabilities of ENVITNote were jeopardized. With the system, as tested in Australia, it
was not possible to enter data measurements, after one had left the site of data collection.
As a result, data needed to be entered by hand directly into the database. This defeated
the purpose of taking such readings through the ENVITNote system.
4.11
Revisions
The three problems identified during Field Testing with the ENVITNote System were
addressed upon return from Australia. The problem of entering data after leaving the data
collection site is relatively complicated and is addressed in detail in Section 12 of this
chapter. The problems with the GPS and Log-in screens are less complicated and only
involved simple fixes in the system.
Related to the first problem, the GPS functionality was not working because it was
generating too many errors attempting to enter data in the database. These errors were
being generated because the time that the GPS sensor was reporting was often invalid and
not a legal entry into a date/time field of the database. To fix this problem, the
ENVITNote application was revised to use the iPaqs local time when recording GPS
59
measurements. This ensured that the entries would not generate errors from the database,
and resulted in a functional GPS module of ENVITNote.
Similarly, related to the second problem, the log-in functionality was also a simple fix.
The same user could not log in twice using the same iPaq at the same location due to the
fact that the primary keys of the log-in table were User, Location ID, and iPaq IP
Address. To solve this problem, Log-In Time was also added as a primary key to this
table to the database. This enabled the same user to log-in as many times as s/he needed
to.
4.12 Integration of Post Processed Data
Samples are often collected in the field, which are not processed instantaneously.
Samples can take hours or even days to analyze or incubate. Some samples may even
need to be sent to a lab for analysis, in which case it may take weeks for the results to be
determined. As a result, in order to integrate this type of data with the STEFS model,
samples must be tagged with serial numbers, which must be entered into the PocketPC in
the field in the place of actual measurements and stored with the project, equipment, user,
and location information. Once the results are obtained, the user must be able to enter this
data into a Windows Graphical User Interface by searching for the appropriate serial
number and replacing it with the actual data. Finally, this data needs to be instantly
updated in the output tables of STEFS for display on the GIS Web Services. As a result,
an effort has been made to create a Windows Visual Basic Lab Data Entry tool and
60
~-
modifications will be made to STEFS to allow it to collect serial numbers in place of data
where appropriate.
The PocketPC application was modified to allow for both data and serial number entry
for Biology and Chemistry readings. The modified screen is shown in Figure 4.14. This
screen now replaces Figure 4.12 c. If the Data Entry radio button is selected, the software
behaves exactly the same way as described in Section 7 of this Chapter. However, if the
"Lab Specimen" radio button is selected, the system allows the user to enter a serial
number into the text boxes. The intent is that the field researcher will write this serial
number on the specimen, recorded it in the database.
Figure 4.14: Modified Data Entry Screen for Lab Data
61
-~
After the lab specimen has been analyzed and the results are obtained, the field researcher
can use the Visual Basic .NET search tool shown in Figure 4.15 to locate the specimen
with the serial number s/he has entered. In case that serial number is misplaced, he may
also search by User, LocationlD, Kit Type, or MeasurementlD. All of these pull down
menus are populated from the database. Once the search button is pressed, the list box on
the right of the screen is populated with possible serial numbers that match the search
criterion. The user may then select the serial number, and replace it with the results of the
specimen analysis. This data will be replaced in the database, and be ready for display by
the GIS Web Service and ESRI ArcPad.
Figure 4.15: Data Entry Screen to Replace Serial Numbers with Data
62
4.13 Conclusions
The SQL Server Database proved to be the central feature of the entire data collection
system allowing all of the different types of data collection to occur, and be organized
through the ENVITNote Application. All of the data that is collected through the system
is well organized and easily queried. Tests indicate that no data was lost, and that the
SQL Server Push-Pull system proved useful for transmitting data from PocketPCs to the
laptop field server allowing for advanced data processing and sharing. Overall, the data
collection power of the STEFS system is the core of its purpose and its usefulness.
63
CHAPTER 5: GEOSPATIAL DATA INTEGRATION
5.1 Introduction
This chapter explores how to associate location data with other data collected on the
handheld computers and how to display that data on electronic maps. It describes the
Geospatial Data Integration module used by STEFS to relate location data collected by
the GPS sensor with environmental data collected manually by field researchers and
automatically by the Hydrolab sensor.
This chapter is organized as follows. Section 5.2 describes the basic specifications and an
analysis of the Teletype (http://www.teletype.com) GPS PCMCIA card being used in the
system in order to understand what type of accuracy we can expect to be reported by that
sensor. Section 5.3 discusses the preliminary design of using a C#.NET (a Microsoft
programming language, http://msdn.microsoft.com) application to average location data,
and Section 5.4 describes how that application can select the most accurate
environmental data, and build an output table that relates the two data sets. Section 5.5
explains how the output table must be readable by GIS (Geographic Information
Systems). Sections 5.6 and 5.7 of this chapter describe the two methods used in STEFS to
display GIS data both on the PocketPC and on the Internet. Section 5.8 describes how
this module performed during a field testing, and Sections 5.9 and 5.10 discuss the
revisions and conclusions that were made as a result of this field testing.
Before this author joined the STEFS project, there had been a number of technological
choices that had been made and were not subject to change. This chapter and this thesis
64
assume these choices are design constraints that will not be explored in this thesis. Some
of these constraints include choosing ESRI (http://www.esri.com) ArcPad and C#.NET
(http://msdn.microsoft.com) were chosen as the GIS display platforms for the STEFS
system. Throughout this chapter, we then assume that ESRI ArcPad and C#.NET are
fixed criterion in the selection of other components in the wireless system.
For advancements in the GIS map display media of STEFS, refer to "Integrating RealTime Geo-Referenced Data Streaming into Interoperable GIS Web Services," Kolodziej,
2002 and "GIS Web Services using .NET Framework," Tsou, 2002.
5.2 Teletype GPS
GPS testing and correlating are key parameters towards determining the accuracy of the
data that is recorded, and determining how much data we need to average to obtain result
reliability.
We are using a Teletype (http://www.teletype.com) GPS 12911 PCMCIA Card. Teletype
states that the accuracy of its product is 3m to 30m. The product states that it reports
every 0.1 seconds, regardless of weather conditions. The operational temperature and
humidity are respectively 0C-700 C and 5% - 95%. A standard test of GPS accuracy is to
study the variance in reported location on a static (not moving) GPS module that is not
moving.
65
Three hours of GPS reporting were logged using a fixed Teletype GPS card attached to a
PocketPC and ESRI (http://www.esri.com) ArcView software. The actual reporting
frequency is on average 0.5 seconds, as opposed to the 0.1 seconds as suggested by the
manufacturer. During the three hour test, ArcView logged approximately 2800 positions.
This frequency is only about .8 seconds.
In the 2800 logged positions, the maximum discrepancy between
points was
approximately 30m. The maximum discrepancy from the mean point was approximately
19m. The standard deviation from the mean position was 4.67m. Figure 5.1 shows a plot
of all the positions logged by the GPS sensor over 3 hours.
Figure 5.2 shows those same positions in a histogram as they deviate from the mean. For
more information on Teletype GPS refer to, "GPS and Wireless Presentation, M.I.T.,
2001," Spieler, Russell and http://www.teletype.com. For more information on GPS in
general refer to http://www.trimble.com and http://www.gpsscales.com.
3 Hour GPS Test
30 meters
Figure 5.1: Logged Positions
66
Deviation from Mean
2800
O 600
4000200
I
0ILJ
T-
I
I
I
I
A
-
Deviation Range (meters)
Figure 5.2: Histogram of Deviations
5.3 Early Design
Due to the inaccuracies of GPS data shown above, the geospatial data integration was
based on averaging GPS data, and extrapolating the location of each data point from user
input. The original design was to collect location 4ata for both shores of each cross
section of the river (see Figure 5.3 a). Taking the average of these data collections would
return a relatively accurate estimate of where the team was on each shore (see Figure 5.3
b). Because it is unlikely that the data collection occurred exactly at the shore point, the
actual shore points can be found by using the user input width of cross section (see
Figures 5.3). We adjust the GPS averaged points to the actual shore points by moving D
along the line between the GPS averaged points (see Figure 5.3 c). The distance to move
D, is given by:
L-W
2
67
Where L is the distance between the averaged points and W is the width reported by the
user interface for the session.
Once the system has an accurate GPS point for both shores, it is possible to associate
each measurement marked on a sub-section of the cross section. The system simply
divides the width by the number of subsections to obtain the interval width. It then
designates a GPS location to each subsection by moving the interval width times the
interval number away from the shore. Therefore, when the user enters the number of
intervals and the width of the cross-section, each sub-section can be given a GPS point
based on the averaged re-adjusted shore points and the line between them (see Figures
5.3, 5.4 and 4.12).
(a)
(b)
0~
0
Shore B Data
Collection
Shore A Data
Collection
Figure 5.3:
System
Determined
Cross Secti
Line For Data
Shore A
Averaged
Point
a:
b:
c:
Shore B
Averaged
Point
Re-adjusted
shore points
based on
user input
GPS Data Collection
GPS Data Averaging
Re-Adjustment of Shore Based On User Input
/
X
Figure 5.4:
(c)
Cross-Section of River Divided Into Sub-Sections
68
Length = L
5.4 Data Selection
Users can enter multiple data records for the same measurement at the same location.
When this happens it may be difficult to determine which reading the user wants
reported. While all data readings taken will be logged in the database, only one reading
can be displayed for each measurement at a specific location on live displays of the data.
There are two primary intentions a user could have when entering multiple data records
for the same measurement at the same location. One scenario is the old data was incorrect
due to instrument malfunction or human error. In this case the user wants only the new
data reported. A second scenario is that the user wants to be sure he got an accurate
reading at a site and takes multiple readings, desiring to report the average of these
readings.
Because there would be a large amount of overhead associated with maintaining these
intentions for each measurement, the user must specify this while using the Configurator
tool for all readings in the entire field study. Based on this decision, the system will only
use either the most recent data or the average of all data for a location when setting up
live data displays. For all field testing of this system, only most recent data was used for
live display.
5.5 Creation of Output Table
The relational database is a robust means of collecting not only all the data, but all of the
conditions surrounding the data collection. However, the relational database is not in the
69
right format to display data on a typical GIS display. Data is stored in the UI Record and
Instrument Record tables without any geospatial data information as discussed in Chapter
4 exhibited in Figure 4.3. The GPS Records are stored in a completely separate table. To
display GIS data using a typical GIS data display, the data must be in the following
format:
X
Y
Measurement 1
Measurement 2
Measurement 3
Measurement N
The original method of creating an output table was to use a C#.NET application running
on the field laptop to process the data and create an output table. This application would
process all data it had obtained from the PocketPCs every minute. The following steps
need to occur to ensure that all data at all points entered are displayed:
1.
After the PocketPC application completes a GPS data collection for a
shore, it averages that data and enters it into the Shores table.
2.
The first thing the Windows application on the laptop does is import
this shore data and moves the averaged points to the actual shore
points using the cross-section width as described in Section 3 of this
Chapter.
3.
It then maps each UIRecord to a GPS coordinate based on the shores
and the width interval.
4.
It clears everything from the previous output table to be sure it is
writing only unique entries.
5.
Next it fills in the table with the distinct GPS coordinates created from
UIRecord.
70
6.
Finally it reads through each value in UIRecord and Instrument Record
and fills it in the table next to the appropriate GPS point.
Unfortunately, the C#.NET program was never fully debugged. As a result, no data was
actually displayed live during either field test. The method used in Section 9 of this
chapter describes an alternate method of creating the output table. This method has been
created and debugged after the field tests and is currently operational.
5.6 Display through GIS Web Service
The GIS Web Service takes the most recent data in the web server's database and
displays it on a background image on demand (see Figure 5.5). Once the data is available
in the format (shown in Section 5) for display on a GIS map, the GIS Web Service is able
to take this data, translate GPS positions to pixels, and display shades of color overlaying
the background image indicating the range of readings at that point. The Web Service
allows the user to request a specific data set for a specific measurement. It then generates
a bitmap image of the background map with shaded colors representing data at
appropriate pixels (GPS locations). It also creates a legend indicating which shade of
color represents which range of values. Finally, it displays these images on the user's
browser.
71
Shttp://ernvitwb.niit.edu/GISWebApplication/tocateapoinit.aspx
File
Edit
Back
Ar
View
Favorites
Tools
-Microsoft linternet Explorer
Help
Search
-
Favorites
Media
V
http i/envitweb.mit.eduIGIWebApplicaton/locateapoint.asp
Go
Ur kc
GIS
Web Services
To view I certam p
sarmeter, select
onec f-rm the p ai-reter pldv
*
pH3m
To locate a specific point, enter the
coord ates mto the text boxes and
click oubrit
Enter Longitude
I
Enter Latitude
A-"
To zoom it on a location, click that
locaticn on the map
View Data
0-2
i2-4
m4-6
6-8
8-10
Done
* nernet
Figure 5.5: GIS Web Service, Australia Field Study
5.7 Display through ESRI ArcPad
One of the major benefits of using a system that can display live data is that researchers
can share data live in the field and modify their study based on this data. Once the data is
available in the format (shown in Section 5) for display on a GIS map, ESRI
(http://www.esri.com) ArcPad can be programmed using Visual Basic Scripts to accept
data and display it on a background image. The scripts simply place the data points on a
geo-referenced background image (see Figure 5.6). Unfortunately, due to time
constraints, we were not able to program these scripts to be compatible with a SQL
Server Database, nor were we able to program the ENVITNote application to provide a
72
Figure 5.6: Display of Data Using ESRI ArcPad
copy of the output table in a compatible format for these scripts to read. Therefore, while
ESRI ArcPad was used to verify the proper function of the GPS sensors, it was not used
as a live display tool for researchers to share data in the field. Researchers were however
able to view some data using the GIS Web Services and Microsoft Pocket Internet
Explorer (a standard browser available on the PocketPC). This was only possible due to a
locally generated GIS Web Service on the field laptop available only to viewing by the
PocketPCs with WLAN.
5.8 Newcastle, Australia Study
The GIS Web Services were not available for the Cambridge Field Test. The first time
they were used was during the Newcastle, Australia study. Because we were unable to
have the C#.NET data processing application debugged on time, the Web Services were
73
not actually live during the field test. Instead, at the end of each day, data was transcribed
by hand from the database to the GIS Web Service's output table on the Web Server
using remote log-n. While it was not live and automatic as had been desired, it did show
that data could be displayed on the Internet while the field study taking that data was still
underway. Users of the service were able to see the data collected in the field the
previous day, and locate exactly where the field teams had been on a map.
5.9 Revisions
As was mentioned in Section 5 of this Chapter, the original method of creating an output
table was not debugged, and was eventually discarded as a feasible means of sorting the
data in the tools of this thesis. As a result, a new method of sorting the data had to be
created. The new method is far simpler than the C#.NET method, but has limitations. It
does not attempt to map each value to a GPS point representing a sub section of a cross
section. It only maps average data for each cross section at the center point of the two
shores for that cross section. This makes the process simpler because we know how many
points we will have before we begin the field study. Each LocationIlD corresponds to a
cross section and only one GPS point. These Location IDs are assigned prior to field
study departure. As a result, we are able to fill in the output table using the PocketPC
application. This involves minimal additional calculations. Basically, every time a Shore
GPS location is calculated, the system updates the GPS location for that LocationlD.
Similarly, anytime a UIRecord or InstrumentRecord is entered, the system recalculates
the average for that measurement over the cross section and records the new average for
that measurement and LocationlD in the output table. The data from the output table is
74
"pushed" back to the laptop (See Section 4.8), with the rest of the tables and integrated
with the output tables from the other PocketPCs. This data is now ready for display by
the GIS Web Services (Section 6) and ESRI ArcPad (Section 7).
5.10 Conclusions
The data collected by STEFS is not in the correct format to display on a GIS display. The
original method of integrating the Geospatial Data to process it into the correct format for
GIS display was to use a C#.NIET application on the laptop. Implementing this C#.NET
data processing application proved more difficult than originally anticipated. As a result,
the data display capabilities of STEFS were unfortunately not available during the field
tests. The revised method of Geospatial Data Integration is much simpler than the
C#.NET method and occurs locally on the PocketPC. The final system accomplishes the
system goal of displaying the data in near real-time on the Internet, using this new
method of Geospatial Data Integration.
75
CHAPTER 6: COMPARISON OF STEFS WITH
SIMILAR SYSTEMS
6.1 Introduction
This chapter seeks to explore how this solution compares with other solutions. It attempts
to compare STEFS with similar systems through a cost-benefit analysis. Section 6.2
describes the benefits of STEFS as an environmental field data collection tool. Section
6.3 analyzes the costs of its development and deployment. Section 6.4 discusses
similarities and differences with other systems. Finally, Section 6.5 explores alternative
uses of the technology used in STEFS.
6.2 Benefits of STEFS
There are three main features of the STEFS field data collection system that make it
superior to the traditional field study: automated data entry, near real-time data sharing
amongst field researchers, and near real-time data sharing to the Internet. The automated
data entry feature of STEFS will result in less human errors that might have previously
occurred during transcription of data, or even manual reading of instruments and maps.
The automated data entry will also lead to less man-hours in the field because many
measurements (especially GPS) are taken without the need for human intervention. The
automated data entry also means there is no need to transcribe data from written notes to
a computer for analysis and legibility. This eliminates the need of a human task, which
was previously required during a field study.
76
Sharing data near real-time amongst field researchers will also save time in the field.
Researchers will not have to wait until they are back to a computer to analyze the status
of the field study. This means that if they are collecting data at a site and realize an
interesting or important discovery, they can continue to take more data at that site before
moving to another site to ensure they gather the data they need to analyze that discovery.
Alternatively, if one researcher realizes a discovery and another researcher notices little
or no data of interest at their site, the researchers can modify their data collection plans to
study some sites in greater details than other sites.
Sharing data in near real-time on the Internet also saves time and allows for greater
flexibility in the project. Typically, a sponsor of a field study does not see the results of
the study until well after the study is completed. Sharing data in near real-time on the
Internet allows the sponsor to see the data in near real-time, and order modifications on
the study while the researchers are still in the field. It also allows data analysts to begin
studying and processing the data while the study is still occurring, allowing for a shorter
time period before results can be found. Finally, because the PocketPC data is sent back
both to the field sever, and to the web server, three copies of the data are maintained at all
times. This provides back-up in case data is lost on any machine.
6.3 Costs of Development and Deployment
Product development costs can be broken into the time that people put into building the
system and the equipment they used to develop the system. Between Professors,
Doctoral, Meng, and Undergraduates students, more than 6600 man-hours were put into
77
the development of STEFS. Using the pay scales shown in Table 6.1, the 6600 man-hours
translates to $183,820. The equipment purchased to develop the system totaled $24,585.
This leads to $208,405 total development costs, not including the valuation of time and
money spent on testing it in Australia.
Level
Number
Professors
Doctoral Students
Meng Students
Undergraduates
4
2
6
13
Value per
Hours
Per Week Hour
4
$100
30
$50
40
$30
15
$12
Total Per Week
Weeks
Total Work
Six Loaded PocketPC
System
TOTAL
Total Per
Week
$1,600
$3,000
$7,200
$2,340
$14,140
13
$183,820
$24,585
$208,405
Table 6.1: STEFS Development Costs
Product deployment costs (shown in Table 6.2) can be alternatively broken down into the
fixed costs of having a base station, and the variable costs of each deployment team, as
different field studies will require a different number of field teams. As shown, the
Hydrolab water quality sensor is the bulk of the deployment costs. The Hydrolab is the
only interchangeable item in the system. One may purchase alternative sensors that
collect water quality data for different costs. Therefore, it is reasonable to analyze the
costs with, and with out, the Hydrolab. So a three-team system with Hydrolabs would
cost around $18,000 without software (see Figure 6.2 = Fixed Cost plus 3 times variable
costs). A three-team system with out Hydrolabs would cost around $9,000 without
software.
78
Variable Costs
Fixed Costs
Item
Cost
Item
Cost
Web Sever
$1,500
PocketPC
$400
Laptop
$1,500
PCMCIA Pack
$200
Wireless Router
$1,200
GPS Card
$500
Wireless Card
$100
Wireless Card
$100
1-Watt Amplifier
$575
Hydrolab
$3,000
15dB Antenna
$210
Case
$50
TOTAL
$5,085
TOTAL
$4,250
Table 6.2: STEFS Deployment Costs
6.4 Similar Systems
While there are many systems which allow for environmental data collection on a
Windows based system, there are very few that allow for environmental data collection
on a PDA based system. To the author's knowledge, there are only two systems which
allow users to enter environmental data through a PDA: Environmental Science Research
Institute's
(ESRI
http://www.esri.com)
ArcPad,
and
Rockware's
(http://www.rockware.com/) Field Data Recorder (FDR).
The primary PDA-based system used in practice in the environmental data collection
field is Rockware's (http://www.rockware.com/) FDR. While FDR has a user interface
for data collection using an MS Access Database with back-up and GPS/GIS inputs, the
system
lacks many
of the
features that
STEFS
has. Primarily,
Rockware's
(http://www.rockware.com/) system is neither live nor automatic. Their system does not
79
take automatic input from sensors, is not wireless, and cannot have multiple users
transmitting data simultaneously. In addition, Rockware (http://www.rockware.com/)
relies on MS ActiveSync and MS Access as the backbone of their system where as
STEFS uses HTTP and SQL Server CE, allowing multi-thread data transmissions so that
multiple PocketPCs can communicate simultaneously. Table 6.3 compares STEFS to
FDR.
Yes
Yes
SQL Server CE
MS Access
Yes
No
-Manual
-Yes
Yes (HTTP)
IAuto
Yes
Yes
No (ActiveSync)
Manual
Yes
Yes
Yes
Table 6.3: STEFS Comparison to FDR
ESRI'S (http://www.esri.com) ArcPad also allows for environmental data entry.
ArcPad's focus is on displaying collected data on an electronic map. Users can click
directly on a map and using layers, enter the data for a specific measurement at any point.
Integration with GPS sensors allow the user to know where they are and enter the data for
that location. ArcPad does not make use of wireless technologies. It does have an
abundance of Windows-based and Web-based applications which can interact with data
collected in ArcPad such as ArcIMS and ArcView. STEFS main benefits over ArcPad is
80
the ability to maintain verification records. STEFS is capable of validating all data as it is
entered and maintaining records on who entered the data and using what instruments.
Finally, ArcPad does not readily lend itself to connecting sensors (other than GPS)
directly to the PDA for automated input where STEFS makes use of automated inputs
from Hydrolab water quality sensor.
6.5 Alternative Uses of STEFS Technology
The product has the potential to be adapted for numerous other data collection efforts.
While the system is specifically tailored towards GIS data, it can be used to collect and
share data of any kind. Some application domains are:
*
Shipping Logistics;
" Inventory Management;
" Emergency Management;
" Environmental Emergency Management;
" Military Coordination;
" Vehicles Dispatching;
" Public Transportation Monitoring;
" Construction Management;
" Infrastructure Management;
*
Equipment Monitoring;
" Medical Patient Management; and
" Utilities Management.
81
ACKNOWLEDGEMENTS
The ENVIT student group at MIT designed this system under the direction of Enrique
Vivoni and Richard Camilli. The project was funded by a grant from the Microsoft ICampus. The Sentient Vehicle Project at MIT sponsored the SafeRide adaptation under
the direction of Professor Ismail Chabini. It was completed in conglomeration with the
ShuttleTrack Microsoft I-Campus Project, MIT Transportation Office, and with the help
of the MIT Earth Atmosphere and Planetary Sciences Department.
Concept of Mobile Field Notebook Application On PocketPC
Enrique Vivoni (ENVIT President) and Richard Camilli (ENVIT Vice President) developed the
concept of a Mobile Field Notebook Application on a PocketPC.
Assembly of a I-Campus Project, Undergraduate Class, Graduate Researchers and
Advising Staff
Enrique Vivoni (ENVIT President) and Richard Camilli (ENVIT Vice President) coordinated the
assembly of the project team. Enrique Vivoni and Richard Camilli directed Eric Lau, Kevin
Richards, Neeraj Agarwal, Ching-Huei Tsou, Russell Spieler, and Kris Kolodziej as the project
integration team for the entire project.
Design and Development of ENVIT Database
Russell Spieler, Neeraj Agarwal, and Ching-Huei Tsou developed the ENVIT Database with
assistance from the ENVIT Officers and Advising Staff.
Design and Development of Wireless Systems
Russell Spieler developed the wireless systems with assistance from Richard Camilli (ENVIT
Vice President).
82
Design and Development of ENVITNOTE Graphical User Interface
Enrique Vivoni (ENVIT President) lead Amy Watson, Kim Schwing, and Nancy Choi in
development of the ENVITNote GUI with guidance and development from Russell Spieler,
Neeraj Agarwal, Ching-Huei Tsou and Kris Kolodziej.
Design and Development of ENVIT Configurator Graphical User Interface
Kris Kolodziej designed and developed the ENVIT Configurator with assistance from Russell
Spieler.
Field Testing In Cambridge and Australia
The MIT Parsons Lab funded the Cambridge and Australia Field Tests under the direction of
Professor Sheila Frankel and coordination with Enrique Vivoni (ENVIT President) and Richard
Camilli (ENVIT Vice President). Kevin Richards and Eric Lau completed land use analysis to
determine which sites were best for sampling and completed analysis and modeling of the data
collected. The entire ENVIT student group contributed to the field testing including: Enrique
Vivoni, Richard Camilli, Neeraj Agarwal, Kevin Richards, Ching-Huei Tsou, Russell Spieler,
Eric Lau, Kris Kolodziej, Anna Leos-Urbel, Trisha McAndrew, Laura Rubiano-Gomez, James
Brady, Brian Loux, Linda Liang, Aurora Kagawa, Arthur Fitzmaurice, Chrissy Dobson, Lisa
Walters, Amy Watson, Kim Schwing, and Nancy Choi.
The University of Newcastle lent space and guidance during field preparations and testing.
Professors Gary Willgoose, Jetse Kalma, and PhD candidate Andrew Krause were of great help.
The University of New South Wales also lent guidance to the field studies from David Waite and
83
members of his lab group. The people at the Department of Land and Water Conservation,
DLWC, also helped in obtaining the GIS data layers relevant to the field study area.
Concept of adapting ENVIT to Track MIT SafeRide
Professor Ismail Chabini developed the concept of adapting ENVIT to track on SafeRide.
Russell Spieler organized and implemented the adaptation.
Other Acknowledgements
Significant work, not mentioned in this paper, was completed by MIT undergraduates. Arthur
Fitzmaurice, Chrissy Dobson, and Lisa Walters under the direction of Richard Camilli and
Neeraj Agarwal worked on integrating the Hydrolab water quality sensor with the PocketPC.
Brian Loux, Linda Liang, and Aurora Kagawa under the direction of Daniel Sheehan and Russell
Spieler worked on integrating the GPS sensor with ESRI Arcpad and displaying data on ESRI
Arcpad. Trisha McAndrew, Laura Rubiano-Gomez, and James Brady worked under the direction
of Richard Camilli and Professor Shiela Frankel to research and modify field equipment to be
brought on the field study.
General ENVIT Acknowledgments
Special thanks goes to the entire MIT ENVIT Student Group including Officers: Enrique Vivoni
(President) and Richard Camilli (Vice President); Advisors: Daniel Sheehan, Sheila Frankel,
Mario Rodriguez; Masters of Enginering Students: Neeraj Agarwal, Kevin Richards, Ching-Huei
Tsou, Eric Lau, and Kris Kolodziej; Undergraduate Students:
Anna Leos-Urbel, Trisha
McAndrew, Laura Rubiano-Gomez, James Brady, Brian Loux, Linda Liang, Aurora Kagawa,
84
Arthur Fitzmaurice, Chrissy Dobson, Lisa Walters, Amy Watson, Kim Schwing, and Nancy
Choi; and Undergraduate Researchers: Keyuan Xu, Rose Liu, and Kan Liu.
85
REFERENCES
1. Agarwal, Neeraj; Lau, Eric, Kolodziej, Kris; Richards, Kevin; Spieler, Russell; Tsou, ChingHuei. EnviroCom FinalPresentation,M.I.T., 2002.
2. Agarwal, Neeraj; Lau, Eric, Kolodziej, Kris; Richards, Kevin; Spieler, Russell; Tsou, ChingHuei. EnviroCom FinalReport (2002).
3. Agarwal, Neeraj; Kolodziej, Kris; Richards, Kevin; Spieler, Russell; Tsou, Ching-Huei.
EnviroCom Presentationto EnvironmentalSystems Research Institute (ESRI), Inc.,
Redlands, CA, 2002.
4. Agarwal, Neeraj; Lau, Eric, Kolodziej, Kris; Richards, Kevin; Spieler, Russell; Tsou, ChingHuei. EnviroCom Project Proposal(2001)
5. Agarwal, Neeraj; Lau, Eric, Kolodziej, Kris; Richards, Kevin; Spieler, Russell; Tsou, ChingHuei. EnviroCom Project ProposalPresentation,M.I.T., 2001.
6. Agarwal, Neeraj; Lau, Eric, Kolodziej, Kris; Richards, Kevin; Spieler, Russell; Tsou, ChingHuei. Software Tools ForEnvironmental Field Studies FinalReport (2002).
7. Boling, Douglas. Programming Windows CE 2nd Edition, 2000.
8. Bowmen, Emerson, and Darnovsky. The PracticalSQL Handbook Fourth Edition, 2001.
9. Camilli, R., Rodriguez, M.A., Sheehan, D.D. and Entekhabi, D. Development of mobile
computing applicationsfor hydraulics and water qualityfield studies. Hydraulic
Engineering Software IX. WIT Press. Montreal, CA. (2002)
10. Deitel,Deitel; Nieto,Yaeger; and Zlatkina. C# How to Program,Introducing.NET, 2002.
11. Dobson, Rick, ProgrammingAccess, 2000.
12. Grattan; and Brain. Windows CE 3.0: Application Programming,2001.
13. Halverson, Step by Step Microsoft Visual Basic 6.0 Professional, 1998.
14. Halvorson, Michael. Learn Visual Basic 6.0 Now, 1999.
15. Kolodziej, Krzysztof (Kris). IntegratingReal-Time Geo-Referenced Data Streaming into
InteroperableGIS Web Services. M.Eng./M.C.P. thesis, Massachusetts Institute of
Technology, 2002.
86
16. Lau, Eric. Hydrologic Modeling of the Williams River with tRIBs: Development and Testing
of a Novel User Interfacefor the TIN-Based Hydrologic Model. M.Eng. thesis,
Massachusetts Institute of Technology, 2002.
17. Muench, The Windows CE Technology Tutorial, 2000.
18. Murray, J. Inside MS Windows CE, 1998.
19. Richards, Kevin. Hydrologic and Water Modeling with HSPF: Utilization of Datafrom a
Novel Field Data Collection System and HistoricalArchivess. M.Eng. thesis,
Massachusetts Institute of Technology, 2002.
20. Seroshek. The Pocket PC, 2001.
21. Spieler, Russell. GPS and Wireless Presentation,M.I.T., 2001.
22. Tsou, Ching-Huei. GIS Web Services using .NET Framework.M.Eng. thesis, Massachusetts
Institute of Technology, 2002.
23. Tsou, Ching-Huei. SQL Server CE Push Pull Model. Private communication, 2002.
24. Vivioni, Enrique. Field Data Streaming Presentation.M.I.T., 2002
Web Sites:
http://envitweb.mit.edu
http://www.mobileplanet.com/
http://msdn.microsoft.com
http://www.motorola.com
http://www.compaq.com
http://www.oriconowireless.com
http://www.dell.com
http://www.rockware.com/
http://www.esri.com
http://www.solutions4sure.com
http://www.gpsscales.com/
http://www.soti.net/
http://www.hydrolab.com
http://www.teletype.com
http://www.hyperlinktech.com
http://www.telstra.com.au
http://www.microsoft.com
http://www.Trimble.com/GPS/
http://web.mit.edu/envit/www
http://www.voicestream.com
http://www-2.cs.cmu.edu/pebbles/
87
GLOSSARY
802.11b - A wireless data transmission protocol that transmits data at a rate of 11
megabits per second on the 2.4 gigahertz radio frequency.
C#.NET - C# is a programming language released in 2001 by Microsoft. It runs on the
.NET platform (see .NET).
CDPD (Cellular Digital Packet Data) - A system that adds to traditional digital
wireless voice technologies in the US. It offers data rates of 19200bps and per kilobyte
billing (as opposed to per minute billing).
ENVIT (Environmental Information Technology) - A Massachusetts Institute of
Technology Association of Student Activities recognized student group dedicated to use
of information technology for environmental purposes.
ENVIT Configurator - A Visual Basic .NET application, running on a Windows
operating system, used to pre-configure the ENVIT database with equipment and people
involved with a project before the actual field study.
ENVITNote - An Embedded Visual Basic application, running on a PocketPC, used to
enter data into and transmit data from the PocketPC.
ESRI (Environmental Studies Research Institute) - A company in California whose
products include Geographic Information Systems software for environmental field
research.
eVB (embedded Visual Basic) - eVB is a programming language released in 2001 by
Microsoft. It runs on the PocketPC platform (see PocketPC).
GHz (Gigahertz) - A frequency of a billion Hertz
GIS (Geographic Information Systems) - Any system which allows for association of
experimental or recorded data with geographical location data.
GPRS (General Packet Radio Service) - A system that adds to traditional digital GSM
wireless voice technologies. It offers data rates of 64kbps and per kilobyte billing (as
opposed to per minute billing).
GPS (Global Positioning Systems) - GPS is a constellation of 24 satellites which allows
for worldwide navigation using radio receivers on the ground.
GSM (Global System for Mobile Communication) - GSM is the primary wireless
transmission medium in Europe, Asia, and Africa with limited build out in the US.
88
GUI (Graphical User Interface) - A graphical user interface is the part of a software
application which allows the user to interact with the software.
iPaq - A personal digital assistant (see PDA) made by Compaq running the Windows
PocketPC (see PocketPC) operating system.
iRDa (Infra Red Data Association) - A data transmission protocol that uses infrared
light.
Mbps (Megabits per second) - Mbps is a rate of data transfer of a million bits per
second.
MIT - The Massachusetts Institute of Technology located in Cambridge, Massachusetts
where this paper was written and the research for this thesis conducted.
.NET - NET is a set of Microsoft software technologies for connecting the users' world
of information, people, systems, and devices.
Orinoco COR-1100 - A device called a wireless router, made by Orinoco, which can
communicate with many mobile computers simultaneously using 802.11 b (see 802.11 b).
Orinoco Silver 802.11b Wireless PCMCIA Card - The Silver 802.1 lb Wireless
PCMCIA Card is a PCMCIA card developed by Orinoco to transmit data from its host
device wirelessly to another 802.11 b receiver, such as the Orinoco COR-l 100.
PCMCIA (Personal Computer Memory Card International Association) - PCMCIA
is a standard for small, credit card sized devices to add features, ports, and / or memory to
a computer.
PCMCIA Expansion Pack - A sleeve which holds the iPaq and a PCMCIA card,
allowing the two of them to communicate through metallic contacts and conduits.
PCMCIA Dual Expansion Pack - A sleeve which holds the iPaq and two PCMCIA
cards, allowing the two of them to communicate through metallic contacts and conduits.
PDA (Personal Digital Assistant) - A PDA is a handheld computer that can be
connected to desktop computers to upload and download information.
PocketPC - A Microsoft Windows Operating System designed to run on PDAs (see
PDA).
SafeRide - A free shuttle bus service that provides safe transportation for MIT students
between their dorms and campus.
89
STEFS (Software Tools For Environmental Field Studies) - A system of hardware
and software used to collect environmental and positional data on a PDA and transmit it
back for processing and distribution to the Internet.
VB.NET (Visual Basic .NET) - Visual Basic is a programming language by Microsoft.
It runs on the .NET platform (see NET).
WLAN (Wireless Local Area Network) - A network connecting a group of computers
over a small area using high frequency radio waves as the communications medium.
90
APPENDIX
Wireless Funding Proposal
STEFS Meng IT Project
In order to seamlessly share data amongst scientists, both in the field and at home,
it is necessary to develop a wireless communications network. We intend to implement
data transfer from the PocketPC to the World Wide Web, and ideally this data will be
instantaneously available at a workstation for processing, manipulation, and output. This
network will transmit data from the PocketPC to a field laptop, and from the field laptop
to a server via wireless modem or wireless Local Area Network. Designing this network
will necessitate tradeoffs between data processing capabilities, cost, wireless coverage,
and necessary equipment in the field. Due to funding restrictions, this proposal has been
revised and the overall cost of the project was cut by almost $2000.
I!,
-
II...))))))....
1-,
I
VOW
I
T
40-OMM"
Envisioned Hardware Architecture
91
Ipas! to Field Laptop Connectivity ($2100)
After careful consideration of wireless options for the STEFS project we have
chosen the ideal solution for data transmission between Pocket PCs and a lap-top and
between the lap-top and the main server back at MIT. We propose to use the Lucent
Orinoco COR- 1100 (848591152) and Orinoco PC Card FCC - Silver (848441481) to
transmit data over 802.11b protocol from the PocketPC's to the field laptop. This product
is the only product which allows for wireless communications from the field. After
studying wireless service plans in Australia, none (with the exception of Satellite Phones)
has solid service in the area we will be investigating. Normal 802.1 lb data access points,
such as the type recently deployed around MIT's campus, only have a range of about 300
feet. Even more powerful standard access points only allow for 3000 feet maximum.
Investigators will be traveling well over a mile from the field laptop with their
PocketPCs. The Orinoco COR- 1100 is the only WLAN product that has enough range
(16 miles) to reach our investigators in the field. To use this product we need Orinoco
Wireless PC Cards in each PocketPC. To use these PC Cards in conjunction with the
Teletype GPS cards (already in use) we will need the Dual-Slot PC Card Expansion Pack
for each PocketPC.
92
The proposed spending is as follows (www.nxgenstore.com) 1-800-860-4411:
1 x Lucent Orinoco COR 1100 (848591152)
$1,21 6.99
gfe~eefl2
1 x Lucent Orinoco COR-1100 (848591152)
$1910 0.00
ardFCC
Silve(848441481)
3 x LucentOrinoco PCCard FCC
SilveF (48441481)
6xLucent OinocoPC
$89.95 each
$539.70 total
$89.95 eaeh
$269.85 total
4 x Lucent Orinoco PC Card FCC - Silver (848441481)
$72.64 each
$290.56 total
1 x 11inch IEEE Jumper / Pigtail N-Female (WRJCMW11F)
$39.17
1 x HyperGain 15DB OmniDirectional Antenna (HG2415U)
$201.00
Approximately (including tax and shipping)
$1650
The proposed spending is as follows (www.compaq.com):
6 x 216198 B21
3 * 216198 B21
3 x 170338-B21
Dual Slot PC Card Expansion Pack
$199.00 each
Duial Slot PC C~afd ExAnon Pack
$1191.00 total
$199.00 each
$597.00 total
$150 each
$450 total
PC Card Expansion Pack
$2100
Total for PocketPC to Field Laptop
93
Field Laptop Web Server Connectivity ($1075)
GSM/GPRS vs Satellite
As mentioned earlier, the only wireless service available in the area we will be
investigating will be with dependable coverage is Satellite phones provided by
GlobalStar. GSM / GPRS coverage by Telstra may, however, be reasonable in the Hunter
Watershed area for a proof of concept.
Telstra GSM Coverage Area
(Scaled to Size of
Complimentary Map)
(See Appendix 1.1 for Full Size
Coverage Map)
Hunter Watershed Area
As shown the GSM coverage area may be enough to have coverage some of the
time for the field laptop and allow for some proof-of-concept testing in Australia.
Satellite phones have ubiquitous coverage over all areas. The following table will allow
us to analyze the benefits of each system.
Feature
Coverage
Price
Usage
Extra Use Cost
Use Cost in Australia
Data Rate
GSM/GPRS
Satellite
Possibly Spotty
100%
$1096.90
$1624 (see Appendix 1.111)
10MBs/month
50mins/month
$4.00/MB
$1.39/min
$10.00/MB x 10MB
$2.39/min x 40mins
= $100.00
= $95.60
w/ GPRS
to
64kbps
Up
19.2kbps
Satellite vs GSM/GPRS Data Connectivity
Although there are some benefits to using a satellite phone, the cost difference is
substantial. It is therefore recommended that we use GSMIGPRS service provided by
Telstra (900MHz) in Australia and VoiceStream (1900Mhz) in Boston (See Appendix 1.11
for VoiceStream's Boston Coverage Map).
94
Field Laptop Web Server Connectivity
Motorola P280 vs Ericsson T28W
Since we are currently in the Boston and need to test our product in the Boston,
we will have to purchase our phone and our service in Boston. VoiceStream (the main
carrier of GSM/GPRS in Boston) only offers two data-enabled phones which will operate
on both the 1900MHz and 900Mhz systems. These are the Ericsson T28W and the
Motorola P280 (aka the Motorola Timeport 280). The following table compares the two
phones.
Feature
Data Connectivity
Network Capability
Price for
Equipment and Service
Data Rate
Ericsson T28W
Directly to Phone
(or PocketPC)
GSM
$500 (see Appendix IV)
Motorola
Via Attached Infrared Modem
GSMIGPRS
$1096.90
9.6kbps
Up to 64kbps w/ GPRS
Ericsson T28W vs Motorola P280
The proposed spending is as follows (1-888-STREAMS):
1 x Motorola P280 (Timport 280) GSMIGPRS Tri-Mode (1900/1800/900MHz) Phone
$169.99
(VoiceStream)
1 x Motorola Data Connectivity Kit
Included
1 X SIMM1X Car=09
12 x 1 Month VoiceStream Service Charges (1OMB/60mins/500mins/month)
$59.98/month
$719.76 total
(VoiceStream)
10 x Estimated MB while in Australia
$10/MB
$100 total
(VoiceStream)
Total for Field Laptop to Web Server
$1000
+ tax and shipping
Approximately
$1075
Customer Service: 1-800-937-8997 ****
Order # 513728
95
Conclusion
Thank you for your consideration of these projects. These purchases will be
beneficial not only to the 4 MEng IT students involved with STEFS, but also the 2
MEng Environmental students and the 13 Environmental Engineering
undergraduates. We would like to purchase these products as soon as possible in
order to ensure we can properly integrate them before the rapidly approaching trip
to Australia.
The total reduction in cost from the original version is almost $2000.
Sincerely,
Russ Spieler
w/ recommendations by Kan Liu
MEng IT
For the STEFS MEng Team
96
Appendix 1.1
Full Size Telstra Coverage Map
GSM/GPRS In Australia
97
Appendix 1.11
Full Size VoiceStream Coverage Map
GSM/GPRS In US
Whenever, Wherever
NATIONWIDE COVERAGE AREA
Od*"
ctvli0'
_-
,r
GIedn
eent
saaoyr
Cuunmnidon
No
.ncra."
MotSt
+ilefik
*
*
Do,
notDs
.4'.0'ay
Lek
57tt
tne
Soe Ponecla
Manm
P.sr
socpp
M*na
%Y.do
ta
-O
e
tourste C.;
1.
C.)_"
f
le meln
o
-
c
I~ a
Ld,_nresrn
od$tLoukfnlt%, I4eeY
Al
on
-tn
Crif
tan
igd
e*
cityay
r
srt1e
5
or
n DC
"
DC
-- -,
1
ed4W
-uei
.ail
Patk
*
*
sio Okla
rt
.,
Atvuqerue
L
s
ho tatr
wesrc
Re-U;*h
4
a
Loeth,..e,.2
sn
mai
ceda
fti
"Th
'C",'
Geudo
.,. Tvl w
klseq
#QWAV
ss'.ierey
~
~ead
*
W
.
t
WeliaDe go
eu t~ P hlobamnK
waki,
whap,
ual
nESiPi
N
-
San
LN
0
comic
obne'
.rt
m
'Sit
f
~
A
L i
ttif <osu.rrFJnlMy
C -ia
ariM
EaleNshlP.K
1; -y
-Illc
n
Aaittita
ih
.f
ironia
0-w
okaecleJ
nJ.etre~~et%
xI
Free Digital Roaming Coverage Area
t
iZ
0.4
ti
to. at* roams
Newals
.,,Pbl
Ottan
ireterbca
CWS
Sh-*'t
inte
u
t
-i
i~j~~t~t
~
~ ~99~csl#
jo.
,Iiiti
rm
tnfd
Atcw$
Ortoen
4to
t
faa
ove,.
mapl4tAasnt
Mlk
o
iotit
et
h
'a
0 * ,1 p d
,,
mmi.5 .4ttls
rul~
001 .
Caoh t~i55e
Iet
HIM.e
Stit
~t5n
Faura
tar
-i 0
Minutes used to male or receive calls while tou are m
LJ this area will be deducted from your included miutes.
Toll-Free Calling Area
You may make calls to anywhere in this tull-reee callng
am jrein( ding Ahtsku). from your free digtz] roanung
coverage area and pay no long distance.
I OTE.
c me.
maps am
primted for
rosni-1
purpses
oy.
Atuac
ric
-
-
emn,
qUaand
Avitaiity ma
98
-y.
1nki
tiko
p.nidd
h uani.i-ts
A
~
e
F
raiaiv
it
ss s.n
1
uaai.Ar
ttn
nf
tsce
A
n
A
Appendix 1.111
Pricing for Qualcomm GSP1600 Satellite Phone ($1624)
The only Satellite phone for use in both the US and Australia (as well as around
the world for future uses of this product) is the Qualcomm GSP1 600 Tri-Mode Handset with
available service from Globalstar. With the GDCKIT Data Cable Kit, this phone can connect
to the laptop (via serial port) and send back data to our server from virtually anywhere on
the planet. We will be able to test it in the US and use it in Australia.
The proposed spending is as follows (all from Globalstar 1.877.SAT.PHONE):
1 x Qualcomm GSP1600 Tri-Mode Handset
1 x GDCKIT Data Cable Kit
1 x Activation Fee
1 x Shipping
4 X 1 Month Globalstar Serviee eharges (100mins)
$899.00
$69.95
$50.00
$20.00
$839.65total
$69.95/mont
$489.65 total
$2.39/min
$95.60 total
7 x 1 Month Globalstar Service charges (50mins)
40 x Estimated Minutes while in Australia
Total for Field Laptop to Web Servee
Total for Field Laptop to Web Server
$1624.20
Appendix I.IV Price for Ericsson T28W ($500)
1 x Ericsson T28W GSM Tri-Mode (1900/1800/900MHz) Phone
1 x Ericsson Infrared Modem
1 x SIMM Card
12 x 1 Month VoiceStream Service Charges (60mins/500mins/month)
$79.99
(VoiceStream)
$59.95
(VoiceStream)
$30???
$19.99/month
$239.60 total
(VoiceStream)
40 x Estimated mins while in Australia
$0.44/min
$17.60 total
(VoiceStream)
Total for Field Laptop to Web Server
$427.14
+ t ax and shipping
Approximately
$500
99