1
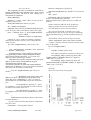
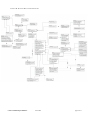
Analyzing IP Traffic Captured by Netsniff
Julie-Anne Bussiere, Jason But
Centre for Advanced Internet Architectures. Technical Report 050617A
Swinburne University of Technology
Melbourne, Australia
[email protected], [email protected]
Abstract- This paper tends to be a complete user manual to
analyse IP traffic captured by NetSniff over a FreeBSD
machine. Netsniff is a multi-network-layered real-time traffic
capture and analysis tool developed as part of the ICE3 project.
logfileparser is a complementary tool which parses the log files
produced by NetSniff and stores data in a database. This
document helps installing and using NetSniff and logfileparser
as well as the other software needed to perform accurate
analysis (MySQL and SQLite(3) databases tools, R).
Keywords- Netsniff, logfileparser, database, IP traffic.
I.
INTRODUCTION
NetSniff is a multi-network-layered real-time traffic
capture and analysis tool developed as part of the ICE3
project being run out of the Center for Advanced
Internet Architectures (CAIA). NetSniff uses the PCAP
library [11] to capture network traffic on a network
interface or from a tcpdump [11] formatted file and
parses the captured traffic at multiple network layers to
produce a detailed set of statistics. Logfileparser is a
complementary tool creating a database and filling it
with the data captured by NetSniff. This database file
can then be queried to obtain relevant statistics and
generate graphical results using the R [7] software.
This paper describes the procedures involved to
install over a FreeBSD machine all software required to
generate these results, as well as provide a brief tutorial
in the usage of both lofileparser and R. The first section
describes the installation and basic use of NetSniff.
Section two outlines the installation of logfileparser and
how to generate a database from the logfiles created by
NetSniff, while Section 3 covers the installation and
usage of R to generate graphical results.
II.
NETSNIFF
Netsniff can be obtained from the ICE3 website [2].
Design and implementation concepts are described in
more detail by Keller et. Al [1], more detailed
information on its usage can be found at the NetSniff
website [3].
Assuming you have extracted the NetSniff source to
the ice/netsniff directory, you can perform the following
steps to build and install the NetSniff software:
To install NetSniff :
.../...# cd ice/netsniff
.../ice/netsniff# mkdir build
.../ice/netsniff# cd build
CAIA Technical Report 050617A
June 2005
.../ice/netsniff/build# ../configure
.../ice/netsniff/build# make
At this stage you will have built the NetSniff
executable. While this executable may now be used, it
has not been installed on your system for widespread
usage by all users. To install NetSniff, you must do so
as the root user. To become root user on your machine,
type su and enter the root password. Installation of
NetSniff is performed using the following command.
..../ice/netsniff/build# make install
Netsniff is now installed on your machine, it can be
run by running "netsniff" at the command prompt, help
can be obtained by executing "man netsniff". Netsniff
can be used in several ways. It can capture the IP traffic
on your machine or take in entry tcpdump files, however
live capture from the network device can only be
performed by a user with root privileges [4]. If using
NetSniff to write log files to an output directory, that
output directory must be pre-existing.
To capture live traffic from network device em0 and
store the logiles in the logs directory previously created,
execute as the root user:
.../ice# netsniff -i em0 -d logs
To parse traffic from a tcpdump file and store the
logfiles in the logs directory, execute:
.../ice# netsniff -r path/to/mytcpdumpfile -d logs
For more usage options like anonymisation see [4].
Netsniff will append data to the end of existing logfiles.
III. LOGFILEPARSER
Logfileparser is a program developed by Urs Keller
at CAIA. It is a complementary tool to NetSniff which
parses the NetSniff log files and stores the resultant
information in a database. Several databases types can
be created: MySQL, SQLite and SQLite3.
A. Building and Installing Logfileparser
The logfileparser source is downloaded as part of the
NetSniff source and can be found in the directory
ice/netsniff/statistic. Before compiling and installing
logfileparser, it is necessary to install the database
libraries and tools that you wish to use. To query which
database tools are installed on your FreeBSD machine,
execute:
> pkg info | grep sql
page 1 of 6
To install MySQL [5] or SQLite(3) [6] databases
tools, check the available packages in [9] or [10] and
type:
> pkg_add -r mypkgname
You can also go directly in the /usr/ports/databases
directory, select the package, enter the directory and
make install. This kind of installation requires more
time.
Once the database tools have been installed, enter the
following sequence of commands from the
ice/netsniff/statistic directory:
.../ice/netsniff/statistic# mkdir build
.../ice/netsniff/statistic# cd build
.../ice/netsniff/statistic/build# ../configure
The configure command will display messages in
your shell. These messages will tell you if the
logfilparser can see the database tools. If it does not, you
have to set flags to your database library path. For
example if your database library is in /usr/local/, you
must execute:
.../ice/netsniff/statistic# setenv CPPFLAGS -I/
usr/local/include
.../ice/netsniff/statistic# setenv LDFLAGS -L/
usr/local/lib
This specifies to the configure script extra directories
to search for the database header files and libraries.
These flags can be accessed and changed from the
configure.ac file too. Your database library may also be
localised in a specific directory like usr/local/.../mysql,
in which case you must execute:
.../ice/netsniff/statistic# setenv CPPFLAGS -I/
usr/local/include -I/usr/local/include/mysql
.../ice/netsniff/statistic# setenv LDFLAGS -L/
usr/local/lib -L/usr/local/lib/mysql
Once you have correctly set the environment
variables, you can rerun the configure script.
.../ice/netsniff/statistic/build# ../configure
If no error messages are displayed, logfileparser is
properly configured and you can compile the application
by executing:
.../ice/netsniff/statistic/build# make
It is possible to install logfileparser by executing the
following command as root. However it may be more
practical to keep the logfileparser a private user-based
application.
.../ice/netsniff/statistic/build# make install
B. Using logfileparser to generate a database
To use the logfileparser from the console, you have
to be in the netsniff directory. If you installed
logfileparser as root you will need to use it as root.
Type:
.../netsniff# logfileparser
CAIA Technical Report 050617A
June 2005
This will show you how to use the logfileparser
command
(logfileparser
[-(dummy|sqlite|sqlite3|
mysql)] database-file logfile {logfile}). If you only see
logfileparser -dummy database logfile {logfiles} it
means your database libraries are not found by the
logfileparser and you have to reconfigure the paths to
database libraries (see above). The log files indicate a
list of NetSniff generated logfiles to parse, either in
uncompressed "*.log" format or compressed ".gz"
format.
To generate an SQLite(3) database from
mylogfile.log, execute:
.../ice/netsniff# logfileparser -sqlite
path/to/mydbfile.db path/to/mylogfile.log
To use MySQL, you need to create a MySQL user
and configure it [5]. Then launch the MySQL server as
root with :
# mysqld_safe -h path/to/databasesdirectory -u
MySQLusername
Before using the logfileparser you need to create a
database. Launch the MySQL client in a new shell with
> mysql and create your database:
> create database mydbname;
The database will automatically be created in the
directory you specified previously when launching the
server. You can now use the logfileparser with MySQL
(MySQL server still running):
.../ice/netsniff# logfileparser -mysql /mydbname
path/to/mylogfile.log
To parse several files from a directory and get the
data in the same database:
.../ice/netsniff# logfileparser -mysql /mydbname
path/to/mydirectory/*.log
Appendix B shows the various tables and their
relationships created in the database by logfileparser.
IV. GENERATING GRAPHS WITH R
To be useful, we need to extract the information
stored in the database to provide statistical and graphical
results. We use R [7], a language and environment for
statistical computing and graphics, to extract the data,
analyse it, and produce graphs for use in reports and
presentations.
A. Installing R
Instructions for download and installation of the R
package on a FreeBSD machine is described in more
details here [8]. Some additional R libraries are
mandatory to analyse our data from MySQL or SQLite
databases. The packages to add are RSQLite and
RMySQL, also available from [8]. Once downloaded as
pkg_x.x.x.tar.gz files in .../mydirectory, type in the shell:
.../...> R CMD INSTALL -l /path/to/Rlibrary .../
mydirectory/pkg_x.x.x.tar.gz
The R library may be installed in /
usr/local/lib/R/library.
page 2 of 6
B. Writing R Scripts
From the shell type R to launch R. To get some help
about a specific R function, use in the R shell help
(myfunction). You can type your command lines either
directly in the shell, or in a text file. It is more
convenient (and repeatable) to create a text file located
in the directory from where you launched R. In
mysource.r text file enter the R command lines. To
execute this sequence of commands from the R shell,
enter
> source("mysource.r")
In mysource.r :
• Include packages or libraries:
library(RlibName)
• Connect to/disconnect from MySQL database (the
MySQL server has to be launched – see III.B) ; use
RMySQL library:
drv <- dbDriver("MySQL")
con <- dbConnect(drv, username="yourname",
password = "your password", dbname =
"yourdb")
dbDisconnect(con);
• Connect to/disconnect from SQLite(3) database using
RSQLite library :
drv <- dbDriver("SQLite")
con <- dbConnect(drv, dbname = "mydbfile.db")
dbDisconnect(con);
• Query:
You can create a list to store the data selected in the
query:
mylist <-list()
mylist <- dbGetQuery(con, paste
( "yourMySQLquery", sep=""))
See [5] for further information on generating an SQL
query. The database schema can be seen in appendix
B, use this to determine how to correctly specify your
query. Sep="" is a parameter of the paste function.
You can also do:
tmp <- dbGetQuery(con, paste("select data1 as
d1, data2 as d2 from mytable1 where data1=x ",
sep=""))
This way you can easily access to your selected data
using the $ operator: tmp$d1 and tmp$d2. Appendix
A provides a complete R example querying the
database.
• Plot: depending on the kind of graph you want to do,
you may need other R libraries. For further
information on available packages, see [7].
Simple graph y=f(x):
plot(x, y, type="l", xlab="what is x", ylab="what
is y")
CAIA Technical Report 050617A
June 2005
Type l corresponds to a simple line graph. For more
options execute help(plot).
Bar graphs with a vector/list in function of a
vector/list:
barplot(vect1, list2)
Execute help(barplot) for more options.
Another way to barplot the data from your query is to
create a matrix where storing the data. Appendix A
includes an example of bar plotting downloaded and
uploaded sizes per port number.
Encapsulated PostScript (EPS) is a standard file
format for importing and exporting PostScript files. It is
usually a single page PostScript program that describes
an illustration or entire page. To generate EPS files with
R, use the following commands:
postscript("myepsfile.eps")
MyGraphCommands
dev.off()
MyGraphCommands is all the plot commands you
want to do. You can add a legend (help(legend)) or text
on your graph (help(text)). See appendix A fore more
details. It is possible to specify graph options and
parameters (height, width, horizontal, vertical, etc). Use
help(postscript) in the R shell for more information.
To export the EPS file to a PDF file created in
Mydirectory, type the following command in your shell:
.../Mydirectory> ps2pdf myepsfile.eps
C. Using EPS graphs in OpenOffice
To insert an EPS file in an OpenOffice document, the
file must be created setting the onefile option to false:
postscript("myepsfile.eps", onefile=F)
Then from your OpenOffice document click on Insert
-> Graphics -> From File and choose your file. The
graph is inserted but is not displayed on your screen
(you can only see a rectangle) : there is no preview, the
graph will appear only when exporting to pdf or
printing. It is possible to add a preview of your file in
the OpenOffice document by using epstool [12]; type in
your shell:
.../Mydirectory> epstool -tg --device tiffg3
myepsfile.eps myepsfilepreview.eps
myepsfilepreview.eps is created in Mydirectory.
Inserting it in the paper, you can see the graph. Double
clicking on your graph allows you to change displaying
options.
V.CONCLUSION
This document provides an overview of installing the
required tools to plot results from traffic logs generated
by NetSniff. Through the use of logfileparser and the R
software suite, we can collate the logged data into a
database which can then be queried for relevant
properties to plot graphical results. An example R script
is provided as a starting point to the reader. The primary
page 3 of 6
purpose of this paper is to facilitate future analysis of
NetSniff collected data.
ACKNOWLEDGMENTS
Thanks to Urs Keller for his explanations about the
logfileparser; to Sebastian Zander for his help
concerning FreeBSD.
REFERENCES
[1]
U. Keller, J. But, "Netsniff - Design and Implementation Concepts,"
(pdf) CAIA Technical Report 050204A, February 2005
[2] http://caia.swin.edu.au/ice/
[3] http://caia.swin.edu.au/ice/tools/netsniff
[4] http://caia.swin.edu.au/ice/tools/netsniff/usage.html
[5] http://dev.mysql.com/doc/mysql/en/index.html
[6] http://www.sqlite.org
[7] http://www.r-project.org/
[8] http://cran.au.r-project.org/
[9] http://www.freebsd.org/ports/databases.html
[10] http://www.freshports.org/
[11] http://www.tcpdump.org/
[12] http://www.cs.wisc.edu/~ghost/gsview/epstool.htm
CAIA Technical Report 050617A
June 2005
page 4 of 6
APPENDIX A: R FILE
This Appendix provides an example R script file to
barplot downloaded and uploaded sizes from several
predefined tcp ports. The text in italic starting by #
corresponds to comments.
library(RMySQL)
databases <- c("db1", "db2", "db3") # vector of the 3
databases names to use
library(RColorBrewer) #library for plots
drv <- dbDriver("MySQL")
mPortNb<-list(21,22,25,110,8000,80,8080,443) #list
of the TCP ports that we decided to analyse the traffic
psize <- matrix(0, nrow = 2, ncol=length(mPortNb),
byrow=TRUE,
dimnames=list(c(1:(2)),mPortNb))
# matrix of 2 rows, number of columns=length of
mPortNb list (number of ports), each column has the
name of a port
for ( i in 1:length(databases) ) #to use the 3 db
{
con <- dbConnect(drv, username="root", password
= "", dbname = databases[i])
dbGetQuery(con, "create temporary table temp
( dst_port integer, dldsize integer unsigned not null,
upsize integer unsigned not null )") # creation of a
temporary table containing 3 columns
dbGetQuery(con, paste("insert into temp (dst_port,
dldsize, upsize) select TransportIPPair.dst_port,
TCPStream.server2client_data,
TCPStream.client2server_data from TransportIPPair
natural join TCPStream ")) # get data from the database
and insert into the temporary table temp
for (j in 1:length(mPortNb)) #for each port
number
{
t <- dbGetQuery(con, paste("select sum
(dldsize) as dsize, sum(upsize) as upsize from temp
where dst_port='",mPortNb[j],"'", sep="")) #sum of
downloaded size and uploaded size for the considered
port
if (!is.na(t$dsize)) {psize[1,j] <- psize
[1,j]+t$dsize } # if the downloaded size sum is not null,
we add it in the matrix psize line 1
if (!is.na(t$upsize)) {psize[2,j] <- psize
[2,j]+t$upsize}#the same for the uploaded size in psize
line 2
}
dbDisconnect(con);#do not forget to disconnect
from the database...
}# psize is filled with the data from the 3 databases,
let's plot it now
colorsnames <- brewer.pal(3,"Greys")
CAIA Technical Report 050617A
June 2005
maxsize<-max(psize[1,]+psize[2,])
postscript("SizeByPorts.eps, onefile=F") #creates the
eps file
ttab <- psize
barplot(ttab, xlab="Port numbers", ylab="Size in
bytes", col=colorsnames, ylim=c(0,
maxsize+maxsize*0.3), space=c(0,0.5), cex.lab=1.2,
font=2)
#ylim is usefull to add text on the graph later
#space specifies the space between the bars
#cex.lab and font are text style parameters
#we only specified 'ttab' to barplot, then it will
automatically create one bar for each port cumulating
the downloaded (ttab[1,]) and the uploaded (ttab[2,])
size.
#let's add the values just on the top of each bar
valbar<-barplot(ttab, space=(0,0.5),plot=FALSE)
#valbar is a matrix with the numeric positions of the
bars on the graph
for (i in 1:length(valbar))
{
if (ttab[1,i]>9999) {beta<-2e9}
else {beta<-1e9}#just to avoid overwritting text
text(valbar[i], ttab[1,i]+ttab [2,i]+beta, paste
(formatC(ttab[1,i]/1000000, format="f", digits=2),
"MB",sep=""), cex=0.7)
text(valbar[i], ttab[1,i]+ttab [2,i]+beta+1e9,
paste(formatC(ttab[2,i]/1000000, format="f", digits=2),
"MB /",sep=""),cex=0.7)
}
dev.off()
#now let's have a look to the graph :
page 5 of 6
APPENDIX B: DATABASE RELATIONSHIPS DIAGRAMM
CAIA Technical Report 050617A
June 2005
page 6 of 6