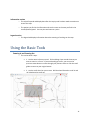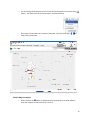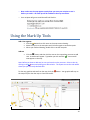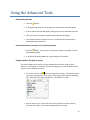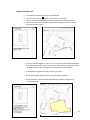
1
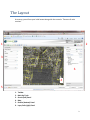
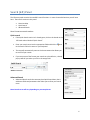
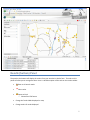
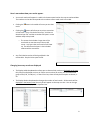
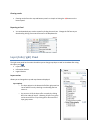
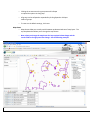
ConnectGIS
User’s Manual
Table of Contents
Click on a title to jump to that section.
The Layout………………………………………………………………3
The Toolbar…………………………………………………………………...4
a. Advanced Tools
b. Mark Up Tools
Search (left) Panel………………………………………………………………….6
III.
a. Quick Search
b. Advanced Search
IV.
Results (bottom) Panel…………………………………………………………………..7
a. Changing how your results are displayed
b. Clearing Results
c. Exporting to Excel
Layers (right) Panel………………………………………………………………..9
V.
a. Layer Options
b. Map Themes
c. Information tab
d. Legend tab
Using The Basic Tools…………………………………………………....11
VI.
a. Zooming in and out
b. Moving around the same extent
c. Identify Database
d. Print Screenshot
e. Email a Map Screenshot
VII.
Using the Mark Up Tools……………………………………………………14
a. Add a line segment
b. Add text
Using the Advanced Tools ……………………………………………………………………..14
VIII.
a. Downloading GIS data or Georeferenced Screenshots
b. Using the Buffer Tool (Ajoiner Tool)
c. Using the Measure Tool
d. Zoom to Scale
I.
II.
2
The Layout
At startup, you will see your initial extent along with the controls. There are 6 main
sections.
1
2
3
6
4
5
1.
2.
3.
4.
5.
6.
Toolbar
Mark Up Tools
Search (left) Panel
Map
Results (bottom) Panel
Layer/Info (right) Panel
3
The Toolbar
Here is a brief overview of all the tools:
Toggle Overview Map
• Reveals the Overview Map in the left panel
Refresh Map
• Reloads the map
Initial Extent
• Returns the map view to its default extent
Previous Extent
• Move backwards through your extent history
Next Extent
• Move forward through your extent history
Pan
•
Move around the map without zooming in or out
Zoom In
• Click and drag to create box around the area you want to magnify
Zoom Out
• Click and drag to create box around the area you want to de-magnify.
Identify Database
• Click to query information from the database.
Print Map
• Print your current map view, including annotations. Click the down arrow
to select print size
Email Map
• Send a screenshot of your current map view, including annotations, to any
email address.
Display Advanced Tools
• Reveals the advanced tools on the tool bar
4
Advanced Tools
To access the advanced tools, click the
advanced tools:
button on the toolbar. Here is a brief description of the
Download Currently Displayed Data
• Creates a zip file of the GIS data and downloads it to your computer
Download Georeferenced Image of Currently Displayed Data
• Creates a zip file of screenshot and world file and downloads it to your computer
Buffer an Area on the Map (Ajoiner Search)
• Brings up menu that lets you search by source layer, target layer, and distance
Measure an Area of the Map
• Measures the length of line segments and area of polygons drawn on the map
Zoom to Scale
• Type a number in the box to zoom to that scale
Mark Up Tools
Here is a brief description of the mark up tools:
Current Color
Choose Color
• Brings up a selection of color swatches
Add Text
• Insert text anywhere on the map
Add Graphics
• Draw line segments on the map
Clear All Graphics
• Erase all added text and lines.
5
Search (left) Panel
The left most panel contains ConnectGIS’s search functions. In most ConnectGIS sessions you will start
here. There are 3 sections in this panel:
•
•
•
Overview Map
Quick Search
Advanced Search
Here is how to use each section:
Quick search
•
If the Quick Search section isn’t already open, click on the header in the
left hand column labeled “Quick Search”
•
Enter your search term into the appropriate field and click the
to the search field or hit enter on your keyboard
•
The map will automatically zoom to the closest extent that allows you
to see all of your results
•
If you are unsure of the format your search term should be in, a handy
pop-up will tell you when you click in the empty field.
next
Advanced Search
•
Advanced Search works the same way that Quick Search does, but it
adds extra fields and parameters that allow you to refine your search
more.
Note: Search terms will vary depending on your map theme.
6
Results (bottom) Panel
The panel at the bottom will display the results from your searches in tabular form. The tools on this
panel will allow you to manage the data. Here is a brief description of the tools on the results toolbar:
•
Zoom to all search results
•
Clear results
•
Export to Excel
o Choose Excel file format
•
Change # of result labels displayed on map
•
Change total # of results displayed
7
Here is more about how your results appear:
•
Your search results will appear in a table in the bottom panel and on the map as numbered dots.
The numbers on the dots correspond to the numbers next to each result in the table.
•
Clicking the
result.
•
button will allow you to print a screenshot
Clicking the
of that result. Then, click the box that says “click here to
download your file” and the screenshot will open in a new
window ready to be printed.
o
•
button in the table will zoom you into that
The screen shot includes a large view of the
result with an overview map in the top left
corner. Any layers that are turned on will show
up. The data from the layers is also included
underneath the screenshot.
Any files linked to results will be hyperlinked in the
results table. Simple click to open the file.
Changing how many results are displayed
•
The Display Labels dropdown box allows you to choose which results are displayed on the map.
Only 50 can be displayed at a time so if there are more than 50 results, you can select which
group of 50 (1-50, 51-100, etc.). If there 50 or less, there will only be one option to choose, 150.
•
The Display Results drop down box changes the number of total results. All the results will be
displayed in the bottom panel, but only 50 will appear on the map at a time. You can change
which 50 with the Display Labels dropdown box.
8
Clearing results
•
Clearing results from the map and bottom panel is as simple as hitting the
bottom panel.
button on the
Exporting to Excel
•
You can download your results to excel by clicking the excel icon. Change the file format you
download by picking from several formats in the dropdown list.
Layer/Info (right) Panel
The right most panel has 3 sections that allow you to change map layers as well as view data after using
the inquiry tool ( ).
• Layers Section
• Information Section
• Legend Section
Layers section
Allows you to change the map and map elements displayed.
Layer options
o The layer options in the bottom half of the right panel can
be turned off or on by checking or unchecking the box
next to it.
o
You can turn all of the layers off or on easily by clicking
Off or On under All Layers. Likewise, all layers in a group
can be turned off or on by clicking Off or On next to the
layer group name.
9
o
Clicking the arrow next to the group name will collapse
or expand the options in that group.
o
All groups can be collapsed or expanded by clicking Expand or Collapse
under all groups.
o
To return to the default settings, click reset
Map theme
o Map themes allow you to easily switch between predetermined sets of map layers. The
top drop down box allows you to change the map theme.
o
Note: when you change the map theme the layer options below change and the
search fields in the right panel also change. See the following example:
10
Information section
o
This tab will expand and display data after the inquiry tool has been used to examine an
area of the map.
o
The options you find in the information tab are the same as the ones you find in the
results (bottom) panel. You can print and zoom to a point.
Legend section
o
The legend tab displays information about the meaning of markings on the map.
Using the Basic Tools
Zooming in and Zooming Out
o
This can be done 2 ways.
§
1. Use the zoom in/zoom out tool. Click and drag a box around the area you
want to zoom in or out of. If you accidentally go too far, you can use the
previous extent button to move through your previous views or click the small
globe to return to your original extent.
§
2. Use the scroll wheel on your mouse. Roll the wheel forward to scroll in and
roll it backward to scroll out.
11
Moving around the same extent
o
Use the pan tool
§ After selecting the pan tool, click and drag to move map around
o
Use the overview map
§ Bring up the overview map by clicking on the button on the tool bar or clicking
the “Overview map” header in the left panel.
§
Click anywhere on the overview map to jump to that location
Note: You can use the
and
buttons to go back and forth in your history of zooms and pans.
Identify Database
o
Click on
and then click on area of interest on the map. The area will be highlighted
and the data for that area will be displayed in the right panel.
Print Screenshots
o
The
button allows you to print your current views. Click the link in the prompt that
comes up. This will open a new window with the screenshot in it. Now you can use
your browser’s print function to print.
12
o
You can change the dimensions of your screen shot by clicking the arrow next to the
button. The check marks let you know what is currently selected.
o
Every panel can be hidden to increase the map view. Just click the arrows (
each panel to hide them.
,
) on
Email a Map Screenshot
o
When you click the
button, a dialog box will pop up asking for an email address.
Enter the recipient’s email and click ok. That’s it.
13
o
Note: make sure the map appears exactly how you want your recipient to see it
before you send it. All mark ups will be included in the map screenshot.
o
Your recipient will get an email that will look like this:
Using the Mark Up Tools
Add a line segment
button then click once on the map to start drawing.
§ Click the
§ Move the cursor to the next point and click once again to set another point.
§ When your finished drawing, double click to set the last point.
Add text
§
button and then click the area on the map where you want to add
Click the
text. A text box will appear. Type what you wish and click . Your text will
now appear on the map.
Note: Before you draw or add text, be sure you have the color you want. Select a color by
button and picking your desired color. The square next to the color wheel
clicking on the
shows you your currently selected color.
To clear any graphics and text from the map, click the
the map until you clear the map or close ConnectGIS.
button. Your graphics will stay on
14
Using the Advanced Tools
Downloading GIS data
§
Click the
§
A dialog box will notify you of some ways to increase your download speed.
§
Click ok and another box will appear asking you to click to download that data.
§
After you click, your browser’s default download client will appear.
§
Click save and choose a location to save. A zip file with the GIS data will be
downloaded and saved there.
button.
Download Georeferenced Image of Currently displayed data
§
button. Click the link in the box that appears and follow a normal
Click the
download procedure.
§
A zip file will be downloaded with a .jpeg image and a world file.
Using the buffer tool (ajoiner search)
This search allows you to search one layer based on distance from another layer’s
features. For example, you could use this tool to bring up the results for all the streets
within a certain distance of a parcel.
§
To use this tool click the
button to bring up the settings. Choose your source
layer (your starting point). Then choose your target layer (what you’re looking
for). Then type in a number for distance. This distance is in feet.
§
After all that is set up, click on the area of the map that you want to be the
center of your search. Your results should appear on the map.
15
Using the measure tool
§
The measure tool works similarly to the draw tool.
§
§
§
button and click once on the map.
To start a line, click the
You can now move your mouse around the map with a line attached to it.
Notice in the left column how the measurement changes in real time as you
move the cursor around.
§
To start a new line segment, click once. You can now create a new line segment
from a pivot point at the end of your first one. Notice that the left panel shows
the distance of your last line segment as well as your current segment.
§
Create new line segments as many times as you need.
§
When you are done, double click to end your final line segment.
§
When you finish, ConnectGIS will automatically complete a polygon and
calculate the area.
16
Zoom to scale
o
The zoom by scale tool has 2 uses:
§ It will show you your current scale, no matter how your zoomed there.
§ It allows you to zoom to a specific scale by entering a number.
• The smaller the number, the closer you will zoom in.
17