1
ELECTRICAL & ACOUSTICAL TESTS
CLIO Software
Release 10
Quality Control Extension
User's Manual
AUDIOMATICA
© Copyright 1991–2009 by AUDIOMATICA SRL
All Rights Reserved
Edition 10.01, September 2009
IBM is a registered trademark of International Business Machines Corporation.
Windows is a registered trademark of Microsoft Corporation.
CONTENTS
19 QUALITY CONTROL.......................................................5
19.1 INTRODUCTION.................................................................................5
19.2 FEATURES OF CLIO QC.......................................................................5
19.2.1 THE OPERATOR'S POINT OF VIEW..................................................6
19.2.2 THE ENGINEER'S POINT OF VIEW..................................................8
19.2.3 THE COMPANY'S POINT OF VIEW...................................................9
19.2.4 OPERATORS AND PASSWORDS MANAGEMENT...............................10
19.2.5 DIGITALLY SIGNED QC FILES......................................................12
19.3 THE QC SOFTWARE OPERATION.........................................................13
19.3.1 THE REFERENCE FILE.................................................................15
19.3.2 THE LIMITS FILE FOR SINGLE CHANNEL MONO OPERATION.............15
19.3.3 LIMITS FILE FOR TWO CHANNELS STEREO OPERATION...................17
19.4 THE QC CONTROL PANEL...................................................................18
19.4.1 TOOLBAR BUTTONS....................................................................18
19.4.2 THE QC REPORT PANEL...............................................................21
19.4.3 REVIEWING A MEASUREMENT.....................................................21
19.4.4 THE QC RESULT PANEL...............................................................24
19.4.5 THE QC BANNER........................................................................24
19.4.6 QUALITY CONTROL MENU AND SHORTCUTS..................................25
19.4.7 QC REGISTERED FILE EXTENSIONS..............................................26
19.4.8 QC OPTIONS DIALOGS...............................................................27
19.5 MY FIRST QC SCRIPT........................................................................28
19.5.1 WHAT TO KNOW ABOUT QC SCRIPTS...........................................28
19.5.2 HOW TO WRITE MY FIRST QC SCRIPT...........................................28
19.6 NOTES ON LIMITS CURVES................................................................32
19.6.1 ABSOLUTE VS. RELATIVE FREQUENCY LIMITS................................34
19.6.2 AVERAGE LEVEL CHECK..............................................................36
19.6.3 ALIGNED MASK.........................................................................39
19.6.4 SENSITIVITY CHECK..................................................................40
19.6.5 FLOATING LIMITS VS. FLOATING CURVES.....................................41
19.6.6 SINUSOIDAL A/B STEREO DIFFERENCE CHECK..............................42
19.6.7 SINUSOIDAL THD AND FAST-TRACK RUB&BUZZ CHECK..................43
19.6.8 THIELE&SMALL PARAMETERS CHECK............................................44
19.6.9 LOUDNESS RATING CALCULATION AND CHECK..............................45
19.6.10 MULTIMETER LIMITS FILES........................................................46
19.7 MANAGING PRODUCTION BATCHES....................................................47
19.7.1 DIRECTORIES CREATED BY CLIO QC............................................47
19.7.2 PRODUCTION REPORT FILES.......................................................48
19.7.3 AUTOSAVED DATA FILES.............................................................49
19.7.4 STATISTICAL INFORMATION ON MEASURED DATA..........................49
19.7.5 SERIAL NUMBER MANAGEMENT...................................................50
19.7.6 THE SKIP LAST BUTTON..............................................................51
19.8 INTERACTING WITH EXTERNAL HARDWARE.........................................52
19.8.1 INPUT SENSITIVITY AND OUTPUT VOLTAGE CONTROL....................52
19.8.2 QCBOX MODEL 5 DC OUTPUT CONTROL........................................52
19.8.3 CLIOQC AMPLIFIER&SWITCHBOX CONTROL..................................53
19.8.4 EXTERNAL TRIGGER...................................................................54
19.8.5 TTL SIGNALS GENERATION.........................................................54
19.8.6 TIME DELAYS GENERATION.........................................................57
19.8.7 PARALLEL PORT SIGNALS MANAGEMENT.......................................58
19.8.8 QCBOX MODEL 5 DIGITAL I/O SIGNALS MANAGEMENT..................59
19.8.9 RS-232 SERIAL PORT CONTROL...................................................60
20 QC BY EXAMPLES, TCP-IP MEASUREMENT SERVER AND
SYNTAX REFERENCE........................................................61
20.1 A COMPLETE, FAST, SINGLE-TEST LOUDSPEAKER QUALITY CONTROL......61
20.1.1 HARDWARE REQUIRED...............................................................61
20.1.2 MEASURING THE REFERENCE FREQUENCY RESPONSE....................63
20.1.3 MEASURING THE REFERENCE IMPEDANCE RESPONSE.....................66
20.1.4 INTEGRATING THE QC REFERENCE FILE........................................68
20.1.5 PROGRAMMING THE QC SCRIPT...................................................69
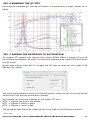
20.1.6 RUNNING THE QC TEST..............................................................71
20.1.7 ADDING THE INTERFACE TO AUTOMATION....................................71
20.2 QC EXAMPLES..................................................................................73
20.2.1 EXAMPLE 1: QC OF A MICROPHONE PREAMPLIFIER........................73
20.2.2 EXAMPLE 2: THE AMPLIFIER&SWITCHBOX UNDER QC.....................76
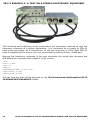
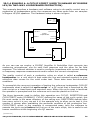
20.2.3 EXAMPLE 3: A TEST ON A STEREO ELECTRONIC EQUIPMENT...........78
20.2.4 EXAMPLE 4: A CYCLIC SCRIPT (USED TO MANAGE MY ROGERS LS3/5A
TWO-WAY LOUDSPEAKER PRODUCTION).................................................79
20.2.5 EXAMPLE 5: QUALITY CONTROL OF A TELEPHONE WITH LOUDNESS
RATING CHECK.....................................................................................82
20.2.6 EXAMPLE 6: ON RUB & BUZZ DETECTION (1)................................83
20.2.7 EXAMPLE 7: ON RUB & BUZZ DETECTION (2)................................85
20.3 CLIO QC TCP/IP SERVER...................................................................87
20.3.1 INVOKING THE QC SERVER.........................................................87
20.3.2 CONNECTING TO THE QC SERVER................................................88
20.3.3 INTERACTING WITH THE QC SERVER...........................................89
20.3.4 NOTES ABOUT QC SERVICES.......................................................92
20.3.5 KEYWORDS FOR QC SERVICES....................................................94
20.3.6 TCP SERVER EXAMPLE: A C++ CLIENT APPLICATION......................95
20.4 QC SCRIPT SYNTAX REFERENCE.........................................................98
20.4.1 KEYWORDS FOR GENERAL SETTINGS...........................................98
20.4.2 KEYWORDS FOR MEASUREMENTS SETTINGS...............................103
20.4.3 KEYWORDS FOR AUXILIARY TESTS AND MATH OPERATION............106
20.4.4 KEYWORDS FOR CONDITIONAL EXECUTION................................107
20.4.5 KEYWORDS FOR HARDWARE CONTROL.......................................111
20.4.6 OTHER KEYWORDS...................................................................112
20.4.7 KEYWORDS USED IN LIMITS FILES.............................................113
BIBLIOGRAPHY.............................................................119
NORMS..........................................................................121
19 QUALITY CONTROL
19.1 INTRODUCTION
The Quality Control software extension for CLIO is a powerful suite for executing
state of the art production line testing.
CLIO QC implements all the measurement techniques found in the CLIO standard
software adding a versatile script processor that handles the test sequence most
appropriate for your needs.
CLIO QC is able to test the production of loudspeakers, drivers, microphones,
amplifiers and any other electroacoustic device.
CLIO QC can interact with external hardware or production line controllers in
addition to PC peripherals, computer networks or with custom written software to
implement a fully automatic test line.
CLIO QC can be configured to act as a measurement server. It is possible to
easily integrate the sophisticated QC measurement techniques of CLIO inside
custom written applications. Interaction takes place with TCP/IP transfer protocol
giving the possibility of remote control over a network.
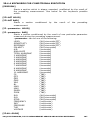
19.2 FEATURES OF CLIO QC
CLIO QC is exceptionally powerful as it relies on the power of CLIO. Here is a list of
the parameters that can be calculated within each measurement:
Sinusoidal -
Frequency response and impedance response (mono or stereo tests)
Average (or single frequency) level
Sensitivity (average or up to eight frequencies)
Polarity
Total harmonic distortion response
Single harmonic response (from 2nd to 10th)
Fast-Track Rub&Buzz response
T&S parameters (Fs,Qt,Qe,Qm,Cms,Mms,Mmd,Vas,Bl,dBSPL,ZMin)
Loudness Rating (RLR, SLR, STMR)
MLS&CHIRP- Frequency response or impedance response (mono tests)
- Average (or single frequency) level
- Sensitivity (average or up to eight frequencies)
- Polarity
- T&S parameters (Fs,Qt,Qe,Qm,Cms,Mms,Mmd,Vas,Bl,dBSPL,ZMin)
- Loudness Rating (RLR, SLR, STMR)
FFT
- Frequency response with definable stimulus (mono tests, also
interactive)
- Average (or single frequency) level
- Sensitivity (average or up to eight frequencies)
METER
- SPL, Volts, THD, IMD single parameter (mono tests, also interactive)
The QC processor is able of handling a virtually unlimited sequence of tests to
accomplish even the most complex tasks; on the other hand a single ultra-fast
sinusoidal test (read about it in 20.1) may ensure you production cycle times
19 QUALITY CONTROL
5
of less than 1 second with total integration with the line controller.
Some of the QC management features are better explained starting from the
various people taking part in this complex operation and their points of view:
- The operator working on the line (19.2.1)
- The quality control engineer responsible for production line operation(19.2.2)
- The company and its managers controlling the overall process (19.2.3)
All QC operations can be password protected (19.2.4); file operation can be
restricted by their digital signature (19.2.5).
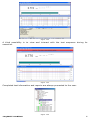
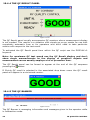
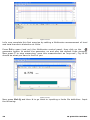
19.2.1 THE OPERATOR'S POINT OF VIEW
A quality control test can be controlled by simple Go-NoGo masks letting even the
least experienced operator work without problems and with no learning curve.
Figure 19.1
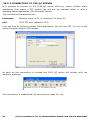
A more complex operation foresees the continuous display of the measurements
executed until the reaching of the final result.
6
19 QUALITY CONTROL
Figure 19.2
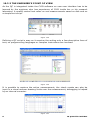
A third possibility is to view and interact with the test sequence during its
execution.
Figure 19.3
Completed test information and reports are always presented to the user.
Figure 19.4
19 QUALITY CONTROL
7
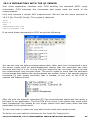
19.2.2 THE ENGINEER'S POINT OF VIEW
As the QC is integrated inside the CLIO software no new user interface has to be
learned by the engineer who has experience of CLIO inside her or his research
laboratory. A quality control test relies on real measurements saved on disk and on
a simple text script.
Figure 19.5
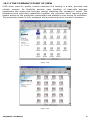
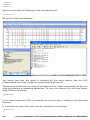
Defining a QC script is easy as it requires the writing only a few descriptive lines of
text, no programming languages or complex instructions are involved.
Figure 19.6
It is possible to capture the active measurement; the check masks can also be
input in a visual manner drawing limits over the measurement; debugging is helped
by an internal corrector.
Figure 19.7
8
19 QUALITY CONTROL
19.2.3 THE COMPANY'S POINT OF VIEW
CLIO when used for quality control executes line testing in a fast, accurate and
reliable manner. Its flexibility permits easy handling of trade-offs between
parameters like speed and accuracy always matching the company's’ needs. The
autosaving and exporting capabilities together the complete result reporting gives
instant access to the production parameters and statistics even during its operation.
The production batch is fully managed while preserving serial number coherence.
Figure 19.8
Figure 19.9
19 QUALITY CONTROL
9
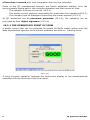
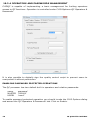
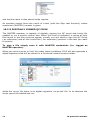
19.2.4 OPERATORS AND PASSWORDS MANAGEMENT
CLIOQC is capable of implementing a basic management for limiting operators
access to QC functions. Operation is controlled under CLIO Options>QC Operators &
Passwords.
It is also possible to digitally sign the quality control script to prevent users to
manipulate it without permission.
ENABLING PASSWORD PROTECTED OPERATIONS
The QC processor has two default built in operators and relative passwords:
name
MASTER
USER1
password
‘000000’
‘user1’
To enable password protected operation you should invoke the CLIO Options dialog
and access the ‘QC Operators & Passwords’ tab. Click on Enable:
10
19 QUALITY CONTROL
You will be prompted to access as MASTER operator.
The MASTER operator is the only entity to have full capability over all QC functions.
It is the only operator that cannot be deleted. It is advisable to change its default
password as soon as possible.
Inside CLIO Options it is possible to define new operators and relative passwords,
modify or delete them. It is possible to define up to 100 different users.
It is also possible to activate operation only with digitally signed QC files (see later).
All settings relative to passwords and operators are encrypted and saved inside the
“qc.stp” file that resides in the CLIO’s temporary folder (see chapter 5); deleting
this file resets CLIO to the initial default situation.
THE OPERATOR'S POINT OF VIEW WHEN DEALING WITH PASSWORDS
Upon invoking the Quality Control menu it is given access only to registered
operators.
The same prompt is also given each time a new QC script is loaded from disk.
If digitally signed files operation is enabled only correctly signed files could be run,
otherwise the following prompt appears:
The QC operations are marked with the logged operator’s name:
19 QUALITY CONTROL
11
and her/his name is also saved inside reports.
An operator cannot force the result of a test (with the Skip Last function) unless
supervisor (MASTER) consent is given.
19.2.5 DIGITALLY SIGNED QC FILES
The MASTER operator is capable of digitally signing the QC script and Limits file
needed to run a quality control test. When this kind of operation is active all text
files found in the test must be signed; usually you will need to sign the QC Script
(.qc extension) and all the limits files (.lim extension) present in the test you want
to protect.
To sign a file simply save it with MASTER credentials (i.e. logged as
MASTER operator).
When you save a script or limit file under these conditions CLIO will also generate a
digital signature that will be stored in a file saved inside the same folder.
Aside the ‘rer.qc’ file there is its digital signature ‘rer.qc.chk’ file. In its absence the
script cannot be loaded and run.
12
19 QUALITY CONTROL
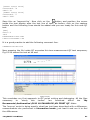
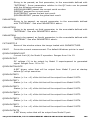
19.3 THE QC SOFTWARE OPERATION
The QC software is a "file driven" event processor that, in sequence, performs a
number of user-defined measurements to test the quality of a production line.
The text file ('.qc' extension) driving this process is called the QC Script.
CLIO's QC processor does the following job:
-
reads the QC script and loads it in memory
interprets it
executes all the tests
reports the test result and production statistics
manages the production batch and serial number
prompts for the next test
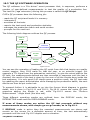
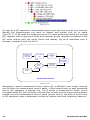
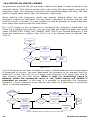
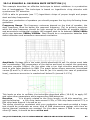
The following block diagram outlines the QC process.
LOAD QC
SCRIPT
WAIT FOR USER
OR TRIGGER TO
START QC TEST
REPORT,
STATISTICS
& BATCH
MANAGEMENT
PERFORM
MEASUREMENT
QC TEST
MEASUREMENTS
ENDED ?
NO
BAD
NO
YES
QC TEST
GOOD
YES
ALL RESULTS
GOOD ?
Figure 19.10
You can see the operation of loading the QC script from disk that begins our quality
control session; then CLIO waits for that the user, or an external trigger (for
example a TTL signal from the automation controller), to give the actual start to the
QC test; the measurements defined are then executed in sequence until the last is
reached; the result of the test is given by the sum of all the checks done inside the
test sequence, it is only good if all checks gave a positive result; the QC test ends
by updating the report and statistics while managing the production batch; the next
device can then be put under test.
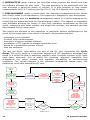
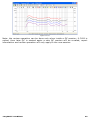
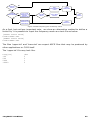
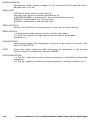
To proceed further it is advisable to go into the former block diagram in greater
detail; this is done in Fig.19.11 and 19.12; Fig.19.11 zooms the entire QC test
sequence adding the blocks in red, while Fig.19.12 zooms the "Perform
Measurement " single block (the blue one).
Three different operating modes are outlined here: the DISPLAY mode, the
INTERACTIVE mode and the DISPLAYONBAD mode.
If none of these modes are active the QC test proceeds without any
measurements shown, with simple go-no-go masks, as in Fig.19.1.
If DISPLAY mode is active then the executed measurements are shown and
remain on the screen for a definable amount of time, the test automatically
proceeds until the end. Fig.19.2 depicts such a situation.
19 QUALITY CONTROL
13
If INTERACTIVE mode is active the executed measurements are shown and then
the software prompts for user input . The test sequence is not continued until the
user executes a particular action or actions. It is also possible to loop certain
measurements for D.U.T. tuning (see Fig.19.12). Fig.19.3 depicts such a situation.
If DISPLAYONBAD mode is active then the executed measurements are shown
only if their result is not satisfactory. The sequence is stopped for user acceptance.
Fig.19.11 shows also the Autosave management which is of great importance for
controlling the production and for characterizing a batch. This feature is completely
user definable allowing for binary or text files, operation conditioned by the test
result, coherence with serial number and single test number; the operator can also
be prompted for file name input.
Two blocks are devoted to the execution of particular actions conditioned by the
result of the single test or the result of all tests. Among these we find:
-
messages to the operator
printout of the measurement
execution of custom written software
generation of TTL signals to manage automatic lines
pause for a predefined amount of time
stop the sequence
The last red block, right before the end of the QC test, represents the Cyclic
Script. The cyclic script is a particular sequence of QC operations described and
saved in a script file that is executed regularly after a certain number of QC tests
have been executed; this is useful for retesting reference quantities that
characterize the entire process and maintain traceability to environmental
conditions. The typical example is the reference loudspeaker tested every 100
production units have passed the QC test.
LOAD QC
SCRIPT
WAIT FOR USER
OR TRIGGER TO
START QC TEST
MANAGE
AUTOSAVE OR
AUTOEXPORT
PERFORM
MEASUREMENT
EXECUTE
CYCLIC SCRIPT
IF TIME TO
SHOW
MEASUREMENT
IF DISPLAY
MODE
SHOW AND
PROMPT IF
INTERACTIVE
MODE
RESULT
GOOD?
YES
SHOW
MEASUREMENT
IF
DISPLAYONBAD
REPORT,
STATISTICS
& BATCH
MANAGEMENT
TAKE USER
DEFINED
ACTIONS
CONDITIONED BY
THE RESULT OF
ALL
MEASUREMENTS
NO
TAKE USER
DEFINED
ACTIONS
CONDITIONED
BY THE RESULT
OF THE SINGLE
MEASUREMENT
QC TEST
BAD
NO
QC TEST
GOOD
YES
ALL RESULTS
GOOD ?
YES
NO
MEASUREMENTS
ENDED ?
Figure 19.11
14
19 QUALITY CONTROL
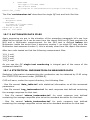
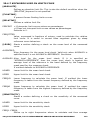
The third diagram in Fig.19.12 shows us how the single QC measurement is
performed. As outlined before, CLIO QC relies on the measurements present in the
standard version of the software; the possible measurements within QC are: MLS
([MLS]), FFT ([FFT]), Sinusoidal ([SIN]) and Multimeter ([MET]). We will now
cover the keywords which are used to define the tests inside the script.
INPUT
SET QC
OPTIONS
LOAD LIMITS
FILE
LOAD
REFERENCE
FILE
EXECUTE
MEASUREMENT
CALCULATE
OPTIONAL
PARAMETERS
OPTIONAL
LOOP
BAD
CHECK
RESULT
GOOD
READY FOR
NEXT
PERFORM MEASUREMENT
OUTPUT
Figure 19.12
To understand this operation we must define two files: the Reference File and the
Limits File; these files are the heart of the QC operation, together the QC Script
they contribute to define all the parameters of the single measurement.
19.3.1 THE REFERENCE FILE
The Reference File is a standard CLIO measurement file (extension '.mls', '.fft',
'.sin', or '.met') created within its relative menu; it contains most of the settings
needed to fully configure your measurement. Just as CLIO resets the measurement
control panel to the settings of the file loaded from disk, the QC processor does the
same job; in this easy but effective way of operating you will be sure that, for
example, the sampling frequency of your QC MLS measure will be the one you
chose, or the display settings will be the same as when you saved the reference
file. And all this is defined, inside the QC script, with a single text line:
REFERENCE=myreferencefile.mls
where we imagined that you gave the name 'myreferencefile' to a saved MLS
measurement.
One very important setting stored within the reference file is if the measurement is
mono (only channel A acquired)
or stereo (channel A and B acquired
simultaneously).
19.3.2 THE LIMITS FILE FOR SINGLE CHANNEL MONO OPERATION
When you have taken a single channel mono measurement you define only one
limits file.
The Limits File is a text file ('.lim' extension) defining the frequency mask or
quantities needed to check the executed measurement. The syntax used is the
same as the QC script. A Limits file can be as simple as:
19 QUALITY CONTROL
15
[UPPER LIMIT DATA]
100
+5
500
+3
5000
+1
10000
+5
[LOWER LIMIT DATA]
100
-5
500
-3
5000
-1
10000
-5
In principle nothing else is needed to define the basic measurement; here is an
example of a section of a QC script defining a MLS measurement:
[MLS]
REFERENCE=MYREFERENCEFILE.MLS
LIMITS=MYLIMITSFILE.LIM
An interesting keyword to add is COMMENT that let’s you give a brief description of
the QC test that will be output during the measurement and inside reports:
[MLS]
COMMENT=FREQUENCY RESPONSE
REFERENCE=MYREFERENCEFILE.MLS
LIMITS=MYLIMITSFILE.LIM
While performing a QC measurement CLIO can calculate more parameters from the
data acquired and have these parameters to concur with the final result. As an
example it is possible to make a polarity check within a MLS frequency response
measurement or make a T&S parameters check within an impedance measurement.
The following script adds the polarity check to the former MLS test.
[MLS]
REFERENCE=MYREFERENCEFILE.MLS
LIMITS=MYLIMITSFILE.LIM
POLARITY=1
Here is a list of the parameters that can be calculated within each measurement:
Sinusoidal -
Frequency response and impedance response (mono or stereo tests)
Average (or single frequency) level
Sensitivity (average or up to eight frequencies)
Polarity
Total harmonic distortion response
Single harmonic response (from 2nd to 10th)
Fast-Track Rub&Buzz response
T&S parameters (Fs,Qt,Qe,Qm,Cms,Mms,Mmd,Vas,Bl,dBSPL,ZMin)
Loudness Rating (RLR, SLR, STMR)
MLS&CHIRP- Frequency response or impedance response (mono tests)
- Average (or single frequency) level
- Sensitivity (average or up to eight frequencies)
- Polarity
- T&S parameters (Fs,Qt,Qe,Qm,Cms,Mms,Mmd,Vas,Bl,dBSPL,ZMin)
- Loudness Rating (RLR, SLR, STMR)
FFT
16
- Frequency response with definable stimulus (mono tests, also
19 QUALITY CONTROL
interactive)
- Average (or single frequency) level
- Sensitivity (average or up to eight frequencies)
METER
- SPL, Volts, THD, IMD single parameter (mono tests, also interactive)
19.3.3 LIMITS FILE FOR TWO CHANNELS STEREO OPERATION
When you have taken a simultaneous two channels stereo measurement you may
define the following limits files:
A) One single Limits file which is valid and shared for both channels; this is the case
when both measurements refer to the same unit like the two channels frequency
response of a headphone or of a stereo equipment. A stereo sinusoidal test may be
defined as:
[SIN]
REFERENCE=MYREFERENCEFILE.SIN
LIMITS=MYSTEREOLIMITSFILE.LIM
B) Two different Limits files one per measured channel; this is the case when the
two measurements refer to two different quantities like a frequency response
together an impedance response. The LIMITS keywork, in this case, is substituted
by the two keywords LIMITSA and LIMITSB. A stereo sinusoidal test may be
defined as:
[SIN]
REFERENCE=MYREFERENCEFILE.SIN
LIMITSA=MYRESPONSELIMITSFILE.LIM
LIMITSB=MYIMPEDANCELIMITSFILE.LIM
19 QUALITY CONTROL
17
19.4 THE QC CONTROL PANEL
Figure 19.13
Figure 19.13 shows the Quality Control panel that is composed by a toolbar similar
to the other CLIO panels plus a text display area that is used either for editing the
QC files (QC script and Limits file) or for showing information about the QC test.
When the QC display handles file editing it has a white background while, when
showing information, it is lightly colored.
19.4.1 TOOLBAR BUTTONS
Starts a QC test.
Enables tracing of the QC script during execution. If pressed, during test
execution the QC control panel is not minimized and remains visible showing the
current script section under execution.
Forces the QC result panel to be displayed after tests completion. Refer to 19.4.3
for more details.
shrink QC result drop down
With this choice in the drop down menu associated with the QC result button it is
possible to display a minimized version of the QC Result Panel; see 19.4.4.
Enables external trigger. This button overrides the setting in the script
(MANUAL keyword). See 19.8.2 and the commands reference for more details.
Skips the last measured unit.
Used to input the current device serial number.
Recalls the QC Report panel Refer to 19.4.2 for more details.
18
19 QUALITY CONTROL
Releases all the measurement control panels. Each panel reverts to its normal
appearance. In fact, when a QC test sequence is running, each panel 'loses' its
toolbar, overlay and curve controls and status bar in order to maximize the
graph display when the windows are tiled. Fig.19.14 shows the MLS control
panel in the two different situations.
Figure 19.14
When control panels are managed under QC the title of the window is used to
display the result of the parameters that have been measured or calculated: in
Fig.19.15 we see written 'Response GOOD' which reports the result of the MLS
frequency response check done.
Starts a new QC script editing session. The text present is canceled.
Edit the current text.
Immediately saves the current text as Script or Limits file.
Enters the Script Text mode. The QC display presents the currently loaded QC
script file.
Enters the Limits Text mode. The QC display presents the currently loaded
Limits file.
Enters the Information Text mode. During tests the QC display shows the
current QC script section under execution. When the test sequence is finished
the QC display shows information about the executed tests.
If in Script Text display mode, 'captures' the active measurement generating
a 'piece' of script file relative to the currently loaded reference and limits files.
The text is inserted at cursor position. As an example the following text is
generated
in the assumption that you have MLS open with the active
measurement saved as 'myreferencefile.mls' and that you have loaded the
'mylimitsfile.lim' inside QC; also captured are output level and input sensitivity
(here assumed to be 0dBu and 0dBV respectively).
[MLS]
OUT=0.0
IN=0
REFERENCE=MYREFERENCEFILE.MLS
LIMITS=MYLIMITSFILE.LIM
19 QUALITY CONTROL
19
If in Limits Text display mode, 'captures' the limits file of the active
measurement loading it inside the QC display.
Creates the frequency curves relative to the limits file under editing and shows
them in the active measurement control panel.
Enables the Draw Limits controls that let you visually input the frequency limits
directly drawing on the active measurement control panel. Fig.19.15 shows the
MLS control panel with the Draw Limits controls on the top. Clicking on one of
the two buttons starts drawing the relative limit curve; to finish input doubleclick on the last frequency point.
Note: it is mandatory to input points from left to right.
Figure 19.15
Hides (if visible) or shows (if hidden) the limits curves in the active
measurement control panel.
20
19 QUALITY CONTROL
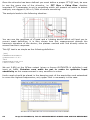
19.4.2 THE QC REPORT PANEL
Figure 19.16
The QC Report panel serves as an interactive tool which is of great help for
inspecting a production while it is tested; it is composed by two tree views named
STATISTICS and TEST REPORT these handle all the information pertaining to
your QC session in a very compact form.
The QC Report panel can be kept open during the tests and it accompanies the
work in a really effective visual form.
Under
-
STATISTICS you find information about:
QC test and Company names
Date of the first unit tested
Name of the production batch
First serial number tested
Total number of units tested, number of “good” and “bad” units
Under
-
TEST REPORT you find information about:
DUT test result with serial number and time of production
Single tests results
Names of the saved files
The QC Report panel is also the starting point for reviewing a saved measurement
as described below. The name of the saved file is a sensible area where you can
double-click to review the measurement.
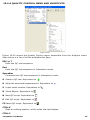
19.4.3 REVIEWING A MEASUREMENT
During a QC tests session it is possible to review a measurement that has been
saved to disk. This is important when, for example, trying to understand why a
measurement went bad. As we saw before the QC report panel indicates all the
names of the files that have been created during the test execution, under the
relative serial number and single test number.
19 QUALITY CONTROL
21
Figure 19.17
As soon as a QC sequence is terminated simply open the tree view of your interest,
identify the measurement you want to inspect and double click on its name
(Fig.19.17). CLIO loads the measurement as if it were performed inside the running
QC, together with its pertinent limits and executes all the calculations defined in the
QC script ending with the result check and display. Fig.19.19 describes such a
process; compare it with Fig.19.12.
DOUBLE-CLIK
ON REPORT
TREE VIEW
LOAD LIMITS
FILE
LOAD
REFERENCE
FILE
LOAD
MEASUREMENT
FROM DISK
BAD
CHECK
RESULT
CALCULATE
OPTIONAL
PARAMETERS
GOOD
DISPLAY
RESULT
REVIEW MEASUREMENT
Figure 19.19
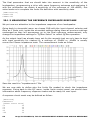
Reviewing a saved measurement from within QC is different from simply opening
the file from the measurement control panel; in this second case no post processing
due to QC operation is applied. Fig. 19.19 shows a measurement (black curve)
reviewed inside QC with its limits (red and blue curves) and the same measurement
loaded from the measurement control panel (purple curve); the shift in level is due
to QC operation when it separately checks for relative level and frequency behavior.
22
19 QUALITY CONTROL
Figure 19.19
Note: the review operation can be done only when inside a QC session; if CLIO is
exited, then later QC is started again a new QC session will be created; report
information and review operation will only apply to the new session.
19 QUALITY CONTROL
23
19.4.4 THE QC RESULT PANEL
Figure 19.20
The QC Result panel usually accompanies QC sessions where measurement display
is not needed. This results in a situation with simple go-no-go masks for use with
completely automatic lines or for operators who don't need to take particular
actions with respect to the test result.
To activated the QC Result panel from within the QC script use the DISPLAY=0
keyword.
Note: for maximum QC test speed use the QC Result display and don't
show single measurements as the display of graphical objects and
measurement curves usually employs a lot of processor time.
The QC Result panel can be forced to appear at the end of the QC sequence
pressing the button.
If Shrink QC result is selected in the associated drop down menu the QC result
panel will appear in a minimized version.
19.4.5 THE QC BANNER
Figure 19.21
The QC Banner is managing information and messages given to the operator while
in Interactive mode.
24
19 QUALITY CONTROL
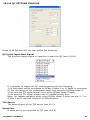
19.4.6 QUALITY CONTROL MENU AND SHORTCUTS
Figure 19.22
Figure 19.22 shows the Quality Control menu accessible from the Analysis menu.
Seen below is a list of all the available Hot Keys.
ESC or T
Exits the QC test sequence.
End
Exits the QC test sequence in Interactive mode.
SpaceBar
Continues the QC test sequence in Interactive mode.
G Starts a QC test. Equivalent to .
K Skip last executed measurement. Equivalent to
S Input serial number. Equivalent to
R Show Report. Equivalent to
N New QC script. Equivalent to
E Edit QC script. Equivalent to
F2 Saves QC script. Equivalent to
CTRL-E
Ends an editing session, while inside the text display.
CTRL-C
19 QUALITY CONTROL
25
Copy selected text.
CTRL-V
Paste selected text.
CTRL-X
Cut selected text.
CTRL-Z
Undo/redo text input.
Q Show QC script. Equivalent to
L Show Limits. Equivalent to
I
Show Information. Equivalent to
H Hide Limits. Equivalent to
M Release measurements. Equivalent to
19.4.7 QC REGISTERED FILE EXTENSIONS
CLIO Quality Control registers the following files extensions beyond the ones
already registered by CLIO.
QC script files.
QC Limits files.
26
19 QUALITY CONTROL
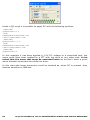
19.4.8 QC OPTIONS DIALOGS
Under CLIO Options>QC you may define the following:
QC Script Input Start Signal
The external trigger signal or condition to start the QC (see 19.8.4).
It is possible to trigger the QC tests sequence with the following:
1) A foot pedal switch connected to QCBox (Model 4 or 5) Pedal In connector.
2) The connection of the loudspeaker under test sensed by QCBox Model 5.
3) An external TTL signal wired to one of the QCBox Model 5 input.
4) An external TTL signal wired to the PC parallel printer port.
Note: For fastest operation when using QCBox Model 5 input use bits 2, 3 or
4. Bits 0 and 1 requires minimum 100ms duration.
TCP Server
The listening port of the TCP server (see 20.2).
Serial Port
A serial port to be controlled by QC (see 19.8.8).
19 QUALITY CONTROL
27
19.5 MY FIRST QC SCRIPT
19.5.1 WHAT TO KNOW ABOUT QC SCRIPTS
A quality control script is a text file that stores information in logical groupings,
called sections.
Each section is initiated by a bracketed keyword in the form [keyword].
Within each section, QC definitions are stored in named keys.
Keys within a section take the form keyword=value.
For example the section called [GLOBALS] defines several settings useful all along
the test sequence:
[GLOBALS]
COMPANY=MY COMPANY
TITLE=MY QUALITY CONTROL
BATCH=MY PRODUCTION BATCH NAME
It is possible to input comment lines initiated by a semicolon. It is not possible to
start a comment after a keyword.
;this is a correct comment line
COMPANY=MY COMPANY ;this comment is not allowed
With an understanding of these brief notes you are ready to write a QC script.
19.5.2 HOW TO WRITE MY FIRST QC SCRIPT
You may write your script with any text editor that stores plain ASCII files (usually
'.txt' ones), like Notepad; the only thing you should remember is that QC scripts
must have the '.qc' extension while limits files use the '.lim' extension; the common
behavior of Windows to hide registered file extensions sometimes renders this
action difficult. It is not uncommon to believe you have saved a file with, say, the
name 'myfile.qc' (where you tried to force the extension) and then find it actually
saved as 'myfile.qc.txt' because the text editor automatically appended the
registered extension.
You may write your script directly by editing it within the QC control panel text
display; in this case the extension management is guaranteed by CLIO and you will
be able to use some tools, like measurements capture, that are of help during
everyday jobs. By doing it like this it is possible to immediately test the script by
pressing Go.
Let's now write our first QC script.
Have your CLIO system in the same setup as when you performed the system
calibration: output A connected to input A; see chapter 3 for details. Don't connect
any external device to the system. Set output level at 0dBu and input sensitivity at
0dBV (see Chapter 4 for details). Have the default settings loaded.
Open MLS; press Go. You should obtain a straight line as in Fig.19.23. Expand the
display to obtain 2dB/div ans set upper Y scale value to -2dBV. Save this
measurement as 'Loop.mls'.
28
19 QUALITY CONTROL
Figure 19.23
Now open the QC control panel. Press N, we are starting a new script. Press Ctrl-E
to exit edit mode and then press L to enter Limits Text mode. Input the following
frequency masks as limits:
[UPPER LIMIT DATA]
20
-4.2
30
-4.7
15000
-4.7
20000
-4.2
[LOWER LIMIT DATA]
20
-6.2
30
-5.7
15000
-5.7
20000
-6.2
Press F2 and save the limits file as 'loopmls.lim'. Now click now on the
(script)
button and then click on the
(capture) button. Your blank text display should
now be filled with your first QC script:
[MLS]
OUT=0.0
IN=0
REFERENCE=LOOP.MLS
LIMITS=LOOPMLS.LIM
It is a good practice to add the following comment line:
COMMENT=FREQUENCY RESPONSE
Click on the
go button; the QC processor should execute a QC test performing
an MLS measurement, displaying it together with the defined limits, everything as
in Fig.19.24; the text display should now present information on the executed test.
19 QUALITY CONTROL
29
Figure 19.24
Let's now complete this first exercise by adding a Multimeter measurement of level
and total harmonic distortion at 1kHz.
Press F4 to open (and run) the Multimeter control panel, then click on the
generator button to switch the generator on and play the default 1kHz sinusoid.
Now press T to stop measuring; save this measurement as 'loop.met'; Fig.19.25
should be what you have in front of you.
Figure 19.25
Now press Ctrl-Q and then L to go back to inputting a limits file definition. Input
the following:
30
19 QUALITY CONTROL
[UPPER LIMIT DATA]
VOLTAGE=0.78
THD=0.01
[LOWER LIMIT DATA]
VOLTAGE=0.77
THD=0.0001
Save this as 'loopmet.lim'. Now click on the
button and position the cursor
inside the text display after the last line of text; as before, click on the capture
button and the following lines should be added and you are ready for this new QC
test.
[MET]
OUT=0.0
IN=0
REFERENCE=LOOP.MET
LIMITS=LOOPMET.LIM
It is a good practice to add the following comment line:
COMMENT=LEVEL+THD
Now pressing the Go inside QC executes this two-measurement QC test sequence;
Fig.19.26 shows the test at its end.
Figure 19.26
This concludes our first approach to QC script writing and debugging. All the files
necessary
to
"study
this
lesson"
are
furnished
within
the
'My
Documents\Audiomatica\CLIO 10 EXAMPLES\MY FIRST QC' folder.
The 'loop.qc' script is doing exactly what has just been described with a difference:
measurements are performed in interactive mode; just load it and run it to feel
the differences.
19 QUALITY CONTROL
31
19.6 NOTES ON LIMITS CURVES
As previously outlined the QC processor needs limits data in order to perform the
required checks. This data is saved within the limits files and usually represent a
frequency mask (for frequency response and impedance tests) but they can also
define a single value check (like, for example, a Qms test).
When dealing with frequency checks the options defined affect the way the
frequency masks are calculated, the way data is displayed on screen and the way
that the result is checked. It is also possible to add an average or single frequency
level check that concurs with the final result.
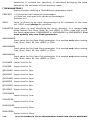
Fig. 19.27 shows us the procedure for calculating the frequency mask after the
limits file is loaded into memory. You can see that the frequency data sets saved
under [UPPER LIMIT DATA] and [LOWER LIMIT DATA] are treated differently if the
limits are absolute or relative (see 19.6.1) or if an aligned point is defined (see
19.6.3).
LOAD LIMITS
FILE
RELATIVE?
YES
GET
REFERENCE
DATA
NO
ALIGNED?
YES
GET ALIGN
POINT
DATA
CALCULATE
LIMITS
CURVES
NO
Figure 19.27
Fig.19.28 shows us the way a frequency check is performed and the measurement
is presented on screen. You may appreciate the presence of an average level (or
sensitivity) check (see 19.6.2) or a single point (aligned) level check (see 19.6.3)
that concurs with the final result. When a level (or sensitivity) check is
defined, either the measured curve or the limits curves are shifted if
presented on screen; in this way it is possible to appreciate the frequency
behaviour of the measured curve without the effect of a difference in sensitivity
which is checked separately.
AVERAGE
LEVEL CHECK?
NO
SHIFT
MEASUREMENT
CURVE
YES
CHECK
RESPONSE
NO
YES
ALIGNED?
CALCULATE
LEVEL @
ALIGN POINT
FLOATING
LIMITS?
YES
SHIFT LIMITS
CURVES
FINAL
RESULT
NO
CALCULATE
LEVEL IN
LIMITS BAND
CHECK
LEVEL
Figure 19.28a frequency plus average level check
32
19 QUALITY CONTROL
NO
SENSITIVITY
CHECK?
SHIFT
MEASUREMENT
CURVE
YES
CHECK
RESPONSE
NO
YES
SINGLE
FREQUENCIES?
CALCULATE
SENSITIVITY @
DEFINED
FREQUENCIES
FLOATING
LIMITS?
YES
SHIFT LIMITS
CURVES
FINAL
RESULT
NO
CALCULATE
SENSITIVITY IN
LIMITS BAND
CHECK
SENSITIVITY
Figure 19.28b frequency plus sensitivity check
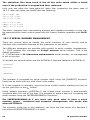
As a final, but not less important note, we show an alternative method to define a
limits file; it is possible to input the frequency mask as a text file as below.
[UPPER LIMIT DATA]
FILE=UPPER.TXT
[LOWER LIMIT DATA]
FILE=LOWER.TXT
The files 'upper.txt' and 'lower.txt' are export ASCII files that may be produced by
other applications or CLIO itself.
The 'upper.txt' file may look like:
Freq[Hz]
100
500
5000
10000
19 QUALITY CONTROL
dBV
5
3
1
5
33
19.6.1 ABSOLUTE VS. RELATIVE FREQUENCY LIMITS
The following limits file defines an absolute frequency limit.
[ABSOLUTE]
[UPPER LIMIT DATA]
200
100
300
97
10000
97
15000
100
[LOWER LIMIT DATA]
200
82
300
85
10000
85
15000
82
The frequency mask is shown in Fig.19.29.
Figure 19.29 and 19.30
The following limits file defines a relative frequency limit.
[RELATIVE]
[UPPER LIMIT DATA]
200
5
300
2
10000
2
15000
5
[LOWER LIMIT DATA]
200
-5
300
-2
10000
-2
15000
-5
The frequency mask is shown in Fig.19.30. Relative means with respect to the
reference file defined in the QC test. Data values will be added and subtracted
to the reference value at the specified frequencies.
Relative data values may be considered as percentages. The following keywords is
required.
[RELATIVE]
PERCENT=1
The above mask may be defined for an impedance measurement curve and
considered as percentage; in this assumption it the calculated limits curves would
34
19 QUALITY CONTROL
differ by ±2% in the 300-10000Hz region while ±5% outside with respect to the
reference.
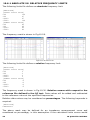
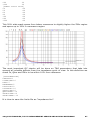
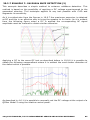
An important feature for a relative file is the possibility of adding a frequency
jitter to the calculated limits curves. This quantity is expressed in fractions of
octaves and tells how much jittering is applied to the limits. The effect, shown in
the below curves is to allow rapidly changing (but small) frequency behaviors of the
measured curves while not loosening too much the mask.
The limit curves in the left figures have no jitter but may be problematic during QC
operation, easily giving false negatives, due to the break-up effects in the higher
part of the spectrum.
Adding a 1/3 of octave jittering with:
[RELATIVE]
FREQJITTER=0.3
You obtain the relative limits as in the right figure which cure the problem not
giving rise to false negatives while keeping the mask tight.
It is possible to input up to 2048 frequency points to define the check mask. The
QC processor will execute the check starting from the first frequency point, ending
at the last; no check will be done outside this frequency range.
Inside a frequency limits file it is possible also to define frequency masks for
executing a QC check on the following:
- Average (or single frequency) level (19.6.2 and 19.6.3)
- Sensitivity (average or up to eight frequencies) (19.6.4)
- A/B difference between channels in a stereo measurement (19.6.6)
- Sinusoidal THD, Single harmonic or Fast-Track Rub&Buzz response (19.6.7)
- T&S parameters (Fs,Qt,Qe,Qm,Cms,Mms,Mmd,Vas,Bl,dBSPL,ZMin) (19.6.8)
- Loudness Rating (RLR, SLR, STMR) (19.6.9)
A frequency limit file can be applied to an MLS, Sinusoidal or FFT test. To define a
limits file for a Multimeter measurement see later.
19 QUALITY CONTROL
35
19.6.2 AVERAGE LEVEL CHECK
The following limits file defines an average level check inside the same relative
frequency limit shown before.
[RELATIVE]
[LEVEL]
UPPER=3
LOWER=-3
FREQHI=5000
FREQLO=400
[UPPER LIMIT DATA]
200
5
300
2
10000
2
15000
5
[LOWER LIMIT DATA]
200
-5
300
-2
10000
-2
15000
-5
When a level check is defined inside a limits file the QC result is actually a
combination of two separate checks; one is the frequency behavior of the
measurement compared against the frequency mask, the second is a level check
which compares the average level of the measured curve with the average level of
the reference.
The average level is calculated within the frequency extremes defined by FREQHI
and FREQLO as shown in Fig.19.31a.
Figure 19.31a
As default, if FREQHI and FREQLO are not defined, the levels are calculated
averaging in the frequency band defined by the extremes frequencies of
the limits.
Fig.19.31b shows such a situation; the title of the measurement control panel
reports the level check.
36
19 QUALITY CONTROL
Figure 19.31b
The level check shown means that the value of the measurement averaged in the
band shown is 0.09dB higher than the reference average level in the same
frequency band.
The measured curve is shifted from this value and then the frequency
check is performed (see also 19.6.4).
The level shift means that the curve is displayed with a different level from
the measured one. Refer also to Fig. 19.19.
As two separate checks are done there may be two distinct cases when a unit
results in a bad report. The following figures try to explain these two cases.
Figure 19.32 shows us the case of a unit is testing bad because the frequency
behavior is not good while the average level is OK.
Figure 19.32
19 QUALITY CONTROL
37
Figure 19.33, instead, shows us the case of a unit is testing bad because the
average level is not good while the frequency behavior is OK.
Figure 19.33
38
19 QUALITY CONTROL
19.6.3 ALIGNED MASK
The following limits file defines a single point level check with a frequency
mask aligned to it.
[ABSOLUTE]
[LEVEL]
UPPER=3
LOWER=-3
ALIGNFREQ=5000
ALIGNLEV=90
[UPPER LIMIT DATA]
200
5
300
2
800
2
1000
6
3000
6
4000
2
7000
2
15000
8
[LOWER LIMIT DATA]
200
-5
300
-2
10000
-2
15000
-5
The align point (in the example 90dBSPL@5000Hz) is used to build the frequency
mask (that is specified relative to it) and also to identify the frequency at which to
perform the level check.
Figure 19.34
Fig.19.34 shows a mask aligned to the point (90dBSPL@5000Hz). The level check
means that the value of the measurement at 5000Hz is 0.22dB higher than the
align point.
The measured curve is shifted from this value to pass at exactly 90dBSPL
at 5000Hz; then the frequency check is performed (see also 19.6.4).
The level shift means that the curve is displayed with a level different from
the measured one. Refer also to Fig. 19.19.
19 QUALITY CONTROL
39
19.6.4 SENSITIVITY CHECK
The following limits file defines a sensitivity check inside a relative frequency
limit.
[RELATIVE]
[SENSITIVITY]
UPPER=102
LOWER=100
[UPPER LIMIT DATA]
200
10
500
10
1000
5
1500
5
2000
10
4000
10
[LOWER LIMIT DATA]
200
-10
500
-10
1000
-5
1500
-5
2000
-10
4000
-10
As per the average level check, when a sensitivity check is defined inside a limits
file the QC result is actually a combination of two separate checks; one is the
frequency behavior of the measurement compared against the frequency mask, the
second is a sensitivity check which compares the sensitivity of the measured curve
with the defined upper and lower limits.
It is possible to calculate sensitivity at discrete frequencies (up to eight) and
average them together.
[SENSITIVITY]
FREQ1=500
FREQ2=1000
FREQ3=2000
UPPER=102
LOWER=100
40
19 QUALITY CONTROL
19.6.5 FLOATING LIMITS VS. FLOATING CURVES
When an average or single frequency level check is defined (19.6.2 or 19.6.3) it is
possible to define floating limits instead of floating curves using the [FLOATING]
keyword.
[RELATIVE]
[FLOATING]
[LEVEL]
UPPER=3
LOWER=-3
[UPPER LIMIT DATA]
200
5
300
2
10000
2
15000
5
[LOWER LIMIT DATA]
200
-5
300
-2
10000
-2
15000
-5
In this case the measured curve is presented on screen with correct values
while the limits curves are moved around it.
19 QUALITY CONTROL
41
19.6.6 SINUSOIDAL A/B STEREO DIFFERENCE CHECK
When executing a stereo sinusoidal frequency response measurement it is possible
to activate quality control checks over the calculated difference between the two
channels.
The display is possible only for one curve chosen among the pool of the curves
calculated within a single sinusoidal test (see 19.6.7).
Note: When a distortion curve is displayed, its graphical properties are defined
within CLIO Otpions>Graphics>” QC Curve C” .
For A/B stereo difference QC check do the following:
1) Execute and save a stereo reference measurement.
2) Define a limits file adding the limit definition:
[A/B UPPER LIMIT DATA]
[A/B LOWER LIMIT DATA]
Select A/B calculated curve for display:
[A/B DISPLAY]
42
19 QUALITY CONTROL
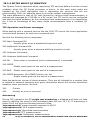
19.6.7 SINUSOIDAL THD AND FAST-TRACK RUB&BUZZ CHECK
When executing sinusoidal frequency response measurements it is possible to
activate quality control checks over calculated THD, Rub-&Buzz or single harmonic
(from 2nd to 10th) response curves.
Calculation and QC check is possible for any distortion curve.
The display is possible only for one curve chosen among the pool of the curves
calculated within a single sinusoidal test (see 19.6.6).
Note: When a distortion curve is displayed, its graphical properties are defined
within CLIO Options>Graphics>” QC Curve C” .
For THD and Harmonics QC check do the following:
1) Execute and save a reference measurement with “THD Enabled” under settings.
2) Define a limits file adding the limit definition:
[THD UPPER LIMIT DATA]
for THD and for any harmonic (if desired):
[2 UPPER LIMIT DATA]
[3 UPPER LIMIT DATA]
..
..
[10 UPPER LIMIT DATA]
Select one calculated curve for display:
[THD DISPLAY]
For Fast-Track Rub&Buzz QC check do the following:
1) Execute and save a reference measurement with “R&B Enabled” under settings.
2) Define a limits file adding the limit definition:
[RUB+BUZZ UPPER LIMIT DATA]
Select rub&buzz curve for display:
[RUB+BUZZ DISPLAY]
NOTE 1: If more than one curve is selected for display only one will be displayed,
the others only calculated and QC check done; to inspect the curves not diplayed
after a QC test is finished you must release the measurement (see 19.4.1) and
operate the proper buttons within the sinusoidal menu.
NOTE 2: If a level or sensitivity check is performed within the QC check and the
distortion data are expressed in dB units (not % units) the calculated limit masks
(R&B, THD and nth Harmonic) will be shifted to take into account the sensitivity
difference with the reference.
19 QUALITY CONTROL
43
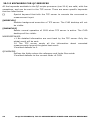
19.6.8 THIELE&SMALL PARAMETERS CHECK
It is possible to execute QC tests of the following T&S parameters:
Qt, Qe, Qm, Fs, Cms, Mms, Mmd, Bl, Vas, dBSPL and ZMin.
To evaluate the first four parameters it is necessary to input the value of the DC
resistance of the voice coil with the keyword REDC.
To evaluate the remaining parameters, by means of a simplified estimation routine,
it is necessary to input the value of the driver diameter with the keyword
DIAMETER and one of the following fixed quantities: KNOWNMMD (fixed mass) or
KNOWNMMS (fixed mass plus air load) or KNOWNCMS (fixed compliance).
The following limits file defines a T&S parameters check inside a limits file with a
frequency mask for an impedance response. The parameters checked are Qt, Qe,
Qm and Fs.
[TSPARAMETERS]
QTUPPER=0.3
QTLOWER=0.05
QEUPPER=0.3
QELOWER=0.05
QMUPPER=5
QMLOWER=2
FSUPPER=90
FSLOWER=50
REDC=5.5
[UPPER LIMIT DATA]
29.89
142.35
40.52
161.19
102.15
161.19
152.62
143.53
[LOWER LIMIT DATA]
29.89
11.29
49.23
20.00
64.33
45.88
76.28
47.06
98.49
22.35
141.87
11.7
The following section defines a T&S check of Qts, Fs, Cms, Bl and ZMin having
fixed the mechanical mass Mmd value.
[TSPARAMETERS]
REDC=6.2
DIAMETER=110
KNOWNMMD=10.7952
QTSUPPER=0.6
QTSLOWER=0.3
FSUPPER=90
FSLOWER=50
CMSUPPER=1.1
CMSLOWER=0.8
BLUPPER=6.5
BLLOWER=6
ZMINUPPER=7.5
ZMINLOWER=7
44
19 QUALITY CONTROL
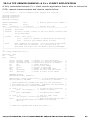
19.6.9 LOUDNESS RATING CALCULATION AND CHECK
It is possible to execute QC tests of the following loudness rating indicators:
RLR, SLR, STMR.
The following limits file defines a loudness rating parameters check inside a limits
file with a frequency mask for an frequency response.
[LR]
SLRUPPER=11
SLRLOWER=5
[UPPER LIMIT DATA]
100
3
200
1.5
3000
1.5
5000
3
[LOWER LIMIT DATA]
100
-3
200
-1.5
3000
-1.5
5000
-3
19 QUALITY CONTROL
45
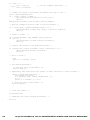
19.6.10 MULTIMETER LIMITS FILES
The following limits file defines a multimeter QC check.
[UPPER LIMIT DATA]
VOLTAGE=0.78
THD=0.01
[LOWER LIMIT DATA]
VOLTAGE=0.77
THD=0.0001
The parameters available are:
-
PRESSURE
VOLTAGE
FREQUENCY
THD
IMD
46
19 QUALITY CONTROL
19.7 MANAGING PRODUCTION BATCHES
Managing a production batch is a rather complex while delicate topic as it involves
diverse needs of diverse areas inside your company.
CLIO QC handles your batch doing the following:
-
Maintains a directory structure where different files are saved
Automatically saves production report files
If requested autosaves data files
Handles 24 characters alphanumeric serial numbers
Auto increments serial number and maintains its coherence
Calculates statistical data about the batch
The result is that you will find the production well documented both for your
internal purposes aimed to achieve the highest quality standard and also for
interfacing with your client who requests technical information about the units.
19.7.1 DIRECTORIES CREATED BY CLIO QC
Suppose you saved your script inside the directory 'My qc'. When you run the script
CLIO automatically creates one or more directories under 'My qc'. There are four
cases depending on the option you set:
1) No Autosave is active. A Batch is not defined.
CLIO creates the 'Report' directory where all the production report files are
saved. Fig.19.37 shows this situation.
2) Autosave is active. A SaveFolder is not defined. A Batch is not defined. CLIO
creates the 'Report' directory where all the production report files are saved. It
also creates the 'Autosave' directory where all data files are saved. Fig.19.38
shows this situation.
Figure 19.37 and 19.38
3) A Batch is defined and is named 'My Batch'. A SaveFolder is not defined.
CLIO creates the 'My Batch' directory where all the production report and also
data files are saved. Fig.19.39 shows this situation.
4) A SaveFolder is defined and is named 'My Savefolder'.
CLIO creates the 'My Savefolder' directory where all the production report and
also data files are saved. Fig.19.40 shows this situation.
Figure 19.39 and 19.40
19 QUALITY CONTROL
47
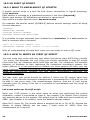
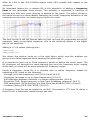
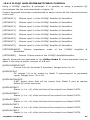
19.7.2 PRODUCTION REPORT FILES
Suppose that today, June 6, 2002, at 6:46, you started a production of your
devices; the batch, named 'My Batch', ended yesterday with unit number 100.
After two units tested CLIO will add, under the folder 'My Batch', the following
report files:
'production_06-06-02_6.46.19.txt'
'101.txt'
'102.txt'
After 20 units tested:
'production_06-06-02_6.46.19.txt'
'101.txt'
'102.txt'
...........
'120.txt'
If you stop the production, exit CLIO, and then restart it at 7:01, after two more
units tested:
'production_06-06-02_6.46.19.txt'
'production_06-06-02_7.01.05.txt'
'101.txt'
'102.txt'
...........
'122.txt'
The files 'production_date time.txt' describe the QC session. They look like:
STATISTICS
MY COMPANY
MY QUALITY CONTROL
BATCH = My Batch
DATE = 06-06-02
INITIAL SN = 101
TOTAL TESTS = 2
GOOD = 2
BAD = 0
TEST REPORT
UNIT N.102 GOOD 6.46.24
1
GOOD MLS
Response GOOD
C:\Program files\Audiomatica\CLIOpci\Data\My qc\My
Batch\102_1.mls
2
GOOD MET
Voltage:0.775Vrms GOOD
THD:0.006% GOOD
C:\Program files\Audiomatica\CLIOpci\Data\My qc\My
Batch\102_2.met
UNIT N.101 GOOD 6.46.19
1
GOOD MLS
Response GOOD
C:\Program files\Audiomatica\CLIOpci\Data\My qc\My
Batch\101_1.mls
48
19 QUALITY CONTROL
2
GOOD MET
Voltage:0.775Vrms GOOD
THD:0.006% GOOD
C:\Program files\Audiomatica\CLIOpci\Data\My qc\My
Batch\101_2.met
The files 'serialnumber.txt' describes the single QC test and look like this:
1 GOOD MLS
Response GOOD
2 GOOD MET
Voltage:0.775Vrms GOOD
THD:0.006% GOOD
06-06-02 6.46.24
UNIT N. 102 GOOD
19.7.3 AUTOSAVED DATA FILES
Again supposing we are in the situation of the preceding paragraph let's see how
data files are saved. As it can be seen from the report files our QC test consists of a
MLS and a Multimeter measurement. As the MLS test is defined before the
Multimeter inside the script then it assumes number 1 as single QC test while the
Multimeter test assumes number 2; this is already clear from the report files above.
After two units tested we find the following measurement files:
'101_1.mls'
'101_2.met'
'102_1.mls'
'102_2.met'
As you see the QC single test numbering is integral part of the name of the
autosaved data file.
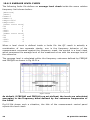
19.7.4 STATISTICAL INFORMATION ON MEASURED DATA
Statistical information characterizing the production can be obtained by CLIO using
the STATISTICS keyword under [GLOBALS].
CLIO will save, under the report directory, the following files:
- One file named 'data_table.txt' with statistical information on all the measured
parameters.
- One file named 'avg_testnumber.txt' for each response test defined containing
the average response for that test.
- One file named 'sdmax_testnumber.txt' for each response test defined
containing the average response plus twice the standard deviation for that test.
- One file named 'sdmin_testnumber.txt' for each response test defined
containing the average response minus twice the standard deviation for that test.
19 QUALITY CONTROL
49
The statistical files keep track of the all the units saved within a batch
even if the production is stopped and then restarted.
Let's now see what the 'data_table.txt' looks like; supposing the same case of
19.7.2, after two tests, we would have the following:
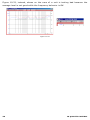
SN Voltage THD
101 0.775 0.006
102 0.775 0.006
Avg 0.775 0.006
SDMax 0.776 0.006
SDMin 0.775 0.006
The other response files representing average and standard deviation curves may
be imported within each control panel with the Import feature recallable with ShiftF3.
19.7.5 SERIAL NUMBER MANAGEMENT
There are several ways to handle the serial numbers of your devices and to
maintain their coherence through all the production of one batch.
Two different strategies are possible with respect to serial number management:
1 - CLIO handles and manages an 8-digit numeric serial number. This is the
default operation.
2 - CLIO accepts a 24 characters alphanumeric serial number; its management
is left to the user.
To activate the second option use the AUTOSN=0 keyword (default is AUTOSN=1).
[GLOBALS]
...
AUTOSN=0
...
...
[SNINPUT]
The operator is prompted for serial number input using the [SNINPUT] keyword.
Input can be done with any kind of bar code reader.
It is also possible to manually input the serial number before starting the test; to
do this just click on the
button.
Under default operation (AUTOSN=1) the 8-digit serial number is automatically
increased after the end of the test. It is possible to avoid a bad unit increasing the
serial number using the INCREASEONBAD=0 keyword.
Set INCREASEONBAD=0 if you want only good units to have a serial
number, report , statistical and autosave management; this works also
when AUTOSN=0.
The operator, under her or his judgment, can force the final result of a bad test if
the keyword PROMPTFORGOOD=1 is used.
50
19 QUALITY CONTROL
19.7.6 THE SKIP LAST BUTTON
When a QC test is finished it is also possible to null its result by pressing the Skip
Last
button. All information saved with the test will be erased comprising serial
number increment and statistical data. The production report will mark the unit as
'SKIPPED'.
19 QUALITY CONTROL
51
19.8 INTERACTING WITH EXTERNAL HARDWARE
The interaction with external hardware gives CLIO the possibility of realizing semi
or fully automatic production line QC tests. Several keywords have been introduced
to implement this functionality (see to reference section for a complete listing).
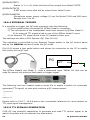
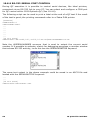
19.8.1 INPUT SENSITIVITY AND OUTPUT VOLTAGE CONTROL
As we have already seen it is of fundamental importance to correctly set CLIO's
input sensitivity and output level (see 4.5). The IN and OUT keywords are used for
this. The script below sets the input sensitivity at 10dBV and output level at 0dBu.
These numbers also directly appear also in the main tool bar of CLIO.
...
IN=10
OUT=0
...
The OUTUNITS keyword can be used, under [GLOBALS], to define the output level
unit of measure; you may choose either V, dBV or dBu; default is dBu. To output 1V
simply write:
[GLOBALS]
OUTUNITS=V
...
OUT=1
...
or, even simpler,
...
OUT=1V
...
If you feed the output to a power amplifier the resulting signal at
terminals will be amplified by the gain of the amplifier. It is possible to
effect into account and specify the output level directly at the amplifier’s
the particular case you are using a CLIOQC Amplifier & SwitchBox. The
script can be used to set 2.83V at the output of the amplifier.
amplifier
take this
output in
following
...
OUTQCBOX=2.83V
...
19.8.2 QCBOX MODEL 5 DC OUTPUT CONTROL
The QCBox Model 5 Amplifier&SwitchBox has the capability of superimposing a DC
voltage to the generated signal. It is possible to manage this DC voltage with the
QCBOXDCOUT keyword. This DC voltage ranges from -20 to 20V. The script below
sets a 2V DC at speakers terminals.
[PERFORM]
QCBOXDCOUT=2
52
19 QUALITY CONTROL
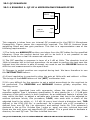
19.8.3 CLIOQC AMPLIFIER&SWITCHBOX CONTROL
Using a CLIOQC amplifier & switchbox it is possible to setup a powerful QC
environment like the ones described in chapter 20.
Custom keywords have been implemented to easily control all the internal functions
of this unit:
[SETINPUT1]
Selects input 1 of the CLIOQC Amplifier & SwitchBox.
[SETINPUT2]
Selects input 2 of the CLIOQC Amplifier & SwitchBox.
[SETINPUT3]
Selects input 3 of the CLIOQC Amplifier & SwitchBox.
[SETINPUT4]
Selects input 4 of the CLIOQC Amplifier & SwitchBox.
[SETINPUT5]
Selects input 5 of the CLIOQC Amplifier & SwitchBox.
[SETINPUT6]
Selects input 6 of the CLIOQC Amplifier & SwitchBox.
[SETINPUT7]
Selects input 7 of the CLIOQC Amplifier & SwitchBox.
[SETINPUT8]
Selects input 8 of the CLIOQC Amplifier & SwitchBox.
[SETIMPEDANCE]
Selects
SwitchBox.
[SETISENSE]
impedance
mode
of
the
CLIOQC
Amplifier
&
Selects I Sense mode of the CLIOQC Ampli&SwitchBox.
Specific keywords are dedicated to the QCBox Model 5; these keywords have no
effect in the case of earlier versions of the unit.
QCBOXCURRENTLIMIT
Current limit (A) for Model 5 operation. Ranges from 0 to 10.
QCBOXDCOUT
DC voltage (V) to be output by Model 5 superimposed to generated
signal. Ranges from -20 to 20.
QCBOXINITIALBYTE
8-BIT binary value that will be output from Model 5 port at startup
before QC script execution.
QCBOXOUTBIT0
Status (=1 or =0) of the bit that will be output from Model 5 BIT0.
QCBOXOUTBIT1
Status (=1 or =0) of the bit that will be output from Model 5 BIT1.
QCBOXOUTBIT2
Status (=1 or =0) of the bit that will be output from Model 5 BIT2.
QCBOXOUTBIT3
Status (=1 or =0) of the bit that will be output from Model 5 BIT3.
QCBOXOUTBIT4
Status (=1 or =0) of the bit that will be output from Model 5 BIT4.
19 QUALITY CONTROL
53
QCBOXOUTBIT5
Status (=1 or =0) of the bit that will be output from Model 5 BIT5.
QCBOXOUTBYTE
8-BIT binary value that will be output from Model 5 port.
QCBOXPHANTOM
Microphone power supply voltage (V) set for Model 5 IN1 and IN2 input.
Ranges from 2 to 24.
19.8.4 EXTERNAL TRIGGER
It is possible to trigger the QC tests sequence with the following:
1) A foot pedal switch connected to QCBox Pedal In connector.
2) The connection of the loudspeaker under test sensed by QCBox Model 5.
3) An external TTL signal wired to one of the QCBox Model 5 input.
4) An external TTL signal wired to the PC parallel printer port.
The settings are within CLIO Options>QC (See 19.4.8).
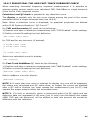
This operation is controlled by the External Trigger button in the QC control panel
and by the MANUAL keyword inside the QC script.
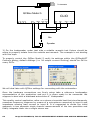
Fig.19.41 shows a foot pedal switch and shows its connection to the PC to enable
the control of the QC test.
PC
LPT
Start
Figure 19.41
The QCBox Model4 and Model 5 have a dedicated input 'PEDAL IN' that can be
used to connect the external foot pedal or trigger signal.
The following lines are needed inside a script file to enable a switch (or externally
generated TTL signal) to start and continue a QC measurement.
[GLOBALS]
...
...
MANUAL=0
Please refer to 19.8.7, 19.8.8 and to the commands reference for more details on
TTL input signal management.
19.8.5 TTL SIGNALS GENERATION
CLIO QC has powerful capabilities to generate and read TTL control signal to be
able to interface with an external line automation.
54
19 QUALITY CONTROL
To manage these TTL signals it is possible to use:
1) The parallel port of the computer, if present.
2) The dedicated Digital I/O port of the QCBox Model 5 (USB controlled).
It is possible to define the status of the bits of the digital port involved; the
following is a list of the kind of signals possible:
- signals output at startup (INITIALBITS, QCBOXINITIALBYTE)
- signals conditioned by the result of a single measure ([IF LAST GOOD], [IF LAST
BAD])
- signals conditioned by the global result ([IF ALL GOOD], [IF ALL BAD])
- unconditioned signals ([PERFORM])
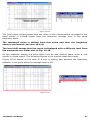
Let's see an example of generation of external signals conditioned by the result of
the measurement (LPT Parallel Port case):
[GLOBALS]
...
...
INITIALBITS=0
[FFT]
...
...
[MLS]
...
...
[IF LAST BAD]
BIT=3
BITVALUE=1
DELAY=200
[IF LAST GOOD]
BIT=3
BITVALUE=0
DELAY=200
[IF ALL GOOD]
BIT=1
BITVALUE=1
[PERFORM]
BIT=0
BITVALUE=1
DELAY=200
[PERFORM]
8BITVALUE=0
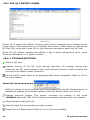
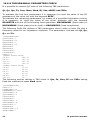
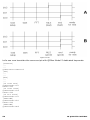
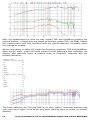
This example defines a signal high on bit 3 if the MLS test performs bad, a signal
high on bit 1 if all the tests are OK and an unconditioned pulse of 200 ms on bit 0
that may be used to signal the end of the QC test sequence.
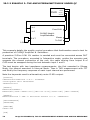
Referring to Figure 19.42 we can see the time signal of the three bits in the two
possible cases A and B; in case A the MLS test performed bad and in case B good.
19 QUALITY CONTROL
55
Figure 19.42
Let's see now translate the same script with QCBox Model 5 dedicated keywords:
[GLOBALS]
...
...
QCBOXINITIALBYTE=0
[FFT]
...
...
[MLS]
...
...
[IF LAST BAD]
QCBOXOUTBIT3=1
DELAY=200
[IF LAST GOOD]
QCBOXOUTBIT3=0
DELAY=200
[IF ALL GOOD]
QCBOXOUTBIT1=1
[PERFORM]
QCBOXOUTBIT0=1
DELAY=200
[PERFORM]
QCBOXOUTBYTE=0
56
19 QUALITY CONTROL
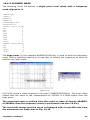
19.8.6 TIME DELAYS GENERATION
It is possible to define a time delay in any point of a script file with the following
definition:
[PERFORM]
DELAY=200
In this example the QC sequence waits for 200 millisecond when encountering
these keywords. In the previous paragraph you can also see the possibility of
mixing time delays with signals definitions in order to generate pulses.
19 QUALITY CONTROL
57
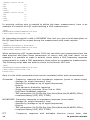
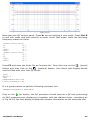
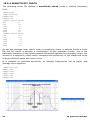
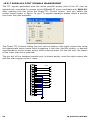
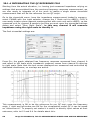
19.8.7 PARALLEL PORT SIGNALS MANAGEMENT
The TTL signals generated with the active parallel printer port of the PC may be
interactively controlled by means of the QCBox&LPT menu recallable with Shift-F4.
After opening this box press the Direct TTL Control button and you obtain the
control panel shown in figure. To get TTL signals operation please select a parallel
port from the ones available.
The Direct TTL Controls dialog lets you set the status of the eight output bits using
the appropriate check boxes while triggering it with the Set Bits button; a decimal
representation of the output binary word is also present. On the left side the status
of the input start bit is reported.
The pin-out of the standard parallel port is shown below; note the eight output bits
and the start trigger pulse in input.
1
14
2
15
3
16
4
17
5
18
6
19
7
20
8
21
9
22
10
23
11
24
12
25
13
58
BIT 0
BIT 1
BIT 2
BIT 3
BIT 4
BIT 5
BIT 6
BIT 7
START
19 QUALITY CONTROL
19.8.8 QCBOX MODEL 5 DIGITAL I/O SIGNALS MANAGEMENT
Using the QCBox Model 5 Digitali I/O port it is possible to generate/monitor TTL
signals to be used for interfacing along production lines; these key features are
controlled over the USB connection of the Model 5 so there is no need for legacy
devices like LPT ports.
The TTL signals generated with the QCBox Model 5 may be interactively controlled
by means of the QCBox&LPT dialog recallable with Shift-F4. After opening this box
press the Model 5 button and you obtain the control panel shown in figure.
The Model 5 Controls dialog lets you interactively set the status of the output bits
while monitoring the input ones; simply click on green pin to control its status.
The pin-out of the Digital I/O port of the QCBox Model 5 is shown in figure; note
the six output bits, the four input bits and the +5V line.
1
14
2
15
3
16
4
17
5
18
6
19
7
20
8
21
9
22
10
23
11
24
12
25
13
19 QUALITY CONTROL
BIT 0
BIT 1
BIT 2
BIT 3
BIT 4
BIT 5
TTL TURNTABLE
CONTROL
BIT 0
BIT 1
BIT 2
BIT 3
BIT 4
+5V
59
19.8.9 RS-232 SERIAL PORT CONTROL
During QC execution it is possible to control serial devices, like label printers,
connected via an RS-232 link to your PC. You can select and configure a COM port
for QC control within CLIO Options>QC (See 19.4.8).
The following script can be used to print a label at the end of a QC test if the result
of the test is good; the printing commands refer to a Zebra Z4M printer.
[GLOBALS]
OPENSERIAL=1
SERIALMONITOR=1
...
...
...
...
...
...
[IF ALL GOOD]
SERIALOUT=^XA^LH40,100,^F020,10^AD^FD@SERIALNUMBER^FS^XZ
Note the @SERIALNUMBER acronym that is used to output the current serial
number. It is possible to activate, mainly for debugging purposes, a monitor window
that echoes RS-232 activity; to do this use the SERIALMONITOR keyword.
The same text output in the above example could be saved in an ASCII file and
loaded with the SERIALOUTFILE keyword:
...
...
[IF ALL GOOD]
SERIALOUTFILE=SERIAL.TXT
60
19 QUALITY CONTROL
20 QC BY EXAMPLES, TCP-IP
SERVER AND SYNTAX REFERENCE
MEASUREMENT
20.1 A COMPLETE, FAST, SINGLE-TEST LOUDSPEAKER QUALITY
CONTROL
CLIO QC is able to program and execute a very fast, accurate and complete, singletest quality control of a loudspeaker using the new functionality of the sinusoidal
measurement menu.
One of the key features of this approach is represented by the new FAST-TRACK™
rub&buzz detection that is carried out along the sinusoidal sweep.
With just one sinusoidal sweep it is possible to measure:
- Frequency response
- Impedance reponse
- Sensitivity
- Polarity
- Total harmonic distortion response
- Single harmonic response (from 2nd to 10th)
- Rub&Buzz
- T&S parameters (Fs,Qt,Qe,Qm,Cms,Mms,Mmd,Vas,Bl,dBSPL,ZMin)
Choosing among the various settings of the sinusoidal test it is possible to tailor the
QC test easily, controlling the trade-offs between speed and accuracy.
This example describes a test setup and the relative QC script that may be
implemented in an automatic production line capable of cycle times of 1 to 2
seconds with a sweep time of around 1s.
20.1.1 HARDWARE REQUIRED
The following parts of the CLIO system are needed to achieve this kind of QC test:
- CLIO FW-01
- QCBox Model 5
- Microphone (MIC-01,02 or 03)
- Optional 19”rack QC panel
The CLIO system hardware presents itself as in this picture:
The basic connections required are listed here:
1) On the electro-acoustic side we find the QCBox used as power amplifier,
microphone directly connected to CLIO, current sensing to channel B input to
measure impedance.
2) On the digital side we find the connection with an external automation that gives
a TTL start signal to the QC test and is informed by three output bits of its current
status.
20 QC BY EXAMPLES, TCP-IP MEASUREMENT SERVER AND SYNTAX REFERENCE
61
BIT2 IN
BIT2 OUT
BIT1 OUT
BIT0 OUT
9
To Automation
3 2 1
DIGITAL I/O
QCBox Model 5
In1 In2 In3 In4
D.U.T.
ISense
CLIO
To From
CLIO CLIO
IN A
IN B
OUT A
OUT B
Mic
Speaker
3) On the loudspeaker under test side a suitable acoustic test fixture should be
setup to properly isolate from the outside environment. The example is not dealing
with this topic.
To properly control the QCBox Model 5 verify its settings within the QCBox&LPT
Controls dialog; default settings (i.e. 2A output current limiting) should be OK for
many DUTs.
We will deal later with QCBox settings for connecting with the automation.
Once the hardware connections are firmly setup take a reference loudspeaker
representative of the production and put it in place ready to be measured. We
suppose to deal with a wideband automotive 4” loudspeaker.
This quality control application relies on a stereo sinusoidal test that simultaneously
measures frequency response by means of a microphone connected to input A and
impedance sensing load current to input B. It is suggested to divide the initial
approach in two separate single channel measurements of the two quantities and
finally integrate them into a single stereo one.
62
20 QC BY EXAMPLES, TCP-IP MEASUREMENT SERVER AND SYNTAX REFERENCE
20.1.2 MEASURING THE REFERENCE FREQUENCY RESPONSE
Open the sinusoidal menu. Let’s start with the acoustic frequency response and set
up the required sweep opening the settings dialog. The main parameters affecting
sweep are: frequency range chosen from 30Hz to 15kHz, resolution of 1/12 of
octave supposed to be fine and speed that is set to “Fast” as best tradeoff for
rub&buzz testing.
Before taking the first reference measurement you still need to set the proper
output level (here chosen 1V at speaker terminals) as indicated by DUT
specifications and accordingly set input sensitivity of CLIO input A; as the final
measurement will be stereo operate separately the two input channel controls
releasing the Link Input Controls button in the hardware toolbar; initial input A
sensitivity is -10dBV (channel B is left to 0dBV).
Now, within the sinusoidal menu, choose CHA input channel selection and dBSPL as
Y scale unit. Press go. The first measurement gives you the following result
one important parameter now clear is the sweep time that is shown in the
sinusoidal menu status bar: with these settings we have 1.05 seconds sweep time.
Consider it fine. Save the result to “response.sin” file.
The test should now be tuned up to take into account the acoustic environment and
completed with missing settings. Open the sinusoidal settings dialog; proper delay
should be set to compensate for microphone distance to loudspeaker, this may be
evaluated by the two common ways CLIO gives you i.e. taking a trial sinusoidal
measurement with auto delay active or taking a parallel MLS&LogChirp
measurement and inspecting the impulse response; in our case we found a 0.2ms
delay to be compensated, due to a quasi near field measurement with a
microphone to DUT distance, in the acoustic fixture, of circa 7cm. Final settings
required are about distortion curves; we need to activate THD and Rub&Buzz
calculations clicking on “THD Enabled” and “R&B Enabled”, the Rise parameter is set
to 0dB as we are going to accommodate all displayed curves inside one single
100dB Y scale graph. Execute the measurement with final frequency response
settings.
20 QC BY EXAMPLES, TCP-IP MEASUREMENT SERVER AND SYNTAX REFERENCE
63
After the measurement is done we may inspect THD and Rub&Buzz pressing the
relative buttons, in figure they are shown as overlays (green THD, red R&B). Repeat
the measurement until fully confident with the results obtained, eventually refine
the settings as needed.
We are now ready to define QC masks for frequency response, THD and Rub&Buzz.
Open the QC menu, press the limits button to start defining a limit definition; we
require, and manually input, a relative mask to frequency response with the
following behavior:
[RELATIVE]
[UPPER LIMIT DATA]
20
10
80
10
100
3
5000
3
6000
5
20000
5
[LOWER LIMIT DATA]
20
-10
80
-10
100
-3
5000
-3
6000
-5
20000
-5
The limits definition for THD and R&B is, for their nature, inherently absolute and
only requires an upper curve so we may begin defining them by direct, on-screen,
drawing.
64
20 QC BY EXAMPLES, TCP-IP MEASUREMENT SERVER AND SYNTAX REFERENCE
Pressing the THD button, inside sinusoidal menu, you obtain the THD curve; inside
QC you press the “Draw Limits Controls” button and you are allow to draw a limit
curve directly on the sinusoidal graph; at the end the QC limit definition panel will
be filled with data about the drawn limit:
[THD UPPER LIMIT DATA]
30.81
69.56
174.96
69.78
639.82
80.62
1603.03
78.19
10869.90
64.25
10869.90
64.25
Pressing the R&B button, inside sinusoidal menu, you obtain the R&B curve; inside
QC you press the “Draw Limits Controls” button and you are allowed to draw a limit
curve directly on the sinusoidal graph; at the end the QC limit definition panel will
be filled with data about the drawn limit:
[RUB+BUZZ UPPER LIMIT DATA]
30.11
48.32
143.15
48.76
445.16
60.49
1692.02
59.38
3924.35
30.18
It is time to save the limits file as “response.lim”.
As we are dealing with an unsmoothed frequency response that is presenting some
high frequency “peaks and dips” we like to give a 1/6 of octave frequency jittering
to the calculated limits curve:
[RELATIVE]
FREQJITTER=0.16
That gives our frequency mask a more comfortable behavior that is less prone to
give false negatives in that troubled spectrum range.
20 QC BY EXAMPLES, TCP-IP MEASUREMENT SERVER AND SYNTAX REFERENCE
65
The final parameter that we should take into account is the sensitivity of the
loudspeaker; programming a chirp with same frequency extremes and analyzing it
with the multimeter we obtain a sensitivity of the reference of 106 dBSPL; this
value leads us to complete the limits file definition with sensitivity data.
[SENSITIVITY]
UPPER=109
LOWER=103
20.1.3 MEASURING THE REFERENCE IMPEDANCE RESPONSE
We put now our attention to the impedance response of our loudspeaker.
Going back to sinusoidal menu we choose CHB with the input channel selector and
Ohm as Y Scale unit; inside the sinusoidal settings dialog leave all previous settings
unchanged as they will accompany us to the final reference measurement; only
change the impedance settings to “QCBox Select” to reflect QCBox operation.
As the output level has already been set for the acoustic test we only have to deal
with input sensitivity for channel B; a settings of -30dBV or -40dBV is usually
correct for ISense impedance tests. The measurement looks as follow.
Save the result to “impedance.sin” file.
We are now able to define also the limits file needed to check the impedance
response. Going back to the QC menu, inside limits control panel, we should clear
information about frequency response masks and be ready for new input.
A response check mask may be defined as follow:
[RELATIVE]
PERCENT=1
[UPPER LIMIT DATA]
20
20
50
20
60
30
90
30
100
20
66
20 QC BY EXAMPLES, TCP-IP MEASUREMENT SERVER AND SYNTAX REFERENCE
200
20
1200
20
[LOWER LIMIT DATA]
20
-20
50
-20
60
-30
90
-30
100
-20
200
-20
1200
-20
This 20% wide mask spans from below resonance to slightly higher the ZMin region
and opens up to 30% in resonance region.
The most important QC checks will be done on T&S parameters that take into
account all possible defects from the impedance point of view. In this definition we
check Fs, Qms and ZMin to be within 10% from reference.
[TSPARAMETERS]
PERCENT=1
DIAMETER=10
REDC=7
KNOWNMMD=5
FSUPPER=10
FSLOWER=-10
QMSUPPER=10
QMSLOWER=-10
ZMINUPPER=10
ZMINLOWER=-10
It is time to save the limits file as “impedance.lim”.
20 QC BY EXAMPLES, TCP-IP MEASUREMENT SERVER AND SYNTAX REFERENCE
67
20.1.4 INTEGRATING THE QC REFERENCE FILE
Starting from the actual situation, i.e. having just measured impedance relying on
settings that accumulated from the previous frequency response measurement, we
are now ready to integrate all of our work to realize a single stereo sinusoidal
measurement that will be the reference for our QC script.
Go to the sinusoidal menu, have the impedance measurement loaded in memory;
select CHA&B with the input selector, change the Y Scale unit to dBSPL; CLIO is
now ready to take a two channels measurement with main unit set to dBSPL; as the
measured unit for channel B needs to be Ohm we must open the sinusoidal settings
dialog and select “Ohm Right Scale”: in this way channel B will measure
impedance using the right scale to identify it.
The final sinusoidal settings are:
Press Go; the graph obtained has frequency response measured from channel A
and refers to left scale while impedance response comes from channel B referring
to right scale. Note that the two curves displayed are measured and controlled by
dedicated checkboxes, no overlays are active.
This measurement is OK to be the reference for our QC test; once the frequency
scale, Y right and left scales are OK for the visualization under QC it can be saved
as “reference.sin”. To properly set scales it is useful to directly input values at their
extremes; refer to 6.2 and 6.4 for details about this.
68
20 QC BY EXAMPLES, TCP-IP MEASUREMENT SERVER AND SYNTAX REFERENCE
20.1.5 PROGRAMMING THE QC SCRIPT
We are ready to write the QC script; the files involved are the stereo sinusoidal
measurement stored inside the “reference.sin” file, the limits file for channel A in
“response.lim” and the limits file for channel B in “impedance.lim”.
[SIN]
OUTQCBOX=1V
INA=-10
INB=-40
REFERENCE=REFERENCE.SIN
LIMITSA=RESPONSE.LIM
LIMITSB=IMPEDANCE.LIM
Two things are still missing: the polarity check and the visualization of the rub&buzz
curve.
1) To add polarity check over the frequency response we simply add POLARITY=1
under [SIN]
2) To add rub&buzz display as a third curve together frequency response and
impedance we add [RUB+BUZZ DISPLAY] in the “response.lim” file.
The final script will thus be:
[SIN]
OUTQCBOX=1V
INA=-10
INB=-30
REFERENCE=REFERENCE.SIN
LIMITSA=RESPONSE.LIM
LIMITSB=IMPEDANCE.LIM
POLARITY=1
This script may now be saved as “faststereosweep.qc”.
The final “response.lim” file will be:
[RELATIVE]
FREQJITTER=0.16
[SENSITIVITY]
UPPER=109
LOWER=103
[UPPER LIMIT DATA]
20
10
80
10
100
3
5000
3
6000
5
20000
5
[LOWER LIMIT DATA]
20
-10
80
-10
100
-3
5000
-3
6000
-5
20000
-5
[THD UPPER LIMIT DATA]
20 QC BY EXAMPLES, TCP-IP MEASUREMENT SERVER AND SYNTAX REFERENCE
69
30.81
69.56
174.96
69.78
639.82
80.62
1603.03
78.19
10869.90
64.25
10869.90
64.25
[RUB+BUZZ DISPLAY]
[RUB+BUZZ UPPER LIMIT DATA]
30.11
48.32
143.15
48.76
445.16
60.49
1692.02
59.38
3924.35
30.18
The final “imedance.lim” file will be:
[RELATIVE]
PERCENT=1
[UPPER LIMIT DATA]
20
20
50
20
60
30
90
30
100
20
200
20
1200
20
[LOWER LIMIT DATA]
20
-25
50
-25
60
-30
90
-30
100
-25
200
-25
1200
-25
[TSPARAMETERS]
PERCENT=1
DIAMETER=10
REDC=7
KNOWNMMD=5
FSUPPER=10
FSLOWER=-10
QMSUPPER=10
QMSLOWER=-10
ZMINUPPER=10
ZMINLOWER=-10
70
20 QC BY EXAMPLES, TCP-IP MEASUREMENT SERVER AND SYNTAX REFERENCE
20.1.6 RUNNING THE QC TEST
Running the complete QC test we will obtain a comprehensive graph display as in
figure.
20.1.7 ADDING THE INTERFACE TO AUTOMATION
To manage TTL signals that connect the system QCBox Model 5 digital I/O port to
the external automation we must include some programming inside CLIO and inside
the QC script.
As we have chosen input Bit 2 to trigger the QC test we must set this inside CLIO
Options>QC dialog.
The output bits operation should be defined directly inside the QC script and should
reflect how CLIO and the automation interact.
We suppose the
BIT0 -> Signals
BIT1 -> Signals
BIT2 -> Signals
following meaning of the output TTL bits:
the end of the sweep.
if result is good.
if result is bad.
The keywords that should be added to our script lead to the following situation
[PERFORM]
20 QC BY EXAMPLES, TCP-IP MEASUREMENT SERVER AND SYNTAX REFERENCE
71
QCBOXOUTBYTE=0
[SIN]
OUTQCBOX=1V
INA=-10
INB=-30
REFERENCE=REFERENCE.SIN
LIMITSA=RESPONSE.LIM
LIMITSB=IMPEDANCE.LIM
POLARITY=1
[PERFORM]
QCBOXOUTBIT0=1
[IF ALL GOOD]
QCBOXOUTBIT1=1
[IF ALL BAD]
QCBOXOUTBIT2=1
Here you may see the initial keyword QCBOXOUTBYTE=0 that resets all three
signals to zero. Then, after the test is finished they are set to reflect the end of
sweep and the result of the test.
The only thing to be noted is that BIT0 (end of sweep) is output when the
sinusoidal test is finished, i.e. right after all calculations and measurement
managements are made. This means that it will be delayed with respect to the
actual end of the sweep by the time the computer takes to make all the calculations
and actions related to a sinusoidal test; this time is usually small but not zero and
may range in some hundred of milliseconds depending on the platform chosen.
If very tight synchronization is needed and you want to avoid the calculation time,
it is possible to require that the TTL signal is output right after the sweep is
completed, without waiting for the sinusoidal test to end; to do this, place the
relative keyword right under the [SIN] definitions thus changing the script to:
[PERFORM]
QCBOXOUTBYTE=0
[SIN]
OUTQCBOX=1V
INA=-10
INB=-30
REFERENCE=REFERENCE.SIN
LIMITSA=RESPONSE.LIM
LIMITSB=IMPEDANCE.LIM
POLARITY=1
QCBOXOUTBIT0=1
[IF ALL GOOD]
QCBOXOUTBIT1=1
[IF ALL BAD]
QCBOXOUTBIT2=1
You can find these example files in the 'My Documents\Audiomatica\CLIO 10
EXAMPLES\EXAMPLE0' folder.
72
20 QC BY EXAMPLES, TCP-IP MEASUREMENT SERVER AND SYNTAX REFERENCE
20.2 QC EXAMPLES
20.2.1 EXAMPLE 1: QC OF A MICROPHONE PREAMPLIFIER
INPUT A
CLIO
INPUT B
OUTPUT A
OUTPUT B
PRE-01
Preamplifier
Input
Output
This example is taken form our internal QC procedure for the PRE-01 Microphone
Preamplifier. Figure shows the connections required. The PRE-01 features three
weighting filters and two gain positions. This test is a representative case of the
following requirements:
1) The limits are ABSOLUTE as they are taken from the IEC tables for the specified
tolerance. Since the perfect device has still to be built it is not possible to use
relative limits from a real life measured reference.
2) The IEC specifies a response in term of a 0 dB at 1kHz. The absolute level at
1kHz is however left to the test procedure. As we want to perform the test near the
highest level the device is able of accept, we need to use the PROCESS feature to
shift the real measurement to the specs level.
3) Changes in switch position are required during test. We have therefore to use
the INTERACTIVE feature.
4) A level regulation is required to align the gain at 1kHz with and without a filter.
This brings in the LOOP feature of the [MET] multimeter test.
5) It’s very difficult for the operator to set a switch accordingly to the next test to
be performed. The PERFORM and MESSAGE feature greatly simplifies this,
avoiding errors.
The QC script, described here with comments, allows the check of the filters
response against Type 1 tolerance specification. It also checks for +/- 0.2 dB gain
tolerance of the gain switch in both positions. As an additional feature it allows the
user, within the test, to adjust a variable gain trimmer that has to be adjusted to
achieve optimum levels; this procedure, LOOP, also ends with a check of the
adjusted level to be within +/- 0.2 dB. At every level check a distortion test, THD
defined in the LEV1.LIM file, is performed. As a general rule a QC procedure is
defined from one QC file (.qc extension) and several limits file (.lim extension)
declared in the qc file. Process files (.mpro or .spro) are also involved here and
these are the only ones not specifically QC related. It is a good idea to dedicate a
directory for each QC test. The files involved here are:
20 QC BY EXAMPLES, TCP-IP MEASUREMENT SERVER AND SYNTAX REFERENCE
73
PRE01.QC
LEV1.LIM
A.LIM
B.LIM
C.LIM
ASHIFT.SPRO
You can find them in the
EXAMPLES\EXAMPLE1' folder.
'My
Documents\Audiomatica\CLIO
10
[GLOBALS]
COMPANY=AUDIOMATICA S.R.L. FLORENCE
TITLE=PRE01 TEST PROCEDURE
INTERACTIVE=1
SAVEONBAD=1
[PERFORM]
MESSAGE=FILTER OFF DIP ON OFF OFF OFF
[MET]
OUT=2.44
IN=10
REFERENCE=FILTER.MET
LIMITS=LEV1.LIM
[PERFORM]
MESSAGE=FILTER ON DIP ON OFF OFF OFF
[MET]
OUT=2.44
IN=10
REFERENCE=FILTER.MET
LIMITS=LEV1.LIM
LOOP=1
[PERFORM]
MESSAGE=FILTER ON DIP ON OFF OFF ON
[MET]
OUT=-17.56
IN=10
REFERENCE=FILTER.MET
LIMITS=LEV1.LIM
[SIN]
OUT=-10
IN=10
REFERENCE=A.SIN
LIMITS=A.LIM
PROCESS=ASHIFT.SPRO
[PERFORM]
MESSAGE=FILTER ON DIP OFF ON OFF ON
[SIN]
OUT=-10
IN=10
74
20 QC BY EXAMPLES, TCP-IP MEASUREMENT SERVER AND SYNTAX REFERENCE
REFERENCE=A.SIN
LIMITS=B.LIM
PROCESS=ASHIFT.SPRO
[PERFORM]
MESSAGE=FILTER ON DIP OFF OFF ON ON
[SIN]
OUT=-10
IN=10
REFERENCE=A.SIN
LIMITS=C.LIM
PROCESS=ASHIFT.SPRO
[PERFORM]
MESSAGE=SET DEFAULT SETTINGS FILTER OFF DIP ON OFF OFF ON
20 QC BY EXAMPLES, TCP-IP MEASUREMENT SERVER AND SYNTAX REFERENCE
75
20.2.2 EXAMPLE 2: THE AMPLIFIER&SWITCHBOX UNDER QC
INPUT A
CLIO
INPUT B
OUTPUT A
OUTPUT B
In 1
From CLIO
In 2
CLIOQC Model 4
Ampli/SwitchBox
D.U.T.
ISense
To CLIO
5 Ohm 1%
This example details the quality control procedure that Audiomatica uses to test its
production of CLIOQC Amplifier & Switchbox.
A precision 5 Ohm 10W 1% resistor is needed and must be connected across DUT
terminals. The procedure, executed in Interactive mode, guides the operator and
requests the manual connection of the unit; the cable coming from output B of
CLIO must be swapped during the test between input 1 and 2.
The test begins with two impedance measurements, the first executed in ISense
Mode, the second executed in Internal Mode. Then a THD measurement with FFT
and finally the frequency response of each input channel are performed.
Note the keywords used to alternatively mute CLIO's output.
[GLOBALS]
COMPANY=AUDIOMATICA S.R.L. FLORENCE
TITLE=QCBOX TEST PROCEDURE
INTERACTIVE=1
[PROMPT]
MESSAGE=CONNECT:
MESSAGE2=[OUTA->FROM CLIO][INA->TO CLIO][OUTB->CH1][INB->ISENSE]
[PROMPT]
MESSAGE=PLACE 5 OHM 1% RESISTOR ACROSS D.U.T. TERMINALS
[SETIMPEDANCE]
[SETMUTEB]
[PERFORM]
DELAY=500
[SIN]
76
20 QC BY EXAMPLES, TCP-IP MEASUREMENT SERVER AND SYNTAX REFERENCE
OUT=0
IN=-20
REFERENCE=IMPEDANCE.SINI
LIMITS=IMPEDANCE.LIM
[SETINPUT1]
[PERFORM]
DELAY=500
[SIN]
OUT=10
IN=-20
REFERENCE=ISENSE.SINI
LIMITS=IMPEDANCE.LIM
[FFT]
OUT=10.0
IN=-10
ACQUISITIONDELAY=200
REFERENCE=FFT.FFT
LIMITS=FFT.LIM
[RESETMUTEB]
[SETMUTEA]
[PERFORM]
DELAY=500
[SIN]
OUT=10
IN=10
REFERENCE=CH.SIN
LIMITS=CH.LIM
[PROMPT]
MESSAGE=CONNECT:
MESSAGE2=[OUTB -> CH2]
[SETINPUT2]
[PERFORM]
DELAY=500
[SIN]
REFERENCE=CH.SIN
LIMITS=CH.LIM
[RESETMUTEA]
You can find the files of this example in the 'My Documents\Audiomatica\CLIO
10 EXAMPLES\EXAMPLE2' folder.
20 QC BY EXAMPLES, TCP-IP MEASUREMENT SERVER AND SYNTAX REFERENCE
77
20.2.3 EXAMPLE 3: A TEST ON A STEREO ELECTRONIC EQUIPMENT
The following self-explaining script implements the procedure required to test the
frequency response of a stereo equipment; it is simulated by a couple of PRE-01
units each connected, as in the picture, to the two channels of CLIO. Both PRE-01
have A-weighting filter active; the unit connected to channel B has +20dB gain.
Beyond the frequency response of the two channels, the script also measure the
A/B difference response and output it to QC screen.
[SIN]
OUT=0.0 dBV
INA=-10
INB=20
REFERENCE=PRE01_A_B20.SIN
LIMITSA=AB_A.LIM
LIMITSB=AB_B.LIM
You can find the files of this example in the 'My Documents\Audiomatica\CLIO
10 EXAMPLES\EXAMPLE3' folder.
78
20 QC BY EXAMPLES, TCP-IP MEASUREMENT SERVER AND SYNTAX REFERENCE
20.2.4 EXAMPLE 4: A CYCLIC SCRIPT (USED TO MANAGE MY ROGERS
LS3/5A TWO-WAY LOUDSPEAKER PRODUCTION)
This example describes a hardware and software setup to do quality control over a
production of loudspeakers units; the responses are taken come from our samples
of Rogers LS3/5A speakers. The hardware setup is shown in figure
INPUT A
CLIO
INPUT B
OUTPUT A
OUTPUT B
Mic No 1
Mic No 2
From CLIO
CLIOQC
Ampli/SwitchBox
Speaker
ISense
To CLIO
far field
near field
As you can see we employ a CLIOQC Amplifier & SwitchBox that connects two
measuring microphones, one for near field response and the other for far field
response. The internal switcher is used to configure impedance with current sensing
or frequency response measurements and to select the correct microphone.
The quality control of such a production relies on what is called a reference
loudspeaker i.e. a unit which is kept aside the line and retested regularly to give
reference data curves for the units under test. These data trace environmental
conditions.
To accomplish the recurrent operation of testing the reference loudspeaker CLIO QC
implements what is called the cyclic script i.e. a QC script that is launched by the
main script on a timed basis and executed once. When the cyclic script is launched
the operator is prompted and the reference unit must be placed on the line.
The three keywords used to define this operation are CYCLIC, REPETITION and
CYCLICFIRST under [GLOBALS]. CYCLIC defines the name of the cyclic script; this
file must reside in the same directory of the calling one. REPETITION defines after
how many units it is run; we put 4 in the example only to allow you to test it, this
number is chosen after evaluating the particular condition of the production line.
CYCLICFIRST, which in the example is commented away, tells the software to
execute the cyclic script before the first run of the main script; this is useful to set
known conditions at the beginning of a QC session.
[GLOBALS]
20 QC BY EXAMPLES, TCP-IP MEASUREMENT SERVER AND SYNTAX REFERENCE
79
CYCLIC=ROGERSCYCL.QC
;CYCLICFIRST=1
REPETITION=4
OUTUNITS=V
OUTQCBOX=2.83
IN=-20
Please note the use of the OUTUNITS keyword which accounts for output levels
expressed in Volts RMS. With OUTQCBOX=2.83 we chose to set 2.83 Volts at
Rogers terminals.
The rest of the main script for producing my LS3/5As deals with the three actual
measurements for testing nearfield, farfield and impedance data; the first two are
done with MLS, the third with Sinusoidal. Before each measurement definition are
the relative commands that set the correct function of the Amplifier & SwitchBox;
note that the impedance is done in 'ISense' mode.
[SETINPUT1]
[MLS]
REFERENCE=NEARFIELD.MLS
LIMITS=NEARFIELD.LIM
[SETINPUT2]
[MLS]
REFERENCE=FARFIELD.MLS
LIMITS=FARFIELD.LIM
[SETISENSE]
[SIN]
OUTQCBOX=1
IN=-30
REFERENCE=IMPEDANCE.SINI
LIMITS=IMPEDANCE.LIM
The main QC script ends here. It is a fairly simple one, which can be customized for
any production of loudspeakers. Let's now see the cyclic script. The basic idea is to
execute the same measurements as in the main script and save them with the
names of the reference files for the main script itself. AUTOSAVE=1 prepares for
saving all the measurements done; SAVEFOLDER= is a particular syntax to set the
script directory as the current one.
[GLOBALS]
AUTOSAVE=1
SAVEFOLDER=
OUTUNITS=V
OUTQCBOX=2.83
IN=-20
The rest of the cyclic script resembles the main script with the difference that after
each measurement, we define the name of the file to be saved and force it to be
equal to the name of the reference file; in this way the reference file itself is
updated. SAVEPROMPT=1 instructs the QC processor to prompt for user acceptance
of the save operation; this is useful for validating the procedure and avoiding
errors.
80
20 QC BY EXAMPLES, TCP-IP MEASUREMENT SERVER AND SYNTAX REFERENCE
[SETINPUT1]
[MLS]
REFERENCE=NEARFIELD.MLS
LIMITS=NEARFIELD.LIM
SAVENAME=NEARFIELD
SAVEPROMPT=1
[SETINPUT2]
[MLS]
REFERENCE=FARFIELD.MLS
LIMITS=FARFIELD.LIM
SAVENAME=FARFIELD
SAVEPROMPT=1
[SETISENSE]
[SIN]
OUTQCBOX=1
IN=-30
REFERENCE=IMPEDANCE.SINI
LIMITS=IMPEDANCE.LIM
SAVENAME=IMPEDANCE
SAVEPROMPT=1
You can find the files of this example in the 'My Documents\Audiomatica\CLIO
10 EXAMPLES\EXAMPLE4' folder.
20 QC BY EXAMPLES, TCP-IP MEASUREMENT SERVER AND SYNTAX REFERENCE
81
20.2.5 EXAMPLE 5: QUALITY CONTROL OF A TELEPHONE WITH
LOUDNESS RATING CHECK
We describe here the quality control test of the production of a telephone unit.
Two script files take part to this example.
The cyclic script “moutheq.qc” is needed to measure and save the output pressure
response of the reference speaker or mouth at reference position.
[GLOBALS]
AUTOSAVE=1
SAVEFOLDER=
[PERFORM]
MESSAGE=PLACE REFERENCE MICROPHONE IN PLACE
[SIN]
OUT=-28 dBu
IN=-10
REFERENCE=MOUTH.SIN
LIMITS=NONE
SAVENAME=MOUTH
The main script “phone.qc” tests the frequency response of the phone under test
equalizing the drive pressure at -4.7 dBPa; also defined inside the “phone.lim”
limits file a Send Loudness Rating QC check.
[GLOBALS]
CYCLIC=MOUTHEQ.QC
CYCLICFIRST=1
REPETITION=100
[PERFORM]
MESSAGE=PLACE TELEPHONE IN PLACE
[SIN]
OUT=-4.7
IN=-10
EQREFERENCE=MOUTH.SIN
REFERENCE=REFPHONE.SIN
LIMITS=PHONE.LIM
You can find the files of this example in the 'My Documents\Audiomatica\CLIO
10 EXAMPLES\EXAMPLE5' folder.
82
20 QC BY EXAMPLES, TCP-IP MEASUREMENT SERVER AND SYNTAX REFERENCE
20.2.6 EXAMPLE 6: ON RUB & BUZZ DETECTION (1)
This example describes an effective technique to detect rub&buzz in a production
line of loudspeakers. The technique is based on logarithmic chirp stimulus with
synchronous FFT detection.
CLIO is able to generate (see 7.7) logarithmic chirps of proper length and proper
start and stop frequencies.
Given your production of speakers you should program the log chirp following these
guidelines:
Frequency Range. The frequency extremes depend on the kind of speaker; the
start frequency must be below the resonant frequency (Fs) to achieve excursion
while the stop frequency should be high enough to stimulate all possible defects
and anomalous mechanical contacts. We suggest start to lie between 20Hz/100Hz
while stop between 500Hz/1500Hz. Stop should be a compromise between best
defect detection and anomalous resonances excitation.
Amplitude. Perhaps this is the most critical parameter to set. Its choice must take
into consideration T&S parameters of the device and tend to exploit the maximum
excursion possible (XMax). On the other side a too high stimulus amplitude will
tend to give false positives to R&B. The graph below shows excursion normalized
versus Qt and Fs; it tells us that, in free air (as it is usually the case of production
lines), maximum excursion is reached well below Fs (around 0.1*Fs).
This leads us also to consider the technique described after (19.9.9) to apply DC
and relax other parameters while augmenting R&B detection.
Duration.
It is directly related to the chirp length; at 48 kHz sampling you
get the following: a 16k chirp lasts around 0.35s, a 32k chirp lasts around 0.7s, a
64k chirp lasts around 1.4s and so on.
The choice should be consistent with your production test needs provided a longer
test should be preferable as some kind of R&B phenomena appear with time as
device thermal constants are reached. For the same reason if R&B is one among
other QC tests, it should be done at the end.
20 QC BY EXAMPLES, TCP-IP MEASUREMENT SERVER AND SYNTAX REFERENCE
83
Once the stimulus has been defined you must define a proper FFT QC test; be sure
to use the same size of the stimulus, i.e. FFT Size = Chirp Size. Another
important FFT parameter to set is smoothing which will present an easier to detect
analysis; we suggest 1/48 or 1/24th of octave smoothing.
The analysis leads to the following situation:
You can see the response of a good and a rubbing device which will lead you to
correct mask definition; it is also shown how this measurement detects the
harmonic signature of the device; the plateau marked with 2nd directly refers to
second harmonic response.
This QC test is as simple as the following definition:
[FFT]
COMMENT=RUB&BUZZ
QCBOXDCOUT=2.83
IN=0
REFERENCE=RUB.FFT
LIMITS=RUB.LIM
We set 2.83V at the QCbox output (given a former OUTUNITS=V definition) and
input at 0dBV. Extreme care must be put in order to optimize input
sensitivity as this measurement is very sensitive to noise.
Limits mask should be placed in the decaying part of the acquisition and extendend
to cover the highest frequencies; only upper limit is necessary in this case.
84
20 QC BY EXAMPLES, TCP-IP MEASUREMENT SERVER AND SYNTAX REFERENCE
20.2.7 EXAMPLE 7: ON RUB & BUZZ DETECTION (2)
This example describes a simple method to enhance rub&buzz detection. This
method is based on the possibility of applying a DC voltage superimposed to the
generated stimulus. This technique applies to any test possible with CLIO and
augments its sensitivity.
As it is evident also from the figures in 19.9.7 the maximum excursion is obtained
at DC and this is an effective way to bring the speaker to its limits. As it is evident
from the following figure when a DC is applied the corresponding AC signal
amplitude must be lowered to obtain similar excursion.
Applying a DC to the same QC test as described before in 19.9.8 it is possible to
obtain the following measurement where it is evident the much better detection of
the defect which is possible.
As described in 4.6.1 it is possible to manually set the DC voltage at the output of a
QCBox Model 5 using the relative control panel.
20 QC BY EXAMPLES, TCP-IP MEASUREMENT SERVER AND SYNTAX REFERENCE
85
Under a QC script it is possible to apply DC with the following synthax:
[PERFORM]
QCBOXDCOUT=1.2
[SIN]
REFERENCE=RESPONSE.SIN
LIMITS=RESPONSE.LIM
[PERFORM]
QCBOXDCOUT=-1.2
[SIN]
REFERENCE=RESPONSE.SIN
LIMITS=RESPONSE.LIM
[PERFORM]
QCBOXDCOUT=0
In this example it has been applied a 1.2V DC voltage to a sinusoidal test; the
same could have been applied to a FFT with log chirp or any other test; to be
noted that the same test must be executed twice as we don’t know a priori
which direction stimulates the defect to arise.
In this case also lower harmonics could be checked as, when DC is present, they
become sensitive to R&B too.
86
20 QC BY EXAMPLES, TCP-IP MEASUREMENT SERVER AND SYNTAX REFERENCE
20.3 CLIO QC TCP/IP SERVER
This is the CLIO answer to the general request of being able to control and use QC
features inside custom applications.
It is an imperative need when audio testing is a part of a more complex QC process
(like in a cell phone QC test procedure when you must test also the display and
other parts).
The choice of TCP/IP approach presents several advantages:
1) No additional learning curve as same CLIO QC script commands are used
2) Prevents the engineer to deal with complex API programming
3) It is independent from the Operating System, Programming Language and kind
of PC.
4) It can be run locally or from another network connected PC
5) It is possible to write applications that control more than one QC test
workstation
20.3.1 INVOKING THE QC SERVER
To invoke the CLIO quality control server simply run CLIO passing it the “TCP”
parameter. You may define a shortcut with the following target program:
“C:\Program Files\Audiomatica\CLIO 10\Clio.exe TCP”
CLIO will run and start listening on the port defined in the CLIO Options>QC
settings dialog (see also 19.4.8) being port 1234 the default one.
The CLIO desktop will also show this particular operating condition in the main
toolbar:
From this moment it is possible to connect to CLIO and receive the various
measurements services that it is capable of.
20 QC BY EXAMPLES, TCP-IP MEASUREMENT SERVER AND SYNTAX REFERENCE
87
20.3.2 CONNECTING TO THE QC SERVER
It is possible to connect to the CLIO QC server with any custom written client
application that opens a TCP socket (we will see an example later) or with a
standard telnet application (like Microsoft Telnet).
The connections parameters are:
hostname
Network name of PC or ‘localhost’ for same PC
port
CLIO TCP port (default 1234)
Let’s see how to connect a telnet client application (we will use CRT 3.4) run in the
same computer where CLIO resides.
As soon as the connection is invoked the CLIO QC server will answer with the
welcome greeting:
The connection is established! QC services are ready for you.
88
20 QC BY EXAMPLES, TCP-IP MEASUREMENT SERVER AND SYNTAX REFERENCE
20.3.3 INTERACTING WITH THE QC SERVER
Your client application interacts with CLIO sending the standard ASCII script
commands; CLIO executes the commands and sends back the result of the
measurements.
Let’s now execute a simple MLS measurement. We will use the same example of
19.5.2 (My First QC Script). The syntax is identical:
[MLS]
OUT=0.0
IN=0
REFERENCE=LOOP.MLS
LIMITS=LOOPMLS.LIM
If we send these commands to CLIO we get the following:
You can see how the data exchange takes place. After each line of command is sent
the server sends back an acknowledgment stating that the command has been
received and that it is ok. At this time the sequence has not been closed yet and
the measurement has not been done. The server needs to know that the sequence
of commands that defines the measurement has ended; there is the special execute
command [] (two empty brackets) that is needed, at the end, to tell CLIO to
execute the measurement.
After we give the execute command ([]) the measurement starts and the result is
fed back to our application. The first line of the result is the global test result while
each subsequent line details all the single checks that have been done and that
participate to the global result.
To see more tests in action we may add a level check and a polarity test.
To do this we must add the following to the limits file ‘loopmls.lim’:
20 QC BY EXAMPLES, TCP-IP MEASUREMENT SERVER AND SYNTAX REFERENCE
89
[LEVEL]
UPPER=2
LOWER=-2
And we must add the following to the commands sent:
POLARITY=1
We get the following situation:
You notice now that the result is detailing all the three checks that the MLS
measurement has done (response, global level and polarity).
The example details how to execute a measurement; single commands can also be
sent that perform all standard operations. To close the channel A in-out loop simply
send CLIO the following:
[SETLOOPA]
[]
In the above example CLIO is behaving as a server and is visible on the Windows
Desktop.
It is possible to hide CLIO from end user sending the command:
[HIDECLIO]
[]
90
20 QC BY EXAMPLES, TCP-IP MEASUREMENT SERVER AND SYNTAX REFERENCE
CLIO will disappear and remain minimized in the Windows application bar; to see
CLIO again send:
[SHOWCLIO]
[]
20 QC BY EXAMPLES, TCP-IP MEASUREMENT SERVER AND SYNTAX REFERENCE
91
20.3.4 NOTES ABOUT QC SERVICES
The Quality Control operation when requesting TCP services differs from the normal
condition when the QC Script processor is active. In this case many tasks are
handled by the client application that is requesting the services and are not
performed by CLIO; for example there is no serial number management.
The main difference is that no QC test, formed by various single measurements, is
defined and managed by CLIO like in a QC script; the TCP server can be configured
and then executes endlessly all the commands and measurements it is requested to
do; it has no knowledge of how many single measurements form a complete QC
test.
TCP Operation and Server messages
When dealing with a network service like the CLIO TCP server the client application
receives back answers for each text command sent.
We find the following server responses:
200 Start Command OK
Usually given when a bracketed keyword is sent
200 Additional Command OK
Usually given when a keyword defining a section is sent
400 Unknown Command
400 Unknown Additional Command
200 OK
Given when a command (not a measurement) is executed
200 GOOD
Global result given at the end of a measurement
200 BAD
Global result given at the end of a measurement
200 GOOD Response, 200 GOOD Polarity etc. etc.
Single results given at the end of a measurement
Note the particular syntax of these answers. They are all initiated by a number that
is related to network operation and gives information about the correct interaction
between client and server. We find:
200
Correct
400
Usually an error is occurred
Autosaving
During TCP operation the QC single test numbering is disabled and does not take
place in defining the name of the autosaved data file (see 19.7.3). If autosaving is
active CLIO will give the following names to files:
'tcpresponse.txt' measurements exported in ASCII
'tcpresponse.mls' MLS measurements
'tcpresponse.sin' Sinusoidal measurements
'tcpresponse.fft' FFT measurements
'tcpresponse.met' Multimeter measurements
92
20 QC BY EXAMPLES, TCP-IP MEASUREMENT SERVER AND SYNTAX REFERENCE
Please note also the following differences with standard QC operation:
- No serial number management is performed
- No batch management is performed
- No production report files are saved
- No statistical information are calculated
20 QC BY EXAMPLES, TCP-IP MEASUREMENT SERVER AND SYNTAX REFERENCE
93
20.3.5 KEYWORDS FOR QC SERVICES
All the keywords available to the QC scripts processor (see 20.4) are valid, with few
exceptions, and can be sent to the TCP server. There are some specific keywords
that are listed below.
[]
Special keyword that tells the TCP server to execute the command or
measurement input.
[HIDECLIO]
Enables background execution of TCP server. The CLIO desktop will not
be visible.
[SHOWCLIO]
Resets normal operation of CLIO when TCP server is active. The CLIO
desktop will be visible.
NOREPORTSAVED
=1 No detailed information are sent back by the TCP server. Only the
global result will be sent.
=0 The TCP server sends all the information about executed
measurements beyond the global test result.
If omitted defaults to 0.
QCWORKDIR
Defines the folder where the reference and limits files reside.
If omitted defaults to the current folder of CLIO.
94
20 QC BY EXAMPLES, TCP-IP MEASUREMENT SERVER AND SYNTAX REFERENCE
20.3.6 TCP SERVER EXAMPLE: A C++ CLIENT APPLICATION
A fully commented sample C++ client console application that is able to connect to
CLIO, request measurements and receive results follow:
/* clio client c - code for example client program that uses TCP */
#include
#include
#include
#include
<windows.h>
<winsock.h>
<stdio.h>
<string.h>
#define PROTOPORT
1234
/* default protocol port number */
extern int
errno;
char
localhost[] =
"localhost";
/* default host name
*/
/*-----------------------------------------------------------------------* Program:
clioclient
*
* Purpose:
allocate a socket, connect to the Clio Server, interact with
*
the QC environmet
*
* Syntax:
client [ host [port] ]
*
*
host - name of a computer on which server is executing
*
port - protocol port number server is using
*
* Note:
Both arguments are optional. If no host name is specified,
*
the client uses "localhost"; if no protocol port is
*
specified, the client uses the default given by PROTOPORT.
*
*-----------------------------------------------------------------------*/
int string_length(char str[]);
main(argc, argv)
int
argc;
char
*argv[];
{
struct hostent *ptrh;
struct protoent *ptrp;
struct sockaddr_in sad;
int
sd;
int
port;
char
*host;
int
n;
char
ibuf[100];
char
obuf[100];
/*
/*
/*
/*
/*
/*
/*
/*
/*
pointer to a host table entry
pointer to a protocol table entry
structure to hold an IP address
socket descriptor
protocol port number
pointer to host name
number of characters read
buffer for data from the server
buffer for data to the server
*/
*/
*/
*/
*/
*/
*/
*/
*/
WSADATA wsaData;
WSAStartup(0x0101, &wsaData);
memset((char *)&sad,0,sizeof(sad)); /* clear sockaddr structure */
sad.sin_family = AF_INET;
/* set family to Internet
*/
/* Check command-line argument for protocol port and extract
*/
/* port number if one is specified. Otherwise, use the default */
/* port value given by constant PROTOPORT
*/
if (argc > 2) {
/* if protocol port specified
port = atoi(argv[2]);
/* convert to binary
} else {
port = PROTOPORT;
/* use default port number
}
if (port > 0)
/* test for legal value
sad.sin_port = htons((u_short)port);
else {
/* print error message and exit
fprintf(stderr,"bad port number %s\n",argv[2]);
exit(1);
}
*/
*/
*/
*/
*/
/* Check host argument and assign host name. */
20 QC BY EXAMPLES, TCP-IP MEASUREMENT SERVER AND SYNTAX REFERENCE
95
if (argc > 1) {
host = argv[1];
} else {
host = localhost;
}
/* if host argument specified
*/
/* Convert host name to equivalent IP address and copy to sad. */
ptrh = gethostbyname(host);
if ( ((char *)ptrh) == NULL ) {
fprintf(stderr,"invalid host: %s\n", host);
exit(1);
}
memcpy(&sad.sin_addr, ptrh->h_addr, ptrh->h_length);
/* Map TCP transport protocol name to protocol number. */
if ( ((int)(ptrp = getprotobyname("tcp"))) == 0) {
fprintf(stderr, "cannot map \"tcp\" to protocol number");
exit(1);
}
/* Create a socket. */
sd = socket(PF_INET, SOCK_STREAM, ptrp->p_proto);
if (sd < 0) {
fprintf(stderr, "socket creation failed\n");
exit(1);
}
/* Connect the socket to the specified server. */
if (connect(sd, (struct sockaddr *)&sad, sizeof(sad)) < 0) {
fprintf(stderr,"connect failed\n");
exit(1);
}
/* Wait a little */
n=0;
while (n < 1000000) {n=n++;
}
/* Get greeting message */
n = recv(sd, ibuf, sizeof(ibuf), 0);
write(1,ibuf,n);
/* Repeatedly read write data from socket or stdin and write to user's screen. */
while (strcmp(obuf,"exit\n")) {
fgets(obuf,127,stdin);
n = send(sd, obuf, string_length(obuf), 0);
n = 0;
while (n < 1000000) {n = n++;
}
n = recv(sd, ibuf, sizeof(ibuf), 0);
write(1,ibuf,n);
}
/* Close the socket. */
closesocket(sd);
/* Terminate the client program gracefully. */
}
96
exit(0);
20 QC BY EXAMPLES, TCP-IP MEASUREMENT SERVER AND SYNTAX REFERENCE
int string_length(char str[])
{
int i;
for(i = 0; i < 80; i++)
{
if(str[i] == '\0')
{
return(i);
}
}
}
You can find the file of this example in the 'My Documents\Audiomatica\TCP
Server' folder.
20 QC BY EXAMPLES, TCP-IP MEASUREMENT SERVER AND SYNTAX REFERENCE
97
20.4 QC SCRIPT SYNTAX REFERENCE
20.4.1 KEYWORDS FOR GENERAL SETTINGS
NOTE: "SCRIPTDIR" means the directory where the QC script is saved.
[GLOBALS]
Starts a section containing settings and definitions valid for the whole
test sequence.
AUTOBATCH
=1 Enables automatic batch naming. The name of the production batch
is set equal to the current name of the folder where the QC script is
saved (SCRIPTDIR).
=0 Does not perform autobatch. If omitted defaults to 0.
AUTOREPEAT
=n Number of QC tests to be executed continuously without operator
assistance. After pressing Go the QC processor will execute “n” tests and
then stop.
AUTOSAVE =1 Autosaves all measurements. Applies to all measurements.
=0 Does not perform autosave. If omitted defaults to 0.
AUTOSN
=1 Automatically manages and increments an 8-digits numerical serial
number.
=0 Permits a 24 alphanumeric serial number to be fed to the QC
processor; no automatic increment is performed.
If omitted defaults to 1 i.e. automatic serial numbering.
AUXMONITOR
=1 Activates the math operation monitor panel during QC execution.
=0 Does not activate the math operation monitor panel.
If omitted defaults to 0.
BATCH
Name of the production batch. See also AUTOBATCH and SAVEFOLDER.
CYCLIC
Name of the cyclic script. The cyclic script is executed every REPETITION
times instead of the actual script. All measurements executed inside the
cyclic script do not take part in production report, batch management
and serial numbering. See also CYCLICFIRST.
CYCLICFIRST
=1 Executes the cyclic script before executing the QC test itself.
If omitted defaults to 0 i.e. no cyclic script executed first.
Refer also to CYCLIC and REPETITION for defining the cyclic script
behavior.
COMPANY Text used as the first title of the QC control panel. Usually the company
name.
DELAY
Value in milliseconds of a pause to be performed.
DISPLAY
=1 displays the result of each measurement.
=0 executes all the measurements without displaying.
If omitted defaults to 1 i.e.DISPLAY.
98
20 QC BY EXAMPLES, TCP-IP MEASUREMENT SERVER AND SYNTAX REFERENCE
DISPLAYONBAD
=1 displays the measurement if bad. Applies to all the measurements.
=0 Not active. If omitted defaults to 0.
DISPLAYTIME
Approximate time of display (in ms) when in DISPLAY mode.
IN
Sets the input sensitivity for both input channels.
INA
Sets channel
untouched.
A
input
sensitivity;
channel
B
sensitivity
remains
INB
Sets channel
untouched.
B
input
sensitivity;
channel
A
sensitivity
remains
INITIALBITS
8-BIT binary value that will be output from LPT port at startup before QC
script execution.
INCREASEONBAD
=1 Increases serial number when unit is bad.
=0 Does not increase serial number when unit is bad.
If omitted defaults to 1 i.e. increases on bad.
INTERACTIVE
=1 displays the result of each measurement and prompts.
=0 executes all the measurements without prompting.
If omitted defaults to 0 i.e. NOT INTERACTIVE.
MANUAL
=1 starts the QC sequence manually (pressing Go).
=0 the sequence is started by an external trigger signal.
If omitted defaults to 1 i.e. MANUAL.
MESSAGEONBAD
Text to be displayed when unit performs bad.
If omitted defaults to 'BAD'
MESSAGEONGOOD
Text to be displayed when unit performs good.
If omitted defaults to 'GOOD'
NOREPORTSAVED
=1 No production report files are saved. See 19.7.2.
=0 The report information is saved.
If omitted defaults to 0.
OPENSERIAL
Opens the QC COM port for serial communication. See 6.3.6 for RS-232
settings. See also SERIALMONITOR.
OUT
Sets the generator
[GLOBALS]).
output
level
(with
OUTUNITS
defined
under
OUTQCBOX
Sets the generator output level taking into account QCBox gain (with
OUTUNITS defined under [GLOBALS]). This is the level that will be
20 QC BY EXAMPLES, TCP-IP MEASUREMENT SERVER AND SYNTAX REFERENCE
99
present at QCBox output.
OUTUNBALANCED
=1 Consider output level settings as unbalanced.
=0 Consider output level settings as balanced.
If omitted defaults to balanced output.
OUTUNITS Sets the unit of measure of the output level. It is possible to set dBu,
dBV or V.
If omitted defaults to dBu.
PHANTOM =1 Switches phantom power supply on.
=0 Switches phantom power supply off. If omitted defaults to 0.
Valid trough all the QC test sequence.
PHANTOMA
=1 Switches phantom power supply for channel A on.
=0 Switches phantom power supply for channel A off. If omitted defaults
to 0. Valid trough all the QC test sequence.
PHANTOMB
=1 Switches phantom power supply for channel B on.
=0 Switches phantom power supply for channel B off. If omitted defaults
to 0. Valid trough all the QC test sequence.
PROMPTFORGOOD
=1 Prompts when unit is bad for user acceptance and overrides result.
=0 No prompt when unit is bad.
If omitted defaults to 0 i.e. no prompt.
QCBOXCURRENTLIMIT
Current limit (A) for Model 5 operation. Ranges from 0 to 10.
QCBOXDCOUT
DC voltage (V) to be output by Model 5 superimposed to generated
signal. Ranges from -20 to 20.
QCBOXINITIALBYTE
8-BIT binary value that will be output from Model 5 port at startup
before QC script execution.
QCBOXOUTBIT0
Status (=1 or =0) of the bit that will be output from Model 5 BIT0.
QCBOXOUTBIT1
Status (=1 or =0) of the bit that will be output from Model 5 BIT1.
QCBOXOUTBIT2
Status (=1 or =0) of the bit that will be output from Model 5 BIT2.
QCBOXOUTBIT3
Status (=1 or =0) of the bit that will be output from Model 5 BIT3.
QCBOXOUTBIT4
Status (=1 or =0) of the bit that will be output from Model 5 BIT4.
100
20 QC BY EXAMPLES, TCP-IP MEASUREMENT SERVER AND SYNTAX REFERENCE
QCBOXOUTBIT5
Status (=1 or =0) of the bit that will be output from Model 5 BIT5.
QCBOXOUTBYTE
8-BIT binary value that will be output from Model 5 port.
QCBOXPHANTOM
Microphone power supply voltage (V) set for Model 5 IN1 and IN2 input.
Ranges from 2 to 24.
RESETRESULTCOLOR
=1 If multiple tests of the same kind (MLS, FFT, MET, SIN) are present
resets the result color of the menu display to match the last test of that
kind. =0 If multiple tests of the same kind are present maintains the
color of a bad result if any.
If omitted defaults to 0 i.e. persistent color.
REPETITION
Number representing the frequency of execution of the cyclic script.
SAVEBINARY
=1 saves also in binary format if SAVETEXT=1. Ignored if used alone.
Applies to all the measurements. If omitted defaults to 0.
Remember
that if neither SAVETEXT nor SAVEBINARY are specified the default
format is binary.
SAVEFOLDER
Forces the name of the autosave directory.
If omitted the default
autosave directory is SCRIPTDIR\AUTOSAVE if no batch name is defined,
otherwise it is SCRIPTDIR\BATCH where BATCH is the name of
production batch. If you desire to save files in the script directory
itself use the particular syntax "SAVEFOLDER=" i.e. leave blank the right
part.
SAVEONGOOD
=1 Autosaves all measurements, if global result is good. Applies to all
measurements.
=0 Does not perform autosave. If omitted defaults to 0.
If you want to autosave also in case of bad measurement add the
keyword SAVEONBAD=1 under [GLOBALS].
SAVEONBAD
=1 Autosaves all measurements, if global result is bad. Applies to all the
measurements.
=0 Not active. If omitted defaults to 0.
Refer also to SAVEONGOOD and AUTOSAVE.
SAVETEXT =1 saves ASCII file instead of binary format. Applies
to
all
measurements.
=0 saves files with normal binary format. If omitted defaults to 0.
the
SERIALMONITOR
=1 Activates the RS-232 monitor panel during QC execution.
=0 Does not activate the RS-232 monitor panel. If omitted defaults to 0.
STARTSIGLOGIC
20 QC BY EXAMPLES, TCP-IP MEASUREMENT SERVER AND SYNTAX REFERENCE
101
Defines the logic of the external trigger signal.
=1 is active high.
=0 is active low.
If omitted defaults to 0 i.e. active low.
STATISTICS
=1 Enables statistical data files generation.
=0 Disables statistical data files generation. If omitted defaults to 0.
STATFILESRES
Number of data lines present in statistical frequency files; maximum is
2048.
TITLE
Text used as the second title of the QC control panel. Usually a
description of the test.
WYSIWYG =1 Enables wysiwyg processing. Valid only for MLS tests.
=0 Disables wysiwyg processing. If omitted defaults to 0.
102
20 QC BY EXAMPLES, TCP-IP MEASUREMENT SERVER AND SYNTAX REFERENCE
20.4.2 KEYWORDS FOR MEASUREMENTS SETTINGS
[FFT]
Starts a section containing the definition of an FFT measurement.
[MLS]
Starts a section containing the definition of an MLS measurement.
[SIN]
Starts a section containing the definition of a Sinusoidal measurement.
[MET]
Starts a section containing the definition of a Multimeter measurement.
ACQUISITIONDELAY
Approximate time in milliseconds that is expected before executing the
measurement after switching the generator on. Valid only for FFT and
Multimeter measurements.
COMMENT Input a text comment used by the report files. This text is also output,
during the script execution, in the measurement title bar.
DISPLAYONBAD
=1 displays the measurement if bad.
=0 Not active. If omitted defaults to 0.
EQREFERENCE
Name of a reference frequency response file used to equalize generator
output response in a sinusoidal measurement. In this case the output
level settings refer to the same units of the eqreference file and set
output level accordingly.
IN
Sets the input sensitivity for both input channels.
INA
Sets channel
untouched.
A
input
sensitivity;
channel
B
sensitivity
remains
INB
Sets channel
untouched.
B
input
sensitivity;
channel
A
sensitivity
remains
LIMITS
Name of the limits file. Applies to both channel if stereo and LIMITSB is
not present.
LIMITSA
Name of the limits file for channel A in stereo measurements.
LIMITSB
Name of the limits file for channel B in stereo measurements.
LOOP
=1 Loops the current Multimeter measurement to let the user perform
an adjustment on the unit under test.
=0 Executes the Multimeter measurement and exits.
If omitted defaults to 0.
MODE
=DIFFERENCE Executes the measurement referring it to the reference
file. Valid only for MLS and Sinusoidal measurements.
=NORMAL Executes the measurement normally.
If omitted defaults to NORMAL
OPERANDnA
OPERANDnB
Define the operands of a mathematical operation (as described in
20 QC BY EXAMPLES, TCP-IP MEASUREMENT SERVER AND SYNTAX REFERENCE
103
20.4.3). n denotes the relative operands number; n may range from 0
to 9.
Possible operands are:
LEVEL
(MLS,sinusoidal,FFT)
SENSITIVITY
(MLS,sinusoidal,FFT)
FS
(T&S)
QTS
(T&S)
QES
(T&S)
QMS
(T&S)
VAS
(T&S)
BL
(T&S)
MMD
(T&S)
MMS
(T&S)
DBSPL
(T&S)
ZMIN
(T&S)
RLR
(MLS,sinusoidal)
SLR
(MLS,sinusoidal)
STMR
(MLS,sinusoidal)
FREQUENCY
(multimeter)
IMD
(multimeter)
PRESSURE
(multimeter)
THD
(multimeter)
VOLTAGE
(multimeter)
When measurement is stereo you may append (A) or (B) to identify
channel; VAS(B) refer to the Vas T&S parameter calculated for an
impedance measurement done with channel B.
OUT
Sets the generator output level (with
[GLOBALS]). See also EQREFERENCE.
OUTUNITS
defined
under
OUTQCBOX
Sets the generator output level taking into account QCBox gain (with
OUTUNITS defined under [GLOBALS]). This is the level that will be
present at QCBox output. See also EQREFERENCE.
POLARITY =1 Executes a polarity check. Valid
measurement.
=0 Not Active. If omitted defaults to 0.
for
an
MLS or
Sinusoidal
PROCESS Name of a process file to be applied to the test. Valid only for MLS and
Sinusoidal measurements.
REFERENCE
Name of the reference file.
SAVEBINARY
=1 saves also in binary format if SAVETEXT=1. Ignored if used alone.
If omitted defaults to 0. Remember that if neither SAVETEXT nor
SAVEBINARY are specified the default format is binary.
SAVENAME Name of the file to be saved.
SAVEONBAD
=1 automatically saves the current measurement if bad.
=0 Not active. If omitted defaults to 0.
104
20 QC BY EXAMPLES, TCP-IP MEASUREMENT SERVER AND SYNTAX REFERENCE
Refer also to AUTOSAVE.
SAVEONGOOD
=1 Autosaves the current measurements, if result is good.
=0 Does not perform autosave. If omitted defaults to 0.
If you want to autosave also in case of bad measurement add the
keyword SAVEONBAD=1.
SAVEPROMPT
=1 Prompts the user for file name input.
=0 Autosaves without prompting.
If omitted defaults to 0.
SAVETEXT =1 saves ASCII file instead of binary format.
=0 saves files with normal binary format. If omitted defaults to 0.
SAVETEXTPARAM
Controls the kind of exported data.
For MLS
=0 Display Frequency Data.
=1 FFT Frequency Data.
=2 Time Data.
For FFT
=0 Display Frequency Data.
=1 FFT Frequency Data.
=2 Last FFT Data.
=3 Last Time Data.
For Sinusoidal
=0 Frequency Data.
=1 Frequency + Distortion Data.
SAVETEXTPARAM2
Controls the number of saved frequency points (valid only for MLS)
=0 saves 256 points.
=1 saves 512 points.
=2 saves 1024 points.
=3 saves 2048 points.
If omitted defaults to 0, i.e. 256 points.
20 QC BY EXAMPLES, TCP-IP MEASUREMENT SERVER AND SYNTAX REFERENCE
105
20.4.3 KEYWORDS FOR AUXILIARY TESTS AND MATH OPERATION
[AUX]
Starts a section containing the definition of an auxiliary test or a math
operation.
TEST
It can be the kind of math operation to be chosen among the following:
SUMn
DIFFERENCEn
MULTIPLICATIONn
DIVISIONn
(where n denotes the relative operands number, see
20.4.2; n may range from 0 to 9.)
Or it can be a value read by QCBox Model5:
QCBOXINBIT0
QCBOXINBIT1
QCBOXINBIT2
QCBOXINBIT3
QCBOXINBIT4
QCBOXINBYTE
QCBOXINDC3
QCBOXINDC4
QCBOXOUTCURRENT
LOWER
Lower limit for the math operation check.
UPPER
Upper limit for the math operation check.
QCBOXINBITVALUE
Value of the input bit to be checked.
QCBOXINBYTEVALUE
Value of the input byte to be checked.
106
20 QC BY EXAMPLES, TCP-IP MEASUREMENT SERVER AND SYNTAX REFERENCE
20.4.4 KEYWORDS FOR CONDITIONAL EXECUTION
[PERFORM]
Starts a section which is always executed, unaffected by the result of
the preceding measurement. See below for the keywords possible
within.
[IF LAST GOOD]
[IF LAST BAD]
Starts a section
measurement.
conditioned
by
the
result
of
the
preceding
[IF ..parameter.. GOOD]
[IF ..parameter.. BAD]
Starts a section conditioned by the result of one particular parameter
measured during the preceding measurement.
..parameter.. can be one of the following:
LEVEL
(MLS,sinusoidal,FFT)
SENSITIVITY
(MLS,sinusoidal,FFT)
RESPONSE
(MLS,sinusoidal,FFT)
POLARITY
(MLS,sinusoidal)
A/B
(sinusoidal)
RUB+BUZZ
(sinusoidal)
TOTAL HARMONIC
(sinusoidal)
2 HARMONIC
(sinusoidal)
3 HARMONIC
(sinusoidal)
4 HARMONIC
(sinusoidal)
5 HARMONIC
(sinusoidal)
6 HARMONIC
(sinusoidal)
7 HARMONIC
(sinusoidal)
8 HARMONIC
(sinusoidal)
9 HARMONIC
(sinusoidal)
10 HARMONIC
(sinusoidal)
FS
(T&S)
QTS
(T&S)
QES
(T&S)
QMS
(T&S)
VAS
(T&S)
BL
(T&S)
MMD
(T&S)
MMS
(T&S)
DBSPL
(T&S)
ZMIN
(T&S)
RLR
(MLS,sinusoidal)
SLR
(MLS,sinusoidal)
STMR
(MLS,sinusoidal)
FREQUENCY
(multimeter)
IMD
(multimeter)
PRESSURE
(multimeter)
THD
(multimeter)
VOLTAGE
(multimeter)
[IF ALL GOOD]
20 QC BY EXAMPLES, TCP-IP MEASUREMENT SERVER AND SYNTAX REFERENCE
107
[IF ALL BAD]
Starts a section conditioned by the global result of the QC sequence.
Note: The following keywords apply to any kind of section for conditional execution.
BIT
BITVALUE
Number of the bit to be singularly controlled with "BITVALUE".
Status (=1 or =0) of the bit defined with "BIT".
8BITVALUE
8-BIT decimal value to be output by the currently selected parallel port.
ABORT
Stops the script execution after executing all keywords in the current
section. Result is forced bad. See also STOP.
CLOSESERIAL
Closes the QC COM port after serial communication.
DELAY
Value in milliseconds of a pause to be performed.
EXPORTGRAPHICS
Exports the current measurement to a graphical file. The same file
naming convention used for data files is used.
EXTERNAL Name of an executable file to be launched. See also PARAMETERS and
WAITCOMPLETION.
IN
Sets the input sensitivity for both input channels.
INA
Sets channel
untouched.
A
input
sensitivity;
channel
B
sensitivity
remains
INB
Sets channel
untouched.
B
input
sensitivity;
channel
A
sensitivity
remains
MESSAGE Text to be displayed in a prompting message to the user.
MESSAGE2 Second line of text to be displayed in a prompting message to the user.
MESSAGE3 Third line of text to be displayed in a prompting message to the user.
MESSAGE4 Fourth line of text to be displayed in a prompting message to the user.
OPENSERIAL
Opens the QC COM port for serial communication. See 6.3.6 for RS-232
settings.
OUT
Sets the generator
[GLOBALS]).
output
level
(with
OUTUNITS
defined
under
OUTQCBOX
Sets the generator output level taking into account QCBox gain (with
OUTUNITS defined under [GLOBALS]). This is the level that will be
present at QCBox output.
PARAMETER1
108
20 QC BY EXAMPLES, TCP-IP MEASUREMENT SERVER AND SYNTAX REFERENCE
String to be passed, as first parameter, to the executable defined with
"EXTERNAL". Some parameters relative to the QC tests can be passed
with the following acronyms:
@SERIALNUMBER passes the current serial number.
@RESULT passes the current result.
@LASTRESULT passes the last test result.
@GLOBALRESULT passes the global test result.
PARAMETER2
String to be passed, as second parameter, to the executable defined
with "EXTERNAL". See also PARAMETER1 above.
PARAMETER3
String to be passed, as third parameter, to the executable defined with
"EXTERNAL". See also PARAMETER1 above.
PARAMETER4
String to be passed, as fourth parameter, to the executable defined with
"EXTERNAL". See also PARAMETER1 above.
PICTURETITLE
Name of the window where the image loaded with SHOWPICTURE.
PRINT
Prints the current measurement. The default Windows printer is used.
QCBOXCURRENTLIMIT
Current limit (A) for Model 5 operation. Ranges from 0 to 10.
QCBOXDCOUT
DC voltage (V) to be output by Model 5 superimposed to generated
signal. Ranges from -20 to 20.
QCBOXINITIALBYTE
8-BIT binary value that will be output from Model 5 port at startup
before QC script execution.
QCBOXOUTBIT0
Status (=1 or =0) of the bit that will be output from Model 5 BIT0.
QCBOXOUTBIT1
Status (=1 or =0) of the bit that will be output from Model 5 BIT1.
QCBOXOUTBIT2
Status (=1 or =0) of the bit that will be output from Model 5 BIT2.
QCBOXOUTBIT3
Status (=1 or =0) of the bit that will be output from Model 5 BIT3.
QCBOXOUTBIT4
Status (=1 or =0) of the bit that will be output from Model 5 BIT4.
QCBOXOUTBIT5
Status (=1 or =0) of the bit that will be output from Model 5 BIT5.
QCBOXOUTBYTE
8-BIT binary value that will be output from Model 5 port.
20 QC BY EXAMPLES, TCP-IP MEASUREMENT SERVER AND SYNTAX REFERENCE
109
QCBOXPHANTOM
Microphone power supply voltage (V) set for Model 5 IN1 and IN2 input.
Ranges from 2 to 24.
SERIALOUT
ASCII text to be sent to serial device.
You may use some acronyms preceded by @:
@SERIALNUMBER is translated in the current serial number
@DATE is translated in the current date
@TIME is translated in the current time
SERIALOUTFILE
Name of an ASCII file containing text to be sent to serial device.
SERIALOUTCR
=1 Outputs carriage returns at the end of serial data.
=0 Does not output carriage returns at the end of serial data.
Defaults to 0.
SHOWPICTURE
Name of an image file containing a picture to be output to screen. See
also PICTURETITLE.
STOP
Stops the script execution after executing all keywords in the current
section. Result is unaltered. See also ABORT.
WAITCOMPLETION
=1 The QC script wait for the external program to end before continuing
execution.
=0 The QC sequence continue without waiting. If omitted defaults to 0.
110
20 QC BY EXAMPLES, TCP-IP MEASUREMENT SERVER AND SYNTAX REFERENCE
20.4.5 KEYWORDS FOR HARDWARE CONTROL
[RESETLOOPA]
Opens internal loop on channel A.
[RESETLOOPB]
Opens internal loop on channel B.
[RESETMUTEA]
Switches mute for channel A off.
[RESETMUTEB]
Switches mute for channel B off.
[RESETPHANTOM]
Switches phantom power off.
[RESETPHANTOMA]
Switches phantom power for channel A off.
[RESETPHANTOMB]
Switches phantom power for channel B off.
[SETIMPEDANCE]
Selects impedance mode of the CLIOQC Amplifier & SwitchBox.
[SETINPUT1]
[SETINPUT2]
[SETINPUT3]
[SETINPUT4]
[SETINPUT5]
[SETINPUT6]
[SETINPUT7]
[SETINPUT8]
Selects the relative input channel of the CLIOQC Amplifier & SwitchBox.
[SETISENSE]
Selects isense mode of the CLIOQC Amplifier & SwitchBox.
[SETLOOPA]
Closes internal loop on channel A.
[SETLOOPB]
Closes internal loop on channel B.
[SETMUTEA]
Switches mute for channel A on.
[SETMUTEB]
Switches mute for channel B on.
20 QC BY EXAMPLES, TCP-IP MEASUREMENT SERVER AND SYNTAX REFERENCE
111
[SETPHANTOM]
Switches phantom power on.
[SETPHANTOMA]
Switches phantom power for channel A on.
[SETPHANTOMB]
Switches phantom power for channel B on.
20.4.6 OTHER KEYWORDS
[SNINPUT]
Prompts the user for serial number input.
[STOP]
112
Immediately stops the script execution.
20 QC BY EXAMPLES, TCP-IP MEASUREMENT SERVER AND SYNTAX REFERENCE
20.4.7 KEYWORDS USED IN LIMITS FILES
[ABSOLUTE]
Defines an absolute limit file. This is also the default condition when the
[RELATIVE] keyword is not specified.
[FLOATING]
If present forces floating limits curves.
[RELATIVE]
Defines a relative limit file.
PERCENT
=1 Interprets limit curves values as percentages.
=0 Does not interpret limit curves values as percentages.
Defaults to 0.
FREQJITTER
Value, expressed in fractions of octave, used to calculate the relative
limit curve. It is useful to correct false negatives given by steep
reference curve behaviour.
[LEVEL]
Starts a section defining a check on the mean level of the measured
curve.
ALIGNFREQ
Align frequency for the mean level check. Valid only when ALIGNLEV is
specified and it is not ALIGNLEV=REFERENCE. See below.
ALIGNLEV Align level for the mean level check. If it is specified as
"ALIGNLEV=REFERENCE" then the mean level check is against the
average level of the reference in the band defined by the frequency
mask used for the response check.
If omitted defaults to ALIGNLEV=REFERENCE.
LOWER
Lower limit for the mean level check.
UPPER
Upper limit for the mean level check.
FREQLO
Lower frequency to calculate the mean level. If omitted the lower
frequency is taken from the lowest frequency defined by the frequency
mask.
FREQHI
Upper frequency to calculate the mean level. If omitted the upper
frequency is taken from the highest frequency defined by the frequency
mask.
[SENSITIVITY]
Starts a section defining a check on the sensitivity of the measured
curve.
LOWER
Lower limit for the sensitivity check.
UPPER
Upper limit for the sensitivity check.
FREQ1..FREQ8
Define up to eight frequencies where to calculate and then average
20 QC BY EXAMPLES, TCP-IP MEASUREMENT SERVER AND SYNTAX REFERENCE
113
sensitivity. If omitted the sensitivity is calculated averaging the band
defined by the extremes of the frequency mask.
[TSPARAMETERS]
Starts a section defining a Thiele&Small parameters check.
PERCENT
=1 Interprets limit values as percentages.
=0 Does not interpret limit values as percentages.
Defaults to 0.
REDC
Value (in Ohms) to be input representing the DC resistance of the voice
coil. REDC must always be specified.
DIAMETER Input value (in mm) specifying the driver diameter. It is needed only
when testing Cms, Mms, Mmd, Bl, Vas, dBSPL or ZMin; used with one of
the fixed parameters: KNOWNMMD or KNOWNMMS or KNOWNCMS. You
must specify only one fixed parameter.
KNOWNMMD
Input value for the fixed Mmd parameter. It is needed only when testing
Cms, Mms, Mmd, Bl, Vas, dBSPL or ZMin.
KNOWNMMS
Input value for the fixed Mms parameter. It is needed only when testing
Cms, Mms, Mmd, Bl, Vas, dBSPL or ZMin.
KNOWNCMS
Input value for the fixed Cms parameter. It is needed only when testing
Cms, Mms, Mmd, Bl, Vas, dBSPL or ZMin.
FSLOWER Lower limit for Fs.
FSUPPER
Upper limit for Fs.
QELOWER Lower limit for Qes.
QEUPPER Upper limit for Qes.
QMLOWER Lower limit for Qms.
QMUPPER Upper limit for Qms.
QTLOWER Lower limit for Qts.
QTUPPER Upper limit for Qts.
CMSLOWER
Lower limit for Cms.
CMSUPPER
Upper limit for Cms.
MMSLOWER
Lower limit for Mms.
MMSUPPER
114
Upper limit for Mms.
20 QC BY EXAMPLES, TCP-IP MEASUREMENT SERVER AND SYNTAX REFERENCE
MMDLOWER
Lower limit for Mmd.
MMDUPPER
Upper limit for Mmd.
BLLOWER Lower limit for Bl.
BLUPPER
Upper limit for Bl.
VASLOWER
Lower limit for Vas.
VASUPPER
Upper limit for Vas.
DBSPLLOWER
Lower limit for dBSPL.
DBSPLUPPER
Upper limit for dBSPL.
ZMINLOWER
Lower limit for ZMin.
ZMINUPPER
Upper limit for ZMin.
[LR]
Starts a section defining a loudness rating check.
PERCENT
=1 Interprets limit values as percentages.
=0 Does not interpret limit values as percentages.
Defaults to 0.
RLRLOWERLower limit for RLR.
RLRUPPER Upper limit for RLR.
SLRLOWERLower limit for SLR.
SLRUPPER Upper limit for SLR.
STMRLOWER
Lower limit for STMR.
STMRUPPER
Upper limit for STMR.
[UPPER LIMIT DATA]
[LOWER LIMIT DATA]
Start a section containing the frequency mask used for the QC check.
The frequency mask has to be defined as a list of N couples like:
Frequency_1 Value_1
......
20 QC BY EXAMPLES, TCP-IP MEASUREMENT SERVER AND SYNTAX REFERENCE
115
Frequency_N Value_N
In the case of a multimeter measurement containing several measured
parameters value.
It is possible to load frequency data from an external ASCII text file
using the FILE keyword.
FILE
Name of a text file containing a frequency mask definition.
FREQUENCY
Executes a frequency check. Valid for a multimeter measurement.
IMD
Executes an intermodulation distortion check. Valid for a multimeter
measurement.
PRESSURE Executes a sound
measurement.
pressure level check.
Valid for a
multimeter
THD
Executes a total harmonic distortion check. Valid for a multimeter
measurement.
VOLTAGE
Executes a voltage check. Valid for a multimeter measurement.
[A/B UPPER LIMIT DATA]
[A/B LOWER LIMIT DATA]
[RUB+BUZZ UPPER LIMIT DATA]
[RUB+BUZZ LOWER LIMIT DATA]
[THD UPPER LIMIT DATA]
[THD LOWER LIMIT DATA]
[n UPPER LIMIT DATA]
[n LOWER LIMIT DATA]
n may range from 2 (2nd harmonic) to 10 (10th harmonic).
Start a section containing the frequency mask used for the QC check of
the following calculated curves within a sinusoidal sweep.
The presence of the relative section defines the QC check.
The frequency mask has to be defined as a list of N couples like:
Frequency_1 Value_1
......
......
Frequency_N Value_N
It is possible to load frequency data from an external ASCII text file
using the FILE keyword.
FILE
Name of a text file containing a frequency mask definition.
[A/B DISPLAY]
116
20 QC BY EXAMPLES, TCP-IP MEASUREMENT SERVER AND SYNTAX REFERENCE
[RUB+BUZZ DISPLAY]
[THD DISPLAY]
[n HARMONIC DISPLAY]
n may range from 2 (2nd harmonic) to 10 (10th harmonic).
Defines which curve of the calculated ones will be displayed. it is
possible to display only one curve.
[REFERENCE DATA]
Start a section containing the frequency response used as reference; if
present substitute data taken from the reference file (as defined in
19.3). The frequency mask has to be defined as a list of N couples like:
Frequency_1 Value_1
......
......
Frequency_N Value_N
It is possible to load frequency data from an external ASCII text file
using the FILE keyword.
FILE
Name of a text file containing a frequency mask definition.
20 QC BY EXAMPLES, TCP-IP MEASUREMENT SERVER AND SYNTAX REFERENCE
117
BIBLIOGRAPHY
[1]
Joseph D'Appolito, “Testing Loudspeakers”, Audio Amateur Press, 1998.
[2]
J.M. Berman and L.R. Fincham, “The Application of Digital Techniques to the
Measurement of Loudspeakers”, J. Audio Eng. Soc., Vol. 25, 1977 June.
[3]
L.R. Fincham, “Refinements in the Impulse Testing of Loudspeakers”, J. Audio
Eng. Soc., Vol. 33, 1985 March.
[4]
S.P. Lipshitz, T.C. Scott and J. Vanderkooy, “Increasing the Audio Measurement
Capability of FFT Analyzers by Microcomputer Postprocessing”, J. Audio Eng.
Soc., Vol. 33, 1985 September.
[5]
D.D. Rife and J. Vanderkooy, “Transfer Function Measurement with MaximumLength Sequences”, J. Audio Eng. Soc., Vol. 37, 1989 June.
[6]
A. Duncan, “The Analytic Impulse”, J. Audio Eng. Soc., Vol. 36, 1988 May.
[7]
J. Vanderkooy and S.P. Lipshitz, “Uses and Abuses of the Energy-Time Curve”,
J. Audio Eng. Soc., Vol. 38, 1990 November.
[8]
G. Ballou, “Handbook for Sound Engineers – The New Audio Cyclopedia”,
Howard W. Sams & Company, 1987.
[9]
D. Davis and C. Davis, “Sound System Engineering”, Howard W. Sams &
Company, 1987.
[10] R.H. Small, “Simplified Loudspeaker Measurements at Low Frequencies”, J.
Audio Eng. Soc., 1972 Jan/Feb.
[11] D.B. Keele Jr, “Low Frequency Loudspeaker Assessment by Near-field Sound
Pressure Measurements”, J. Audio Eng. Soc., 1974 April.
[12] W.D.T. Davies, “Generation and properties of maximum length sequences”,
Control, 1966 June/July/August.
[13] F.J. MacWilliams and N.J.A. Sloane, “Pseudo-random sequences and arrays”,
Proc. IEEE, 1976 December.
[14] M.R. Schroeder, “Integrated impulse method measuring sound decay without
using impulses”, J. Acoust. Soc. Am., 1979 August.
[15] J. Borish and J.B. Angell, “An efficient algorithm for measuring the impulse
response using pseudorandom noise”, J. Audio Eng. Soc., 1983 July/August.
[16] D.D. Rife, “Maximum length sequences optimize PC-based linear system
analysis”, Pers. Eng. Inst. News, 1987 May.
[17] C. Dunn and M.O. Hawksford, “Distortion Immunity of MLS-Derived Impulse
Response Measurements”, J. Audio Eng. Soc., 1993 May.
[18] R.H. Small, “Direct-Radiator Loudspeaker System Analysis”, J. Audio Eng. Soc.,
1972 June.
BIBLIOGRAPHY
119
[19] M.O. Hawksford, “Digital Signal Processing Tools for Loudspeaker Evaluation
and Discrete-Time Crossover Design”, J. Audio Eng. Soc., 1997
January/February.
[20] D. Clarke, “Precision Measurement of Loudspeaker Parameters”, J. Audio Eng.
Soc., 1997 March.
[21] IASCA - International Auto Sound Challenge Association Inc. - “Official Judging
Rules”.
[22] A.Farina, “Simultaneous measurements of impulse response and distortion
with a swept sine technique”, AES Preprint n.5093, 108th Convention, 2000
February.
[23] S.Mueller and P.Massarini, “Transfer function measurement with sweeps”, J.
Audio Eng. Soc., 2001 June.
[24] T.Kite, “Measurements of audio equipment with log-swept sine chirps”, AES
Preprint n.6269, 117th Convention, 2004 October.
[25] S. J. Loutridis, “Decomposition of Impulse Responses Using Complex
Wavelets”, JAES, Vol. 53, No. 9, 2005 September
[26] D. B. Keele, “Time–Frequency Display of Electroacoustic Data Using CycleOctave Wavelet Transforms,” 99th Convention AES, preprint 4136.
[27]
120
A. Mertins, “Signal Analysis: Wavelets,
Transforms and Applications”, 1999 J. Wiley.
Filter
Banks,
Time-Frequency
BIBLIOGRAPHY
NORMS
[1]
IEC 61672, Sound Level Meters (replacing former IEC 651, Sound level meters
and IEC 804, Integrating-averaging sound level meters).
[2]
IEC 60268, Sound system equipment.
[3]
IEC 60386, Methods of measurement of speed fluctuations in sound recording
and reproducing equipment.
[4]
ISO 226, Normal equal-loudness-level contours.
[5]
ISO 266, Preferred frequencies for measurements.
[6]
ISO 3382, Measurement of reverberation time of rooms with reference to
other acoustical parameters.
[7]
IEC 61260, Octave-band and fractional-octave-band filters.
[8]
SMPTE RP120, Measurement of Intermodulation Distortion in Motion-Picture
Audio Systems.
NORMS
121