1
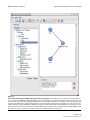
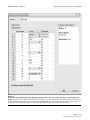
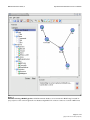
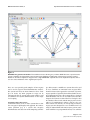
BMC Bioinformatics
BioMed Central
Open Access
Software
Pegasys: software for executing and integrating analyses of
biological sequences
Sohrab P Shah, David YM He, Jessica N Sawkins, Jeffrey C Druce,
Gerald Quon, Drew Lett, Grace XY Zheng, Tao Xu and BF Francis Ouellette*
Address: UBC Bioinformatics Centre, University of British Columbia, Vancouver, British Columbia, Canada
Email: Sohrab P Shah - [email protected]; David YM He - [email protected];
Jessica N Sawkins - [email protected]; Jeffrey C Druce - [email protected]; Gerald Quon - [email protected];
Drew Lett - [email protected]; Grace XY Zheng - [email protected]; Tao Xu - [email protected]; BF
Francis Ouellette* - [email protected]
* Corresponding author
Published: 19 April 2004
BMC Bioinformatics 2004, 5:40
Received: 27 February 2004
Accepted: 19 April 2004
This article is available from: http://www.biomedcentral.com/1471-2105/5/40
© 2004 Shah et al; licensee BioMed Central Ltd. This is an Open Access article: verbatim copying and redistribution of this article are permitted in all
media for any purpose, provided this notice is preserved along with the article's original URL.
Abstract
Background: We present Pegasys – a flexible, modular and customizable software system that
facilitates the execution and data integration from heterogeneous biological sequence analysis
tools.
Results: The Pegasys system includes numerous tools for pair-wise and multiple sequence
alignment, ab initio gene prediction, RNA gene detection, masking repetitive sequences in genomic
DNA as well as filters for database formatting and processing raw output from various analysis
tools. We introduce a novel data structure for creating workflows of sequence analyses and a
unified data model to store its results. The software allows users to dynamically create analysis
workflows at run-time by manipulating a graphical user interface. All non-serial dependent analyses
are executed in parallel on a compute cluster for efficiency of data generation. The uniform data
model and backend relational database management system of Pegasys allow for results of
heterogeneous programs included in the workflow to be integrated and exported into General
Feature Format for further analyses in GFF-dependent tools, or GAME XML for import into the
Apollo genome editor. The modularity of the design allows for new tools to be added to the system
with little programmer overhead. The database application programming interface allows
programmatic access to the data stored in the backend through SQL queries.
Conclusions: The Pegasys system enables biologists and bioinformaticians to create and manage
sequence analysis workflows. The software is released under the Open Source GNU General
Public License. All source code and documentation is available for download at http://
bioinformatics.ubc.ca/pegasys/.
Background
Pipelines for biological sequence analysis
Large scale sequence analysis is a complex task that
involves the integration of results from numerous compu-
tational tools. For high-throughput data analysis, these
tools must be tied together in a coordinated system that
can automate the execution of a set of analyses in
sequence or in parallel. To this end, a diverse array of
Page 1 of 16
(page number not for citation purposes)
BMC Bioinformatics 2004, 5
software systems for biological sequence analysis have
emerged in recent years. For example, the Ensembl pipeline [1] automates the annotation of several eukaryotic
genomes, Mungall et al [2] have created a robust pipeline
for annotation and analysis of the Drosophila genome,
GenDB [3] is used as an annotation system for several
prokaryotic genomes and Yuan et al [4] have published
resources for annotating the rice and other plant genomes.
These pipelines are extensive in their scope, are welldesigned and meet their objectives. In surveying these and
other systems, we have identified three critical areas that
are essential for building on the design of existing biological sequence analysis pipelines:
• There is a need for flexible architecture so that one software system can be used to analyse different data sets that
may require different analysis tools.
• A system needs to allow for the inclusion of new tools in
a modular fashion so the software architecture does not
have to change with the addition of new tools.
• A system should provide the framework to facilitate data
integration of analysis results from different tools that
were computed on the same input.
The need for flexible architecture
The systems outlined above differ substantially from each
other in their design and application, but share common
attributes. The diversity is naturally reflective of the varied
computational tasks that biologists working on different
projects need to perform in order to analyse their data. A
researcher working on bacteria will need different tools
for her analyses than someone working on mouse. The
specificity driven by the needs of a research project makes
it impossible to use a pipeline designed for a particular
data set for analysis of another data set that has inherent
differences such as the organism from which it was generated. As a result, numerous software pipelines have been
created, many of which perform similar analyses (such as
genome annotation) but on different data. For example,
the concept of constructing a pipeline or 'workflows' of
data processing are common to nearly all high-throughput sequence analysis projects. This shared concept provides an opportunity to harness the commonality in
software so that a new system need not be designed for
every new project.
Incorporating new tools into existing frameworks
The bioinformatics community is faced with a challenging
and dynamic environment where new computational
tools and data sets for sequence analysis are constantly
being generated. Capitalizing on algorithmic and computational advances is critical to discovering more about the
data being analysed. For a system that has a rigid pipeline
http://www.biomedcentral.com/1471-2105/5/40
that is 'hard coded', it may require a significant programming investment to incorporate a new tool. This may discourage biologists from integrating a new tool on the
basis of logistics, rather than on the basis of scientific
applicability. Therefore, a system should provide a framework that is designed for flexibility and extensibility.
Facilitating data integration
Genome annotation requires data integration. For example ab initio prediction of gene structures on genomic
sequence can be greatly enhanced by using supporting
sequence similarity searches [5-7]. Concordance between
different methodologies lends stronger support and gives
more compelling evidence to an algorithm or a person trying to infer true biological features from computationally
derived features [8]. It follows that any analysis pipeline
or system should provide a design that facilitates integration of heterogeneous sources of data.
The Pegasys biological sequence analysis system
To meet the challenges outlined above we have designed
and implemented Pegasys: a flexible, modular and customizable framework for biological sequence analysis.
The software is implemented in the Java programming
language and is Open Source, released under the GNU
General Public License. The features of Pegasys allow it to
be used on a wide variety of tasks and data. Analysis modules for pair-wise and multiple sequence alignment, ab
initio gene prediction, masking of repetitive elements, prediction of RNA sequences and eukaryotic splice site predictors have been developed. A new set of analyses is
performed by first creating a new 'workflow'. We define a
workflow as a set of analyses a biologist wishes to perform
on a single sequence or set of sequences. Each workflow
has the following qualities: a) the analyses can be linked
together such that output from one analysis can be used
as input to a subsequent analysis, b) analyses can accept
outputs from more than one analysis as input, and c)
analyses that are not serially dependent can be executed in
parallel.
Analysis tools in the Pegasys system are wrapped in modules that can easily be plugged into the system. The backend database system provides a data model that abstracts
the concept of a computational feature and captures data
from all the different analysis tools in the same framework. We have implemented data adaptors that can
export computational results in General Feature Format
[9] and Genome Annotation Markup Elements (GAME)
XML [10] for import into the Apollo genome editor [11].
For simple workflows where data integration is not applicable, for example one analysis on an input sequence,
raw, untransformed output from the analysis can also be
retrieved.
Page 2 of 16
(page number not for citation purposes)
BMC Bioinformatics 2004, 5
The system is fronted by a graphical user interface that
allows users to create workflows at run-time and have
them executed on the Pegasys server. The GUI also allows
users to save their workflows for repeat execution on different input, or using different reagents.
To demonstrate the utility of Pegasys in widely different
bioinformatics tasks, we present three use cases of the system: a single application workflow, a workflow designed
for formatting a database for BLAST [12,13] and searching
the newly formatted database, and finally a workflow
designed for genome annotation of eukaryotic genomic
sequence.
We are releasing this work with the intention that a wide
variety of sequence analyses in the bioinformatics
research community will be enabled. Full details of the
availability, support and documentation of Pegasys can be
found at http://bioinformatics.ubc.ca/pegasys/.
Implementation
The design of the Pegasys system is guided by three main
principles: modularity, flexibility and data integration.
With these principles in mind, we designed Pegasys with
the following architecture.
Architecture and data flow
The architecture of the system has a layered topology that
uses a client/server model. The client has a graphical user
interface (see Figure 4) for the creation of workflows.
Once a workflow is created, it is sent to the server where it
is executed. The server is made up of separate layers for job
scheduling, execution, database interaction, and adaptors.
The connectivity between layers is shown in Figure 1. The
application layer converts the work flow rendered in XML
into a directed acyclic graph (DAG) of analyses in memory. While traversing the DAG, the application schedules
all of the analyses on a distributed compute cluster and
facilitates the flow of data so that a particular node's program is only executed once all of its inputs are ready (i.e.
all of the 'parent' analyses are complete). As each analysis
completes, the results are inserted into the backend database layer. Complete reports and computational features
of a sequence are inserted into relational tables. Sophisticated queries on the data, in which results from selected
programs can be integrated together over a portion or all
of the input sequence, can then be run to compile data for
output. The data is exported from the system via the adaptor layer in various formats (currently GFF, GAME XML
and raw output from each analysis tool are supported) for
human interpretation or for import into other applications such as viewing tools (DAS [14]), editing tools
(Apollo [11]) or statistical analysis tools such as R [15].
http://www.biomedcentral.com/1471-2105/5/40
The Pegasys data structure
The core data structure of the Pegasys system is a DAG
G(V, E), consisting of a set of nodes V and a set of edges
connecting the nodes E (see Figure 2). The DAG data
structure models a workflow created by a user of the
Pegasys system. A node can take one of three forms: a) an
input sequence or b) an individual run of a program in the
system or c) an output node. An edge (v1, v2) where v1
and v2 are nodes in V links data flow between v1 and v2.
An edge represents a serial dependency, indicating that
the input of v2 is tied to the output of v1. We refer to this
relationship as a parent-child relationship: node v2 is a
child of node v1 and node v1 is the parent of node v2. The
edge ensures that the output format from v1 is consistent
with the input format of v2. A node in the DAG can have
more than one parent and therefore can have heterogeneous input from multiple sources. The edges in the graph
are directional and can only connect two nodes that are
executed one after another. The graph therefore has a
chronological axis: the child nodes are executed after their
parent nodes have completed.
The DAG is created dynamically at run time as the user
manipulates the GUI (see The Graphical User Interface
section). The user can create workflows using any combination of the available programs in Pegasys by dragging/
dropping and linking graphical icons that represent
sequence analysis tools on a canvas together with edges in
much the same way that one would use drawing tool software to create a flow diagram. Each program icon can be
clicked to open a dialogue box that can take inputs for
parameters that are supported by that particular program.
Once all of the parameters for all the nodes have been
filled in, the information for each node and their relationships to each other are compiled into a structured XML
file. This file is then used as input to the Pegasys server that
executes the analyses in parallel (described in the Architecture and Data Flow section) or can be saved for later
editing or distribution. During the execution of the DAG,
the data structure can adjust itself to accommodate outputs generated from the nodes. Consider the edge (v3, v5)
depicted in Figure 2 that connects an ab initio gene prediction program v3 with a sequence alignment program v5.
In v5, the user wishes to search the coding regions from
the output of v3 against a protein database. v5 cannot
know how many genes will be predicted from v3 before v3
has terminated. Once v3 has terminated however, v5 will
replicate itself for each 'output unit' generated from v3
(see Figure 2B). In this case, v5 replicates itself for each of
the coding regions and the DAG executes each 'copy' of v5
in parallel. This built-in elasticity confers maximum parallel execution of analyses and therefore more efficient execution of the computations in the DAG.
Page 3 of 16
(page number not for citation purposes)
BMC Bioinformatics 2004, 5
http://www.biomedcentral.com/1471-2105/5/40
Client
Workstation
GUI
Layer
XML
Layer
Send/receive Pegasys DAG XML
Send/receive output in GFF, Game XML, etc...
Server
Application Layer
Schedule DAG
for execution
Send to compute
cluster
Write results to
database
Output data in a
standard format
Job scheduling Layer
Adaptor Layer
Execution Layer
Database Layer
Figure 1showing the client/server model and layering of the Pegasys architecture
Diagram
Diagram showing the client/server model and layering of the Pegasys architecture. Arrows between the layers
indicate a transfer of data. The workflow created by manipulating the GUI in the client is sent as a Pegasys DAG XML file to
the server. The application layer then processes the XML file, and sends jobs to the job scheduling layer. The analyses are then
executed and the results are stored in the database. The adaptor layer takes results stored in the PegasysResultSet data
structure in memory in the application layer and can create output in GFF or GAME XML format. This file is then returned to
the GUI where it can be digested by the user or input into a visualization tool.
The Program module
The Program module is the fundamental unit of the
nodes of the aforementioned DAG in the application layer
of the server and is a real instance of a node v ∈ V. 'Program' is an object oriented class that abstracts the concept
of a Unix program that is natively compiled. Unix programs generally have a set of input command line parameters and output that is sent to the standard output,
standard error or an output file. The Program class has a
data structure to store a program's command line arguments and parameters. It contains methods for setting the
path to the program's location on the system, executing
the program and capturing its output from a file, standard
error and standard output streams. To abstract a sequence
analysis program, we created a PegasysProgram class that
extends Program by adding an input sequence attribute
and a PegasysResultSet to store the results of the analysis.
The ProgramResultSet is a hierarchical, recursive data
structure that allows storage of nested analysis results. For
example a BLAST output has a list of similar sequences
that each in turn has a list of high scoring pairs. Similarly
Genscan produces output that contains a list of predicted
genes, each of which could have a promoter, a list of exons
and a poly-A signal. PegasysResultSet captures the hierarchical nature of these results.
For each sequence specific analysis tool in Pegasys, we created a class that extends PegasysProgram. Each of these
Page 4 of 16
(page number not for citation purposes)
BMC Bioinformatics 2004, 5
http://www.biomedcentral.com/1471-2105/5/40
v1
A
v2
v1
v3
v4
B
v5
v6
v2
v3
v4
v5a
v6a
v5b
v6b
Figure 2showing an abstract representation of a Pegasys DAG
Diagram
Diagram showing an abstract representation of a Pegasys DAG. A): Consider v1: this could be an input sequence that
is used by two sequence analysis programs v2 and v3. v4 is dependent on the output of both v2 and v3 and therefore cannot
execute until v2 and v3 have completed. In this diagram, v2 and v3 will be executed in parallel as will v4 and v5. B): DAG in the
case where v3 produces two instances of the expected output to v5. The sub-DAG rooted at v5 replicates itself (v5a and v5b)
for each instance of its input. All of the new sub-DAGs are executed in parallel.
classes implement their own methods that load the particular output of the program and parse it into their PegasysResultSet. For example, the locations of computational
evidences such as predicted exons from a gene finding
tool, or a high scoring pair from an alignment algorithm
are parsed along with a statistic and/or score when available. This architecture generalises a computational feature
so that programmatically, results from different analysis
programs can be treated equally. As mentioned earlier,
this allows the user to output results from different programs in a unified format such as GFF, or GAME XML. In
addition, it facilitates querying for all computational evidence computed on a segment of sequence that may be of
interest to the biologist.
Creating a new PegasysProgram derivative involves writing a parser for the particular application that can extract
data that is amenable to being loaded into a PegasysResultSet. The system, at the time of this writing has
PegasysPrograms for RepeatMasker [16], BLAST (blastn,
blastp, blastx, tblastn, tblastx) [12,13], WU BLAST [17],
the EMBOSS [18] implementation of Smith-Waterman
[19], Genscan [20], HMMgene [21], Mlagan [22], Sim4
[23], TrnaScan-SE [24] and GeneSplicer [25].
The database
The backend database of the Pegasys system was created
with the goal of maximizing information capture during
execution of a workflow. The database tracks all parameters used for the invocations of analysis programs, all
input sequences, and all output generated by
computation.
The Pegasys schema
The Pegasys schema has three main tables: 'sequence'
which stores the input sequences, 'program_run' which
stores the information about an individual program's
process on the system and 'pegasys_result' which stores
the locations of computational features on the input
sequence. Peripheral to the three core tables are seventeen
Page 5 of 16
(page number not for citation purposes)
BMC Bioinformatics 2004, 5
http://www.biomedcentral.com/1471-2105/5/40
seq_has_subseq
sequence
PK
sequence_id
I1
sequence
defline
accession
version
hashcode
I2
class
PK
class_id
batch_run_programs
PK,FK2,I1
PK,FK1,I2
batch_run_id
program_run_id
name
batch_type
PK
program_run
PK
program_run_id
FK2,I2
FK1,I1
class_id
sequence_id
process_id
exit_status
program_output
name
version
description
path
start_timestamp
finish_timestamp
batch_run
batch_type_id
PK
batch_run_id
batch_type
description
FK1,I1
batch_type_id
owner
description
start_timestamp
finish_timestamp
finished_successfully
PK,FK1,I1
PK,FK2,I2
parent_seq_id
subseq_id
subseq
PK
subseq_id
FK1
sequence_id
start
stop
program_run_has_argument
PK,FK1,I1
PK,FK2,I2
program_run_id
argument_id
parameter
argument
PK,FK1
PK
argument_id
argument_id
value
name
description
flag
PK,FK1
argument_id
arg_set
result_has_xref
pegasys_result
database_reagent
PK
result_has_xref_id
PK
pegasys_result_id
PK
database_reagent_id
FK1,I1
FK2,I2
pegasys_result_id
pegasys_xref_id
FK2,I1
FK1,I2
FK3,I3
evidence_type_id
database_reagent_id
program_run_id
strand
start
stop
subject_strand
subject_start
subject_end
phase
frame
score
statistic
description
query_description
time_stamp
parent_id
FK1,I1
database_format_id
database_name
database_desc
path
pegasys_xref
PK
I1
FK1
pegasys_xref_id
id_string
xref_type_id
version
xref_type
PK
xref_type_id
xref_type
description
FK4,I4
database_format
PK
database_format_id
format
evidence_type
PK
evidence_type_id
evidence_name
description
Figure 3showing the relations of the Pegasys database model
Diagram
Diagram showing the relations of the Pegasys database model. There are three core tables to the database: sequence
(shown in blue), program_run (shown in orange) and pegasys_result (shown in yellow). The meta tables for each of the three
core tables are colour coded to match the corresponding core table. Foreign keys are indicated with 'FK' and indexed fields
are marked with T.
Page 6 of 16
(page number not for citation purposes)
BMC Bioinformatics 2004, 5
meta tables that store information about the data in the
core tables. The full schema is presented in Figure 3.
The 'program_run' table is designed to store all information on an invocation of an analysis tool in order to facilitate reprocessing of results without having to recompute
an analysis and can also aid in diagnosing problems that
are bound to occur in the system. 'program_run' stores the
class that invoked the process, the raw unprocessed output of the program, the start and end time of the process
and the exit status of the process. In addition, all command line arguments used to invoke the program are
stored in support tables to 'program_run' in the structured
tables 'argument', 'parameter', and 'flag'. Entries into
'program_run' can be grouped into batches for selective
retrieval of analysis results.
The 'sequence' table stores the raw sequence string itself, a
unique hash code for the sequence string generated by the
java.lang.String.hashCode() function, an identifier for the
sequence (by default the GenBank accession.version
number) and a description of the sequence (by default the
NCBI definition line of the FASTA file). This table does
not store meta data about the sequence, rather it is meant
to store unique sequences used for computation. The system assumes additional information on the sequence is
stored elsewhere. The uniqueness is enforced by ensuring
all sequences have distinct hash codes, description and
identifiers.Support tables for sequence have been created
to enable the analysis of sub-sequences of a larger input
sequence. The subsequence relationship to the sequence
is stored in the 'subseq' and 'seq_has_subseq' relations.
These tables are useful for 'sliding window' analyses or
when focusing in on small regions of interest of a larger
input sequence.
The 'pegasys_result' table stores the results of the computations. It has attributes for a computational evidence
type, a database reagent (if the result is from similarity
searches or uses a particular model in ab initio predictions), the strand, start and end positions of the computational feature, a score and a statistic for the computational
feature and a free-text description of the feature. If available, the strand, start and end position on the target
sequence of an alignment are also recorded. To support
hierarchical computational evidences, the table has a
'parent_id' that is a self-referential foreign key. This enables relating a particular row entry in the table to another
row in the table. Theoretically, the table supports infinite
nesting of hierarchical data types, although in practice
results are no more than 2 levels deep.
The support tables for 'pegasys_result' allow cross-referencing of ids. For example, the system models the concept
of linking out an identifier from the result of a database
http://www.biomedcentral.com/1471-2105/5/40
search so that the full sequence and meta data of that
sequence can be easily retrieved. This cross-referencing of
a 'pegasys_result' to an identifier is stored in the
'result_has_xref' relation. The type of identifier is labeled
by a controlled vocabulary so that one can query on a particular type of cross-reference (such as accession number)
as well as add a new type of cross-reference to the system.
Additional support tables to 'pegasys_result' are: 'database-format', 'database_reagent' and 'evidence-type'. Each
of these tables stores controlled nomenclature that is referenced by 'pegasys_result'. The 'database-format' contains values such as blast, fasta, and genscan for BLAST
formatted, FASTA formatted and Genscan training model
respectively. The 'database_reagent' table stores the names
and descriptions of sequence databases and statistical
models that are used in the analysis, so that a user can
query the Pegasys database for results from a particular
database reagent. This structure also allows adding new
database reagents into the system seamlessly. The 'evidence-type' table stores an ontology of computational evidence types, for example 'blastn_hit' or 'genscan_exon'.
For each program that is part of the Pegasys system, the
computational evidence(s) that it outputs must be
recorded in the 'evidence-type' table prior to its use.
Database API
To communicate programmatically with the database, we
have created a modular application programming interface (API). The PegasysDB class contains public methods
for insertion and retrieval of sequences, analysis results
and sets of results (from different programs) on a particular sequence. Application developers that wish to access
data from a Pegasys database can use these high-level
methods to rapidly store and access data in a straightforward manner without having to study the underlying
schema of the database. The database API uses the PostgreSQL JDBC driver and so is backend relational database
management system (RDBMS) independent.
Adaptors
We have implemented several adaptors for exporting data
from a PegasysProgram or set of PegasysPrograms that
contain analysis results. The derived PegasysAdaptor
classes all implement a print method to output data in a
specific format. We currently have derived PegasysAdaptor classes for GAME XML for import into Apollo [11] and
GFF [9] which can be imported into numerous tools and
servers such as the Distributed Annotation System [14]
(DAS) and Gbrowse [26]. The adaptor architecture is
extensible and easily allows the development and inclusion of new adaptors for additional formats. The
PegasysAdaptor classes serve as an important bridge from
the Pegasys data structure to other well-used standards
and permits interoperability between data computed
Page 7 of 16
(page number not for citation purposes)
BMC Bioinformatics 2004, 5
http://www.biomedcentral.com/1471-2105/5/40
Figure 4 of the Pegasys GUI showing the three pane design
Screenshot
Screenshot of the Pegasys GUI showing the three pane design. The visible pane is the canvas pane which allows the
user to create a workflow by clicking and dragging icons corresponding to the programs available to the system. The icons can
be connected to each other through edges. The parameters used for the execution of each program can be set by double clicking the icon and filling in the dialogue box that appears (see Figure 5). Expected inputs and outputs for the edge can be set by
double clicking the edge and filling in the dialogue (see Figure 6). This workflow will run RepeatMasker on the sequence specified in the File node and write the results to a text file whose path is specified in the text output node. The RepeatMasker analysis itself is run on the compute server and the results are communicated back to the client.
Page 8 of 16
(page number not for citation purposes)
BMC Bioinformatics 2004, 5
using Pegasys and many other bioinformatics tools and
databases.
Parallelism
Our local installation of Pegasys runs on a 28 CPU distributed memory compute cluster that runs the OpenPBS parallel batch server [27]. We have implemented 'serial'
parallelism into the system meaning that each application
is a serial process, but many serial processes can be run in
parallel. It is important to note that this is distinct from
parallelism where a single application is itself implemented using a message passing library that can use many
distributed processors in a compute cluster environment.
To enable serial parallelism, we implemented a Runnable
thread class in the Pegasys application layer that can navigate a command line argument of a PegasysProgram,
and create a script at runtime that is used to submit a job
to a PBS job queue. To monitor job progress, we implemented a Java server called QstatServer, that registers each
job sent to the PBS job queue. The QstatServer maintains
a hash table of jobs in the queue and informs the Pegasys
application layer when a particular job has terminated.
This architecture enables the Pegasys application server to
execute jobs in sequence or in parallel according to the
structure of the DAG that was sent by the client.
Pegasys and Java
The Pegasys system is implemented in the Java programming language. Java offers robust data typing that
facilitates object-oriented programming in its truest form.
The principles and advantages of object-oriented design
are well documented in the software engineering literature (see [28]). Java is becoming widely adopted in the
bioinformatics software domain. For example, the
Ensembl database has a Java API to programmatically
access genome annotations [29]. The Biojava toolkit [30]
is an extensive set of packages written in Java for sequence
manipulation, analysis and processing. The Apollo
genome editor [11], that we use with Pegasys, allows biologists and bioinformaticians to edit and create annotations in a sophisticated GUI and is written in Java. We
have integrated the Biojava toolkit into Pegasys for
manipulation of sequence files as well as parsing of BLAST
output. Using Java also allows us to make use of the JDBC
library for database connectivity that facilitates standard
database interactions independent of the RDBMS engine.
To enable parallelism, we made use of the robust Thread
and Runnable classes that allow development of multithreaded programs.
We have designed Pegasys in a layered architecture that
consists of independent Java packages that can easily be
imported into any external Java application that wishes to
make use of them. These packages are well described in
the Pegasys user manual, available at: http://bioinformat
http://www.biomedcentral.com/1471-2105/5/40
ics.ubc.ca/pegasys/. Implementing Pegasys in Java has
brought the system strength and robustness that would
not have been attainable with using a scripting language.
Pegasys provides a Java alternative to existing Perl-based
sequence analysis systems such as GenDB [3] and BioPipe
[31].
The Graphical User Interface
The Pegasys graphical user interface (GUI) is designed for
ease of use while maximizing functionality. When the client is started, the user sees a simple three pane design (see
Figure 4). On left of the screen is a list of programs (the
'Tool Box') available to the user. The list is retrieved from
the server as an XML configuration file when the client
starts, ensuring all the programs that are available to the
user from the client are available on the server. The canvas
for drawing the workflow is on the upper right side of the
screen, and on the bottom of the screen there is a console
to view feedback from the client program.
The structure of the workflow the user creates on the canvas mirrors the structure of the DAG (see The Pegasys data
structure section). The nodes of this DAG can either be
input files, output files, or a program, while the edges that
connect the nodes manage the flow of input and output
information. For example, the Genscan program node can
produce many types of outputs, a list of nucleotide FASTAs of predicted transcripts, or a list of amino acid FASTAs
of the protein products. If a user connects a BLASTP node
to this Genscan node, then the edge between these two
nodes can be used to get the list of amino acid FASTAs
from the Genscan node as input for the BLASTP node.
During the creation of the workflow, the user can modify
the parameters of the analysis programs by double-clicking a node. This opens a Node Properties dialogue. An
example for BLAST is pictured in Figure 5. The input/output types for each edge must be set during the creation of
the workflow. This is done through the Edge Properties
dialogue (see Figure 6).
When the user has finished creating the workflow, it can
be saved as an XML file representing the DAG. This XML
file stores all the parameters for the nodes and edges that
have been set by the user during the creation of the DAG.
This file can be kept on the local hard drive and retrieved
for later modification or distribution, or sent to the server
to be executed on the compute cluster. The saved DAG can
also be sent to the server using the command-line Java client for high-throughput, or automated processing. When
the processing is complete, the results are sent back to the
GUI client to be saved as text files.
To ensure that the user's workflow is syntactically correct,
the Pegasys client validates the workflow in real time. As
Page 9 of 16
(page number not for citation purposes)
BMC Bioinformatics 2004, 5
http://www.biomedcentral.com/1471-2105/5/40
Figure 5 of the Node Properties dialogue window where users can input parameters for the analysis programs
Screenshot
Screenshot of the Node Properties dialogue window where users can input parameters for the analysis programs. There are three columns – the name of the parameter, its current value and a check box to indicate if this parameter
is enabled. Disabled parameters will be excluded from the DAG XML, and consequently from the actual command that is executed on the server. All default values are set in the ProgramList.xml file that the server reads on startup.
Page 10 of 16
(page number not for citation purposes)
BMC Bioinformatics 2004, 5
http://www.biomedcentral.com/1471-2105/5/40
Figure 6 of the Edge Properties dialogue window where users set the inputs and outputs of an edge
Screenshot
Screenshot of the Edge Properties dialogue window where users set the inputs and outputs of an edge. The
input/output values are selected with drop-down select bars so users can only select input/output types that are available to
the two nodes. Incompatible input/output types for an edge are not allowed by the GUI and the user is alerted to the error.
The input/output lists for each node are set in the ProgramList.xml file that the server reads on startup.
Page 11 of 16
(page number not for citation purposes)
BMC Bioinformatics 2004, 5
the user draw nodes and edges, they are validated for correctness based on their requirements. For example, if a
Program Node has a required parameter that is not filled
in, the Pegasys client will display that node with a red 'X'
beside it. Once this required parameter is filled in, the red
'X' will turn into a green tick mark, indicating the correctness of this node. Invalid edges are displayed in red, while
correct ones are displayed in black. Typically, edges will be
invalid if the 'output' and 'input' values of the edges are
not set or do not match. If the workflow has a red edge or
a node marked with a red 'X', the Pegasys client will not
allow the user to send the workflow to the server and will
output a warning to the 'Console' area.
The GUI component of the Pegasys system is implemented in C++, using QT graphical libraries [32]. The QT
libraries offer a "write once compile anywhere" approach.
Because the QT components are natively compiled for its
target operating system, GUI components written in C++/
QT have a more native look and feel and give fast response
times to the user. In addition, C++/QT can be compiled
on all the major operating systems, giving it nearly the
same level of portability as Java and facilitating the distribution of the Pegasys GUI client for most platforms.
XML configuration files
Communication between the client and server is mediated through XML files. There are three key XML files in
the Pegasys client. The first XML file, the Pegasys
configuration file (PegasysConfig.xml), keeps track of the
system settings for default output directories on the server,
queuing time for the scheduler, location of Pegasys Java
jar files, and database information. This file also contains
the path to the second XML file – the program list file
which list all of the programs and their associated parameters that are currently available on the Pegasys server
(ProgramList.xml). This file needs to be updated whenever a new module is added to the server, or the parameters of an existing module are changed. It is kept on the
server and is transmitted to the client every time it starts
up to inform the users of the available programs on the
server and their associated parameters.
The third XML file is the textual representation of the
workflow. This file is generated by saving the workflow
using the client. It can be sent to the server where it is
parsed and then executed, or it can be re-opened at a later
time for further modification. For each node on the
canvas, its parameters, flags, and coordinates on the canvas are recorded in the DAG XML file. Edges have their
start and end nodes recorded.
Communication via XML is one of the standard ways of
disseminating information on the Internet. Both Java for
the backend and QT for the client have ready-made pars-
http://www.biomedcentral.com/1471-2105/5/40
ers for XML. This allowed us to rapidly build the software
components that exchange information between the client and the server.
Results and discussion
To illustrate the flexibility of Pegasys for diverse analyses,
we chose three workflows to demonstrate as use cases for
the system. The simplest workflow takes an input
sequence, runs a single analysis on this sequence and
saves the unprocessed results.
Figure 4 shows an example of detecting repeats in a
genomic sequence using RepeatMasker. In this example,
the unprocessed results are written to a text file. This
example is almost as if RepeatMasker were run locally on
the command line, except that all information about the
parameters used, the input sequence and the results are
logged to the Pegasys database.
Figure 7 shows a workflow that has two inputs. The first is
a FASTA-formatted nucleotide sequence file. This file is
used as input to 'formatdb' – an application that transforms FASTA-formatted databases into a format that can
be used by BLAST. The second input is a query sequence
that will be used to search the newly formatted database
using BLAST. The results of the search are outputted in a
GFF-formatted text file.
Figure 8 shows a workflow that would be suitable for
annotation of eukaryotic genomic sequence. The output
of this workflow would serve as the input for an annotation tool like Apollo. The DAG branches after the input
sequence File node into a sub-DAG of analyses that work
on the input as is and a sub-DAG that analyzes the input
sequence that is masked for repeats with RepeatMasker.
The unmasked sequence is analysed for tRNAs using
tRNAscan-SE, and for protein coding genes using ab initio
gene predictors Genscan and HmmGene. The masked
sequence is searched against a database of curated proteins using BLASTX and against a database compiled from
ESTs, full-length cDNAs and mRNA sequences (dbTranscript). The results from the latter search are further processed by an application (bt2fasta) that filters all hits based
on taxonomy (in this case the user-inputted NCBI taxonid
of the source organism of the input sequence) and
retrieves their full sequences. This results in an organismspecific database of FASTA formatted sequences consisting of the BLASTN against dbTranscript hits. The
unmasked input sequence is then used as input to Sim4,
which in turn aligns the input sequence to the entries in
the organism specific database. Results for all analyses are
then integrated into a GAME XML file for further interpretation using Apollo. The Pegasys XML DAG file that
includes the parameters for all programs is available for
download at http://bioinformatics.ubc.ca/pegasys/.
Page 12 of 16
(page number not for citation purposes)
BMC Bioinformatics 2004, 5
http://www.biomedcentral.com/1471-2105/5/40
Figure 7 showing a BLAST pipeline
Workflow
Workflow showing a BLAST pipeline. A FASTA formatted database is to be formatted for BLAST using 'formatdb'. A
query sequence is then searched against this new database using BLAST. The results are written to a text file in GFF format.
Page 13 of 16
(page number not for citation purposes)
BMC Bioinformatics 2004, 5
http://www.biomedcentral.com/1471-2105/5/40
Figure 8 for genome annotation
Workflow
Workflow for genome annotation. This workflow executes ab initio gene prediction, tRNA detection, repeat detection,
sequence similarity searching against protein and transcript databases and alignments of transcripts to genomic sequence.
Results for all of these analyses are integrated into a single GAME XML output file that can be inputted into Apollo, where a
user can create annotations on the original input sequence.
These use cases provide good examples of how Pegasys
can be used in sequence-based bioinformatics analyses.
The system itself is by no means limited to these examples. In theory any Unix program or script can be
incorporated into the system and Pegasys could be used
for workflows for systems administration, or other highlevel scripting.
Comparison with other systems
As mentioned above, there are other systems that are similar to Pegasys in philosophy and approach. The DiscoveryNet platform [33] is a system that integrates
bioinformatics tools based on Grid computing technolo-
gies. This system is a 'middleware' system that can be used
to create workflows of annotation tools. Pegasys differs
from the DiscoveryNet approach in two major ways. First,
Pegasys provides a rigorously defined data model for storing computational features that is mapped by a relational
backend database. The use case for DiscoveryNet describes
output in the form of text-based flat files. Storing the data
in a database allows it to be mined using SQL for selective
sub-sets of computational evidence and gives the user
more control over what they are interpreting. Second, the
Pegasys system is designed to create workflows on the fly
using the GUI and XML. The DiscoveryNet genome annotation workflow was programmed and any new workflow
Page 14 of 16
(page number not for citation purposes)
BMC Bioinformatics 2004, 5
would
also
require
programming
investment.
DiscoveryNet uses the concept of web-services and distributed computing. The architecture of Pegasys is extensible
to web service based analyses. We plan on adding the
capability of making remote calls to application servers
and being able to integrate their analysis results into the
Pegasys framework. This would give Pegasys the utmost
flexibility and extensibility by combining the power of
locally installed applications with remote web services.
The Biopipe framework [31] describes a framework for
protocol-based bioinformatics. The protocols are
developed with the goal of creating reproducibility of
results from computational analyses. This idea complements Pegasys quite well and we envisage using Pegasys to
encode protocols by creating workflow standards generated from the Pegasys GUI for specific types of analyses
(e.g. genome annotation or mass spectrometry peptide
fragment identification) that we can distribute to the
Pegasys user community. This will facilitate cross-comparison of results from similar bioinformatics experiments
performed on data sources in different research labs, or by
colleagues working in the same lab. In addition, Pegasys
can be used to compare results of different protocols
designed to address similar scientific problems.
Future directions
The work described in this paper has led us to consider
many new challenges for future work on Pegasys. While
the specifications, the data model and the software are
mature enough to be used in a research setting, there
remain many features and enhancements to the system
that we are implementing in on-going work. We are adding new modules to Pegasys for distribution to the community. We are implementing Pegasys modules for the
Infernal package that is driving the Rfam repository of
families of functional RNAs [34]. Our genome annotation
work to date has focused largely on eukaryotic systems,
and we have therefore devoted most of our development
time to applications tuned for eukaryotic animal analysis.
We are adding modules for prokaryotic analysis (e.g.
Glimmer [35,36]) and plants (Eugene [37]) to complement the current tools in Pegasys.
From a software perspective, we hope to make Pegasys
inter-operable and compliant with additional existing
Open Source bioinformatics standards and specifications,
namely BioSQL and Chado to allow data computed with
Pegasys to be used in other systems that employ and interact with these specifications.
Conclusions
We have created a robust, modular, flexible software system for the execution and integration of heterogeneous
biological sequence analyses. Pegasys can execute and
http://www.biomedcentral.com/1471-2105/5/40
integrate results from ab initio gene prediction, pair-wise
and multiple sequence alignments, RNA gene detection
and masking of repetitive sequences to greatly enhance
and automate several levels of the biological sequence
analysis process. The GUI allows users to create workflows
of analyses by dragging and dropping icons on a canvas
and joining processes together by connecting them with
graphical 'edges'. Each analysis is highly configurable and
users are presented with the option to change all parameters that are supported by the underlying program. Data
integration is facilitated through the creation of a data
model to represent computational evidence which is in
turn implemented in a robust backend relational database
management system. The database API provides programmatic access to the results through high-level methods
that implement SQL queries on the data. The Pegasys system is currently driving numerous diverse sequence analysis projects and can be easily configured for others.
Implemented in Java, the backend of Pegasys is interoperable with a growing number of bioinformatics tools
developed in Java. Pegasys can output text files in standard formats that can then be imported into other tools for
subsequent analysis or viewing. We are continually adding to Pegasys through the development of additional
modules and methods of data integration. The flexibility,
customization, modularity and data integration capabilities of Pegasys make it an attractive system to use in any
high throughput sequence analysis endeavour. We are
releasing the source code of Pegasys under the GNU General Public License with the hope that the bioinformatics
community worldwide will make use of our efforts and in
turn contribute improvements in the spirit of Open
Source.
Availability and requirements
Pegasys is available at http://bioinformatics.ubc.ca/
pegasys/ and is distributed under the GNU General Public
License. Pegasys is designed to run on Unix based systems.
Please consult the user manual (available with the distribution) for detailed installation and configuration
instructions. The Pegasys server is written in Java and has
the following dependencies: Java 1.3.1 or higher, PostgreSQL 7.3.*, JDBC driver for PostgreSQL 7.3.* and BioJava 1.2*. We have tested Pegasys on a distributed
memory cluster (recommended) running OpenPBS
2.3.16 to administer the job scheduling. In theory an SMP
system running OpenPBS should work, but this has not
been tested. The system's analysis programs include the
following: NCBI BLAST 2.2.3, WU BLAST 2.0, EMBOSS
2.7.1 (for Smith-Waterman implementation only),
tRNAscan-SE 1.23, the LAGAN toolkit 1.2, Sim4, Genscan
1.0, HMMgene 1.1, MaskerAid (2001-11-08) and GeneSplicer. All of the analysis tools are freely available to academics. For details please consult the Pegasys manual
Page 15 of 16
(page number not for citation purposes)
BMC Bioinformatics 2004, 5
available with the distribution. The server has successfully
been deployed and tested on a 28 CPU Linux cluster running RedHat 7.3.
The client is written in C++ and requires the QT libraries
version 3.11, and gcc version 3.2.2. The client has been
tested on Linux Mandrake9.x, Solaris 8, Mac OSX,
Windows98/NT/ME/XP.
Authors' contributions
SS was the lead architect of the system and contributed to
the design and implementation and wrote most of this
manuscript. DH was the principal developer and contributed to the design and implementation of the server and
the GUI. JS contributed to the design of the project and
provided requirements to the developers who were
designing the system. GQ, GZ, JD, DL and TX all participated in the implementation of various components of
the system. BFFO conceived of the project, guided its
development, and edited this manuscript.
http://www.biomedcentral.com/1471-2105/5/40
10.
11.
12.
13.
14.
15.
16.
17.
18.
19.
20.
21.
Acknowledgments
BFFO would like to acknowledge GenomeBC for funding this project. DL
is supported by the CIHR/MSFHR Strategic Training Program in Bioinformatics http://bioinformatics.bcgsc.ca. TX is supported by CIHR grant
#MOP-53259. We wish to thank Stefanie Butland, Joanne Fox and Yong
Huang for critical reviews of this manuscript. We also thank Miroslav Hatas
and Graeme Campbell for systems and software installation and maintenance for the Pegasys server.
References
1.
2.
3.
4.
5.
6.
7.
8.
9.
Hubbard T, Barker D, Birney E, Cameron G, Chen Y, Clark L, Cox T,
Cuff J, Curwen V, Down T, Durbin R, Eyras E, Gilbert J, Hammond M,
Huminiecki L, Kasprzyk A, Lehvaslaiho H, Lijnzaad P, Melsopp C,
Mongin E, Pettett R, Pocock M, Potter S, Rust A, Schmidt E, Searle S,
Slater G, Smith J, Spooner W, Stabenau A, Stalker J, Stupka E, UretaVidal A, Vastrik I, Clamp M: The Ensembl genome database
project. Nucleic Acids Res 2002, 30:38-41.
Mungall CJ, Misra S, Berman BP, Carlson J, Frise E, Harris N, Marshall
B, Shu S, Kaminker JS, Prochnik SE, Smith CD, Smith E, Tupy JL, Wiel
C, Rubin GM, Lewis SE: An integrated computational pipeline
and database to support whole-genome sequence annotation. Genome Biol 2002, 3(12):. RESEARCH0081. Epub 2002 Dec 23.
Review
Meyer F, Goesmann A, McHardy A, Bartels D, Bekel T, Clausen J,
Kalinowski J, Linke B, Rupp O, Giegerich R, Pühler A: GenDB – an
open source genome annotation system for prokaryote
genomes. Nucleic Acids Res 2003, 31(8):2187-2195.
Yuan Q, Ouyang S, Liu J, Suh B, Cheung F, Sultana R, Lee D, Quackenbush J, Buell C: The TIGR rice genome annotation resource:
annotating the rice genome and creating resources for plant
biologists. Nucleic Acids Res 2003, 31:229-233.
Korf I, Flicek P, Duan D, Brent MR: Integrating genomic homology into gene structure prediction. Bioinformatics 2001,
17:S140-S148. Suppl 1
Mathé C, Déhais P, Pavy N, Rombauts S, Van Montagu M, Rouzé P:
Gene prediction and gene classes in Arabidopsis thaliana. J
Biotechnol 2000, 78(3):293-299.
Yeh R, Lim L, Burge C: Computational inference of homologous
gene structures in the human genome. Genome Res 2001,
11(5):803-816.
Rogic S, Ouellette B, Mackworth A: Improving gene recognition
accuracy by combining predictions from two gene-finding
programs. Bioinformatics 2002, 18(8):1034-1045.
General Feature Format [http://www.sanger.ac.uk/Software/for
mats/GFF/index.shtml]
22.
23.
24.
25.
26.
27.
28.
29.
30.
31.
32.
33.
34.
35.
36.
37.
GAME XML DTD
[http://flybase.bio.indiana.edu/annot/
gamexml.dtd.txt]
Lewis SE, Searle SM, Harris N, Gibson M, Lyer V, Richter J, Wiel C,
Bayraktaroglir L, Birney E, Crosby MA, Kaminker JS, Matthews BB,
Prochnik SE, Smithy CD, Tupy JL, Rubin GM, Misra S, Mungall CJ,
Clamp ME: Apollo: a sequence annotation editor. Genome Biol
2002, 3(12):. RESEARCH0082. Epub 2002 Dec 23. Review.
Altschul S, Gish W, Miller W, Myers E, Lipman D: Basic local alignment search tool. J Mol Biol 1990, 215(3):403-410.
Altschul S, Madden T, Schäffer A, Zhang J, Zhang Z, Miller W, Lipman
D: Gapped BLAST and PSI-BLAST: a new generation of protein database search programs. Nucleic Acids Res 1997,
25(17):3389-3402.
Dowell R, Jokerst R, Day A, Eddy S, Stein L: The distributed annotation system. BMC Bioinformatics 2001, 2:7-7.
R Development Core Team: R: A language and environment for
statistical computing. R Foundation for Statistical Computing, Vienna,
Austria 2003 [http://www.R-project.org]. [ISBN 3-900051-00-3]
Bedell J, Korf I, Gish W: Masker Aid: a performance enhancement to RepeatMasker. Bioinformatics 2000, 16(11):1040-1041.
Gish W: WU BLAST 2.0.
[http://blast.wustl.edu/blast/
README.html].
Rice P, Longden I, Bleasby A: EMBOSS: the European Molecular
Biology Open Software Suite. Trends Genet 2000, 16(6):276-277.
Smith T, Waterman M: Identification of common molecular
subsequences. J Mol Biol 1981, 147:195-197.
Burge C, Karlin S: Prediction of complete gene structures in
human genomic DNA. J Mol Biol 1997, 268:78-94.
Krogh A: Two methods for improving performance of an
HMM and their application for gene finding. Proc Int Conf Intell
Syst Mol Biol 1997, 5:179-186.
Brudno M, Do C, Cooper G, Kim M, Davydov E, Green E, Sidow A,
Batzoglou S: LAGAN and Multi-LAGAN: efficient tools for
large-scale multiple alignment of genomic DNA. Genome Res
2003, 13(4):721-731.
Florea L, Hartzell G, Zhang Z, Rubin G, Miller W: A computer program for aligning a cDNA sequence with a genomic DNA
sequence. Genome Res 1998, 8(9):967-974.
Lowe T, Eddy S: tRNAscan-SE: a program for improved detection of transfer RNA genes in genomic sequence. Nucleic Acids
Res 1997, 25(5):955-964.
Pertea M, Lin X, Salzberg S: GeneSplicer: a new computational
method for splice site prediction. Nucleic Acids Res 2001,
29(5):1185-1190.
Stein L, Mungall C, Shu S, Gaudy M, Mangone M, Day A, Nickerson E,
Stajich J, Harris T, Arva A, Lewis S: The generic genome browser:
a building block for a model organism system database.
Genome Res 2002, 12(10):1599-1610.
OpenPBS [http://www.openpbs.org]
Booch G: Object-oriented Analysis and Design with Applications The Benjamin/Cummings Publishing Company; 1994.
Ensj [http://www.ensembl.org/java/]
BioJava.org [http://www.biojava.org]
Hoon S, Ratnapu K, Chia J, Kumarasamy B, Juguang X, Clamp M, Stabenau A, Potter S, Clarke L, Stupka E: Biopipe: a flexible framework for protocol-based bioinformatics analysis. Genome Res
2003, 13(8):1904-1915.
Trolltech – Qt Overview [http://www.trolltech.com/products/qt/
index.html]
Rowe A, Kalaitzopoulos D, Osmond M, Ghanem M, Guo Y: The discovery net system for high throughput bioinformatics. Bioinformatics 2003, 19(Suppl 1):225-225.
Griffiths-Jones S, Bateman A, Marshall M, Khanna A, Eddy S: Rfam:
an RNA family database. Nucleic Acids Res 2003, 31:439-441.
Delcher A, Harmon D, Kasif S, White O, Salzberg S: Improved
microbial gene identification with GLIMMER. Nucleic Acids Res
1999, 27(23):4636-4641.
Salzberg S, Delcher A, Kasif S, White O: Microbial gene identification using interpolated Markov models. Nucleic Acids Res 1998,
26(2):544-548.
Schiex T, A M, P R: EUGENE: An Eukaryotic Gene Finder That
Combines Several Sources of Evidence. In JOBIM 2000:111-125.
Page 16 of 16
(page number not for citation purposes)