1
X-NetStat Professional 5.3 User’s Manual – Page 1 of 38
X-NetStat Professional Users Manual
Last Revised: May 2005
You've got connections. ™
Copyright © 2005 Fresh Software
Please check the X-NetStat Professional website at www.freshsw.com/xns/pro for updates to the manual and program.
Contents
•
•
•
•
•
•
•
•
•
•
•
•
•
What is X-NetStat? ……………………………………….……………….……2
Main Window………………………………………………….…………………3
Interpreting Connections…………………………………….…………………4
Getting more information…………………………………….…………………5
o Connection Information……………………………..……....…………6
o Process Information……………………………….…….…….....……7
o Port Information…………………………………….…………….……8
o The InfoPanel…………………………………………….……….....…9
o Lookup Tools…………………………………………………………12
Options: Configuring and Customizing XNS………………..………………14
Other ways to access X-NetStat
o ViewBar Access………………………………………....……………22
o Tray Access………………………………………..…..........…………23
o Remote Access…………………………………….....………………24
Logging……………………………………………………….....………………26
Rules: Responding to Network Events…………………………………....…27
Recognizing your connections with Friendly Names………………………30
Net Stats: Your Network Statistics………………………………………...…32
Add more power: The X-NetStat Packet Sniffer………………....…………33
Other X-NetStat Tools………………………………………………....………34
Appendices
o Appendix A: Netstat Status codes……………….……….……...…35
o Appendix B: WHOIS Servers………………….……….….…….......36
o Appendix C: IP Addresses & Hostnames…………….....….…........37
o Appendix D: About Fresh Software and its commitment……........38
See also: readme.txt / whatsnew.txt
X-NetStat Professional 5.3 User’s Manual – Page 2 of 38
What is X-NetStat?
X-NetStat is a program that displays information on your current Internet and network connections, much like the console
netstat.exe program, but in a graphical interface. These connections are established each time you visit a web page, send
an instant message, check your email, or anytime you do network activity that requires you to connect to another
computer. They also appear when outside computers attempt to connect to your machine, authorized or not.
Each connection is displayed in the Connection Table, where you can see the address you are connected to, what
ports (local and remote) are being used, the connection status, the program EXE * used to open the connection, and how
long the connection has been active.
The Professional edition of X-NetStat offers a smorgasbord of additional features that are geared towards Network
Administrators for their tasks of monitoring and managing networks. X-NetStat Professional contains powerful features
like a Rules system that lets you set up actions based on network conditions, a comprehensive Network Statistics window
displaying information on network interfaces and protocols, a Web Server that lets you access XNS information remotely,
a collection of Lookup Tools (TraceRoute, WHOIS, Finger, DNS, Web Search, etc), and many more features.
Feature List
•
•
•
•
•
•
•
•
•
•
•
•
•
•
Display TCP connections & UDP listens
Connection info: Process, Port, Status, Addresses
Location Info (Automatic WHOIS)
System Info
FilterBar – search for connections
Ability to kill/disconnect connections
Nuke Connections (mass kill)
DNS Cache for fast hostname resolution
Logging XNS activity to file
Feature centric toolbar
ViewBar & System tray access
Remote Access thru X-NetStat Server
Comprehensive Port Information Database
Banish Hostname
•
•
•
•
•
•
•
•
•
•
•
•
•
•
Condition/Action Rules system
Print / Save Connection Table
Process Information
Customize Columns & Toolbar buttons
Customize Status Bar
Customize external Programs
Customize Font & Appearance
Lookup Tools (WHOIS, TraceRoute, etc)
Net Stats (Interface, TCP, IP, ICMP, UDP)
Check for Updates
Assign addresses “friendly” names
DOS Commands menu
Get External IP Address
Log Manager
System Requirements
•
•
•
Windows 98, 2000, or XP
64MB Ram
Pentium 233 MHz
On average X-NetStat will consume less than 1% CPU resources at any given time.
To begin discovering how X-NetStat can empower your network management, keep reading, or simply start the program
and play around with it – you should find the program intuitive to use.
*Windows XP Only
X-NetStat Professional 5.3 User’s Manual – Page 3 of 38
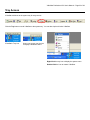
Main Window
Toolbar: Quick access to the most
important features of X-NetStat.
To add or remove buttons to the
toolbar, right-click on any button
and check/uncheck the buttons
you wish to be visible. You may
also add or remove buttons by
using the View menu.
Connection Table: The core of XNetStat. This is where connections
are displayed.
InfoPanel: Shows detailed
information on the currently
selected connection.
Status Bar: Shows progress of a
connection refresh, time of last
refresh, address information for
computer, pings sent/received, etc.
You can customize what you want
to appear in the status bar.
Double-click the status bar to add
or remove panels.
X-NetStat Professional 5.3 User’s Manual – Page 4 of 38
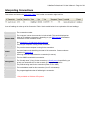
Interpreting Connections
Connections are listed in the Connection Table. Here’s what a connection might look like:
A set of headings is at the top of the Connection Table. Use the table below for an explanation of these headings:
#
The connection number.
Remote Addr
The computer / server the connection is involved with. This can be displayed as
either an IP address or hostname, depending on your DNS Settings and whether
a hostname for the IP address exists.
See: Appendix C, IP Addresses and Hostnames.
Local Port
The port your computer is using for the connection.
Remote Port
The port the remote computer is using for the connection.
Status
One-word status code describing the state of the connection. Status codes are
explained in Appendix A.
Age
How long XNS has known about the connection (hh:mm:ss)
Time
The time XNS first noticed this connection.
Recognized
The "friendly name" (if any) for the connection. A friendly name is specified by you
to help you remember who or what a certain IP / hostname address is.
Protocol
The protocol being used for the connection (Either TCP or UDP).
Local Addr
The local address used for this connection (Your IP or hostname)
Process *
The program/application that is facilitating the connection.
* Only available on Windows XP systems.
X-NetStat Professional 5.3 User’s Manual – Page 5 of 38
Getting more information
The Connection Table shows all available information about the connection, but you may find yourself in a situation where
you need to know more. X-NetStat has several built-in features to help you further research a connection.
The Context Menu
If you right-click on a connection, the context menu appears.
This popup menu lets you perform several actions on a connection.
View Alert:
View Message Alert if connection has tripped a rule.
Refresh:
Refresh Connection List
Copy Connection Info: Copy information to clipboard.
Connection Info:
Opens Connection Info window
Process Info:
Opens Process Info window
Local/Remote Port:
Opens Port Information window
Kill Connection:
Extended Kill
Recognize as:
TraceRoute:
WHOIS:
NBLookup:
Attempts to forcibly disconnect the connection
Kills and sets rule to auto-kill address if seen again
Associates a friendly name with the connection
Traces the path from your computer to remote comp
Various WHOIS functions
Attempts to retrieve computer’s NetBIOS name.
These commands are also available under the “Connection” main menu.
New in version 5.2 is the InfoPanel, which provides easy access to
Connection Info, Process Info, Port Info, Location Info and System Info in one place.
X-NetStat Professional 5.3 User’s Manual – Page 6 of 38
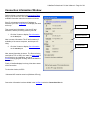
Connection Information Window
Double-clicking a connection in the Connection Table
brings up the Connection Info window. Here, all
available information about the connection is shown.
If the IP or hostname matches an IP address or
hostname you have recognized, it will display the name
at the top.
Local Port Info
Then comes local information: Your local IP and
hostname, and the port being used on your end.
1. Click the ? button to display Port Information
on the local port.
Remote Port Info
Next is remote information: The IP and hostname (if
available) of the remote computer, and the port it is
using.
Process Info
2. Click the ? button to display Port Information
on the remote port.
Next, status information is shown: The Protocol being
used (either TCP or UDP), the “state” or status code of
the connection, an explanation, and what
process/running program is being used to facilitate the
connection. *
Finally, X-NetStat displays how long it has been aware
of the connection.
To close the window, hit ESC.
* Advanced API must be turned on (Windows XP only)
Connection Information is also available in the InfoPanel under the Connection Info tab.
X-NetStat Professional 5.3 User’s Manual – Page 7 of 38
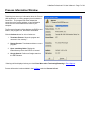
Process Information Window
This dialog box shows you information about the Process
(AKA application, or running program) that is behind the
connection. The program has either initiated the
connection to the remote address, or has facilitated a
connection the remote address has made to your
computer.
The Process Information dialog displays the EXE file and
location, the program icon, and version information.
Click the Actions button for a list of actions to:
1. Terminate Process: Stops the program and
removes it from memory.*
2. Restart Process: Terminates and then re-runs a
program.*
3. Open containing folder: Display the
folder/directory where the EXE file is located.
4. Google Search: Performs a Google search on
the EXE filename.
* Warnings will be displayed unless you check Don’t Warn when Terminating/Restarting in Extra Options .
Process Information is also available in the InfoPanel under the Process Info tab.
X-NetStat Professional 5.3 User’s Manual – Page 8 of 38
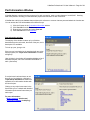
Port Information Window
X-NetStat displays a local port and a remote port for each connection, each a number between 1 and 65,435. Knowing
what these ports do can help you understand the purpose and relevance of each connection.
X-NetStat has a built in port database that provides quick reference to common Internet ports and what their functions are.
You can access the Port Info database three different ways:
1)
2)
3)
4)
Click the ? button in the Connection Information window
Click Port Info from the Tools menu
Right-click a connection and select Port Info
Click Port Info tab on the InfoPanel
Port Information window
The majority of the window is taken up by a field that
describes the port's code word, the name of the port, and a
description if it's available.
To look up a port, just type it in.
If the port you have looked up is associated with any trojan
horse programs, the Trojan horse information >> button
will light up.
Upon clicking it, the window will expand and display a list of
associated trojans, with a link to detailed information on
each. (See below)
If a trojan horse has been known to use
the port you just looked up, clicking the
Trojan horse information >> button will
expand the Port Information window with
the list of trojans.
Clicking on any trojan horse name in the
list will take you to a website with detailed
information (and removal instructions) on
each trojan.
For more Information:
What is a trojan? (whatis.com)
Trojan Horse Attacks (irchelp.org)
X-NetStat Professional 5.3 User’s Manual – Page 9 of 38
The InfoPanel
New in version 5.2 is the InfoPanel, a dashboard that sits below the connection table that integrates Connection
Information, Process Information, Port Information, Location Information and System Information into one easy-toaccess place.
InfoPanel: Click a button to display information.
To make use of the InfoPanel, just select a connection and information will appear. Click another tab to display other
information.
To get the InfoPanel out of the way, click the Down button.
This will shrink the InfoPanel down to a minimal size and
change the Down button to an Up button.
Click Up to restore the InfoPanel to its previous height.
To close the InfoPanel completely, click the X in the upperright hand corner. To turn it back on, click the View menu
and choose “Show InfoPan”
Everything in the InfoPanel can be activated through the Context Menu, except for Location Info and System Info which
are explained below.
X-NetStat Professional 5.3 User’s Manual – Page 10 of 38
InfoPanel: Location Info
The Location Info section of the InfoPan allows you to do a one-click WHOIS lookup of a connection’s IP address, domain name, or
both. To use, simply select a connection, click the Location Info tab, and click IP Lookup or Domain Lookup.
IP Lookup
When clicked, X-NetStat will query the IP address of the connection in the databases of :
ARIN
American Registry for Internet Numbers
RIPE
Réseaux IP Européens
APNIC
Asia Pacific Network Information Centre
LACNIC
Latin American and Caribbean Internet Addresses Registry
The organization that owns the IP address will then be displayed (see above). In rare instances, several duplicate records will be
found and you will need to focus your query by clicking the
button
Domain Lookup
When clicked, X-NetStat will determine the domain name of the selected connection and query Verisign’s central database to find which
registrar handles its registration, and then will pull up the WHOIS record.
This button will only be enabled if the connection’s IP address was resolved into a hostname.
See Also: Appendix B: WHOIS Servers
X-NetStat Professional 5.3 User’s Manual – Page 11 of 38
InfoPanel: System Info
The System Info section of the InfoPanel does not display connection-specific information. Rather, it shows useful stats
such as X-NetStat version, System Uptime, Windows Username, Workgroup, MAC Address, and more.
X-NetStat Professional 5.3 User’s Manual – Page 12 of 38
Lookup Tools
X-NetStat has an integrated interface for several network tools, the Lookup Tools window.
TraceRoute: A graphical interface for the TraceRoute or tracert program. This applet uses the ICMP protocol to map
what servers ("hops") are being used to route a packet of data from your computer to a remote, destination system. To
trace a server, just enter the IP address or hostname and click Trace. During this process, information regarding the
status of the TraceRoute will be shown in the status bar. As each hop is reached, information about the hop will be shown
in the table.
Note: Your firewall may restrict ICMP packets, which may result in TraceRoute not working properly
.
WHOIS: WHOIS connects to one of several online databases of domain names (domain.com, domain.net, etc). You can
obtain information on a domain name, such as who registered it, where that person resides, and contact information for
businesses and people associated with the domain.
There are two things you must know when doing a WHOIS query: The query string, and the server you are going to query.
The query string is usually a domain name, such as “freshsw.com”. However, it can include other types of queries as
well, and will give different results based on what's on the WHOIS server. You can try entering a person's last name, the
name of a corporation, or the direct handle of a contact. To see what syntax a server accepts, click the Help button after
choosing a server.
The WHOIS server you must use usually depends on the type of domain name you are querying. If it ends in a .com,
.net, or .org, you will want to use whois.verisign-grs.net as the server. If you need to query an IP address, use arin.net
for the United States and ripe.net for Europe. (See Appendix B, WHOIS servers). Click the Go button to start the query.
You can also use a specific port in this format: server:port , eg arin.net:44
X-NetStat Professional 5.3 User’s Manual – Page 13 of 38
Finger: According to RFC742, a finger query “returns a friendly, human-oriented status report on either the system at the
moment or a particular person in depth.”
Note that Finger is an old protocol that is not in common usage today. However, some servers still run finger daemons
and you may find the information they return to be useful. To make a query, use the form of an email address, such as
[email protected].
Check Verbose to instruct the server to return as much information as possible.
See Also: RFC 742
NS Lookup: NS Lookup is a program to query Internet domain name servers for their records on an IP or hostname.
There are several types of queries that can be made:
Simple
Changes IP to Hostname or Hostname to IP based on records in the DNS Cache.
MX
Short for mail exchange record, an entry in a domain name database that identifies the mail server that is
responsible for handling e-mails for that domain name.
A
Address records. This is where the hostname to IP (name-to-number) mappings are kept.
PTR
PTR records are the reverse of A records. They map an IP address to a hostname, rather than vice-versa.
SOA
SOA (Start Of Authority) records indicate the extent of the zone for which the name server is authoritative. They
also contain information about how frequently they should be checked for updated information.
Any
Returns any available information.
For more information: The In’s and Out’s of DNS and Appendix C, IP Addresses and Hostnames.
Web Search: Provides a gateway to query several popular web search-engines. Simply type in your search query,
select which search engine to use, and click search.
Server Version: Sends a HTTP HEAD request to a server on port 80, which returns data on the type of web server and
operating system the server is running on.
Ex: Apache/1.3.29 (Unix) mod_webapp/1.2.0-dev PHP/4.3.4 FrontPage/5.0.2.2634 Rewrit/1.1a
NB Lookup: Given an IP address, NB Lookup will try to establish a NetBIOS connection, and if successful, will return the
name table of the remote computer.
Online Tools: Contains a list of links to popular web-based network tools. This list is customizable, so you can add your
own favorite links. Just click the Edit Online Tools button and enter a link in the form of NAME=URL (e.g., Fresh
Software=http://www.freshsw.com)
X-NetStat Professional 5.3 User’s Manual – Page 14 of 38
Options: Configuring and Customizing X-NetStat
Click the Options button to change X-NetStat program settings.
General Connection Table Friendly Names Rules Programs Viewbar Remote Access Logging Packet Sniffer Advanced Extra Options
General Options
Auto refresh connections – When checked, XNetStat will refresh the Connection Table for you
automatically so you don’t have to push the
Refresh button each time.
Count down seconds in status bar – When
checked, X-NetStat will count down the last 5
seconds until a refresh.
Auto lookup hostnames – When checked, XNetStat will attempt to resolve all IP addresses
to a hostname.
Use Advanced API – When checked, X-NetStat
will display the process / EXE behind each
connection in the Connection Table.
Cache DNS – Stores the results of an IP to
hostname lookup for future reference. Speeds
up the application.
Edit DNS Cache
Opens the DNS Cache in Notepad for
manual editing.
Clear DNS Cache
Clears the cache and looks up every IP
address from scratch.
Show X-NetStat Tips – Displays helpful tips
and hints on how to use X-NetStat when the
program starts.
Start in system tray – When checked, XNetStat will start minimized to the system tray.
Check for X-NetStat Updates – Checks Fresh
Software’s website on startup to make sure you
are running the latest version of X-NetStat.
Run X-NetStat at Windows startup – Loads XNetStat every time Windows starts.
Click Load Default Values link to revert to X-NetStat’s default
settings (the settings used on the first install)
X-NetStat Professional 5.3 User’s Manual – Page 15 of 38
Connection Table Options
Font – Picks the font face, the size, color and
style of the font used for the Connection Table.
Columns – Shows and hides columns in
X-NetStat’s main window.
HotTrack on Connection Table – When
checked, you can select a connection by
hovering your mouse over it.
Show grid lines – Separates information in the
Connection Table with lines for easier reading.
Show FilterBar – Turns the Filter Bar on or off.
When the Filter Bar is on, type into a text field at
the top of the connection table to show ONLY
connections that match that criteria.
You can use multiple filters by using a comma.
For example, to show .com addresses but hide
all .net addresses use:
.com, %.net
This option can also be toggled from the View
on the
menu, or by clicking the funnel icon
toolbar.
Show open UDP ports – Displays UDP
listening ports in the Connection Table.
Show open TCP ports – Displays TCP
connections with “Listening” status (AKA Open
Ports) in the Connection Table.
Show a port’s shortname when available –
Displays a “code” word (from the Port Database)
for local and remote ports instead of numbers.
If the port is not in the Port Database, only the
port number will be shown.
To display BOTH shortname and numbers, also
check Show Port Numbers with Shortnames
in the Extra Options section.
X-NetStat Professional 5.3 User’s Manual – Page 16 of 38
Friendly Names Editor
Here is where you can edit all of your
recognized friendly names.
See Also: Friendly Names
Rules Editor
This page displays all your rules and allows you
add, edit, and delete them. You can enable or
disable a rule by checking the box in the “On”
column.
See also: Rules
X-NetStat Professional 5.3 User’s Manual – Page 17 of 38
Programs Editor
This page lists all the external programs to be
shown under the Programs button on the
toolbar.
Click Add to add a new program/file to the list. A
window will appear asking for the location of the
file, folder, or URL and a name to give it.
When you click this item in the Programs
dropdown menu (shown above), the program,
file, or URL will launch.
ViewBar Options
Enable ViewBar – When checked, X-NetStat
shows the ViewBar by default.
Start Docked to – The initial dock location of
the ViewBar.
Autohide – Hides the ViewBar at the very top or
bottom unless the mouse is hovered over it.
Slide Effect – Animate the ViewBar when it is
changing position.
Blend Connections – An alternate style to
show the ViewBar in.
Show transmission lights – Shows
transmission LEDs, the same ones on the status
bar.
Show Clock – Displays the time on the
ViewBar.
Autoscroll connections – When checked,
each connection is shown for a specified time
and then the next connection is shown.
X-NetStat Professional 5.3 User’s Manual – Page 18 of 38
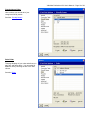
Remote Access Options
Enable X-NetStat Server – Turns the server on
or off.
Port to Use – The port on your computer that
the server will use. Port 11131 is default.
Include Net Stats – Include information from
the Net Stats window in the HTML report.
AutoRefresh – Includes a META Refresh tag
so the page is reloaded every few seconds.
Authentication required – Password protects
access to the X-NetStat server. You must know
the password in order to view the report.
URLs – Shows the URLs to access the XNetStat server.
See Also: Remote Access
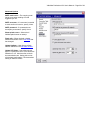
Logging Options
Log X-NetStat Activity – When checked,
certain activity in X-NetStat will be logged to a
file.
Record address and… -- What to include when
recording each activity.
See also: Logging
X-NetStat Professional 5.3 User’s Manual – Page 19 of 38
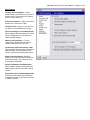
Packet Sniffer Options
Enable X-NetStat Packet Sniffer – Turns
on packet sniffing when checked so XNS
can calculate bandwidth usage for each
button
connection. Corresponds to the
Show total traffic in KiloBytes – When
checked, displays total traffic in KB instead
of bytes.
Display Bandwidth Meters – For each
connection, shows meteres that measure the
portion of total bandwidth used.
Enter in the maximum KB/s (KiloBytes per
second) for your upstream and downstream
connection.
You can choose from a preset of common
connection types, but this may not
accurately represent the bandwidth
capabilities of your connection.
To accurately figure out your connection
speeds, contact your network administrator
or Internet Service Provider, or click one of
the links to go to an online bandwidth speed
test.
See Also: The X-NetStat Packet Sniffer
X-NetStat Professional 5.3 User’s Manual – Page 20 of 38
Advanced Options
SMTP email server – The outgoing email
server to use when sending an email
triggered by a rule.
SMTP username – If a username is needed
to send email on this server, specify it here.
SMTP password – If a password must
accompany a username, specify it here.
Show splash screen – Shows the XNetStat splash screen on startup.
Flash cells – When checked, a border
flashes around each value in Net Stats that
has changed.
Update NetStats – How often to refresh
Network Statistics in the Net Stats window.
Update LED lights – How often to check
bytes in / bytes out to see if a LED should be
flashed on or off. Also how often to check
the transmission rate. Setting this too low
will decrease performance. Recommended
setting is 100ms to 500ms.
X-NetStat Professional 5.3 User’s Manual – Page 21 of 38
Extra Options
Old style toolbar highlight – Turns a
toolbar button’s text blue when the mouse is
hovered over it, much like the HotTracking
feature in XNS version 4.0.
Flat Column headers – Flattens the column
headers in the Connection Table.
Confirm on Exit – Asks you if you are sure
you want to exit X-NetStat when closing.
Check for changes in Local IP/Hostname
When enabled, XNS will update the Local IP
and Local Hostname on every refresh to
reflect potential changes.
Memory Leak protection – For beta
versions only, checking this will make XNetStat restart itself every 24 hours.
Continuously repaint Connection Table
When checked, the Connection Table will be
repainted every second instead of every
refresh. Uncheck to increase performance.
Show Connection Events - Specifies
where you want “Events” (New Connection,
Closed Connection, etc) to show up when
the program is minimized.
Show Port Numbers with Shortnames
When enabled, turning on Shortnames will
display both the Port’s “code name” and its
number.
Don’t Warn when Terminating/Restarting
Checking this will disable the confirmation
message box when you decide to terminate
or restart a process.
X-NetStat Professional 5.3 User’s Manual – Page 22 of 38
ViewBar Access
The ViewBar is a small window that is dockable to the top or bottom of your screen, and displays your connections over
time. This handy feature allows you to keep an eye on your connections, but without having the main X-NetStat window
visible and taking up space. It has the same appearance and nature as the Windows taskbar, and the Microsoft Office
"Shortcut Bar". Other windows will adjust around it, so it will always be visible.
Turning on the ViewBar
The ViewBar is disabled by default. To turn it on, click the View menu and check Show ViewBar.
After this, a small bar will appear on the bottom of your screen and the surrounding windows should adjust around it.
The ViewBar
1
2
3
4
5
1) XNS Button – If you click this button, it will bring up a menu to toggle the options related to the ViewBar. You can
also close the ViewBar and exit XNS from here.
2) Connection display – Here is where the connections are displayed one at a time. If "Scroll connections" is
enabled, new connections will automatically be displayed after a certain interval. If the Scroll connections feature
is not enabled, you must manually advance to the next connection (see #3). By right-clicking on a displayed
connection, you can copy it's information to the clipboard.
Connection “Events”, like New and Closed connection messages will also flash here.
3) Next, Previous, Pause, Refresh buttons – By clicking the up and down arrows, you can manually browse
through your current connection list. Clicking the Pause button will stop Auto-Scrolling connections. Clicking the
Refresh button forces a refresh of active connections, and should be done every so often if you do not have
AutoRefresh enabled.
4) Transmission LEDs – Transmission LEDs will light up in response to network activity.
5) System clock – Shows your current time. Double-click to copy it to the clipboard.
X-NetStat Professional 5.3 User’s Manual – Page 23 of 38
Tray Access
X-NetStat minimizes to the system tray for easy access.
Click the Tray button to send X-NetStat to the system tray. You can also simple minimize X-NetStat.
X-NetStat’s Tray icon.
Hover your mouse over the icon
to display X-NetStat’s status.
Right-Click the tray icon to display the system menu.
Double-Click the icon to restore X-NetStat.
X-NetStat Professional 5.3 User’s Manual – Page 24 of 38
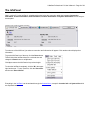
Remote Access
X-NetStat features a built-in web server that lets you view your connections from any web browser.
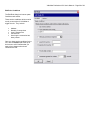
Remote Access Options
Enable X-NetStat Server – Turns the server on
or off.
Port to Use – The port on your computer that
the server will use.
Include Net Stats – Include information from
the Net Stats window in the HTML report.
AutoRefresh – Includes a META Refresh tag
so the page is reloaded every few seconds.
Authentication required – Password protects
access to the X-NetStat server. You must know
the password in order to view the report.
URLs – Shows the URLs to access the
X-NetStat server. Note that the top URL shows
the NetBIOS name and will only be accessible
from Microsoft-based networks.
When running, the X-NetStat server will stay in the background. You can see the server status on the status bar.
When someone makes a request to the XNS Server, it will appear in the leftmost panel of the status bar (The main status
text). The status of the server can also be seen by looking at the server icon.
Server is OFF
Server is ON
Server is BUSY
When the server is OFF, double-click the server icon to start it.
When the server is ON, double-click the server to see the Server status window.
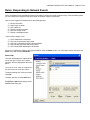
X-NetStat Professional 5.3 User’s Manual – Page 25 of 38
XNS Server Status Window
Server activity is logged in this window. A GET
message means someone has tried to connect
to the server. A subsequent >> Sent message
means the user was authorized and the report
was sent.
To close the window, hit ESC or close with the X
button. If you want to stop the server, click Stop
Server.
To show the current report, click Show Report.
Someone who successfully accesses the server will see a report like this.
X-NetStat Professional 5.3 User’s Manual – Page 26 of 38
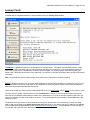
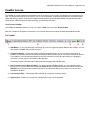
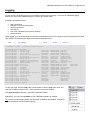
Logging
You don’t have to be sitting in front of your computer to catch every connection. If you turn on X-NetStat’s logging
features, you can record X-NetStat activity to a text file and review it later.
X-NetStat can log these events:
•
•
•
•
•
•
New Connections
Changes in connection state/status
Closing connections
Rule activity
Use of the X-NetStat server (Remote Access)
Connection Kills
When logging, you can choose whether to include a timestamp for the event, the ports involved, and the process involved.
Here is what a X-NetStat log file might look like with all these options on:
[
Time
] [
Log message
]
[
Ports
]
[
Status
]
[
Process
]
-- X-NetStat log file -- created 4/30/2004 8:02:29 PM
[8:02:29
[8:02:33
[8:02:33
[8:02:33
[8:02:33
[8:02:33
[8:02:33
[8:02:33
[8:02:33
[8:02:34
[8:02:59
[8:02:59
[8:02:59
[8:07:02
[8:07:02
[8:07:02
[8:07:02
[8:07:02
[8:07:02
[8:07:08
[8:07:21
[8:07:21
[8:07:29
[8:07:29
[8:07:31
PM]
PM]
PM]
PM]
PM]
PM]
PM]
PM]
PM]
PM]
PM]
PM]
PM]
PM]
PM]
PM]
PM]
PM]
PM]
PM]
PM]
PM]
PM]
PM]
PM]
Started Recording
New
: 205.188.12.127
New
: 205.188.6.143
New
: 218.78.211.62
New
: host207105075031.borland.com
New
: 207.105.83.51
New
: aba23.neoplus.adsl.tpnet.pl
New
: 218.68.224.146
New
: pool80183.interbusiness.it
New
: pD9E49117.dip.t-dialin.net
New
: moscow.uwec.edu
Change: 80.13.40.17
Change: 80.15.148.16
New
: localhost
New
: localhost
New
: 205.188.12.127
New
: 205.188.6.143
New
: host207105075031.borland.com
New
: 207.105.83.51
New
: 216.200.111.181
Closed: i8.cnn.net
Closed: i8.cnn.net
Closed: 80.8.55.221
Closed: 217.5.28.163
X-NetStat shutdown
<3032/5190>
<3040/5190>
<3149/4661>
<3262/80>
<3263/80>
<3436/4662>
<3437/80>
<3439/4662>
<3441/4662>
<3001/3633>
<3548/4662>
<3559/4660>
<3813/3814>
<3814/3813>
<3032/5190>
<3040/5190>
<3262/80>
<3263/80>
<3848/443>
<3833/80>
<3832/80>
<3851/4662>
<3850/4661>
(Established) [aim.exe]
(Established) [aim.exe]
(Established) [emule.exe]
(Close wait) [delphi32.exe]
(Close wait) [delphi32.exe]
(Time wait)
[System Process]
(Time wait)
[System Process]
(Closing)
[emule.exe]
(Time wait)
[System Process]
(Established) [alg.exe]
(Established->Fin wait1)
[emule.exe]
(Established->Fin wait1)
[emule.exe]
(Established) [mozilla.exe]
(Established) [mozilla.exe]
(Established) [aim.exe]
(Established) [aim.exe]
(Close wait) [delphi32.exe]
(Close wait) [delphi32.exe]
(Established) [mozilla.exe]
[mozilla.exe]
[mozilla.exe]
[emule.exe]
[emule.exe]
To view your Logs, click the Logs button on the toolbar or click the Logs main menu, and
then click the date you want to view. The log file will be opened in Notepad.
Click Show all Logs to open the Logs folder in Windows Explorer.
Alternatively, you can click Log Viewer to use X-NetStat’s internal Log manager.
TIP: Turning on many logging options can slow down X-NetStat’s performance, especially if
there is a significant amount of network activity.
X-NetStat Professional 5.3 User’s Manual – Page 27 of 38
Rules: Responding to Network Events
One of X-NetStat’s most outstanding features is the ability to respond to certain network activity. With the Rules system,
you can configure the program to act upon certain incoming & outgoing connections.
Once a rule is triggered, X-NetStat can do the following things:
1)
2)
3)
4)
5)
6)
Kill the connection
Notify users via email
Play a WAV file
Launch a script or program
Start the Lookup Tools
Display a message window
Criteria used to trigger a rule:
1)
2)
3)
4)
5)
The IP addresses or hostname
The local & remote ports being used
How many connections from the remote address
How long the connection has been present
The Process EXE facilitating the connection
All rules in X-NetStat are shown in the Options window, under the Rules section. You can jump to this by clicking on the
Rules menu and choosing Edit Rules…
Rules Editor
The rules are displayed in a table like the
one on the right. Click a rule to read a
summary, which is displayed at the lower
panel.
To turn a on or off, check or uncheck the
box next to the rule in the On column.
To edit an existing rule, select a rule and
click Edit.
To add a new rule, click the Add button.
Both Edit and Add buttons brings up the
Add/Edit Rule dialog box.
X-NetStat Professional 5.3 User’s Manual – Page 28 of 38
Edit Rule: Conditions
The Edit Rule dialog box has two parts:
Conditions and actions.
These are the conditions which must be
met by a connection for X-NetStat to
trigger the rule. They include:
•
•
•
•
•
Address
Number of connections
Local / Remote Port
Process EXE
How long the connection has
been present
Once you have set the conditions for the
rule, click the Actions tab at the top of
the screen to tell X-NetStat what you
want to have happen when those
conditions are met.
X-NetStat Professional 5.3 User’s Manual – Page 29 of 38
Edit Rule: Actions
When your conditions are met, X-NetStat can
perform several actions:
•
•
•
•
•
•
•
Execute a program or file
Play a WAV file in the background
Open a web page (URL)
Kill the connection
Start Lookup Tools
Pop-up Message Alert
Send email
To send email to multiple addresses,
separate the addresses with a semicolon ;
Pop-up Message Alerts will not be displayed
when X-NetStat is minimized. Instead, the
system tray icon will blink.
Message Alert window
This window is displayed when either you specify an alert to pop up,
or by right-clicking a connection and choosing View Alert.
The window shows the Alert message, what connection met what
rule, and the actions automatically taken by X-NetStat.
If you want to stop seeing Alert windows pop up, check Ignore rule
this session. The rule will no longer be active until you restart the
program.
If you want to turn off the rule completely, check Disable this rule
completely.
At the bottom of the window are three buttons:
OK – Close the window
Edit Rule – Opens the Edit Rule Dialog box
Actions – Provides a menu of additional actions to perform
Click the Left/Right arrows to scroll through your current Alerts.
X-NetStat Professional 5.3 User’s Manual – Page 30 of 38
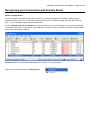
Recognizing your Connections with Friendly Names
What’s a Friendly Name?
If you’re running a busy network, there may be a whole lot of connections displayed in X-NetStat, making it hard to
ascertain what each one is for. It’s your job to make sure that “good” connections are getting through, and “bad” ones
aren’t. You can simplify this job by using Friendly Names.
Say that ultrabank.com (216.138.240.196) is a business partner of your firm and connects to your network occasionally
for transaction processing. This would be a great address to recognize so that it is marked as a friendly, human-readable
name when it shows up in X-NetStat.
Ultrabank.com is a business partner that frequents our network. Let’s recognize them.
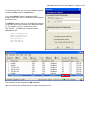
Right click the connection and choose Recognize as.
X-NetStat Professional 5.3 User’s Manual – Page 31 of 38
For each friendly name, you can have X-NetStat recognize
on either an exact match or a partial match.
If you choose EXACT match, X-NetStat will ONLY
recognize when either the IP or Hostname exactly matches
the friendly name.
For PARTIAL matches (see right), X-NetStat will recognize
a connection even when a portion of the addresses match
up. For example, by using “.ultrabank.com” and
“216.138.240.” , X-NetStat will recognize all these
addresses as “UB”:
node1.ultrabank.com
node2.ultrabank.com
www.ultrabank.com
216.138.240.10
216.138.240.23
216.138.240.255
This connection is now recognized as UB (Ultrabank).
Other connections that X-NetStat doesn’t recognize are shown as ???
X-NetStat Professional 5.3 User’s Manual – Page 32 of 38
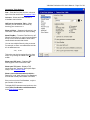
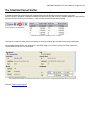
Net Stats: Your Network Statistics
The Network Statistics window displays
information on your network interface and
statistics for the IP, ICMP, TCP/IP and UDP
protocols.
If more than one interface is detected, you can
view the them by clicking the dropdown arrow
next to the adapter name (see Red Box)
Accessing Network Statistics
You can view Network Statistics 4 ways:
1) Click the Net Stats button on the toolbar
2) Click Network Statistics on the Tools menu
3) Double-click the LEDs in the status bar
X-NetStat Professional 5.3 User’s Manual – Page 33 of 38
The X-NetStat Packet Sniffer
X-NetStat Professional comes with a built in packet sniffer that can double the program’s power in one click.
When the Sniffer is activated, X-NetStat will monitor the data coming in and out of your network adapter so it can calculate
the bytes coming in and out per connection. It will even tell you how fast the data is flowing!
Click to activate the X-NetStat Sniffer.
X-NetStat will calculate the data flow for every connection.
This feature is perfect for telling which connections are actively pumping data, and which ones are just sitting idle.
The X-NetStat Packet Sniffer may increase your total CPU usage, so if you are running on a slower system it is
recommended to only turn it on as needed.
The X-NetStat Packet Sniffer can display bandwidth meters to show the portion of total available bandwidth used per connection.
See Also: Packet Sniffer Options
X-NetStat Professional 5.3 User’s Manual – Page 34 of 38
Other X-NetStat Tools
X-NetStat has other tools you can access from the Tools menu.
Google Search: You can do a Google Search any time by hitting Ctrl-G and typing in your query.
Get External IP Address: If you are behind a NAT or internal network setup, your External IP – the one the outside
world sees – may not be obvious. Click this will contact Fresh Software’s server and report back to you your external IP.
Banish Hostname: This feature adds an entry to your HOSTS file that makes a hostname resolve to 0.0.0.0, preventing
any outgoing connections to be made.
Nuke Connections: Attempts to kill EVERY established connection.
RWHOIS: RWHOIS extends and enhances the WHOIS concept in a hierarchical and scalable fashion. It focuses on the
distribution of "network objects"--the data representing Internet resources or people--and uses the inherently hierarchical
nature of these network objects (domain names, Internet Protocol (IP) networks, email addresses) to more accurately
discover the requested information. See Also: About RWHOIS
Find Files: Opens the Windows Find Files dialog.
Find Computer: Opens the Windows Find Computer dialog.
Run: Opens the Windows Run dialog.
Shut Down: Opens the Windows Shut Down/Restart/Log Off/Standby dialog.
X-NetStat Professional 5.3 User’s Manual – Page 35 of 38
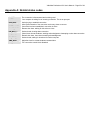
Appendix A: Netstat status codes
CLOSED
LISTEN
SYN_SENT
SYN_RECEIVED
ESTABLISHED
CLOSE_WAIT
FIN_WAIT_1
CLOSING
LAST_ACK
FIN_WAIT_2
TIME_WAIT
TCB_DISCARD
The connection is disconnected and not being used
Your computer is waiting for an incoming connection. This is an open port.
Actively trying to establish connection
Initial synchronization of the connection under way, about to connect
Connection has been established, connection is active
Remote shut down: waiting for the socket to close
Socket closed, shutting down connection
Closed, then remote shutdown: awaiting acknowledgement. Attempting to shut down connection
Remote shut down, then closed: awaiting acknowledgement
Socket closed, waiting for shutdown from other computer
Wait after close for remote shutdown retransmission
TCP connection control block discarded
X-NetStat Professional 5.3 User’s Manual – Page 36 of 38
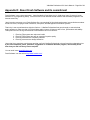
Appendix B: WHOIS Servers
Note: Click on the globe icon to visit the web gateway for each WHOIS server.
For a really handy Web-based WHOIS gateway, check out allwhois.com
Type of query
Server to use
Example query
.com, .org, .net Domain name
whois.networksolutions.com
powder.com
Government .gov
nic.gov
fbi.gov
Military .mil
whois.nic.mil
usace.army.mil
IP address (USA)
arin.net
172.206.65.182
IP address (Europe)
ripe.net
80.170.35.191
IP address (Asia/Pacific)
apnic.net
203.99.65.227
IP address (Latin America)
lacnic.net
200.47.53.10
Other country (.uk, .de, etc)
nic.xxx (where xxx is the country
code or domain suffix)*
amiga.de
* Note: See the file whoislist.dat in the X-NetStat directory for a list of international WHOIS servers
X-NetStat Professional 5.3 User’s Manual – Page 37 of 38
Appendix C: IP Addresses & Hostnames
An IP (Internet Protocol) address is a numerical sequence that uniquely identify a computer, or other networked device,
on a network such as the Internet. To be able to use the Internet, your computer needs an IP address so that network
traffic can be directed to and from it.
When you log on to the Internet, your Internet Service Provider (ISP) typically assigns you an IP address for your current
session. If you use a dial-up, you usually receive a different address each time you connect. If you connect to the Internet
from a local-area network, like you might at work, or through a cable modem or DSL line, you might have an IP address
permanently assigned to your computer.
Anytime you send an e-mail, access a Web page, or try to send or gather other information to or from the Internet, your
Internet application communicates with a server via its IP address. IP addresses are usually formatted by means of four
numbers from 0 to 255, separated by dots. A typical IP address might be "209.94.162.45".
Since it is difficult to remember arbitrary strings of numbers, and an IP address for a given computer can frequently
change, textual "hostnames" are used in place of numeric addresses. Hostnames are used to make addresses easier to
remember, and to continue to identify a specific computer even when its IP address changes. DNS (Domain Name
System) is the Internet function that provides "hostname resolution", which translates textual hostnames into numeric IP
addresses.
The Domain Name System is what enables you to type in names (such as "www.freshsw.com") instead of numerical IP
addresses. When DNS translates hostnames into their numerical counterpart, the process is usually transparent to the
end user. When an Internet application encounters a textual hostname, it sends a request to a DNS server. The DNS
server will then respond with the IP address associated with the textual hostname, or it will signal an error if it cannot find
an associated address.
For more information: The In’s and Out’s of DNS
X-NetStat Professional 5.3 User’s Manual – Page 38 of 38
Appendix D: About Fresh Software and its commitment
Fresh Software is not a giant corporation. It was founded by Drew Niese (me) in 1998 when I was 15 years old, as an
extension of my programming hobby. Since that time FS has released several freeware and shareware programs to the
Internet community.
I don’t have the resources to run Fresh Software like a conventional full-time business because I am enrolled as a student
at UW-Eau Claire, studying a blend of Business, Computers, and Management Information Systems.
That’s why I want my software done right the first time. X-NetStat Professional has gone through an extensive beta
testing program to make sure that it is of the highest quality in terms of features, ease of use, performance and stability.
That’s part of the four driving commitments Fresh Software has to its customers:
1.
2.
3.
4.
Ensuring FS programs are unique and useful
Ensuring FS programs are easy to use and of superior quality
Ensuring customers are completely satisfied
Ensuring customers are always listened to
I hope that I have met these commitments and that you find X-NetStat Professional to be well worth the registration price.
If you have complaints, praise, questions, suggestions or comments about the program, I would really like to
hear from you and I will do my best to respond.
You can email me at [email protected].
Fresh Software is on the web at http://www.freshsw.com/