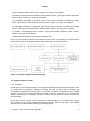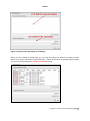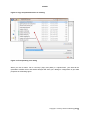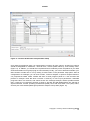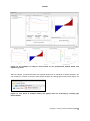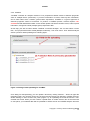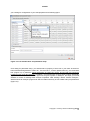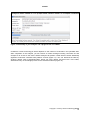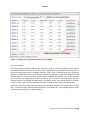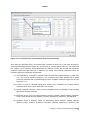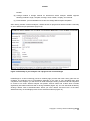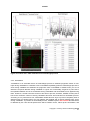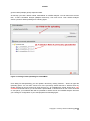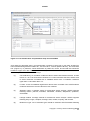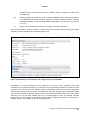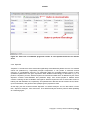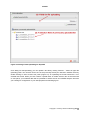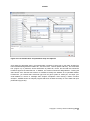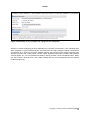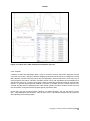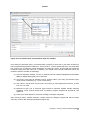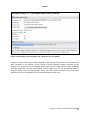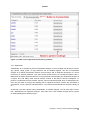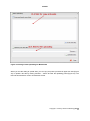
1
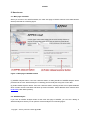
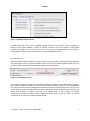
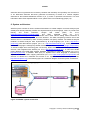
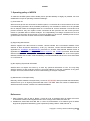
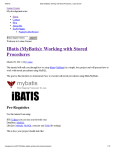
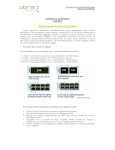
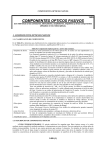
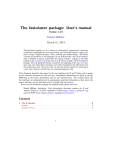
APPEX user manual APPEX User Manual Version 1.0 APPEX Contents 1. Introduction ....................................................................................................................................... 3 2. How to use ......................................................................................................................................... 5 2.1. Main page of APPEX ................................................................................................................ 5 2.2. APPEX analyzer........................................................................................................................ 5 (1) Main menu button................................................................................................................ 6 (2) Connection ID ...................................................................................................................... 7 (3) Analysis history.................................................................................................................... 8 (4) Supporting analysis methods .............................................................................................. 8 2.3. Analysis methods in detail ........................................................................................................ 9 2.3.1. CoxSingle ....................................................................................................................... 9 2.3.2. CoxMulti ........................................................................................................................ 14 2.3.3. IntransSingle ................................................................................................................. 17 2.3.4. IntransMulti ................................................................................................................... 21 2.3.5. SuperPC ....................................................................................................................... 25 2.3.6. TimeRoc........................................................................................................................ 29 2.3.7. Multivariate ................................................................................................................... 33 2.3.8. Public datasets ............................................................................................................. 38 3. Applicable data format ................................................................................................................... 39 3.1. column-oriented dataset ......................................................................................................... 39 3.2. row-oriented dataset ............................................................................................................... 40 4. Stored public datasets .................................................................................................................... 41 5. Supporting analysis methods ........................................................................................................ 41 5.1. Cox proportional hazard model............................................................................................... 41 5.2. In-trans correlation approach .................................................................................................. 42 5.3. Super PC ................................................................................................................................ 43 5.4. Time dependent ROC curves ................................................................................................. 43 6. System architecture ........................................................................................................................ 44 7. Operating policy of APPEX ............................................................................................................ 45 References ........................................................................................................................................... 45 Copyright 2015 by Genome Institute @ KRIBB 2 APPEX APPEX: Analysis Platform for identification of Prognostic gene EXpression signature in cancer 1. Introduction Identification of robust molecular signature to predict cancer patients’ outcome is profoundly important, since cancer patients have heterogeneous clinical courses even if they have similar clinicopathological characteristics. By using prognostic molecular signature, cancer patients can be treated more effectively. As an example, Oncotype DX breast cancer assay is now performed in the clinic to predict clinical behavior of a breast cancer patient (1). Furthermore, developing molecular signatures to predict patient’s responses to treatment such as chemotherapy or radiotherapy is also important, because it can be used for the prediction of treatment effectiveness, selection of drugs, and preventing side effects. While many researchers have tried to develop robust prognostic and predictive signatures from genomics data (2-12), there is no suitable web-based analysis tool that supports researchers in their efforts of signature development. Currently, most researchers use either commercial programs such as SPSS or Matlab or open source scripting language like R for statistical analysis. For genome-wide analyses, several tools including BRB-arrayTools (Excel plugin) (13), TM4 (Java based standalone) (14), or GEPAS (Web based platform) (15) have been widely used. However, for many investigators, particularly, clinicians or oncologists, doing proper statistical analyses using publicly available tools can be a daunting task. Also, most genome-wide analysis tools are not equipped with tools for identifying prognosis signature by survival analysis. Here, we constructed APPEX web based software platform to help researchers in the efforts to identify prognostic or predictive molecular signatures from genomics data. APPEX was designed to be easy to use, flexible, and freely available for advanced statistical survival analyses. APPEX is a web-based platform to perform survival analysis, particularly, to support identifying molecular signatures significantly associated with cancer patients’ outcome. APPEX provides various analysis methods to discover genes or any other molecules associated with survival of cancer patients. Currently, APPEX supports seven analyses including Cox proportional hazard model (for single molecule and multiple molecules) (16), Super-PC (17), in-trans correlation analysis (for single molecule and multiple molecules) (7, 18), Time-dependent ROC analysis(19), and Multivariate Cox regression analysis (16). Although major data type of APPEX is the gene expression intensity obtained from cancer patients and their follow-up times, APPEX is also applicable for any other continuous numeric signal intensities with time-to-event information. APPEX is mainly designed for clinicians and oncologists who investigate cancer behaviors and are interested in discovering prognostic or predictive signatures. A user-friendly graphical interface similar to desktop application is provided, so users can easily handle their own data on the APPEX even if they are not familiar with statistical analysis packages such as SPSS or R. APPEX serves various charts and figures as well as downloadable data tables which include information of significant Copyright 2015 by Genome Institute @ KRIBB 3 APPEX molecules associated with survival in each analysis. To serve diverse users from the one who wants to estimate prognostic value of a single factor to others who want to find a set of molecules associated with survival, APPEX supports easy and useful approaches such as a simple copy/paste approach for single factor analysis and a data file uploading with configuration for multiple factors identification. We defined the two easy and flexible data formats on APPEX, column-oriented and roworiented tab-delimited text data. Furthermore, as to user’s personal information, APPEX does not operate user-logging system and does not require any user information except for e-mail address to instantly alert the user after completing time consuming jobs. Instead, APPEX just uses “connection ID” which automatically generated when the user accesses to APPEX. Using auto-generated connection ID, user can always perform an analysis, access the previous analysis results, or remove their analysis histories. The user is responsible for the management of his/her own connection ID. APPEX has no responsibility for it. In summary, APPEX is the best choice when you try to discover significant novel factors to predict clinical behavior of cancer patients from a data of continuous numeric intensities with follow-up time information of cancer patients. Copyright 2015 by Genome Institute @ KRIBB 4 APPEX 2. How to use 2.1. Main page of APPEX When you access to the APPEX website, the main web page of APPEX with two executable buttons will be presented as a following figure: Figure 1. Main page of APPEX website (1) APPEX analyzer button: If the user clicks this button, a dialog interface of APPEX analyzer will be presented to the user. APPEX analyzer is a starting point for analyses using user’s own data. (2) Public dataset explorer button: If the user clicks this button, a dialog shows a list of public datasets which contain numeric intensities and follow-up time information. Public datasets were collected from NCBI GEO public data repository. 2.2. APPEX analyzer If you click an APPEX analyzer button at the main web page of APPEX, you can see a dialog of APPEX analyzer at which you can perform survival analyses as a following figure: Copyright 2015 by Genome Institute @ KRIBB 5 APPEX Figure 2. APPEX analyzer (1) Main menu button To perform an analysis at the APPEX analyzer, users should choose one of the analysis methods which APPEX supports. If you click a main menu button, the following menu list will be shown. Copyright 2015 by Genome Institute @ KRIBB 6 APPEX Figure 3. APPEX selective menu As shown in Figure 3, the menu on APPEX analyzer consists of a sub-menu of seven analyses, a button to open public datasets, a button to change connection ID, and a button to quit APPEX analyzer. By clicking one of the lists in the menu, you can carry out analysis with your own data or public dataset, change current connection ID, or terminate APPEX analyzer. (2) Connection ID APPEX manages multiple sessions of users using connection ID which is automatically generated by the system when a user accesses to APPEX. When you access to APPEX website at first time, you will get an initial connection ID at an APPEX analyzer as following figure: Figure 4. Connection ID field If you perform analyses several times, all analysis results are stored on the APPEX server based on the current connection ID. When you want to access previous analysis results, you should remember the connection ID at the time of analysis and replace connection ID to the previous one. Then you can access previous analysis histories at the left panel of APPEX analyzer. To change connection ID, you should click a button of “Change connection ID” at APPEX menu or click a button of “Change connection ID” located at upper toolbar of APPEX analyzer. When you click a button to change connection ID, you can see a following dialog window: Copyright 2015 by Genome Institute @ KRIBB 7 APPEX Figure 5. Connection ID setup dialog A connection ID at upper part is current ID. If you have a connection ID which was used at previous analysis, then you can insert it to a text edit field at lower part of the dialog. Then APPEX analyzer will show analysis history tree which contains your previous analysis results. (3) Analysis history To log history of user’s analysis and support future access after time-consuming survival analysis, APPEX maintains analysis histories based on connection ID for a limited duration. Within that time, users can freely access their own previous analysis results or remove histories. The maintaining duration for analysis history is two months. A tree menu of analysis history is located at a left panel of APPEX Analyzer. It consists of two folders, the one to hold analysis results and the other to contain uploaded data which were uploaded by user. Figure 6. Tree panel of analysis history (4) Supporting analysis methods Currently, APPEX supports seven survival analyses to detect significant signatures. It also provides analysis results of public datasets. We define short term of each analysis as followings: 1) CoxSingle: Cox proportional hazard model to estimate prognostic value of single factor 2) CoxMulti: Cox proportional hazard model to estimate prognostic value of multiple factors. Typical Copyright 2015 by Genome Institute @ KRIBB 8 APPEX genome-wide expression matrix (column: sample; row: gene) can be applied. 3) SuperPC: Semi-supervised methods to predict patient survival. Typical genome-wide expression matrix (column: sample; row: gene) can be applied. 4) IntransSingle: Estimation of prognostic value using in-trans molecules correlated with single factor. Typical genome-wide expression matrix (column: sample; row: gene) can be applied. 5) IntransMulti: Estimation of prognostic value using in-trans molecules correlated with multiple factors. Typical genome-wide expression matrix (column: sample; row: gene) can be applied. 6) TimeRoc: Time-dependent ROC analysis. Typical genome-wide expression matrix (column: sample; row: gene) can be applied. 7) Multivariate: Multivariate Cox proportional hazard model. How to use each analysis method is described at the next section. The following is a typical analysis flow of APPEX system. All analysis methods were constructed as a following scheme: Figure 7. Schematic diagram of APPEX analyzer 2.3. Analysis methods in detail 2.3.1. CoxSingle CoxSingle is a survival analysis based on Cox proportional hazard model to estimate prognostic value of a single factor (a molecule). CoxSingle is a simple, fast, and very useful way for clinicians and oncologists to estimate the prognostic value of a molecule. To perform a CoxSingle process, APPEX requires column-oriented and tab-delimited text data. Users can insert data by just copying and pasting in the website or uploading a file which contains numeric intensities, censor, and follow-up time information. At first step, just click a button named “CoxSingle” on APPEX analyzer. You can also select a menu item, “Simple Cox proportional hazard model (Single molecule)”, from the main menu. Then APPEX analyzer shows a panel for data uploading as a following figure: Copyright 2015 by Genome Institute @ KRIBB 9 APPEX Figure 8. Dialog of data uploading for CoxSingle When you see a dialog to upload data, you can copy and paste your data at the upper text area (Figure 9) or upload a text file by clicking “Browse…” button at the lower file uploading panel (Figure 10). The text format should be a column-oriented text format. Copyright 2015 by Genome Institute @ KRIBB 10 APPEX Figure 9. Copy and pasted text area on a dialog Figure 10. File uploading on a dialog When you click a button “Go to next step” (Copy and paste) or “Upload Data”, your data will be uploaded to APPEX server and APPEX analyzer will show you a dialog for configuration of your data properties as a following figure: Copyright 2015 by Genome Institute @ KRIBB 11 APPEX Figure 11. Column identification and parameter setup On a dialog for parameter setup, you should select a property for each column. At least four columns should be designated as “Patient ID”, “Survival Time”, “Censor (death:1/alive:0)”, and “Intensity value” (Figure 11). In addition, you should select a patient division method by which the patients in your data would be divided into two groups (high or low intensities). Finally, you have to determine whether your data contains a header line or not by clicking a check button on the parameter setup panel. After all configurations of CoxSingle, you can click a button, “Perform analysis!” to perform analysis based on cox proportional hazard model. APPEX will show a small progress panel for a few seconds and present an analysis result tab which includes a summary of user’s input parameters, estimated prognostic value of a molecule, and various charts. On CoxSingle analysis, APPEX provides hazard ratio, p-value by cox regression analysis, p-value by log-rank test with Kaplan-Meier plot, bar-plot of signal intensities, receiver operating characteristic (ROC) curve with area under curve (AUC) value, and box plot of two divided patient groups with two sample t-test p-value (Figure 12). Copyright 2015 by Genome Institute @ KRIBB 12 APPEX Figure 12. An example of analysis result based on Cox proportional hazard model and supporting charts After an analysis, you will find its item from analysis history tree on left panel of APPEX analyzer. You can access to it in future or remove it from APPEX analyzer by clicking right mouse button (Figure 13). Figure 13. Tree panel of analysis history and popup menu for removing by clicking right mouse button Copyright 2015 by Genome Institute @ KRIBB 13 APPEX 2.3.2. CoxMulti “CoxMulti” indicates an analysis method of Cox proportional hazard model to estimate prognostic value of multiple factors (molecules). If you have information of censor, follow-up time information, and a data matrix which contains genome-wide expressions, CoxMulti is a typical approach to estimate prognostic values of molecules. To perform a CoxMulti process, APPEX requires roworiented and tab-delimited text data. A user should upload a file which contains censor, follow-up time information, and genome-wide (multiple genes) expression data. At first step, just click a button named “CoxMulti” on APPEX analyzer. You can also select a menu item, “Cox proportional hazard model (Multiple molecules)”, from main menu. Then APPEX analyzer shows a panel for data uploading as a following figure: Figure 14. Dialog of data uploading for CoxMulti On a dialog for data uploading, you can upload a text file by clicking “Browse…” button at upper file uploading panel. You can also choose one of the previously stored your data list in APPEX server by double clicking an item at lower tree panel (Figure 14). An uploading file format should be a roworiented text format. When you click a button “Upload Data” or double click an item of the stored list on tree panel, your selected data will be uploaded to APPEX server and APPEX analyzer will show Copyright 2015 by Genome Institute @ KRIBB 14 APPEX you a dialog for configuration of your data properties as a following figure: Figure 15. Line identification and parameter setup On a dialog for parameter setup, you should select a property of each row in your data. At least four lines should be designated as “Patient ID”, “Survival Time”, “Censor (death:1/alive:0)”, and “Data start line” (Figure 15). In particular, clinical information of patient ID, censor, and survival time should be located at upper than data start line. In addition, you should insert cut-off p-value to select statistically significant molecules, select molecule type such as gene symbol or refSeq ID, and input your email address to receive a message after analysis completion. After clicking a button “Perform analysis!”, APPEX shows an analysis progress tab which includes summary of user’s data and input parameters (Figure 16). Copyright 2015 by Genome Institute @ KRIBB 15 APPEX Figure 16. Summary of your analysis and a progress bar in CoxMulti CoxMulti is a time-consuming job which depends on the number of molecules in the uploaded data. After completion of the analysis, you will receive an email message including connection ID and analysis ID to access to the result. APPEX analyzer will present a table which includes statistically significant molecules correlated with patients’ survival (Figure 17). You can download its table by clicking a button “Click to download table”. When you click a button “Survival Curve” of the table, APPEX will carry out CoxSingle process for the selected molecule (Figure 12). Copyright 2015 by Genome Institute @ KRIBB 16 APPEX Figure 17. Table view of significant molecules by CoxMulti 2.3.3. IntransSingle The “IntransSingle” analysis estimates the prognostic value of a driving candidate (driver) and its associated molecules (effectors) in disease events. IntransSingle uses correlation based approach to select associated genes from a candidate molecule. Then, using a selected gene set (a prognostic signature), APPEX performs an unsupervised hierarchical clustering to divide total samples into two clusters based on numeric intensities. Finally, APPEX estimates a prognostic value of this signature using Log-rank test, Kaplan-Meier, and two-group box plots. To perform an IntransSingle process, APPEX requires row-oriented text data which is delimited by tab. User should upload a file which contains censor, follow-up time information, and genome-wide (multiple genes) expression data. At first step, just click a button named “IntransSingle” on APPEX analyzer. You can also select a menu item, “In-trans correlation analysis (Single molecule)”, from main menu. Then APPEX analyzer shows a panel for data uploading as a following figure: Copyright 2015 by Genome Institute @ KRIBB 17 APPEX Figure 18. Dialog of data uploading for IntranSingle On a dialog for data uploading, you can upload a text file by clicking “Browse…” button at upper file uploading panel. You can also choose one of the previously stored data list in APPEX server by double clicking an item at lower tree panel (Figure 18). An uploading file format should be a roworiented text format. When you click a button “Upload Data” or double click an item of the stored list on tree panel, your selected data will be uploaded to APPEX server and APPEX analyzer will show you a dialog for configuration of your data properties as a following figure: Copyright 2015 by Genome Institute @ KRIBB 18 APPEX Figure 18. Line identification and parameter setup for IntransSingle On a dialog for parameter setup, you should select a property of each row in your data. At least four lines should be designated as “Patient ID”, “Survival Time”, “Censor (death:1/alive:0)”, and “Data start line” (Figure 18). In particular, clinical information of patient ID, censor, and survival time should be located at upper than data start line. In addition, you should insert several parameters which are needed to perform intransSingle as followings: (1) Cor.coefficient (r): a correlation coefficient value to select associated molecules. A value from 0 to 1 as a cut-off should be inserted. If 0.4 is inserted at this field, APPEX tries to select molecules correlated with a candidate which have a correlation coefficient upper than 0.4 and lower than -0.4. (2) P-value: a level for statistical significance derived from correlation test. APPEX selects molecules which have a lower value than user inserted. (3) Driving candidate molecule: A name of driving candidate factor. An identifier in user uploaded data matrix should be inserted. (4) Molecular Id type: one of ID types should be selected. APPEX handles following identifiers: Gene symbol, Entrez Gene ID, RefSeq, Unigene, Affypetrix ID, Illumina ID, and Agilent ID. (5) Similarity metric: a similarity metric for hierarchical cluster analysis. APPEX supports following metrics: pearson, euclidean, manhattan, canberra, abspearson, spearman, and Copyright 2015 by Genome Institute @ KRIBB 19 APPEX kendall. (6) Linkage method: a linkage method for hierarchical cluster analysis. APPEX supports following methods: single, complete, average, ward, median, mcquitty, and centroid. (7) Email address: your email address to receive a message after analysis completion. After clicking a button “Perform analysis!”, APPEX shows an progress tab which includes a summary of user’s data and input parameters (Figure 19). Figure 19. Summary of your analysis and a progress bar in IntransSingle IntransSingle is a time-consuming job but a relatively light process than other heavy jobs such as CoxMulti. The analysis time of IntransSingle depends on the size of your uploaded data. After completion of the analysis, you will receive an email message including connection ID and analysis ID to access to its result. APPEX analyzer will present several charts and a table which includes significantly associated molecules with a driving candidate (Figure 20). You can download its table by clicking a button “Click to download table”. When you click a button “Survival Curve” of the table, APPEX will carry out CoxSingle process for the selected molecule (Figure 12). Copyright 2015 by Genome Institute @ KRIBB 20 APPEX Figure 20. Charts and a table obtained from IntransSingle process 2.3.4. IntransMulti “IntransMuti” is an extended version of IntransSingle process to estimate prognostic values of userinput driving candidates in a disease event. IntransMulti repeatedly performs IntransSingle process in each driving candidate and estimates its prognostic value. IntransMulti is suitable when you do not determine a specific disease driving candidate in a gene set. Theoretically, all genes or probe IDs in the uploaded dataset can be set as disease driving candidates and IntransMulti can be applied using them. However, it needs enormous resources and time to process, therefore, APPEX currently sets a limit to the maximum number of driving candidates less than 200 molecules for IntranMulti process. According to our performance test, IntransMulti needed about 6 days to process completely when a dataset which had 28,000 genes and 100 patients was applied and all genes (28,000) were set as driving candidates. To perform an IntransMulti process, APPEX requires row-oriented text data which is delimited by tab. User should upload a file which contains censor, follow-up time information, and Copyright 2015 by Genome Institute @ KRIBB 21 APPEX genome-wide (multiple genes) expression data. At first step, just click a button named “IntransMulti” on APPEX analyzer. You can also select a menu item, “In-trans correlation analysis (Multiple molecules)”, from main menu. Then APPEX analyzer shows a panel for data uploading as a following figure: Figure 21. Dialog of data uploading for IntransMulti On a dialog for data uploading, you can upload a text file by clicking “Browse…” button at upper file uploading panel. You can also choose one of the previously stored data list in APPEX server by double clicking an item at lower tree panel (Figure 21). An uploading file format should be a roworiented text format. When you click a button “Upload Data” or double click an item of the stored list on tree panel, your selected data will be uploaded to APPEX server and APPEX analyzer will show you a dialog for configuration of your data properties as following figure: Copyright 2015 by Genome Institute @ KRIBB 22 APPEX Figure 21. Line identification and parameter setup for IntransMulti On a dialog for parameter setup, you should select a property of each row in your data. At least four lines should be designated as “Patient ID”, “Survival Time”, “Censor (death:1/alive:0)”, and “Data start line” (Figure 21). In particular, clinical information of patient ID, censor, and survival time should be located at upper than data start line. In addition, you should insert several parameters which are needed to perform IntransMulti as followings: (1) Cor.coefficient (r): a correlation coefficient value to select associated molecules. A value from 0 to 1 as a cut-off should be inserted. If 0.4 was inserted at this field, APPEX tries to select molecules correlated with a candidate which have a correlation coefficient upper than 0.4 and lower than -0.4. (2) P-value: a level for statistical significance derived from correlation test. APPEX selects molecules which have a lower value than user inserted. (3) Similarity metric: a similarity metric for hierarchical cluster analysis. APPEX supports following metrics: pearson, euclidean, manhattan, canberra, abspearson, spearman, and kendall. (4) Linkage method: a linkage method for hierarchical cluster analysis. APPEX supports following ways: single, complete, average, ward, median, mcquitty, and centroid. (5) Molecule Id type: one of molecule types should be selected. APPEX handles following Copyright 2015 by Genome Institute @ KRIBB 23 APPEX identifiers: Gene symbol, Entrez Gene ID, RefSeq, Unigene, Affypetrix ID, Illumina ID, and Agilent ID. (6) Driving candidate molecule list: A list of driving candidate factors. Identifiers existed in user uploaded data matrix should be inserted. Currently, maximum number of driving candidate identifiers is 200 and each identifier delimited by carriage return or new line (‘\r’ or ‘\n’). (7) Email: your email address to receive a message of analysis completion. After clicking a button “Perform analysis!”, APPEX shows an analysis progress tab which includes summary of user’s data and input parameters (Figure 22). Figure 22. Summary of your analysis and a progress bar in IntransMulti IntransMulti is a time-consuming job which depends on the size of your uploading data. After completion of your required analysis, you will receive an email message including connection ID and analysis ID to access to its result. APPEX analyzer will present a table which includes prognostic value and the number of in-trans genes correlated with each user-inputting driving candidate (Figure 23). You can download its table by clicking a button “Click to download table”. When you click a button “Survival Curve” of the table, APPEX will carry out IntransSingle process for selected molecule (Figure 20). In case of Figure 23, the table view was obtained when we inserted four genes (E2F1, S100A8, CCNB1, and FOXM1) as driving candidate genes. Copyright 2015 by Genome Institute @ KRIBB 24 APPEX Figure 23. Table view of estimated prognostic values of user-inputted molecules as disease driver 2.3.5. SuperPC “SuperPC” is a method to select molecules significantly associated with patient survival. This method carries out prediction by "supervised principal components". It can predict a censored survival outcome, or a quantitative outcome. It is especially useful for correlating patient survival or other quantitative parameters with gene expression data. Detailed methodology is described in (17). To perform a SuperPC process, APPEX requires row-oriented text data which is delimited by tab. Since SuperPC contains cross-validation and prediction steps, user should prepare a dataset which contains a training set and a validation set together. APPEX requires the user to select start column in training set and validation set, respectively. An uploaded user data also should contain censor, followup time information, and genome-wide (multiple genes) expression data. At first step, just click a button named “SuperPC” on APPEX analyzer. You can also select a menu item, “Super-PC analysis”, from main menu. Then APPEX analyzer shows a panel for data uploading as a following figure: Copyright 2015 by Genome Institute @ KRIBB 25 APPEX Figure 24. Dialog of data uploading for SuperPC On a dialog for data uploading, you can upload a text file by clicking “Browse…” button at upper file uploading panel. You can also choose one of the previously stored your data list in APPEX server by double clicking an item at lower tree panel (Figure 24). An uploading file format should be a roworiented text format. When you click a button “Upload Data” or double click an item of the stored list on tree panel, your selected data will be uploaded to APPEX server and APPEX analyzer will show you a dialog for configuration of your data properties as following figure: Copyright 2015 by Genome Institute @ KRIBB 26 APPEX Figure 25. Line identification and parameter setup for SuperPC On a dialog for parameter setup, you should select a property of each row in your data. At least four lines should be designated as “Patient ID”, “Survival Time”, “Censor (death:1/alive:0)”, and “Data start line” (Figure 15). In particular, clinical information of patient ID, censor, and survival time should be located at upper than data start line. In addition, two columns should be designated as “Training-set start column” and “Test-set start column” for APPEX to identify two datasets in an uploaded dataset. Furthermore, you should select molecule type such as gene symbol or refSeq ID, and input your email address to receive a message after analysis completion. After clicking a button “Perform analysis!”, APPEX shows an analysis progress tab which includes summary of user’s data and input parameters (Figure 26). Copyright 2015 by Genome Institute @ KRIBB 27 APPEX Figure 26. Summary of your analysis and a progress bar in SuperPC SuperPC is a time-consuming job which depends on the number of molecules in your uploading data. After completion of your required analysis, you will receive an email message including connection ID and analysis ID to access to its result. APPEX analyzer will present several charts produced while SuperPC process and a table which includes highly significant molecules correlated with patients’ survival (Figure 27). You can download its table by clicking a button “Click to download table”. When you click a button “Survival Curve” of the table, APPEX will carry out CoxSingle process for selected molecule (Figure 12). Copyright 2015 by Genome Institute @ KRIBB 28 APPEX Figure 27. Charts and a table obtained from SuperPC process 2.3.6. TimeRoc “TimeRoc” means time-dependent ROC curves for censored survival data and a diagnostic marker (19). ROC curves are a popular method for displaying sensitivity and specificity of a diagnostic marker. Many disease outcomes including cancer are time dependent, which means ROC curves may vary at several specific time points. TimeRoc calculates a ROC curve with sensitivities and specificities at a specific time point (e.g. 3 years or 36 months), and then estimates prognostic values for all molecules stored in a genome-wide expression dataset. To perform a TimeRoc process, APPEX requires roworiented text data which is delimited by tab. User should upload a file which contains censor, follow-up time information, and genome-wide (multiple genes) expression data. At first step, just click a button named “TimeRoc” on APPEX analyzer. You can also select a menu item, “Time-dependent ROC analysis”, from the main menu. Then APPEX analyzer shows a panel for data uploading as a following figure: Copyright 2015 by Genome Institute @ KRIBB 29 APPEX Figure 28. Dialog of data uploading for TimeRoc On a dialog for data uploading, you can upload a text file by clicking “Browse…” button at upper file uploading panel. You can also choose one of the previously stored your data list in APPEX server by double clicking an item at lower tree panel (Figure 28). An uploading file format should be a roworiented text format. When you click a button “Upload Data” or double click an item of the stored list on tree panel, your selected data will be uploaded to APPEX server and APPEX analyzer will show you a dialog for configuration of your data properties as following figure: Copyright 2015 by Genome Institute @ KRIBB 30 APPEX Figure 29. Line identification and parameter setup for TimeRoc On a dialog for parameter setup, you should select a property of each row in your data. At least four lines should be designated as “Patient ID”, “Survival Time”, “Censor (death:1/alive:0)”, and “Data start line” (Figure 29). In particular, clinical information of patient ID, censor, and survival time should be located at upper than data start line. In addition, you should insert several parameters which are needed to perform TimeRoc as followings: (1) Survival estimation method: a metric to estimate survival. Nearest Neighborhood Estmation (NNE) or Kaplan-Meier (KM) can be selected. (2) Time point: a time point to estimate survival. As time scale in your data, you should a proper value of time to estimate (e.g. 3 year or 46 months). (3) AUC value: a cut-off value of area under curve (AUC) to select significant molecules. A value from 0 to 1 is valid. (4) Molecule Id type: one of molecule types should be selected. APPEX handles following identifiers: Gene symbol, Entrez Gene ID, RefSeq, Unigene, Affypetrix ID, Illumina ID, and Agilent ID. (5) Email: your email address to receive a message of analysis completion. After clicking a button “Perform analysis!”, APPEX shows an analysis progress tab which includes summary of user’s data and input parameters (Figure 30). Copyright 2015 by Genome Institute @ KRIBB 31 APPEX Figure 30. Summary of your analysis and a progress bar in TimeRoc TimeRoc is a time-consuming job which depends on the number of molecules in the uploaded data. After completion of the analysis, you will receive an email message including connection ID and analysis ID to access to its result. APPEX analyzer will present a table which includes statistically significant molecules correlated with patients’ survival (Figure 31). You can download its table by clicking a button “Click to download table”. When you click a button “Survival Curve” of the table, APPEX will carry out CoxSingle process for selected molecule (Figure 12). Copyright 2015 by Genome Institute @ KRIBB 32 APPEX Figure 31. Table view of significant molecules by TimeRoc 2.3.7. Multivariate “Multivariate” is an analysis to perform multivariate analysis, in which multiple clinical factors such as age, gender, stage, grade, or drug treatment can be handled together. The aim of multivariate analysis is to identify association between clinical factors and to estimate robustness of a factor (molecule) for survival prediction even after several clinical factors are considered together with it. Multivariate in APPEX performs based on Cox proportional hazard model (16). Multivariate analysis is a simple, fast, and widely used survival analysis method in the field of clinical investigation. To perform a multivariate process, APPEX requires column-oriented text data which is delimited by tab. User can just insert by copying and pasting data or upload a file which contains the information of survival time, censor, and user interested factors. The values of interested factors should be binary (0 or 1. At first step, just click a button named “Multivariate” on APPEX analyzer. You can also select a menu item, “Multivariate Cox regression analysis”, from main menu. Then APPEX analyzer shows a panel for data uploading as a following figure: Copyright 2015 by Genome Institute @ KRIBB 33 APPEX Figure 32. Dialog of data uploading for Multivariate When you see the dialog to upload data, you can copy and paste your data at upper text area (Figure 33) or upload a text file by clicking “Browse…” button at lower file uploading panel (Figure 34). The text format should be a column-oriented text format. Copyright 2015 by Genome Institute @ KRIBB 34 APPEX Figure 33. Copy and pasted text area on a dialog Copyright 2015 by Genome Institute @ KRIBB 35 APPEX Figure 34. File uploading on a dialog When you click a button “Go to next step” (Copy and paste) or “Upload Data”, your inserted data will be uploaded to APPEX server and APPEX analyzer will show you a dialog for configuration of your data properties as following figure: Copyright 2015 by Genome Institute @ KRIBB 36 APPEX Figure 34. Column identification and parameter setup for multivariate analysis On a dialog for parameter setup, you should select a property of each column. At least three columns should be designated as “Survival Time”, “Censor (death:1/alive:0)”, and “Interest factor” (Figure 34). The number of columns of “Interest factor” can be set more than 1. In addition, you have to determine whether your data contains a header line or not by clicking a check button on parameter setup panel. After all configurations of Multivariate, you can click a button, “Perform analysis!” to perform a multivariate analysis based on cox proportional hazard model. APPEX will show a small progress panel for a few seconds and present an analysis result tab which includes summary of user’s input parameters and a result table of multivariate analysis. In this analysis, APPEX provides hazard ratio, 95% confidence interval (lower and upper values), and p-value by cox regression analysis of each estimated factor (Figure 35). You can download its table by clicking a button “Click to download table”. Copyright 2015 by Genome Institute @ KRIBB 37 APPEX Figure 35. An example of analysis result of multivariate analysis based on Cox proportional hazard model 2.3.8. Public datasets We have collected public datasets which contains numeric intensities and follow-up time information from NCBI GEO public data repository. You can select one of the datasets stored in APPEX database to perform a survival analysis on APPEX analyzer. To select and apply a dataset to an analysis, just click a button named “Public datasets” on APPEX analyzer. You can also select a menu item, “Open public datasets”, from main menu. Then APPEX analyzer shows a panel of public dataset list as a following figure: Copyright 2015 by Genome Institute @ KRIBB 38 APPEX Figure 36. Dialog of public dataset list On a dialog of public datasets, you can select one of the datasets and click a button “Perform analysis!” at the right column. Then APPEX will show a pop up menu in which you can choose an analysis method to perform. If you click one of the analysis methods, APPEX will load a dataset for a while and present a configuration dialog associated with a selected analysis method. To see configuration option and flow of each analysis, please refer to the previous section of each analysis. 3. Applicable data format To provide flexibility and easy access, APPEX defined two easy and flexible data formats: columnoriented and row-oriented datasets. APPEX analyzer handles two data formats to analyze and users should prepare their data as one of these formats before applying the data to APPEX. The user uploaded data file on APPEX should not be binary but a text type. 3.1. column-oriented dataset A text data formatted by column-oriented dataset contains a type of data list in each column. Columns should be delimited by tab (‘\t’) keyword. The number of columns is not limited, so users can upload data with any number of columns even if the data contains redundant columns. The column-oriented dataset is applicable at “CoxSingle” and “Multivariate” process on APPEX analyzer. To perform a CoxSingle process, at least four columns of the data should be designated as “Patient ID”, “Survival Time”, “Censor (death:1/alive:0)”, and “Intensity value”. For multivariate analysis, at least three columns should be designated as “Survival Time”, “Censor (death:1/alive:0)”, and “Interest factor”. Header line inclusion is up to user, since APPEX asks header inclusion while analyzing. A typical example of column-oriented dataset was illustrated at Figure 37. Copyright 2015 by Genome Institute @ KRIBB 39 APPEX Figure 37. An example of column-oriented dataset 3.2. row-oriented dataset A row-oriented dataset contains a type of data list in each line of the text. All columns should be delimited by tab (‘\t’) keyword and the first column should contain a title of each line. The row-oriented dataset is applicable at “CoxMulti”, “IntransSingle”, “IntransMulti”, “SuperPC”, and “TimeRoc” processes on APPEX analyzer. To perform each process, at least four lines should be designated as “Patient ID”, “Survival Time”, “Censor (death:1/alive:0)”, and “Data start line”. In particular, all clinical information such as patient ID, censor, and survival time should be located at upper part of the data than data start line. A typical example of row-oriented dataset was illustrated at Figure 38. Copyright 2015 by Genome Institute @ KRIBB 40 APPEX Figure 38. An example of row-oriented dataset 4. Stored public datasets To support users who wish to analyze previously published datasets to APPEX and find significant prognostic or predictive signature in cancers, we have collected public datasets which contains numeric intensities and patients’ follow-up time information from NCBI GEO, a public data repository. Currently, we have collected a total of 263 datasets from GEO and constructed a database to explore and analyze datasets on APPEX system. When a user chooses one of the datasets on APPEX dataset explorer and clicks an analysis method of the pop-up menu (Figure 36), APPEX analyzer will generate a file formatted by row-oriented dataset from a selected public dataset and apply it to an analysis method selected by the user. The generated file will be automatically saved at user storage area on APPEX which controlled by connection ID. APPEX curation team is maintaining the database of public datasets by regular update (once per three months). If you want to know how to use public datasets in APPEX, please refer to the “public datasets” subsection of the “How to use” section. 5. Supporting analysis methods In this section, methodology of supporting analysis methods from APPEX analyzer is briefly described. To access full description of methodology, please refer to the reference document of each analysis method subsection. 5.1. Cox proportional hazard model Survival analysis typically examines the relationship of the survival distribution to covariates. Most commonly, this examination entails the specification of a linear-like model for the log hazard. For example, a parametric model based on the exponential distribution may be written as or, equivalently, that is, as a linear model for the log-hazard or as a multiplicative model for the hazard. Here, i is a subscript for observation, and the x’s are the covariates. The constant α in this model represents a kind of log-baseline hazard, since log hi(t) = α[or hi(t) = eα] when all of the x’s are zero. The Cox model leaves the baseline hazard function α(t) = log h0(t) unspecified: or, again equivalently, Copyright 2015 by Genome Institute @ KRIBB 41 APPEX This model is semi-parametric because while the baseline hazard can take any form, the covariates enter the model linearly. Consider, now, two observations i and I’ that differ in their x-values, with the corresponding linear predictors and The hazard ratio for these two observations, is independent of time t. Consequently, the Cox model is a proportional-hazards model. Remarkably, even though the baseline hazard is unspecified, the Cox model can be estimated by the method of partial likelihood, developed by Cox in the paper in which he introduced the Cox model (16). Although the resulting estimates are not as efficient as maximum-likelihood estimates for a correctly specified parametric hazard regression model, not having to make arbitrary, and possibly incorrect, assumptions about the form of the baseline hazard is a compensating virtue of Cox’s specification. Having fit the model, it is possible to extract an estimate of the baseline hazard. 5.2. In-trans correlation approach The aim of in-trans correlation approach is to estimate prognostic value of a molecule (driver) and its associated molecules (effectors). A gene set of a disease driving candidate and its associated genes is handled as a signature to predict cancer behaviors on APPEX. To generate in trans gene set correlated with a gene feature, Pearson correlation test method is applied. Using expression data of highly correlated genes with a gene feature, a hierarchical clustering analysis is performed as described in Eisen et al (20). According to patients clustering, patients are divided into two sub-groups and time to survival event of patients in each sub-group is estimated. The Kaplan-Meier method is used to calculate the time to survival and differences in survival between the two groups is assessed using log-rank statistics. In addition, to estimate prognostic values of multiple in trans gene sets in IntransMulti process of APPEX, Pearson correlation test, hierarchical clustering, Kaplan-Meier method, and log-rank test are sequentially iterated for user input disease driving candidates existing in the gene expression data. In-trans correlation approach was successfully applied at previous investigations (7, 18). Copyright 2015 by Genome Institute @ KRIBB 42 APPEX 5.3. Super PC SuperPC indicates "supervised principal components". It can predict a censored survival outcome, or a quantitative outcome. It is especially useful for correlating patient survival or other quantitative parameters with gene expression data. “Supervised principal components” is a generalization of principal components regression. The first (or first few) principal components are the linear combinations of the features that capture the directions of largest variation in a dataset. But these directions may or may not be related to an outcome variable of interest. To find linear combinations that are related to an outcome variable, SuperPC compute univariate scores for each gene and then retain only those features whose score exceeds a threshold. A principal components analysis is carried out using only the data from these selected features. Finally, these "supervised principal components" are used in a regression model to predict the outcome. To summarize, the steps are: (1) Compute (univariate) standard regression coefficients for each feature (2) Form a reduced data matrix consisting of only those features whose univariate coefficient exceeds a threshold theta in absolute value (theta is estimated by cross-validation) (3) Compute the first (or first few) principal components of the reduced data matrix (4) Use these principal component(s) in a regression model to predict the outcome This idea can be used in standard regression problems with a quantitative outcome, and also in generalized regression problems such as survival analysis. In the latter problem, the regression coefficients in step (1) are obtained from a proportional hazards model. There is one more important point: the features (e.g. genes) which important in the prediction are not necessarily the ones that passed the screen in step 2. There are other features that may have as high a correlation with the supervised PC predictor. So SuperPC computes an importance score for each feature equal to its correlation with the supervised PC predictor. A reduced predictor is formed by softthresholding the importance scores, and using these shrunken scores as weights. The softthresholding sets the weight of some features to zero, hence throwing them out of the model. The amount of shrinkage is determined by cross-validation. The reduced predictor often performs as well or better than the supervised PC predictor, and is more interpretable. For more information about SuperPC, please refer to its methodology paper (17). 5.4. Time dependent ROC curves ROC curve is a popular method for displaying sensitivity and specificity of a continuous diagnostic marker, X, for a binary disease variable, D. However, many disease outcomes are time dependent, D(t), and ROC curves that vary as a function of time may be more appropriate. A common example of a time-dependent variable is vital status, where D(t) = 1 if a patient has died prior to time t and zero otherwise. Time dependent ROC method tries to summarize the discrimination potential of a marker X, measured at baseline (t = 0), by calculating ROC curves for cumulative disease or death incidence by time t, which is denoted as ROC(t). A typical complexity with survival data is that observations may be censored. Two ROC curve estimators are proposed that can accommodate censored data. A simple estimator is based on using the Kaplan-Meier estimator for each possible subset X > c. However, this Copyright 2015 by Genome Institute @ KRIBB 43 APPEX estimator does not guarantee the necessary condition that sensitivity and specificity are monotone in X. An alternative estimator that does guarantee monotonicity is based on a nearest neighbor estimator for the bivariate distribution function of (X, T), where T represents survival time. For more information about Time dependent ROC curves, please refer to its methodology paper (19). 6. System architecture APPEX system consists of various software frameworks to handle multiple concurrent analysis jobs steadily and robustly. Basically, APPEX was implemented by a host language, JAVA. To provide user friendly and active interfaces, Google web toolkit (GWT, ver. 2.5.0, https://developers.google.com/web-toolkit) and GWT extended (GXT, ver. 3.0.1, http://www.sencha.com/products/gxt) frameworks were used. Various dialog based interfaces of APPEX were constructed by GWT and GXT libraries. The data transporting between client and APPEX server is controlled by GWT remote procedure call (RPC) method. All statistical analysis methods of APPEX analyzer were implemented by R script language (ver. 2.15.2, http://www.rproject.org) with Bioconductor plugins (ver. 2.11, http://www.bioconductor.org). Calling R modules from a host language is managed by RCaller framework (ver. 2.1.1, https://code.google.com/p/rcaller). To handle multiple time-consuming jobs concurrently, Quartz framework, one of the job scheduling services, was integrated with APPEX (ver. 2.1.6, http://quartz-scheduler.org). To store and handle public datasets from NCBI GEO, MySQL database management system was applied (ver. 5.5.11, http://dev.mysql.com). In addition, data query on MySQL from a host language is controlled by MyBatis, a XML based SQL mapping framework (ver. 3.1.1, https://code.google.com/p/mybatis). All services of APPEX are contained and served on an Apache Tomcat web server (ver. 6.0.26, http://tomcat.apache.org). The following figure is a schematic diagram of APPEX system architecture. Figure 39. APPEX system architecture Copyright 2015 by Genome Institute @ KRIBB 44 APPEX 7. Operating policy of APPEX To make the APPEX system works steadily and to provide flexibility as highly as possible, we have established a couple of operating criteria as followings: (1) Connection ID When an anonymous user accesses to APPEX system, a connection ID to control session of the user is automatically generated. All the materials produced by user activities on APPEX such as uploaded files or analysis results are managed based on a connection ID. If users remember a connection ID at previous sessions, they can replace current connection ID with previous one and access previous results or uploaded data on APPEX analyzer. The responsibility to manage connection ID such as maintaining a connection ID and saving or removing its data is up to the user. APPEX just has a roll to generate new connection ID when users access to APPEX website. (2) Supporting data formats APPEX supports two data formats to handle, column-oriented and row-oriented datasets. Each element of them should be delimited by a tab (‘\t’) character. Column-oriented dataset format is applicable for CoxSingle and Multivariate processes on APPEX. Row-oriented dataset format is applicable for CoxMulti, IntransSingle, IntransMulti, SuperPC, and TimeRoc processes. Row-oriented dataset format is also used at public dataset processing. When user select one of the stored public datasets, APPEX tries to make a file formatted by row-oriented dataset and save it to user area based on connection ID. (3) No requiring of personal information APPEX does not require and never try to save any personal information of user. The only thing APPEX requires at each analysis process is an email address to alert the completion of long time analysis. Of course, APPEX does not save it after alerting an analysis completion. (4) Maintenance of analysis history Basically, APPEX maintains analysis history of user for two months after processed date. Meanwhile, APPEX never try to do anything associated with user’s own data. After two months of maintenance, APPEX will remove all the contents in the APPEX database. References 1. Paik S, Shak S, Tang G, Kim C, Baker J, Cronin M, et al. A multigene assay to predict recurrence of tamoxifen-treated, node-negative breast cancer. N Engl J Med. 2004;351:2817-26. 2. Alizadeh AA, Eisen MB, Davis RE, Ma C, Lossos IS, Rosenwald A, et al. Distinct types of diffuse large B-cell lymphoma identified by gene expression profiling. Nature. 2000;403:503-11. Copyright 2015 by Genome Institute @ KRIBB 45 APPEX 3. van de Vijver MJ, He YD, van't Veer LJ, Dai H, Hart AA, Voskuil DW, et al. A gene-expression signature as a predictor of survival in breast cancer. N Engl J Med. 2002;347:1999-2009. 4. Lee JS, Chu IS, Heo J, Calvisi DF, Sun Z, Roskams T, et al. Classification and prediction of survival in hepatocellular carcinoma by gene expression profiling. Hepatology. 2004;40:667-76. 5. Lee JS, Heo J, Libbrecht L, Chu IS, Kaposi-Novak P, Calvisi DF, et al. A novel prognostic subtype of human hepatocellular carcinoma derived from hepatic progenitor cells. Nat Med. 2006;12:410-6. 6. Sanchez-Carbayo M, Socci ND, Lozano J, Saint F, Cordon-Cardo C. Defining molecular profiles of poor outcome in patients with invasive bladder cancer using oligonucleotide microarrays. J Clin Oncol. 2006;24:778-89. 7. Lee JS, Leem SH, Lee SY, Kim SC, Park ES, Kim SB, et al. Expression signature of E2F1 and its associated genes predict superficial to invasive progression of bladder tumors. J Clin Oncol. 2010;28:2660-7. 8. Oh SC, Park YY, Park ES, Lim JY, Kim SM, Kim SB, et al. Prognostic gene expression signature associated with two molecularly distinct subtypes of colorectal cancer. Gut. 2012;61:1291-8. 9. Volinia S, Croce CM. Prognostic microRNA/mRNA signature from the integrated analysis of patients with invasive breast cancer. Proc Natl Acad Sci U S A. 2013;110:7413-7. 10. Sadanandam A, Lyssiotis CA, Homicsko K, Collisson EA, Gibb WJ, Wullschleger S, et al. A colorectal cancer classification system that associates cellular phenotype and responses to therapy. Nat Med. 2013;19:619-25. 11. De Sousa EMF, Wang X, Jansen M, Fessler E, Trinh A, de Rooij LP, et al. Poor-prognosis colon cancer is defined by a molecularly distinct subtype and develops from serrated precursor lesions. Nat Med. 2013;19:614-8. 12. Wu CL, Schroeder BE, Ma XJ, Cutie CJ, Wu S, Salunga R, et al. Development and validation of a 32-gene prognostic index for prostate cancer progression. Proc Natl Acad Sci U S A. 2013;110:6121-6. 13. Simon R, Lam A, Li MC, Ngan M, Menenzes S, Zhao Y. Analysis of gene expression data using BRB-ArrayTools. Cancer informatics. 2007;3:11-7. 14. Saeed AI, Sharov V, White J, Li J, Liang W, Bhagabati N, et al. TM4: a free, open-source system for microarray data management and analysis. BioTechniques. 2003;34:374-8. 15. Tarraga J, Medina I, Carbonell J, Huerta-Cepas J, Minguez P, Alloza E, et al. GEPAS, a webbased tool for microarray data analysis and interpretation. Nucleic Acids Res. 2008;36:W308-14. 16. Cox DR. Regression Models and Life-Tables. Journal of the Royal Statistical Society Series B (Methodological). 1972;34:187-220. 17. Bair E, Tibshirani R. Semi-supervised methods to predict patient survival from gene expression data. PLoS Biol. 2004;2:E108. 18. Kim SK, Kim EJ, Leem SH, Ha YS, Kim YJ, Kim WJ. Identification of S100A8-correlated genes for prediction of disease progression in non-muscle invasive bladder cancer. BMC Cancer. 2010;10:21. 19. Heagerty PJ, Lumley T, Pepe MS. Time-dependent ROC curves for censored survival data and a diagnostic marker. Biometrics. 2000;56:337-44. 20. Eisen MB, Spellman PT, Brown PO, Botstein D. Cluster analysis and display of genome-wide expression patterns. Proc Natl Acad Sci U S A. 1998;95:14863-8. Copyright 2015 by Genome Institute @ KRIBB 46