1
RAFA Solutions
DAnS
Data Analysis Software
DAnS User Manual
Contents
Getting Started .................................................................................................................................................... 4
Data Analysis Window ....................................................................................................................................... 10
Creating Report ................................................................................................................................................. 18
Measurements .................................................................................................................................................. 20
General Measurements ..................................................................................................................................... 22
At X ............................................................................................................................................................ 22
Crossing ..................................................................................................................................................... 23
Delta X ....................................................................................................................................................... 24
Delta Y........................................................................................................................................................ 25
Maximum................................................................................................................................................... 25
Minimum ................................................................................................................................................... 26
X at Maximum............................................................................................................................................ 26
X at Minimum ............................................................................................................................................ 27
Peaks.......................................................................................................................................................... 28
Valleys........................................................................................................................................................ 28
Peaks and Valleys ....................................................................................................................................... 29
Crop ........................................................................................................................................................... 30
Statistics............................................................................................................................................................. 31
Mean ......................................................................................................................................................... 31
Root Mean Square ..................................................................................................................................... 31
Standard Deviation .................................................................................................................................... 32
Variance ..................................................................................................................................................... 33
Median....................................................................................................................................................... 34
Histogram .................................................................................................................................................. 34
Level Measurements ......................................................................................................................................... 35
Amplitude .................................................................................................................................................. 35
Peak to Peak .............................................................................................................................................. 36
High State Level ......................................................................................................................................... 36
Low State Level .......................................................................................................................................... 37
Average ...................................................................................................................................................... 38
Filters ................................................................................................................................................................. 38
1
© RAFA Solutions, 2014
DAnS User Manual
Bessel Filter................................................................................................................................................ 39
Butterworth Filter ...................................................................................................................................... 39
Chebyshev Filter ........................................................................................................................................ 40
Inverse Chebyshev Filter ............................................................................................................................ 40
Elliptic Filter ............................................................................................................................................... 41
Equiripple Bandpass Filter ......................................................................................................................... 42
Equiripple Bandstop Filter ......................................................................................................................... 42
Equiripple Highpass Filter .......................................................................................................................... 43
Equiripple Lowpass Filter ........................................................................................................................... 43
Median Filter ............................................................................................................................................. 44
FIR Windowed Filter .................................................................................................................................. 44
Fitting................................................................................................................................................................. 45
Linear Fit .................................................................................................................................................... 45
Exponential Fit ........................................................................................................................................... 47
Power Fit.................................................................................................................................................... 49
Logarithmic Fit ........................................................................................................................................... 51
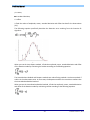
Gaussian Peak Fit ....................................................................................................................................... 52
Polynomial Fit ............................................................................................................................................ 55
Cubic Spline Fit .......................................................................................................................................... 57
Transforms......................................................................................................................................................... 58
Fast Fourier Transform .............................................................................................................................. 59
Fast Hilbert Transform ............................................................................................................................... 60
Inverse Fast Hilbert Transform .................................................................................................................. 61
Fast Hartley Transform .............................................................................................................................. 61
Inverse Fast Hartley Transform.................................................................................................................. 62
Walsh Hadamard Transform ...................................................................................................................... 63
Inverse Walsh Hadamard Transform ......................................................................................................... 64
Laplace Transform ..................................................................................................................................... 65
Mathematics...................................................................................................................................................... 66
Integral ...................................................................................................................................................... 66
Derivative................................................................................................................................................... 66
Spectral Analysis ................................................................................................................................................ 68
2
© RAFA Solutions, 2014
DAnS User Manual
Auto Power Spectrum................................................................................................................................ 68
Power Spectrum ........................................................................................................................................ 69
Phase Spectrum ......................................................................................................................................... 70
Cross Power Spectrum............................................................................................................................... 70
Amplitude Spectrum .................................................................................................................................. 71
Time Domain Measurements ............................................................................................................................ 72
Period ........................................................................................................................................................ 72
Frequency .................................................................................................................................................. 73
Duty Cycle .................................................................................................................................................. 74
Positive Pulse Width .................................................................................................................................. 76
Negative Pulse Width ................................................................................................................................ 77
Rise Time ................................................................................................................................................... 78
Fall Time .................................................................................................................................................... 79
Slew Rate ................................................................................................................................................... 81
Delay .......................................................................................................................................................... 82
Release Notes .................................................................................................................................................... 84
Software License and Evaluation ....................................................................................................................... 85
License Agreement .................................................................................................................................... 87
3
© RAFA Solutions, 2014
DAnS User Manual
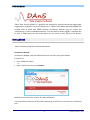
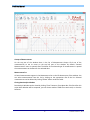
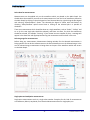
“DAnS” Data Analysis Software is a graphical tool designed for viewing and analyzing logged data.
Logged data is displayed in the form of waveforms on a graph. DanS works with most popular file
formats such as Excel and TDMS. Software incorporates different types of analysis and
measurements, as well as embedded calculator. Tool also allows to export logged or measured data
to Excel or TDMS format files and create Report for the results in Excel, Word or PDF formats.
Getting Started
“DAnS” Software incorporates the following windows:
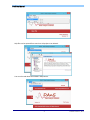
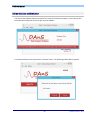
File Selection Window
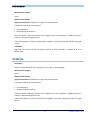
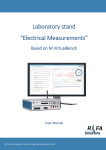
File Selection Window is the first window which user sees after running the software.
To open a file
Press “OPEN FILE” button
or
Open a file from the menu bar: File>Open.
Window menu bar has three sections: File, Help and Options.
It is also possible to select one of the recently opened (up to 10) files from the menu bar: File>Recent
Files.
4
© RAFA Solutions, 2014
DAnS User Manual
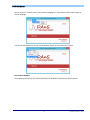
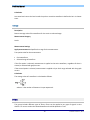
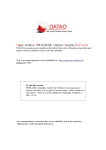
Help files can be opened from menu bar: Help>Open User Manual.
You can also read about the Software: Help>About.
5
© RAFA Solutions, 2014
DAnS User Manual
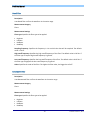
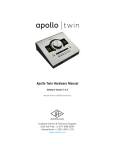
Section "Options" contains menu of the software languages. It is possible to select either English or
Russian language.
You can exit the Software by clicking “Close Window” button or from menu bar: File>Exit.
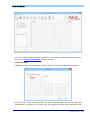
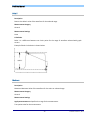
Data Analysis Window
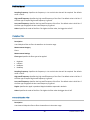
After selecting the file from File Selection Window, the window for data analysis will be opened.
6
© RAFA Solutions, 2014
DAnS User Manual
You can do measurements and create reports from this interface. See detailed description of the
window in the “Data Analysis Window” section of the Help.
Calculator Window
Embedded calculator can be opened by clicking “Calculator” button on the Data Analysis Window.
On the left part of the calculator window list with the plotted graphs from the file and saved
measurements is presented. List includes multi- and single-point measurements. Double click the
7
© RAFA Solutions, 2014
DAnS User Manual
item to add to the formula. You should add Measurement Name to the corresponding field if you
want to save calculations done. Saved calculations will be added to the Measurement list as well.
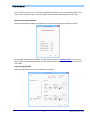
Measurement Settings Window
Measurement Settings window is opened each time one of the measurement buttons is clicked.
See detailed description of procedure for taking measurements in “Measurements” section of the
Help. Settings and calculation methods for each measurement are described in appropriate sections
of the Help.
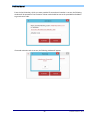
Report Settings Window
Report Settings Window is used to set options for the report.
8
© RAFA Solutions, 2014
DAnS User Manual
See detailed description of procedure for creating report in “Creating Report” section of the Help.
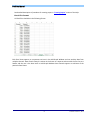
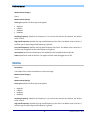
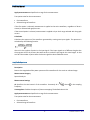
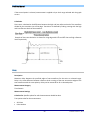
Excel File Format
All Excel files should be in the following format:
Each Excel sheet appears as a separate tree item in the Add Graph Window and can combine data from
multiple channels. Data of each channel is written in the sheets in a separate column with the first line as a
header and the rest is the data itself. In Add Graph Window these channels appear as sub-items of the
particular Excel sheet.
9
© RAFA Solutions, 2014
DAnS User Manual
Data Analysis Window
After selecting the file, the window for data analysis will be opened. You can do measurements and
create reports for the data from this interface.
Menu Bar
On the top of the window menu bar is available. Menu bar has 5 main sections:
1. File
There are five main options available in this menu, which mostly refer to file operations.
a. Open file: Open a file from the menu bar: File>Open.
b. Recent files: There is a possibility to select one of the recently opened files from the menu bar:
File>Recent Files.
c. Export Data: Exports plotted data to Excel or TDMS file. You should choose data from which graph
you want to export - Main Graph or Measurements Graph.
d. Export Image: There is possibility to export Graph Images (Main Graph or Measurement Graph) in
BMP, JPEG or PNG formats. If no format is chosen for the file, BMP format image will be saved.
Choose directory where you want to export image from the browsing window and type file name.
e. Exit: Select this option if you want to close Data Analysis Window.
2. Graph
In this palette options for Measurement Graph are combined.
a. Show Measurement Graph: When Software is opened Measurement Graph is hidden. Select this
option if you want to show it.
b. Hide Measurement Graph: Select this option if you want to hide Measurement Graph.
3. Report
In this menu options for Report are combined:
a. Save Image for Report: Select this option if you want to save Graph Image for later use in report.
You can choose to save image of Main Graph as well as the Measurement Graph.
b. Report Settings: Select this option to apply settings for report. “Report Settings” window will be
opened.
4. Help
a. Open User Manual: This menu is for opening Help files for the Software.
b. Show Context Help Window: Displays short descriptions of functions.
Hovering on a particular object a small window with a short description of the object will appear.
Clicking on More you can see a more detailed description of the object function.
10
© RAFA Solutions, 2014
DAnS User Manual
c. About: Reflect information about Software version, activation and the Company.
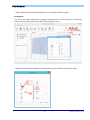
Plotting data
First of all, you should select data for applying measurements. This can be done by clicking add
button from the graphs palette of the Main Graph (top right corner).
A separate interface will be opened for selecting channels from the file which you want to plot.
11
© RAFA Solutions, 2014
DAnS User Manual
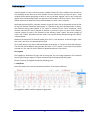
Channels appear in a tree, with their groups. A default channel for Time is added to the channels for
the possibility to plot data versus Time. Double click the channel which you want to plot, a small
window will be opened prompting to select an axis for the data. Applied X and Y axes’ names will
appear in the corresponding fields in the right part of the window. Field for X axis has “Time” value by
default, which means data versus Time will be plotted if no other X axis is selected.
While working with big files, computer memory can get full, and it will not be possible to use the file.
For big files channels should be read partially. It is possible to plot only selected number of points,
with selected starting point (offset). If "All" option is selected for the "Count" parameter, whole
channels selected for X and Y axes will be plotted. If you want to plot only part of the channels,
mention number of points in the channels to plot selecting "other" option, and enter number of
points. If for "Offset" parameter non-zero value is set, channels will be plotted starting from "Offset"
numbered point.
Maximum permitted size for channel reading from а file is 1 mln elements. If channel length is more
than 1 mln, only first 1 mln elements will be read.
Click “Add” button if you want to add selected plot to the graph, or “Cancel” to cancel the operation.
The new Plot will be added to the graph with the name “Y vs X”, where Y is the name of the channel
selected as Y axis, and X for X axis. Number of plotted waveforms is not limited.
Plot Legends
Plot legends are located on the right side of each graph. You can change properties of the selected
plot by right clicking its legend. To select or deselect plot click appropriate plot legend.
Shortcut menu for the legend includes the following items:
1. Hide/Show
Select this option if you want to hide visible waveform, or to show invisible one.
Plot legend for hidden waveform appears as grayed out.
12
© RAFA Solutions, 2014
DAnS User Manual
2. Color
Select this option if you want to change the color of the selected waveform. Click the color box and
select color from the color palette that appears.
3. Line Style
Select this option if you want to change the line style of the waveform. Select the style you want
from the series of styles.
4. Line Width
Select this option to change the line width of the waveform.
5. Bar Plot
Select this option if you want to fill the bar for the selected waveform.
6. Point Style
Select this option to change the point style of the waveform.
7. Select/Deselect
Select this option to make the waveform selected, or to deselect already selected waveform.
Plot legend for the selected plot appears with red borders.
13
© RAFA Solutions, 2014
DAnS User Manual
8. Delete Plot
Select this option if you want to delete plotted waveform.
Graph Palette (Main Graph)
You can apply general changes to the graph from the Graph Palette. There are five options available
from this palette:
1. Cursor
Select this option if you want to move cursors of the graph.
2. Zoom
Select one of zoom options to apply to graph.
14
© RAFA Solutions, 2014
DAnS User Manual
3. Hand Tool
Select this option to move the graph.
4. Clear Graph
Select this option to clear all plotted data.
5. Add Graph
Select this option to add new waveform to already plotted waveforms. Detailed operation of this
option is described in “Plotting data” section of the current Help file.
Main Graph has also an option to move cursors by giving X coordinates of the cursors. Enter first and
second cursors' X coordinates in the X1 and X2 fields appropriately, above the Main Graph.
15
© RAFA Solutions, 2014
DAnS User Manual
Graph Palette (Measurement Graph)
Graph palette of Measurement Graph has five options.
First four options - Cursor, Zoom, Hand Tool and Clear Graph are the same, as for the Main Graph.
See detailed descriptions for these options in “Graph Palette (Main Graph)” section above.
The fifth option in Graphs Palette is “Save Graph”. This option saves data of the selected plots.
Names of the saved data appear in the Measurement list in the left part of the window.
You can add them to Main Graph by double clicking.
16
© RAFA Solutions, 2014
DAnS User Manual
Groups of Measurements
On the top part of the window there is the list of Measurement Groups. Click one of the
measurements to see its menu on the top left part of the window. By default “General
Measurements” menu is opened. After The Menu of the selected type of measurements is opened
the measurements can be done for the selected data.
Measurement list
All saved measurements appear in the Measurement list on the left bottom part of the window. You
can select measurements from this list by clicking on the appropriate row of the list. Selected
measurements can be deleted by clicking “Delete” button under the table.
Closing Data Analysis Window
Data Analysis Window can be closed by clicking “Close” button or from Menu Bar: File>Exit. After this
action Main Window will be reopened, you can choose another TDMS file to work with, or close the
Software.
17
© RAFA Solutions, 2014
DAnS User Manual
Creating Report
“DAnS” software allows creating Reports in Excel, Word or PDF formats. Report can be created by clicking
“Report” button on the “Data Analysis Window”. Before creating the report appropriate settings should be
set from the “Report Settings” window. The “Report Settings” window can be opened from the
Report>Report Settings option in Menu bar. This window is also opened each time “Report” button is
clicked on the “Data Analysis Window”.
The following settings should be selected for the report:
1. Logo
Logo appears on the top left corner of the Report. If no logo is chosen, it will not appear in the report. Note,
only JPEG or PNG formatted images can be selected for the logo.
2. Report type
This option defines file type for the Report. It is possible to choose Microsoft Excel, Microsoft Word and PDF
formats. Note, in the computer you are using the following software should exist in order to generate
report:
- Microsoft Excel
- Microsoft Word
- Any PDF reader and PDF printer/converter. You can download free pdf converter from
http://www.foxitsoftware.com/.
3. Page Orientation
Defines orientation of the report page (Portrait or Landscape). Portrait page orientation is selected by
default.
4. Saved Graph Images
This table shows images of graphs which were saved previously from the “Data Analysis Window”. You can
select graphs by double clicking on the graph name. Selected graphs will appear in the report file. All graphs
are deselected by default.
You can select/deselect all Graph Images by click appropriate button located under the Image table.
5. Remark
If Remark is “On” Graph Image remarks will be included in the Report.
6. Measurement Data
If Measurement Data is “On” all single-point measurements will be included in the Report.
18
© RAFA Solutions, 2014
DAnS User Manual
7. Report Title
Report Title appears on the top of the Report page. The following settings can be chosen for the Report
Title: Alignment, Font, Size, Style (Italic, Bold, Underline), Color.
8. Reported By
Text inserted in the “Reported By” field appears on the bottom of the Report page. The following
settings can be chosen for the text: Alignment, Font, Size, Style (Italic, Bold, Underline), Color.
19
© RAFA Solutions, 2014
DAnS User Manual
Measurements
Measurement types
For easier use measurements are divided into groups, according to their types. There are nine groups
of measurements:
1. General Measurements
This group includes general measurements which can be done on any type of waveforms. Group
includes measurements, such as Maximum of the waveform, Peaks of the waveform and so on.
2. Statistical Measurements
Measurements in this group are for statistical analysis of the waveform. Examples for statistical
measurements are calculation of root mean square, mean, variance, etc.
3. Level Measurements
This group combines measurements which concern signal level calculations, such as amplitude
calculation, high/low state level calculation, etc.
4. Time Domain Measurements
Measurements in this group are for calculations which refer to time domain. Time domain
measurements include transition, period, frequency calculation, etc.
5. Spectral Analysis
Measurements in this group perform different spectral analysis. These measurements should be
applied to the waveform in time domain.
6. Filters
This group includes different types of filters. Filters can be applied to any type of signals in time
domain. For correct results the selected waveform should be plotted vs Time.
7. Fitting
This group combines different methods for fitting data to known curves.
8. Mathematics
This group combines mathematical calculations, such as integral and derivative.
9. Transforms
This group includes different transforms for the waveforms, such as Fast Fourier transform, WalshHadamard transform, Fast Hilbert transform, etc.
All measurements in these groups are described in details in corresponding chapters of this
document.
20
© RAFA Solutions, 2014
DAnS User Manual
Select data for measurements
Measurements can be applied only on the waveforms which are plotted on the Main Graph. You
should select the waveform you want to do measurements on from the list of waveforms plotted on
the Main Graph by clicking on the plot legend or from Shortcut Menu by right clicking the plot legend
and selecting “Select/Deselect” option. The selected plot legend is shown with red borders. By
choosing “Select/Deselect” option second time or clicking on the selected plot it is possible to
deselect it.
There are measurements which should be done on a single waveform, such as “Peaks”, “Valleys” and
so on (in this case single plot should be selected), and there are those, for which two waveforms
should be selected, for example “Crossing”. If you choose incorrect number of plots, a message will
appear in the Status bar with appropriate warning. No measurement will be done in this case.
Selecting range for measurements
Before doing any measurement, Measurement Settings window for the selected measurement is
being opened. You can do the measurement on the Entire Waveform or on the Selected range. In the
case of selected range, measurement is being done on the part of the waveform within two cursors
on the Main Graph.
Single-point and multipoint measurements
Single-point measurement result is a single value number. Examples for this kind of measurements
are: Maximum, Delta X, Amplitude, Time Domain Measurement done for single pulse, etc.
21
© RAFA Solutions, 2014
DAnS User Manual
Results for single-point measurements are shown on the left side of the software window.
Measurement result is shown in “Result” window. To save measurement result you should click the
“Save” button under “Result” window. Saved results are appearing in the “Measurements List” on
the left side of the software window. It is also possible to use saved results in the calculator.
Multipoint measurement result is a waveform. Examples for multipoint measurements are: Peaks (if
the selected waveform has multiple peaks), Peaks and Valleys, all fittings, all transforms and so on.
Multipoint measurements are being plotted on the Measurement Graph. You can show or hide this
graph from Menu Bar. If you have done multipoint measurement and have not enabled
Measurement Graph, a warning will come. From Measurement graph you can save selected
Measurements for later use. Saved Multipoint measurement will appear in the measurements list.
You can plot saved measurement on the Main Graph by double clicking it from the measurements list
for later operations. You will also be able to use saved multipoint measurements in calculator.
General Measurements
This group includes general measurements which can be done on any type of waveforms. Group
includes measurements, such as Maximum of the waveform, Peaks of the waveform and so on.
At X
Description
Returns the Y-axis value at a particular X-axis point of the waveform for the entire or selected range.
Measurement Category
General
Measurement Settings
X Value: Specifies the X value which corresponding Y value should be found.
Apply measurement on: Specifies the range for the measurement.
Two options exist for the measurement:
Entire waveform
Selected range of waveform
If the first option is selected, measurement is applied to the entire waveform, regardless of what is
viewed, or selected with graph cursors.
If the second option is selected, measurement is applied only to the X range selected with the graph
cursors.
22
© RAFA Solutions, 2014
DAnS User Manual
Calculation
For provided X value returns the corresponding Y value.
Crossing
Description
Measures crossings of two waveforms for the entire or selected range. It is possible to find all or
selected crossings.
Measurement Category
General
Measurement Settings
Method: Defines the method curves will be interpolated by.
Nearest
Linear
Spline
Cubic Hermite
Lagrange
Accuracy: Defines the accuracy of the measurement. The smaller this parameter the bigger accuracy
of the measurement is. Accuracy is a positive parameter, it cannot equal to 0 as well.
Calculate for: Specifies the crossings for which measurement should be done.
Two options exist for the measurement:
All Crossings
Crossing Number
If the first option is selected, all crossings of the waveforms are returned. If the second option is
selected, selected crossing is returned.
Apply measurement on: Specifies the range for the measurement.
Two options exist for the measurement:
Entire waveform
Selected range of waveform
23
© RAFA Solutions, 2014
DAnS User Manual
If the first option is selected, measurement is applied to the entire waveform, regardless of what is
viewed, or selected with graph cursors.
If the second option is selected, measurement is applied only to the X range selected with the graph
cursors.
Calculation
Crossing is calculated by finding points with the save values for two waveforms. After crossing of two
waveforms is found, corresponding Y axis value is returned. If selected two waveforms don’t have
any crossings, “NaN” value is returned.
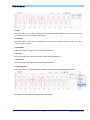
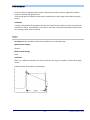
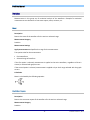
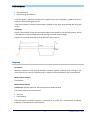
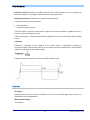
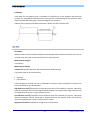
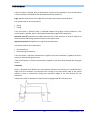
Delta X
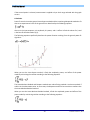
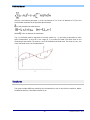
Description Returns the delta X value of the waveform for the selected range.
Measurement Category
General
Measurement Settings
None
Calculation
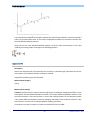
Delta X is a difference between two X-axis points for the range of waveform selected with graph
cursors.
Example of delta X calculation is shown below.
24
© RAFA Solutions, 2014
DAnS User Manual
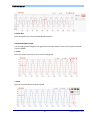
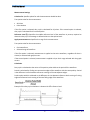
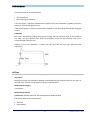
Delta Y
Description
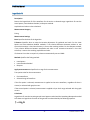
Returns the delta Y value of the waveform for the selected range.
Measurement Category
General
Measurement Settings
None
Calculation
Delta Y is a difference between two Y-axis points for the range of waveform selected with graph
cursors.
Example of delta Y calculation is shown below.
Maximum
Description
Measures Maximum Value of the waveform for the entire or selected range.
Measurement Category
General
Measurement Settings
Apply measurement on: Specifies the range for the measurement.
Two options exist for the measurement:
25
© RAFA Solutions, 2014
DAnS User Manual
Entire waveform
Selected range of waveform
If the first option is selected, measurement is applied to the entire waveform, regardless of what is
viewed, or selected with graph cursors.
If the second option is selected, measurement is applied only to the X range selected with the graph
cursors.
Calculation
Maximum value of the input sequence is returned.
Minimum
Description
Measures Minimum Value of the waveform for the entire or selected range.
Measurement Category
General
Measurement Settings
Apply measurement on: Specifies the range for the measurement.
Two options exist for the measurement:
Entire waveform
Selected range of waveform
If the first option is selected, measurement is applied to the entire waveform, regardless of what is
viewed, or selected with graph cursors.
If the second option is selected, measurement is applied only to the X range selected with the graph
cursors.
Calculation
Minimum value of the input sequence is returned.
X at Maximum
Description
Returns the X coordinate of the Maximum value of the waveform for the entire or selected range.
26
© RAFA Solutions, 2014
DAnS User Manual
Measurement Category
General
Measurement Settings
Apply measurement on: Specifies the range for the measurement.
Two options exist for the measurement:
Entire waveform
Selected range of waveform
If the first option is selected, measurement is applied to the entire waveform, regardless of what is
viewed, or selected with graph cursors.
If the second option is selected, measurement is applied only to the X range selected with the graph
cursors.
Calculation
Finds the maximum value and returns corresponding X coordinate.
X at Minimum
Description
Returns the X coordinate of the Minimum value of the waveform for the entire or selected range.
Measurement Category
General
Measurement Settings
Apply measurement on: Specifies the range for the measurement.
Two options exist for the measurement:
Entire waveform
Selected range of waveform
If the first option is selected, measurement is applied to the entire waveform, regardless of what is
viewed, or selected with graph cursors.
If the second option is selected, measurement is applied only to the X range selected with the graph
cursors.
Calculation
Finds the minimum value and returns corresponding X coordinate.
27
© RAFA Solutions, 2014
DAnS User Manual
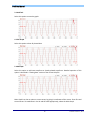
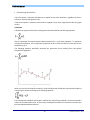
Peaks
Description
Returns Peaks of the waveform for the entire or selected range.
Measurement Category
General
Measurement Settings
Threshold: Ignores peaks which amplitudes are less than threshold.
Width: Specifies the number of consecutive data points to use in the quadratic least squares fit.
Width is coerced to a value greater than or equal to 3. The value should be no more than about 1/2
of the half-width of the peaks and can be much smaller (but > 2) for noise-free data. Width should be
as small as possible but should be balanced against the possibility of false peak detection due to
noise.
Apply measurement on: Specifies the range for the measurement.
Two options exist for the measurement:
Entire waveform
Selected range of waveform
If the first option is selected, measurement is applied to the entire waveform, regardless of what is
viewed, or selected with graph cursors.
If the second option is selected, measurement is applied only to the X range selected with the graph
cursors.
Calculation
Peaks are measured based on an algorithm that fits a quadratic polynomial to sequential groups of
data points. The number of data points used in the fit is specified by width.
For each peak, the quadratic fit is tested against the threshold. Peaks with heights lower than
threshold are ignored.
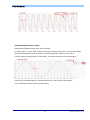
Valleys
Description
Returns Valleys of the waveform for the entire or selected range.
28
© RAFA Solutions, 2014
DAnS User Manual
Measurement Category
General
Measurement Settings
Threshold: Ignores valleys which amplitudes are greater than threshold.
Width: Specifies the number of consecutive data points to use in the quadratic least squares fit.
Width is coerced to a value greater than or equal to 3. The value should be no more than about 1/2
of the half-width of the valleys and can be much smaller (but > 2) for noise-free data. Width should
be as small as possible but must be balanced against the possibility of false peak detection due to
noise.
Apply measurement on: Specifies the range for the measurement.
Two options exist for the measurement:
Entire waveform
Selected range of waveform
If the first option is selected, measurement is applied to the entire waveform, regardless of what is
viewed, or selected with graph cursors.
If the second option is selected, measurement is applied only to the X range selected with the graph
cursors.
Calculation
Valleys are measured based on an algorithm that fits a quadratic polynomial to sequential groups of
data points. The number of data points used in the fit is specified by width.
For each valley, the quadratic fit is tested against the threshold. Valleys with troughs higher than
threshold are ignored.
Peaks and Valleys
Description
Returns Peaks and Valleys of the waveform for the entire or selected range.
Measurement Category
General
Measurement Settings
High Threshold: Ignores peaks which amplitudes are less than high threshold.
Low Threshold: Ignores valleys which amplitudes are greater than low threshold.
Width: Specifies the number of consecutive data points to use in the quadratic least squares fit.
Width is coerced to a value greater than or equal to 3. The value should be no more than about 1/2
29
© RAFA Solutions, 2014
DAnS User Manual
of the half-width of the peaks/valleys and can be much smaller (but > 2) for noise-free data. Width
should be as small as possible but must be balanced against the possibility of false peak detection
due to noise.
Apply measurement on: Specifies the range for the measurement.
Two options exist for the measurement:
Entire waveform
Selected range of waveform
If the first option is selected, measurement is applied to the entire waveform, regardless of what is
viewed, or selected with graph cursors.
If the second option is selected, measurement is applied only to the X range selected with the graph
cursors.
Calculation
Peaks and Valleys are measured based on an algorithm that fits a quadratic polynomial to sequential
groups of data points. The number of data points used in the fit is specified by width.
For each peak and valley, the quadratic fit is tested against the high and low thresholds. Peaks with
heights lower than high threshold and valleys with troughs higher than low threshold are ignored.
Crop
Description
Returns cropped part of the selected waveform.
Measurement Category
General
Measurement Settings
None
Calculation
Part of the selected waveform containing between two cursors is returned.
30
© RAFA Solutions, 2014
DAnS User Manual
Statistics
Measurements in this group are for statistical analysis of the waveform. Examples for statistical
measurements are calculation of root mean square, mean, variance, etc.
Mean
Description
Returns the mean of the waveform for the entire or selected range.
Measurement Category
Statistics
Measurement Settings
Apply measurement on: Specifies the range for the measurement.
Two options exist for the measurement:
Entire waveform
Selected range of waveform
If the first option is selected, measurement is applied to the entire waveform, regardless of what is
viewed, or selected with graph cursors.
If the second option is selected, measurement is applied only to the X range selected with the graph
cursors.
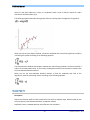
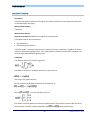
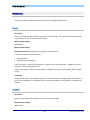
Calculation
Mean is calculated by the following equation:
Root Mean Square
Description
Returns the root mean square of the waveform for the entire or selected range.
Measurement Category
Statistics
31
© RAFA Solutions, 2014
DAnS User Manual
Measurement Settings
Apply measurement on: Specifies the range for the measurement.
Two options exist for the measurement:
Entire waveform
Selected range of waveform
If the first option is selected, measurement is applied to the entire waveform, regardless of what is
viewed, or selected with graph cursors.
If the second option is selected, measurement is applied only to the X range selected with the graph
cursors.
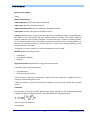
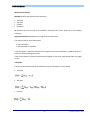
Calculation
Root mean square is calculated by the following equation:
Standard Deviation
Description
Returns the standard deviation of the waveform for the entire or selected range.
Measurement Category
Statistics
Measurement Settings
Weighting: Specifies whether to calculate population or sample standard deviation:
Sample – 0(default)
Population - 1
Apply measurement on: Specifies the range for the measurement.
Two options exist for the measurement:
Entire waveform
Selected range of waveform
32
© RAFA Solutions, 2014
DAnS User Manual
If the first option is selected, measurement is applied to the entire waveform, regardless of what is
viewed, or selected with graph cursors.
If the second option is selected, measurement is applied only to the X range selected with the graph
cursors.
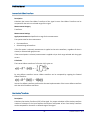
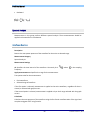
Calculation
Standard deviation is calculated by the following equation:
,
where w is weighting and is «n-1» when weighting is set to sample and «n» when it is
population.
Variance
Description
Returns the variance of the waveform for the entire or selected range.
Measurement Category
Statistics
Measurement Settings
Weighting: Specifies whether to calculate population or sample standard deviation:
Sample – 0(default)
Population - 1
Apply measurement on: Specifies the range for the measurement.
Two options exist for the measurement:
Entire waveform
Selected range of waveform
If the first option is selected, measurement is applied to the entire waveform, regardless of what is
viewed, or selected with graph cursors.
If the second option is selected, measurement is applied only to the X range selected with the graph
cursors.
33
© RAFA Solutions, 2014
DAnS User Manual
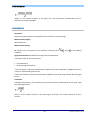
Calculation
Variance is calculated by the following equation,
,
where w is weighting and is «n-1» when weighting is set to sample and «n» when it is population.
Median
Description
Returns the median of the waveform for the entire or selected range.
Measurement Category
Statistics
Measurement Settings
Apply measurement on: Specifies the range for the measurement.
Two options exist for the measurement:
Entire waveform
Selected range of waveform
If the first option is selected, measurement is applied to the entire waveform, regardless of what is
viewed, or selected with graph cursors.
If the second option is selected, measurement is applied only to the X range selected with the graph
cursors.
Calculation
Median is the middle member’s value of the waveform arranged from low value to high value. If the
number of values is odd then median is calculated as the mean of the two middle values.
Histogram
Description
Returns the histogram of the waveform for the entire or selected range.
34
© RAFA Solutions, 2014
DAnS User Manual
Measurement Category
Statistics
Measurement Settings
Intervals: Specifies the number of the intervals of the histogram plot.
Apply measurement on: Specifies the range for the measurement.
Two options exist for the measurement:
Entire waveform
Selected range of waveform
If the first option is selected, measurement is applied to the entire waveform, regardless of what is
viewed, or selected with graph cursors.
If the second option is selected, measurement is applied only to the X range selected with the graph
cursors.
Calculation
Histogram of the waveform is calculated by counting the number of times the specified interval
occurs in the waveform.
Level Measurements
This group combines measurements which concern signal level calculations, such as amplitude
calculation, high/low state level calculation, etc.
Amplitude
Description
Returns the amplitude of the waveform for the entire or selected range.
Measurement Category
Levels
Measurement Settings
Apply measurement on: Specifies the range for the measurement.
Two options exist for the measurement:
35
© RAFA Solutions, 2014
DAnS User Manual
Entire waveform
Selected range of waveform
If the first option is selected, measurement is applied to the entire waveform, regardless of what is
viewed, or selected with graph cursors.
If the second option is selected, measurement is applied only to the X range selected with the graph
cursors.
Calculation
Amplitude is calculated as the difference between high state level and low state level.
Peak to Peak
Description
Returns peak to peak value of the waveform for the entire or selected range.
Measurement Category
Levels
Measurement Settings
Apply measurement on: Specifies the range for the measurement.
Two options exist for the measurement:
Entire waveform
Selected range of waveform
If the first option is selected, measurement is applied to the entire waveform, regardless of what is
viewed, or selected with graph cursors.
If the second option is selected, measurement is applied only to the X range selected with the graph
cursors.
Calculation
Peak to peak value is calculated as the difference between maximum and minimum values of the
waveform.
High State Level
Description
Returns the high state level of the waveform for the entire or selected range.
36
© RAFA Solutions, 2014
DAnS User Manual
Measurement Category
Levels
Measurement Settings
Apply measurement on: Specifies the range for the measurement.
Two options exist for the measurement:
Entire waveform
Selected range of waveform
If the first option is selected, measurement is applied to the entire waveform, regardless of what is
viewed, or selected with graph cursors.
If the second option is selected, measurement is applied only to the X range selected with the graph
cursors.
Calculation
High state level returns the level at which a pulse or transition waveform is defined to be in its
highest state.
Low State Level
Description
Returns the low state level of the waveform for the entire or selected range.
Measurement Category
Levels
Measurement Settings
Apply measurement on: Specifies the range for the measurement.
Two options exist for the measurement:
Entire waveform
Selected range of waveform
If the first option is selected, measurement is applied to the entire waveform, regardless of what is
viewed, or selected with graph cursors.
If the second option is selected, measurement is applied only to the X range selected with the graph
cursors.
37
© RAFA Solutions, 2014
DAnS User Manual
Calculation
Low state level returns the level at which a pulse or transition waveform is defined to be in its lowest
state.
Average
Description
Returns average value of the waveform for the entire or selected range.
Measurement Category
Levels
Measurement Settings
Apply measurement on: Specifies the range for the measurement.
Two options exist for the measurement:
Entire waveform
Selected range of waveform
If the first option is selected, measurement is applied to the entire waveform, regardless of what is
viewed, or selected with graph cursors.
If the second option is selected, measurement is applied only to the X range selected with the graph
cursors.
Calculation
The average value of a waveform is calculated as follows:
,
where n is the number of elements in input sequence X.
Filters
This group includes different types of filters. Filters can be applied to any type of signals in time
domain. For correct results the selected waveform should be plotted vs. Time.
38
© RAFA Solutions, 2014
DAnS User Manual
Bessel Filter
Description
Uses Bessel filter to filter the waveform in the entire range.
Measurement Category
Filters
Measurement Settings
Filter type: Specifies the filter type to be applied:
Highpass
Lowpass
Bandpass
Bandstop
Sampling frequency: Specifies the frequency in Hz at which the data will be sampled. The default
value is 1.0 Hz.
High cutoff frequency: Specifies the high cutoff frequency of the filter. The default value is 0.45 Hz. If
the filter type is lowpass high cutoff frequency is ignored.
Low cutoff frequency: Specifies the low cutoff frequency of the filter. The default value is 0.125 Hz. If
the filter type is highpass the low cutoff frequency is ignored.
Order: Specifies the order of the filter. The higher the filter order, the bigger the roll-off.
Butterworth Filter
Description
Uses Butterworth filter to filter the waveform in the entire range.
Measurement Category
Filters
Measurement Settings
Filter type: Specifies the filter type to be applied:
Highpass
Lowpass
Bandpass
Bandstop
39
© RAFA Solutions, 2014
DAnS User Manual
Sampling frequency: Specifies the frequency in Hz at which the data will be sampled. The default
value is 1.0 Hz.
High cutoff frequency: Specifies the high cutoff frequency of the filter. The default value is 0.45 Hz. If
the filter type is lowpass high cutoff frequency is ignored.
Low cutoff frequency: Specifies the low cutoff frequency of the filter. The default value is 0.125 Hz. If
the filter type is highpass the low cutoff frequency is ignored.
Order: Specifies the order of the filter. The higher the filter order, the bigger the roll-off.
Chebyshev Filter
Description
Uses Chebyshev filter to filter the waveform in the entire range.
Measurement Category
Filters
Measurement Settings
Filter type: Specifies the filter type to be applied:
Highpass
Lowpass
Bandpass
Bandstop
Sampling frequency: Specifies the frequency in Hz at which the data will be sampled. The default
value is 1.0 Hz.
High cutoff frequency: Specifies the high cutoff frequency of the filter. The default value is 0.45 Hz. If
the filter type is lowpass high cutoff frequency is ignored.
Low cutoff frequency: Specifies the low cutoff frequency of the filter. The default value is 0.125 Hz. If
the filter type is highpass the low cutoff frequency is ignored.
Ripple: Specifies the ripple in passband. Ripple should be expressed in decibels.
Order: Specifies the order of the filter. The higher the filter order the bigger the roll-off.
Inverse Chebyshev Filter
Description
Uses Inverse Chebyshev filter to filter the waveform in the entire range.
40
© RAFA Solutions, 2014
DAnS User Manual
Measurement Category
Filters
Measurement Settings
Filter type: Specifies the filter type to be applied:
Highpass
Lowpass
Bandpass
Bandstop
Sampling frequency: Specifies the frequency in Hz at which the data will be sampled. The default
value is 1.0 Hz.
High cutoff frequency: Specifies the high cutoff frequency of the filter. The default value is 0.45 Hz. If
the filter type is lowpass high cutoff frequency is ignored.
Low cutoff frequency: Specifies the low cutoff frequency of the filter. The default value is 0.125 Hz. If
the filter type is highpass the low cutoff frequency is ignored.
Attenuation: Specifies the attenuation of the stopband in dB. The default value is 60.0 dB.
Order: Specifies the order of the filter. The higher the filter order the bigger the roll-off.
Elliptic Filter
Description
Uses Elliptic filter to filter the waveform in the entire range.
Measurement Category
Filters
Measurement Settings
Filter type: Specifies the filter type to be applied:
Highpass
Lowpass
Bandpass
Bandstop
Sampling frequency: Specifies the frequency in Hz at which the data will be sampled. The default
value is 1.0 Hz.
High cutoff frequency: Specifies the high cutoff frequency of the filter. The default value is 0.45 Hz. If
the filter type is lowpass high cutoff frequency is ignored.
41
© RAFA Solutions, 2014
DAnS User Manual
Low cutoff frequency: Specifies the low cutoff frequency of the filter. The default value is 0.125 Hz. If
the filter type is highpass the low cutoff frequency is ignored.
Passband ripple: Specifies the ripple of the passband in dB. The default value is 1.0 dB.
Stopband attenuation: Specifies the attenuation of the stopband in dB. The default value is 60.0 dB.
Order: Specifies the order of the filter. The higher the filter order the bigger the roll-off.
Equiripple Bandpass Filter
Description
Uses FIR equiripple bandpass filter to filter the waveform in the entire range.
Measurement Category
Filters
Measurement Settings
Sampling frequency: Specifies the frequency in Hz at which the data will be sampled. The default
value is 1.0 Hz.
No of Taps: Determines the total number of FIR coefficients.
Higher stop frequency: Specifies the higher frequency of the stop band. The default value is 0.4 Hz.
Lower stop frequency: Specifies the lower frequency of the stopband. The default value is 0.2 Hz.
Higher pass frequency: Specifies the higher frequency of passband. The default value is 0.35 Hz.
Lower pass frequency: Specifies the lower frequency of the passband. The default value is 0.25 Hz.
Equiripple Bandstop Filter
Description
Uses FIR equiripple bandstop filter to filter the waveform in the entire range.
Measurement Category
Filters
Measurement Settings
Sampling frequency: Specifies the frequency in Hz at which the data will be sampled. The default
value is 1.0 Hz.
No of Taps: Determines the total number of FIR coefficients.
42
© RAFA Solutions, 2014
DAnS User Manual
Higher stop frequency: Specifies the higher frequency of the stopband. The default value is 0.35 Hz.
Lower stop frequency: Specifies the lower frequency of the stopband. The default value is 0.25 Hz.
Higher pass frequency: Specifies the higher frequency of the passband. The default value is 0.4 Hz.
Lower pass frequency: Specifies the lower frequency of the passband. The default value is 0.2 Hz.
Equiripple Highpass Filter
Description
Uses FIR equi-ripple highpass filter to filter the waveform in the entire range.
Measurement Category
Filters
Measurement Settings
Sampling frequency: Specifies the frequency in Hz at which the data will be sampled. The default
value is 1.0 Hz.
No of Taps: Determines the total number of FIR coefficients.
High frequency: Specifies the pass frequency of the filter. The default value is 0.3 Hz.
Stop frequency: Specifies the stop frequency of the filter. The default value is 0.2 Hz.
Equiripple Lowpass Filter
Description
Uses FIR equiripple lowpass filter to filter the waveform in the entire range.
Measurement Category
Filters
Measurement Settings
Sampling frequency: Specifies the frequency in Hz at which the data will be sampled. The default
value is 1.0 Hz.
No of Taps: Determines the total number of FIR coefficients.
Pass frequency: Specifies the pass frequency of the filter. The default value is 0.2 Hz.
Stop frequency: Specifies the stop frequency of the filter. The default value is 0.3 Hz.
43
© RAFA Solutions, 2014
DAnS User Manual
Median Filter
Description
Uses Median filter to filter the waveform in the entire range.
Measurement Category
Filters
Measurement Settings
Left rank: Specifies the number of elements to be used to compute the filter to the left side. The
default value is 2.
Right rank: Specifies the number of elements to be used to compute the filter to the right side. The
default value is -1.
Calculation
The Median Filter computes elements of the filtered signal using equation below.
Y is the output sequence of the filtered signal. n is the number of elements in the input sequence X.
Ji is a subset of the input X, centered about the ith element of X, and the indexed elements outside
the X range equal zero.
Ji can be described as:
,
where rl is the left rank and rr is the right rank.
FIR Windowed Filter
Description
Uses FIR windowed filter to filter the waveform in the entire range.
Measurement Category
Filters
Measurement Settings
Window: Specifies the type of the smoothing window.
44
© RAFA Solutions, 2014
DAnS User Manual
Window parameter: Specifies parameters for different windows. For the Kaiser window specifies the
beta parameter. For the Gaussian window specifies standard deviation. For the Dolph-Chebyshev
window specifies the ratio "s" of the main lobe to the side lobe. For other types of windows’ this
setting is ignored.
Filter type: Specifies the filter type to be applied:
Highpass
Lowpass
Bandpass
Bandstop
No of Taps: Determines the total number of FIR coefficients.
Sampling frequency: Specifies the frequency in Hz at which the data will be sampled. The default
value is 1.0 Hz.
High cutoff frequency: Specifies the high cutoff frequency of the filter. The default value is 0.45 Hz. If
the filter type is lowpass high cutoff frequency is ignored.
Low cutoff frequency: Specifies the low cutoff frequency of the filter. The default value is 0.125 Hz. If
the filter type is highpass the low cutoff frequency is ignored.
Order: Specifies the order of the filter. The higher the filter order, the bigger the roll-off.
Fitting
This group combines different methods for fitting data to known curves.
Linear Fit
Description
Returns the linear fit of the waveform for the entire or selected range. Linear fit is measured using
the Least Square, Least Absolute Residual, or Bisquare method.
Slope and intercept are also calculated.
Measurement Category
Fitting
45
© RAFA Solutions, 2014
DAnS User Manual
Measurement Settings
Tolerance: Specifies when to stop the iterative adjustment of slope and intercept when you use the
Least Absolute Residual or Bisquare method. For the Least Absolute Residual method, if the relative
difference between residues in two successive iterations is less than tolerance, it returns the
resulting residue. For the Bisquare method, if any relative difference between slope and intercept in
two successive iterations is less than tolerance, it returns the resulting slope and intercept.
If tolerance is less than or equal to 0, tolerance automatically sets to 0.0001.
Method: Specifies the fitting method:
Least Square
Least Absolute Residual
Bisquare
Apply measurement on: Specifies the range for the measurement.
Two options exist for the measurement:
Entire waveform
Selected range of waveform
If the first option is selected, measurement is applied to the entire waveform, regardless of what is
viewed, or selected with graph cursors.
If the second option is selected, measurement is applied only to the X range selected with the graph
cursors.
Calculation
Linear fit is calculated by the iterative general Least Square method and the Levenberg-Marquardt
method to fit experimental data to a straight line of the general form described by the following
equation:
where x is the input sequence, a is slope, and b is intercept. It finds the values of a and b that best fit
the observations (X,Y).
46
© RAFA Solutions, 2014
DAnS User Manual
The Least Absolute Residual and Bisquare methods are robust fitting methods. Use these methods if
outliers in the observations exist. In most cases, the Bisquare method is less sensitive to outliers than
the Least Absolute Residual method.
When you use the Least Absolute Residual method, it finds the slope and intercept of the linear
model by minimizing residue according to the following equation:
Exponential Fit
Description
Returns the exponential fit of the waveform for the entire or selected range. Exponential fit uses the
Least Square, Least Absolute Residual, or Bisquare method.
Amplitude and damping are also calculated.
Measurement Category
Fitting
Measurement Settings
Tolerance: Specifies when to stop the iterative adjustment of amplitude, damping and offset. For the
Least Square and Least Absolute Residual methods, if the relative difference between residues in two
successive iterations is less than tolerance, it returns the resulting residue. For the Bisquare method,
if any relative difference between amplitude, damping, and offset in two successive iterations is less
than tolerance, it returns the resulting amplitude, damping, and offset.
If tolerance is less than or equal to 0, tolerance automatically sets to 0.0001.
47
© RAFA Solutions, 2014
DAnS User Manual
Method: Specifies the fitting method:
Least Square
Least Absolute Residual
Bisquare
Apply measurement on: Specifies the range for the measurement.
Two options exist for the measurement:
Entire waveform
Selected range of waveform
If the first option is selected, measurement is applied to the entire waveform, regardless of what is
viewed, or selected with graph cursors.
If the second option is selected, measurement is applied only to the X range selected with the graph
cursors.
Calculation
Exponential fit uses the iterative general Least Square method and the Levenberg-Marquardt method
to fit data to an experimental curve of the general form described by the following equation:
where x is the input sequence, a is amplitude, b is damping, and c is offset. It finds the values of a, b
and c that best fit the observations (X,Y).
The following equation specifically describes the exponential curve resulting from the exponential fit
algorithm:
When you use the Least Square method, it finds the amplitude, damping, and offset of the
exponential model by minimizing the residue according to the following equation:
48
© RAFA Solutions, 2014
DAnS User Manual
The Least Absolute Residual and Bisquare methods are robust fitting methods. Use these methods if
outliers in the observations exist. In most cases, the Bisquare method is less sensitive to outliers than
the Least Absolute Residual method.
When you use the Least Absolute Residual method, it finds the amplitude, damping and offset of the
exponential model by minimizing residue according to the following equation:
Power Fit
Description
Returns the power fit of the waveform for the entire or selected range. Power fit uses the Least
Square, Least Absolute Residual, or Bisquare method.
Amplitude and power are also calculated.
Measurement Category
Fitting
Measurement Settings
Tolerance: Specifies when to stop the iterative adjustment of amplitude, power and offset. For the
Least Square and Least Absolute Residual methods, if the relative difference between residues in two
successive iterations is less than tolerance, it returns the resulting residue. For the Bisquare method,
if any relative difference between amplitude, power, and offset in two successive iterations is less
than tolerance, it returns the resulting amplitude, power, and offset.
If tolerance is less than or equal to 0, tolerance automatically sets to 0.0001.
Method: Specifies the fitting method:
Least Square
Least Absolute Residual
Bisquare
Apply measurement on: Specifies the range for the measurement.
Two options exist for the measurement:
Entire waveform
Selected range of waveform
If the first option is selected, measurement is applied to the entire waveform, regardless of what is
viewed, or selected with graph cursors.
49
© RAFA Solutions, 2014
DAnS User Manual
If the second option is selected, measurement is applied only to the X range selected with the graph
cursors.
Calculation
Power fit uses the iterative general Least Square method and the Levenberg-Marquardt method to fit
data to an experimental curve of the general form described by the following equation:
where x is the input sequence, a is amplitude, b is power, and c is offset. It finds the values of a, b and
c that best fit the observations (X,Y).
The following equation specifically describes the power function resulting from the general power fit
algorithm:
When you use the Least Square method, it finds the amplitude, power, and offset of the power
model by minimizing the residue according to the following equation:
The Least Absolute Residual and Bisquare methods are robust fitting methods. Use these methods if
outliers in the observations exist. In most cases, the Bisquare method is less sensitive to outliers than
the Least Absolute Residual method.
When you use the Least Absolute Residual method, it finds the amplitude, power and offset of the
power model by minimizing residue according to the following equation:
50
© RAFA Solutions, 2014
DAnS User Manual
Logarithmic Fit
Description
Returns the logarithmic fit of the waveform for the entire or selected range. Logarithmic fit uses the
Least Square, Least Absolute Residual, or Bisquare method.
Amplitude and scale are also calculated.
Measurement Category
Fitting
Measurement Settings
Base: Specifies the base of the logarithm.
Tolerance: Specifies when to stop the iterative adjustment of amplitude and scale. For the Least
Square and Least Absolute Residual methods, if the relative difference between residues in two
successive iterations is less than tolerance, it returns the resulting residue. For the Bisquare method,
if any relative difference between amplitude and scale in two successive iterations is less than
tolerance, it returns the resulting amplitude and scale.
If tolerance is less than or equal to 0, tolerance automatically sets to 0.0001.
Method: Specifies the fitting method:
Least Square
Least Absolute Residual
Bisquare
Apply measurement on: Specifies the range for the measurement.
Two options exist for the measurement:
Entire waveform
Selected range of waveform
If the first option is selected, measurement is applied to the entire waveform, regardless of what is
viewed, or selected with graph cursors.
If the second option is selected, measurement is applied only to the X range selected with the graph
cursors.
Calculation
Logarithmic fit uses the iterative general Least Square method and the Levenberg-Marquardt method
to fit data to a logarithmic function of the general form described by the following equation:
51
© RAFA Solutions, 2014
DAnS User Manual
where x is the input sequence, c is base, a is amplitude, and b is scale. It finds the values of a and b
that best fit the observations (X,Y).
The following equation describes the logarithm function resulting from the logarithm fit algorithm:
When you use the Least Square method, it finds the amplitude and scale of the logarithmic model by
minimizing the residue according to the following equation:
The Least Absolute Residual and Bisquare methods are robust fitting methods. Use these methods if
outliers in the observations exist. In most cases, the Bisquare method is less sensitive to outliers than
the Least Absolute Residual method.
When you use the Least Absolute Residual method, it finds the amplitude and scale of the
logarithmic model by minimizing residue according to the following equation:
Gaussian Peak Fit
Description
Returns the Gaussian peak fit of the waveform for the entire or selected range. Gaussian peak fit uses
the Least Square, Least Absolute Residual, or Bisquare method.
Amplitude, center, standard deviation and offset are also calculated.
52
© RAFA Solutions, 2014
DAnS User Manual
Measurement Category
Fitting
Measurement Settings
Initial amplitude: Specifies initial guess of amplitude.
Initial center: Specifies initial guess of center.
Initial Standard deviation: Specifies initial guess of standard deviation.
Initial offset: Specifies initial guess of the offset it returns.
Tolerance: Specifies when to stop the iterative adjustment of amplitude, center, standard deviation,
and offset. For the Least Square and Least Absolute Residual methods, if the relative difference
between residues in two successive iterations is less than tolerance, it returns the resulting residue.
For the Bisquare method, if any relative difference between amplitude, center, standard deviation, or
offset in two successive iterations is less than tolerance, it returns the resulting amplitude, center,
standard deviation, and offset.
If tolerance is less than or equal to 0, tolerance automatically sets to 0.0001.
Method: Specifies the fitting method:
Least Square
Least Absolute Residual
Bisquare
Apply measurement on: Specifies the range for the measurement.
Two options exist for the measurement:
Entire waveform
Selected range of waveform
If the first option is selected, measurement is applied to the entire waveform, regardless of what is
viewed, or selected with graph cursors.
If the second option is selected, measurement is applied only to the X range selected with the graph
cursors.
Calculation
Gaussian peak fit uses the iterative general Least Square method and the Levenberg-Marquardt
method to fit data to a Gaussian curve in a form described by the following equation:
,
where x is the input sequence,
a is amplitude,
53
© RAFA Solutions, 2014
DAnS User Manual
µ is center,
is standard deviation,
c is offset.
It finds the values of amplitude, center, standard deviation and offset that best fit the observations
(X,Y).
The following equation specifically describes the Gaussian curve resulting from the Gaussian fit
algorithm:
When you use the Least Square method, it finds the amplitude, center, standard deviation and offset
of the Gaussian model by minimizing the residue according to the following equation:
The Least Absolute Residual and Bisquare methods are robust fitting methods. Use these methods if
outliers in the observations exist. In most cases, the Bisquare method is less sensitive to outliers than
the Least Absolute Residual method.
When you use the Least Absolute Residual method, it finds the amplitude, center, standard deviation
and offset of the Gaussian model by minimizing residue according to the following equation:
54
© RAFA Solutions, 2014
DAnS User Manual
Polynomial Fit
Description
Returns the Polynomial fit of the waveform for the entire or selected range. Polynomial fit uses the
Least Square, Least Absolute Residual, or Bisquare method.
Polynomial Coefficients are also calculated.
Measurement Category
Fitting
Measurement Settings
Polynomial order: Specifies the order of the polynomial that fits to the data set. Polynomial order
must be greater than or equal to 0. In real applications, polynomial order is less than 10. Polynomial
order can’t be greater than 25. The default is 2.
Algorithm: Specifies the algorithm uses to compute Best Polynomial Fit. Use SVD for Rank Deficient H
if all other algorithms are unsuccessful.
SVD
Givens
Givens2
Householder
LU Decomposition
Cholesky
SVD for Rank Deficient H
Tolerance: Specifies when to stop the iterative adjustment of Polynomial Coefficients when you use
the Least Absolute Residual or Bisquare methods. For the Least Absolute Residual method, if the
relative difference between residue in two successive iterations is less than tolerance, it returns the
resulting Polynomial Coefficients. For the Bisquare method, if any relative difference between
Polynomial Coefficients in two successive iterations is less than tolerance, it returns the resulting
Polynomial Coefficients.
If tolerance is less than or equal to 0, tolerance automatically sets to 0.0001.
Method: Specifies the fitting method:
Least Square
Least Absolute Residual
Bisquare
Apply measurement on: Specifies the range for the measurement.
Two options exist for the measurement:
Entire waveform
55
© RAFA Solutions, 2014
DAnS User Manual
Selected range of waveform
If the first option is selected, measurement is applied to the entire waveform, regardless of what is
viewed, or selected with graph cursors.
If the second option is selected, measurement is applied only to the X range selected with the graph
cursors.
Calculation
It fits data to a polynomial function of the general form described by the following equation:
,
where f represents the output sequence Best Polynomial Fit, x is the input sequence, "a" represents
Polynomial Coefficients, and m represents polynomial order. It finds the value of a that best fits the
observations (X, Y).
The following equation specifically describes the polynomial curve resulting from the general
polynomial fit algorithm:
When you use the Least Square method, it finds the Polynomial Coefficient of polynomial model by
minimizing the residue according to the following equation:
The Least Absolute Residual and Bisquare methods are robust fitting methods. Use these methods if
outliers in the observations exist. In most cases, the Bisquare method is less sensitive to outliers than
the Least Absolute Residual method.
56
© RAFA Solutions, 2014
DAnS User Manual
When you use the Least Absolute Residual method, it finds Polynomial Coefficient of polynomial
model by minimizing residue according to the following equation:
Cubic Spline Fit
Description
Uses cubic spline fitting to smooth the waveform for the entire or selected range.
Measurement Category
Fitting
Measurement Settings
Balance parameter: Specifies the balance between the smoothness of the cubic spline fit and the
accuracy with which it fits the observations. Balance parameter must fall within the range [0, 1]. If
balance parameter is 0, the cubic spline fit is equivalent to a linear fit. If balance parameter is 1, the
cubic spline fit interpolates between the data points.
If balance parameter is out of the range [0, 1], it calculates an appropriate value for balance
parameter automatically.
Method: Specifies the fitting method:
Least Square
Least Absolute Residual
Bisquare
Apply measurement on: Specifies the range for the measurement.
Two options exist for the measurement:
Entire waveform
Selected range of waveform
If the first option is selected, measurement is applied to the entire waveform, regardless of what is
viewed, or selected with graph cursors.
If the second option is selected, measurement is applied only to the X range selected with the graph
cursors.
Calculation
Cubic fit fits the observations (X, Y) by minimizing the following function:
57
© RAFA Solutions, 2014
DAnS User Manual
where p is the balance parameter. yi is the i-th element of Y. xi is the i-th element of X. f"(x) is the
second-order derivative of the f(x) cubic spline function.
(x) is the piecewise constant function
Where
is the i-th element of smoothness.
If p = 0, the fitted model is equivalent to a linear model. If p = 1, the fitting is equivalent to cubic
spline interpolation. p must fall in the range [0, 1] to make the fitted curve both close to the
observations and smooth. The closer p is to 0, the smoother the fitted curve. The closer p is to 1, the
closer the fitted curve is to the observations.
Transforms
This group includes different transforms for the waveforms, such as Fast Fourier transform, WalshHadamard transform, Fast Hilbert transform, etc.
58
© RAFA Solutions, 2014
DAnS User Manual
Fast Fourier Transform
Description
Calculates Fast Fourier Transform (FFT) of the signal. FFT computes the discrete Fourier transform of
the signal. FFT can be computed for the entire or selected range of the signal.
Measurement Category
Transforms
Measurement Settings
Shift: Specifies whether DC component is at the center of FFT {signal}. If Shift is ON, DC component
will be at the center of FFT {signal}.
FFT Size: Specifies the length of the FFT be performed. If FFT size is less than the number of elements
in the signal, only first elements (with number equal to FFT size) are used to perform the FFT. If FFT
size is greater than the number of elements in the signal, zeros are added to the end of the signal.
Apply measurement on: Specifies the range for the measurement.
Two options exist for the measurement:
Entire waveform
Selected range of waveform
If the first option is selected, measurement is applied to the entire waveform, regardless of what is
viewed, or selected with graph cursors.
If the second option is selected, measurement is applied only to the X range selected with the graph
cursors.
Calculation
FFT computes the discrete Fourier transform (DFT) of the signal with fast Fourier transform
algorithm. Discrete Fourier transform is defined by the following equation:
for n=0, 1, 2, …, N-1 ,
where x is the input signal (sequence), N is the number of elements in input sequence, and Y is the
result of transform.
Frequency spacing (resolution) between Y components is:
,
where
is the sampling frequency.
59
© RAFA Solutions, 2014
DAnS User Manual
Fast Hilbert Transform
Description
Calculates Fast Hilbert Transform of the signal. Fast Hilbert Transform can be computed for the entire
or selected range of the signal.
Measurement Category
Transforms
Measurement Settings
Apply measurement on: Specifies the range for the measurement.
Two options exist for the measurement:
Entire waveform
Selected range of waveform
If the first option is selected, measurement is applied to the entire waveform, regardless of what is
viewed, or selected with graph cursors. If the second option is selected, measurement is applied only
to the X range selected with the graph cursors.
Calculation
The Hilbert transform of a function is given as:
The Hilbert transform is a multiplier operator. The symbol of H is
,
where sgn is the signum function.
Fourier transform of the Hilbert transform of a function x(t) is:
where
is a Fourier transform pair and
Fast Hilbert transform performs the discrete implementation of the Hilbert transform with the aid of
the fast Fourier transform routines based upon the
60
Fourier transform pair.
© RAFA Solutions, 2014
DAnS User Manual
Inverse Fast Hilbert Transform
Description
Calculates the inverse fast Hilbert Transform of the signal. Inverse Fast Hilbert Transform can be
computed for the entire or selected range of the signal.
Measurement Category
Transforms
Measurement Settings
Apply measurement on: Specifies the range for the measurement.
Two options exist for the measurement:
Entire waveform
Selected range of waveform
If the first option is selected, measurement is applied to the entire waveform, regardless of what is
viewed, or selected with graph cursors.
If the second option is selected, measurement is applied only to the X range selected with the graph
cursors.
Calculation
The inverse Hilbert transform of a function h(t) is given as:
By using Hilbert transform inverse Hilbert transform can be computed by negating the forward
Hilbert transform:
Inverse Fast Hilbert transform performs the discrete implementation of the inverse Hilbert transform
with the aid of the Hilbert transform.
Fast Hartley Transform
Description
Calculates Fast Hartley Transform (FHT) of the signal. For proper calculation of fast Hartley transform
number of elements in the input sequence should be a valid power of two. Fast Hartley transform
can be computed for the entire or selected range of the signal.
61
© RAFA Solutions, 2014
DAnS User Manual
Measurement Category
Transforms
Measurement Settings
Apply measurement on: Specifies the range for the measurement.
Two options exist for the measurement:
Entire waveform
Selected range of waveform
If the first option is selected, measurement is applied to the entire waveform, regardless of what is
viewed, or selected with graph cursors.
If the second option is selected, measurement is applied only to the X range selected with the graph
cursors.
Calculation
The Hartley transform of a function x(t) is given as:
where
.
The Hartley transform maps real-valued sequences into real-valued frequency domain sequences.
Fast Hartley transform is obtained through the discrete implementation of the Hartley integral:
for k=1,2,…. n-1, where n is the number of X elements.
Inverse Fast Hartley Transform
Description
Calculates Inverse Fast Hartley Transform (inverse FHT) of the signal. For proper calculation of inverse
fast Hartley transform number of elements in the input sequence should be a valid power of two.
Inverse fast Hartley transform can be computed for the entire or selected range of the signal.
Measurement Category
Transforms
62
© RAFA Solutions, 2014
DAnS User Manual
Measurement Settings
Apply measurement on: Specifies the range for the measurement.
Two options exist for the measurement:
Entire waveform
Selected range of waveform
If the first option is selected, measurement is applied to the entire waveform, regardless of what is
viewed, or selected with graph cursors.
If the second option is selected, measurement is applied only to the X range selected with the graph
cursors.
Calculation
The inverse Hartley transform of a function x(t) is given as:
where
.
The inverse Hartley transform maps real-valued frequency domain sequences into real-valued
sequences.
Inverse fast Hartley transform is obtained through the discrete implementation of the inverse Hartley
integral:
for k=1,2,…. n-1, where n is the number of X elements.
Walsh Hadamard Transform
Description
Calculates the real Walsh Hadamard Transform of the signal. Walsh Hadamard transform can be
computed for the entire or selected range of the signal.
Measurement Category
Transforms
Measurement Settings
Apply measurement on: Specifies the range for the measurement.
63
© RAFA Solutions, 2014
DAnS User Manual
Two options exist for the measurement:
Entire waveform
Selected range of waveform
If the first option is selected, measurement is applied to the entire waveform, regardless of what is
viewed, or selected with graph cursors.
If the second option is selected, measurement is applied only to the X range selected with the graph
cursors.
Calculation
The Walsh Hadamard transform performs an orthogonal, symmetric, involutional, linear operation on
2^m real numbers. The Walsh Hadamard transform is based on an orthogonal system consisting of
functions of only two elements -1 and 1.
If WHn and WHn+1 denote the Walsh Hadamard matrices of dimension 2^n and 2^(n+1) respectively,
then:
where –WHn is meant in the element wise sense.
Inverse Walsh Hadamard Transform
Description
Calculates the inverse of real Walsh Hadamard Transform of the signal. Inverse Walsh Hadamard
transform can be computed for the entire or selected range of the signal.
Measurement Category
Transforms
Measurement Settings
Apply measurement on: Specifies the range for the measurement.
Two options exist for the measurement:
Entire waveform
Selected range of waveform
If the first option is selected, measurement is applied to the entire waveform, regardless of what is
viewed, or selected with graph cursors.
If the second option is selected, measurement is applied only to the X range selected with the graph
cursors.
64
© RAFA Solutions, 2014
DAnS User Manual
Calculation
The inverse Walsh Hadamard transform is calculated according to the following formula:
,
where n is the length of the signal X, WHI{X} is the inverse Walsh Hadamard transform and WH{X} is
the Walsh Hadamard transform of the signal X.
Laplace Transform
Description
Calculates Laplace Transform of the signal. Laplace Transform can be computed for the entire or
selected range of the signal.
Measurement Category
Transforms
Measurement Settings
End: Specifies instant in time of the last sample. The entire sample interval is between 0 and the
specified End.
Apply measurement on: Specifies the range for the measurement.
Two options exist for the measurement:
Entire waveform
Selected range of waveform
If the first option is selected, measurement is applied to the entire waveform, regardless of what is
viewed, or selected with graph cursors.
If the second option is selected, measurement is applied only to the X range selected with the graph
cursors.
Calculation
The real Laplace transform of a real signal x(s) is given as:
for S>=0 and S real. x(t) is defined for all t>=0.
65
© RAFA Solutions, 2014
DAnS User Manual
Mathematics
This group combines mathematical calculations, such as integral and derivative.
Integral
Description
Returns the integral of the waveform for entire or selected range. The calculation of waveforms with
non-monotonic X axis can return incorrect results.
Measurement Category
Mathematics
Measurement Settings
Apply measurement on: Specifies the range for the measurement.
Two options exist for the measurement:
Entire waveform
Selected range of waveform
If the first option is selected, measurement is applied to the entire waveform, regardless of what is
viewed, or selected with graph cursors.
If the second option is selected, measurement is applied only to the X range selected with the graph
cursors.
Calculation
Integral of the curve in the selected range is the sum of the areas of rectangles, which are formed by
pairs of two neighboring x coordinates and y value corresponding to the righteous x coordinate of
that pair.
Derivative
Description
Returns the derivative of the waveform for entire or selected range.
Measurement Category
Mathematics
66
© RAFA Solutions, 2014
DAnS User Manual
Measurement Settings
Method: Specifies the method of the calculation:
2nd order
4th order
Forward
Backward
dt: Specifies the time interval of the waveform. Commonly dt is 1/dfs, where dfs is the sampling
frequency.
Apply measurement on: Specifies the range for the measurement.
Two options exist for the measurement:
Entire waveform
Selected range of waveform
If the first option is selected, measurement is applied to the entire waveform, regardless of what is
viewed, or selected with graph cursors.
If the second option is selected, measurement is applied only to the X range selected with the graph
cursors.
Calculation
The formula of the derivatives for four different ways of calculations is shown below:
2nd order
4th order
Forward
67
© RAFA Solutions, 2014
DAnS User Manual
Backward
Spectral Analysis
Measurements in this group perform different spectral analysis. These measurements should be
applied to the waveform in time domain.
Auto Power Spectrum
Description
Returns the auto power spectrum of the waveform for the entire or selected range.
Measurement Category
Spectral Analysis
Measurement Settings
dt: Specifies the time interval of the waveform. Commonly dt is
frequency.
, where
is the sampling
Apply measurement on: Specifies the range for the measurement.
Two options exist for the measurement:
Entire waveform
Selected range of waveform
If the first option is selected, measurement is applied to the entire waveform, regardless of what is
viewed, or selected with graph cursors.
If the second option is selected, measurement is applied only to the X range selected with the graph
cursors.
Calculation
Calculates the auto spectrum of the waveform using the fast Fourier transformation of the signal and
complex conjugate of FFT using formula:
68
© RAFA Solutions, 2014
DAnS User Manual
,
where n is the number of points in the signal, FFT is the fast Fourier transformation and «*»
indicates the complex conjugate.
Power Spectrum
Description
Returns the power spectrum of the waveform for the entire or selected range.
Measurement Category
Spectral Analysis
Measurement Settings
dt: Specifies the time interval of the waveform. Commonly dt is
frequency.
, where
is the sampling
Apply measurement on: Specifies the range for the measurement.
Two options exist for the measurement:
Entire waveform
Selected range of waveform
If the first option is selected, measurement is applied to the entire waveform, regardless of what is
viewed, or selected with graph cursors.
If the second option is selected, measurement is applied only to the X range selected with the graph
cursors.
Calculation
Calculates the spectrum of the waveform using the fast Fourier transformation of the input signal
with following formula:
,
where n is the number of points in the input signal, and F(X) is the Fourier transform of the X
function.
69
© RAFA Solutions, 2014
DAnS User Manual
Phase Spectrum
Description
Returns the phase spectrum of the waveform for the entire or selected range.
Measurement Category
Spectral Analysis
Measurement Settings
dt: Specifies the time interval of the waveform. Commonly dt is
frequency.
, where
is the sampling
Unwrap phase: Enables the option of phase unwrapping. The default value is ON.
Apply measurement on: Specifies the range for the measurement.
Two options exist for the measurement:
Entire waveform
Selected range of waveform
If the first option is selected, measurement is applied to the entire waveform, regardless of what is
viewed, or selected with graph cursors.
If the second option is selected, measurement is applied only to the X range selected with the graph
cursors.
Calculation
Phase spectrum is calculated by taking the exponential part of the calculated one sided spectrum.
Cross Power Spectrum
Description
Returns the power spectrum of the two crossed waveforms for entire or selected range.
Measurement Category
Spectral Analysis
Measurement Settings
dt: Specifies the time interval of the waveform. Commonly dt is
frequency.
70
, where
is the sampling
© RAFA Solutions, 2014
DAnS User Manual
Apply measurement on: Specifies the range for the measurement.
Two options exist for the measurement:
Entire waveform
Selected range of waveform
If the first option is selected, measurement is applied to the entire waveform, regardless of what is
viewed, or selected with graph cursors.
If the second option is selected, measurement is applied only to the X range selected with the graph
cursors.
Calculation
Calculates the spectrum of the waveform generated by crossing two input signals. The spectrum is
calculated by the following formula:
,
where N is the number of points in the input signal. If the input signals are of different lengths then
the program will fill the shorter data with zeroes to make the two signals the same length. In that
case N is the number of points after the shorter signal has been filled with zeroes.
Amplitude Spectrum
Description
Returns the magnitude of the power spectrum of the waveform for the entire or selected range.
Measurement Category
Spectral Analysis
Measurement Settings
dt: Specifies the time interval of the waveform. Commonly dt is
frequency.
, where
is the sampling
Unwrap phase: Enables the option of phase unwrapping. The default value is ON.
Apply measurement on: Specifies the range for the measurement.
Two options exist for the measurement:
Entire waveform
Selected range of waveform
71
© RAFA Solutions, 2014
DAnS User Manual
If the first option is selected, measurement is applied to the entire waveform, regardless of what is
viewed, or selected with graph cursors.
If the second option is selected, measurement is applied only to the X range selected with the graph
cursors.
Calculation
Magnitude of the power spectrum is calculated by taking the real part of the power spectrum.
Time Domain Measurements
Measurements in this group are for calculations which refer to time domain. Time domain
measurements include transition, period, frequency calculation, etc.
For correct results, these measurements should be applied on the waveform for which Time is
selected as X axis.
Period
Description
Measures Period of the periodic waveform between adjacent reference level crossings in the same
direction in the entire or selected range. Period can be measured for all or selected pulses.
Measurement Category
Time Domain
Measurement Settings
Calculate for: Specifies pulses for which measurement should be done.
Two options exist for the measurement:
All Pulses
Pulse Number
If the first option is selected, period is calculated for all pulses. If the second option is selected, period
is calculated for the selected pulse.
Reference Level (%): Specifies the middle reference level of the waveform in percent, required to
determine period. Percentage is defined relative to the topline levels.
Apply measurement on: Specifies the range for the measurement.
Two options exist for the measurement:
72
© RAFA Solutions, 2014
DAnS User Manual
Entire waveform
Selected range of waveform
If the first option is selected, measurement is applied to the entire waveform, regardless of what is
viewed, or selected with graph cursors.
If the second option is selected, measurement is applied only to the X range selected with the graph
cursors.
Calculation
Period is calculated by finding two consecutive edges of the waveform with the same polarity. Period
is the difference in time between reference crossings of the two adjacent edges.
Example of the period calculation is shown with 50% reference level.
Frequency
Description
Measures Frequency of the periodic waveform between adjacent reference level crossings in the
same direction in the entire or selected range. Frequency can be measured for all or selected pulses.
Measurement Category
Time Domain
Measurement Settings
Calculate for: Specifies pulses for which measurement should be done.
Two options exist for the measurement:
All Pulses
Pulse Number
If the first option is selected, frequency is calculated for all pulses. If the second option is selected,
frequency is calculated for the selected pulse.
73
© RAFA Solutions, 2014
DAnS User Manual
Reference Level (%): Specifies the middle reference level of the waveform in percent, required to
determine frequency. Percentage is defined relative to the topline levels.
Apply measurement on: Specifies the range for the measurement.
Two options exist for the measurement:
Entire waveform
Selected range of waveform
If the first option is selected, measurement is applied to the entire waveform, regardless of what is
viewed, or selected with graph cursors.
If the second option is selected, measurement is applied only to the X range selected with the graph
cursors.
Calculation
Frequency is calculated as the reciprocal of the period. Period is calculated by finding two
consecutive edges of the waveform with the same polarity. Period is the difference in time between
reference crossings of the two adjacent edges.
Example of frequency calculation is shown with 50% reference level.
Duty Cycle
Description
Measures Duty Cycle of the periodic waveform in the entire or selected range. Duty Cycle can be
measured for all or selected pulses.
Measurement Category
Time Domain
74
© RAFA Solutions, 2014
DAnS User Manual
Measurement Settings
Calculate for: Specifies pulses for which measurement should be done.
Two options exist for the measurement:
All Pulses
Pulse Number
If the first option is selected, duty cycle is calculated for all pulses. If the second option is selected,
duty cycle is calculated for the selected pulse.
Reference Level (%): Specifies the middle reference level of the waveform in percent, required to
determine duty cycle. Percentage is defined relative to the topline levels.
Apply measurement on: Specifies the range for the measurement.
Two options exist for the measurement:
Entire waveform
Selected range of waveform
If the first option is selected, measurement is applied to the entire waveform, regardless of what is
viewed, or selected with graph cursors.
If the second option is selected, measurement is applied only to the X range selected with the graph
cursors.
Calculation
Duty cycle is calculated as the ration of the positive pulse width to the period of the waveform.
Period is calculated by finding two consecutive edges of the waveform with the same polarity. Period
is the difference in time between reference crossings of the two adjacent edges.
Positive pulse width is calculated as the difference in time between reference level crossing of a rising
edge and reference level crossing of the next falling edge of the waveform.
Example of the duty cycle calculation is shown with 50% reference level.
75
© RAFA Solutions, 2014
DAnS User Manual
Positive Pulse Width
Description
Measures duration of the positive pulse of the waveform for the entire or selected range. Pulse width
is the time difference between reference level crossings of the two adjacent edges of the pulse. Pulse
width can be measured for all or selected pulses.
Measurement Category
Time Domain
Measurement Settings
Calculate for: Specifies pulses for which measurement should be done.
Two options exist for the measurement:
All Pulses
Pulse Number
If the first option is selected, width is calculated for all pulses. If the second option is selected, width
is calculated for the selected pulse.
Reference Level (%): Specifies the middle reference level of the waveform in percent, required to
determine pulse width. Percentage is defined relative to the topline levels.
Apply measurement on: Specifies the range for the measurement.
Two options exist for the measurement:
Entire waveform
Selected range of waveform
If the first option is selected, measurement is applied to the entire waveform, regardless of what is
viewed, or selected with graph cursors.
If the second option is selected, measurement is applied only to the X range selected with the graph
cursors.
Calculation
Pulse width for the positive pulse is calculated as the difference in time between reference level
crossing of a rising edge and reference level crossing of the next falling edge of the waveform. Pulse
width is calculated by finding two consecutive edges of the waveform.
Example of the positive pulse width calculation is shown with 50% reference level.
76
© RAFA Solutions, 2014
DAnS User Manual
Negative Pulse Width
Description
Measures duration of the negative pulse of the waveform for the entire or selected range. Pulse
width is the time difference between reference level crossings of the two adjacent edges of the
pulse. Pulse width can be measured for all or selected pulses.
Measurement Category
Time Domain
Measurement Settings
Calculate for: Specifies pulses for which measurement should be done.
Two options exist for the measurement:
All Pulses
Pulse Number
If the first option is selected, width is calculated for all pulses. If the second option is selected, width
is calculated for the selected pulse.
Reference Level (%): Specifies the middle reference level of the waveform in percent, required to
determine pulse width. Percentage is defined relative to the topline levels.
Apply measurement on: Specifies the range for the measurement.
Two options exist for the measurement:
Entire waveform
Selected range of waveform
If the first option is selected, measurement is applied to the entire waveform, regardless of what is
viewed, or selected with graph cursors.
If the second option is selected, measurement is applied only to the X range selected with the graph
cursors.
77
© RAFA Solutions, 2014
DAnS User Manual
Calculation
Pulse width for the negative pulse is calculated as the difference in time between reference level
crossing of a rising edge and reference level crossing of the next falling edge of the waveform. Pulse
width is calculated by finding two consecutive edges of the waveform.
Example of the negative pulse width calculation is shown with 50% reference level.
Rise Time
Description
Measures Rise time of the waveform between selected high and low reference levels for the entire or
selected range. Rise time can be measured for all or selected pulses.
Measurement Category
Time Domain
Measurement Settings
Calculate for: Specifies pulses for which measurement should be done.
Two options exist for the measurement:
All Pulses
Pulse Number
If the first option is selected, rise time is calculated for all pulses. If the second option is selected, rise
time is calculated for the selected pulse.
High Reference Level (%): Specifies the high reference level of the waveform in percent, required to
determine transition interval. Percentage is defined relative to the topline levels. High reference level
crossing defines the end of a rising transition interval.
Low Reference Level (%): Specifies the low reference level of the waveform in percent, required to
determine transition interval. Percentage is defined relative to the baseline levels. Low reference
level crossing defines the start of a rising transition interval.
Apply measurement on: Specifies the range for the measurement.
78
© RAFA Solutions, 2014
DAnS User Manual
Two options exist for the measurement:
Entire waveform
Selected range of waveform
If the first option is selected, measurement is applied to the entire waveform, regardless of what is
viewed, or selected with graph cursors.
If the second option is selected, measurement is applied only to the X range selected with the graph
cursors.
Calculation
Rise time is calculated by finding crossing with the high and low reference levels of the waveform.
Rise time is the time duration from when the waveform crosses the low reference level until it
crosses the high reference level.
Example of rise time calculation is shown with 10% and 90% low and high reference levels
respectively.
Fall Time
Description
Measures Fall time of the waveform between selected high and low reference levels for the entire or
selected range. Fall time can be measured for all or selected pulses.
Measurement Category
Time Domain
Measurement Settings
Calculate for: Specifies pulses for which measurement should be done.
Two options exist for the measurement:
All Pulses
Pulse Number
79
© RAFA Solutions, 2014
DAnS User Manual
If the first option is selected, fall time is calculated for all pulses. If the second option is selected, fall
time is calculated for the selected pulse.
High Reference Level (%): Specifies the high reference level of the waveform in percent, required to
determine transition interval. Percentage is defined relative to the topline levels. High reference level
crossing defines the start of a falling transition interval.
Low Reference Level (%): Specifies the low reference level of the waveform in percent, required to
determine transition interval. Percentage is defined relative to the baseline levels. Low reference
level crossing defines the end of a falling transition interval.
Apply measurement on: Specifies the range for the measurement.
Two options exist for the measurement:
Entire waveform
Selected range of waveform
If the first option is selected, measurement is applied to the entire waveform, regardless of what is
viewed, or selected with graph cursors.
If the second option is selected, measurement is applied only to the X range selected with the graph
cursors.
Calculation
Fall time is calculated by finding crossing with the high and low reference levels of the waveform. Fall
time is the time duration from when the waveform crosses the high reference level until it crosses
the low reference level.
Example of fall time calculation is shown with 10% and 90% low and high reference levels
respectively.
80
© RAFA Solutions, 2014
DAnS User Manual
Slew Rate
Description
Measures Slew Rate of the specified edge of the waveform between selected high and low reference
levels for the entire or selected range. Slew Rate can be measured for all or selected pulses.
Measurement Category
Time Domain
Measurement Settings
Calculate for: Specifies pulses for which measurement should be done.
Two options exist for the measurement:
All Pulses
Pulse Number
If the first option is selected, slew rate is calculated for the specified edges of all pulses. If the second
option is selected, slew rate is calculated for the edge of the selected pulse.
Edge: Specifies the direction of the transition for which slew rate measurement should be done.
Two options exist for the measurement:
Rising
Falling
If the first option is selected, slew rate is calculated for rising edges. If the second options is selected,
slew rate is calculated for the falling edges.
High Reference Level (%): Specifies the high reference level of the waveform in percent, required to
determine transition interval. Percentage is defined relative to the topline levels. High reference level
crossing defines the end of a rising transition interval and the start of a falling transition interval.
Low Reference Level (%): Specifies the low reference level of the waveform in percent, required to
determine transition interval. Percentage is defined relative to the baseline levels. Low reference
level crossing defines the start of a rising transition interval and the end of a falling transition interval.
Apply measurement on: Specifies the range for the measurement.
Two options exist for the measurement:
Entire waveform
Selected range of waveform
If the first option is selected, measurement is applied to the entire waveform, regardless of what is
viewed, or selected with graph cursors.
81
© RAFA Solutions, 2014
DAnS User Manual
If the second option is selected, measurement is applied only to the X range selected with the graph
cursors.
Calculation
Slew rate is calculated as the difference between the high and low reference levels of the waveform
divided by the transition time of the edge. Transitions are defined by finding crossing with the high
and low reference levels of the waveform.
Example of slew rate calculation is shown for rising edge with 10% and 90% low and high reference
levels respectively.
Delay
Description
Measures Delay between the specified edges of two waveforms for the entire or selected range.
Delay is the time difference between reference level crossings of the two consecutive edges of the
two waveforms with the same polarity. Delay can be measured for all or selected pulses.
Measurement Category
Time Domain
Measurement Settings
Calculate for: Specifies pulses for which measurement should be done.
Two options exist for the measurement:
All Pulses
Pulse Number
82
© RAFA Solutions, 2014
DAnS User Manual
If the first option is selected, delay is calculated for all pulses of two waveforms. If the second option
is selected, delay is calculated for the selected pulses of two waveforms.
Edge: Specifies the direction of the edges for which delay measurement should be done.
Two options exist for the measurement:
Rising
Falling
If the first option is selected, delay is calculated between rising edges of two waveforms. If the
second option is selected, delay is calculated between falling edges of two waveforms.
Reference Level (%): Specifies the middle reference level of the waveform in percent, required to
determine delay. Percentage is defined relative to the topline levels.
Apply measurement on: Specifies the range for the measurement.
Two options exist for the measurement:
Entire waveform
Selected range of waveform
If the first option is selected, measurement is applied to the entire waveform, regardless of what is
viewed, or selected with graph cursors.
If the second option is selected, measurement is applied only to the X range selected with the graph
cursors.
Calculation
Delay is calculated as the difference in time between reference level crossing of a specified polarity
edge of the first waveform and reference level crossing of the same polarity edge of the second
waveform. Delay is calculated by finding two consecutive edges of the same polarity for two
waveforms.
Example of the delay calculation is shown for the rising edges with 50% reference level.
83
© RAFA Solutions, 2014
DAnS User Manual
Release Notes
1. Excel File Format
In the new version the program supports also files in Excel format.
2. Updated Menu Bar
2.1. Options - Open and Recent Files
New options Open and Recent Files are added to the menu bar in Data Analysis Window. A file can be
opened from the Data Analysis Window in the following way: File>Open. Recent Files: the program allows to
open one of the recent files.
2.2. Options - Show Context Help Window
The new option Show Context Help Window is added to the menu bar in Data Analysis Window. It displays
short description of object functions.
84
© RAFA Solutions, 2014
DAnS User Manual
Software License and Evaluation
You can use the software without activation for 15 days for evaluation purposes. In this case you will
see notification of days left each time you start the software.
To activate software you should click the “Activate” button. The following window will be opened.
85
© RAFA Solutions, 2014
DAnS User Manual
Enter the Serial Number, which you were provided. If entered serial number is correct, the following
window will be opened for final activation. Shown code should be sent to the provided email address
to get activation code.
If entered activation code is correct, the following window will appear.
86
© RAFA Solutions, 2014
DAnS User Manual
License Agreement
END-USER LICENSE AGREEMENT
THIS END-USER LICENSE AGREEMENT ("AGREEMENT") IS A LEGAL AGREEMENT BETWEEN YOU AND
THE LICENSOR.
YOU AGREE TO BE BOUND BY THE TERMS OF THIS AGREEMENT BY INSTALLING, COPYING, OR
OTHERWISE USING THE PRODUCT AS SET FORTH IN THIS AGREEMENT. IF YOU DO NOT AGREE WITH
THE TERMS OF THIS AGREEMENT, YOU SHOULD NOT INSTALL OR USE THE PRODUCT.
BY INSTALLING, COPYING, OR USING THE UPDATES OF THE PRODUCT (''UPDATES''), IF ANY, YOU
AGREE TO BE BOUND BY THE ADDITIONAL LICENSE TERMS THAT MAY ACCOMPANY SUCH UPDATES.
IF YOU DO NOT AGREE TO THE ADDITIONAL LICENSE TERMS THAT ACCOMPANY SUCH UPDATES, YOU
SHOULD NOT INSTALL, COPY, OR USE SUCH UPDATES.
1. Definitions. As used herein, the following terms have the following meanings:
1.1. “You” or “Licensee” means the end user who legally received access to use the Software and the
Product in accordance with the terms and conditions set forth herein.
1.2. “Licensor” means RAFA Solutions.
1.3. “Software” means the computer software provided to You by Licensor in accordance with the
terms and conditions set forth herein.
1.4. “Product” means and includes the Software and all related printed or electronic materials,
documentation, patches and fixes that may be provided or made available to You by Licensor.
1.5. “Permitted Purpose” means the right to use the Product or any portion thereof in accordance
with the terms and conditions of this Agreement solely for the internal use of the Licensee.
2. License Grant. Licensor hereby grants to You and You hereby accept a limited, revocable, nonexclusive, non-transferable, non-assignable, non-sublicenseable license (hereinafter “License”) to:
2.1. access and use the Product or any portion thereof solely for the Permitted Purpose;
2.2. modify and create derivative works of the Software solely for the Permitted Purpose.
3. License Restrictions. The License is subject to the restrictions below. In particular, You are not
allowed to:
3.1. alter any copyright, trademark or patent notice in the Product;
3.2. use Developer’s trademark/s in any way and for any purpose;
3.3. include the Product or any portion thereof in any malicious, deceptive or unlawful programs; or
3.4. distribute, provide access to or otherwise make the Product (as is or modified in accordance with
the terms and conditions set forth herein) available to any third party.
87
© RAFA Solutions, 2014
DAnS User Manual
3.5. work around any technical limitations in the Software;
3.6. reverse engineer, decompile or disassemble the Software, except and only to the extent that this
Agreement expressly permits, despite this limitation;
3.7. use any components of the Product to run applications not running on the Software;
3.8. make more copies of the Product than specified in this Agreement;
3.9. disclose or distribute the Product or any portion thereof to any third party or publish them for
others to copy;
3.10. rent, lease or lend the Product and/or any developments, improvements, modifications (made
by You or Developer), further updates, upgrades thereof, notwithstanding whether they are made by
the Developer, Installer, Licensor or by You to any third party; or
3.11. use the Product in any other manner not expressly stated in the Permitted Purpose.
4. Geographic Restrictions. You are only permitted to use this Product in the geographic region
indicated on the Product, if any. You should not attempt to install and activate the Software outside
of that region.
5. Intellectual Property Rights. The Software, and all copies of the Software, are (a) owned by
Developer and protected by applicable copyright laws and international treaty provisions, and (b)
licensed only, and not sold or leased. You shall not remove or alter any copyright, patent, trademark,
or other legal notices or disclaimers that exist in the Software. All rights not expressly granted to You
herein are reserved to Developer.
6. Backup Copy. You may make one backup copy (copies) of the Software. You may use it only to
reinstall the Software.
7. Documentation. Any person that has valid access to your computer or internal network may copy
and use the documentation for your internal, reference purposes.
8. Third Party Programs. The Software may contain third party programs. The license terms with
those programs apply to your use of them.
9. Limitation on and Exclusion of Damages. No Party shall be liable for consequential damages, lost
profits, special, indirect or incidental damages. This limitation applies to anything related to the
software, services, content on third party Internet sites, or third party programs; as well as claims for
breach of contract, breach of warranty, guarantee or condition, strict liability, negligence, or other
tort to the extent permitted by applicable law. It also applies even if repair, replacement or a refund
for the Software, if any does not fully compensate you for any losses; or Licensor knew or should
have known about the possibility of the damages.
10. Limited Warranty. If you follow the instructions and the Software is properly licensed, the
Software will perform substantially as described in the Licensor’s materials that you receive in or with
the Software. The limited warranty covers the software for 90 days after acquiring by you. If you
receive supplements, updates, or replacement software during warranty period, they will be covered
for the remainder of the warranty.
11. Exclusions from Warranty. This warranty does not cover problems caused by your acts (or
failures to act), the acts of others, or events beyond the reasonable control of the Licensor.
88
© RAFA Solutions, 2014
DAnS User Manual
12. Remedy for Breach of Warranty. Licensor will, at its election, either (i) repair or replace the
Software at no charge, within the warranty term, or (ii) accept return of the product(s) for a refund of
the amount paid, if any. The developer, Licensor or installer may also repair or replace supplements,
updates and replacement software or provide a refund of the amount you paid for them, if any.
These are your only remedies for breach of the limited warranty.
13. No other Warranties. The limited warranty is the only direct warranty from the developer,
Licensor or installer. The latters give no other express warranties, guarantees or conditions and
exclude implied warranties of merchantability, fitness for a particular purpose and non-infringement.
14. Disclaimer of Warranties. The Limited Warranty referenced herein is the only express warranty
made to you and is provided in lieu of any other express warranties (if any). Except for the Limited
Warranty, Licensor and its suppliers provide the Product and support services (if any) AS IS AND WITH
ALL FAULTS, and hereby disclaim all other warranties and conditions, either express, implied, or
statutory, including, but not limited to, any (if any) implied warranties, duties or conditions of
merchantability, of fitness for a particular purpose, of accuracy or completeness of responses, of
results, of workmanlike effort, of lack of viruses, and of lack of negligence, all with regard to the
Product, and the provision of or failure to provide support services. ALSO, THERE IS NO WARRANTY
OR CONDITION OF TITLE, QUIET ENJOYMENT, QUIET POSSESSION, AND CORRESPONDENCE TO
DESCRIPTION OR NON-INFRINGEMENT.
15. EXCLUSION OF INCIDENTAL, CONSEQUENTIAL, AND OTHER DAMAGES. IN NO EVENT SHALL
LICENSOR AND/OR ITS SUPPLIERS, DISTRIBUTORS BE LIABLE FOR ANY SPECIAL, INCIDENTAL,
INDIRECT, OR CONSEQUENTIAL DAMAGES WHATSOEVER (INCLUDING, BUT NOT LIMITED TO,
DAMAGES FOR LOSS OF PROFITS OR CONFIDENTIAL OR OTHER INFORMATION, FOR BUSINESS
INTERRUPTION, FOR PERSONAL INJURY, FOR LOSS OF PRIVACY, FOR FAILURE TO MEET ANY DUTY
INCLUDING OF GOOD FAITH OR OF REASONABLE CARE, FOR NEGLIGENCE, AND FOR ANY OTHER
PECUNIARY OR OTHER LOSS WHATSOEVER) ARISING OUT OF OR IN ANY WAY RELATED TO THE USE
OF OR INABILITY TO USE THE PRODUCT, THE PROVISION OF OR FAILURE TO PROVIDE SUPPORT
SERVICES, OR OTHERWISE UNDER OR IN CONNECTION WITH ANY PROVISION OF THIS AGREEMENT,
EVEN IN THE EVENT OF THE FAULT, TORT (INCLUDING NEGLIGENCE), STRICT LIABILITY, BREACH OF
CONTRACT, OR BREACH OF WARRANTY OF LICENSOR OR ANY SUPPLIER, AND EVEN IF LICENSOR OR
ANY SUPPLIER HAS BEEN ADVISED OF THE POSSIBILITY OF SUCH DAMAGES.
16. Limitation of Liability and Remedies. Notwithstanding any damages that you might incur for any
reason whatsoever (including, without limitation, all damages referenced above and all direct or
general damages), the entire liability of Licensor and any of its suppliers, distributors under any
provision of this Agreement and your exclusive remedy for all of the foregoing (except for any
remedy of repair or replacement elected by Licensor with respect to any breach of the Limited
Warranty) shall be limited to the greater of the amount actually paid by you for the Product. The
foregoing limitations, exclusions, and disclaimers (including Sections 9 and 10 above and as stated in
the Limited Warranty) shall apply to the maximum extent permitted by applicable law, even if any
remedy fails its essential purpose.
17. Consent to use of Data. You agree that Licensor and/or its affiliates may collect and use technical
information you provide as a part of support services, if any, related to the Product. Licensor agrees
not to use this information in a form that personally identifies you.
89
© RAFA Solutions, 2014
DAnS User Manual
18. Prerelease Code. The Product or any portion thereof may be identified as prerelease code
("Prerelease Code"). Such Prerelease Code may be not at the level of performance and compatibility
of the final Product. The Prerelease Code may not operate correctly and may be substantially
modified. The grant of license to use Prerelease Code expires upon availability of the final version
(including trial version) of the Product.
19. Update License Terms. All updates shall be considered part of the Product and subject to the
terms and conditions of this Agreement. Additional license terms may accompany Updates, as
defined above. By installing, copying, or otherwise using any Update, you agree to be bound by the
terms accompanying each such Update. If you do not agree to the additional license terms
accompanying such Updates, you should not install, copy, or otherwise use such Updates.
20. Entire Agreement. This Agreement (including any addendum or amendment to this Agreement)
are the entire agreement between you and Licensor relating to the Product and the Support Services
(if any) and they supersede all prior or contemporaneous oral or written communications, proposals,
and representations with respect to the Product or any other subject matter covered by this
Agreement. To the extent the terms of any Licensor policies or programs for Support Services conflict
with the terms of this Agreement, the terms of this Agreement shall control.
21. Applicable Law. The law of the country of registration of the Licensor governs the interpretation,
execution and performance of this Agreement.
22. Termination. Without prejudice to any other rights, Licensor may cancel this Agreement if you do
not abide by the terms and conditions of this Agreement, in which case you must destroy all copies of
the Product.
90
© RAFA Solutions, 2014