1
Final Project Report Park of the Covenant Rob Mustak, Alex Wentzel, Jack Moore, Ben Shenk, Bryce Persichetti Table of Contents
1
2
3
4
5
6
7
8
Introduction
1.1 Description of Competing Solutions
1.2 Park of the Covenant System Overview
1.3 Summary of Results
System Requirements
2.1 System Intelligence
2.1.1 Video Processing
2.1.2 Networking
2.2 Security Camera
2.3 System Power
2.4 User Interfaces
2.5 Usage and Installation
2.6 Safety Considerations
Project Description
3.1 System Theory of Operation
3.2 System Block Diagram
3.3 Operation of Video Processing Algorithm
3.4 Raspberry Pi Computer
3.5 Web Application and Database Setup
3.6 Database Querying and Occupancy Calculations
3.7 Streaming the Live Video
Subsystem Integration Testing
4.1 Subsystem Testing
4.2 Meeting System Requirements
User Manual
5.1 Installation
5.2 Setup
5.3 Is the System Working?
5.4 Troubleshooting
To-Market Design Considerations
Conclusions
Appendices
8.1 Occupancy Website Code
8.2 Video Streaming Website Code (potc.ee.nd.edu:5000)
8.3 Raspberry Pi Model B Schematic
1 Introduction
Cities everywhere see issues with traffic. Congestion, pollution, and convenience
are all problems plaguing highly trafficked population centers. The focus that this group
chose to tackle was parking. Crowded city centers struggle constantly with using most
efficiently the space allocated to them for parking. The parking garage design has not
seen many changes since its invention, but one major change that has taken hold to
some degree is giving people the opportunity to best understand the occupancy of the
garage, and therefore the availability of parking.
Parking garage managements do a serviceable job of instituting systems which
serve their needs of monitoring traffic in and out of their parking garage. Counting the
number of transactions in and out of the entrances and exits of a facility allows for
accounting of the number of cars in and out of the garage at any one time, but does not
excel at serving the needs of the consumer. In the current model for most parking
facilities, information gathered is not distributed to the consumer; in fact, the systems
are often not designed to benefit the consumer to any significant degree.
Many of the modes of transportation that compete with parking structures serve
their customer by providing highly detailed information on availability, In New York City
alone a commuter can find apps for Citibike, the subway system, or Zipcars, to help
them gather options as to the availability of these methods of transportation. Driving
one’s car has less utility if the average driver has to search locally for a parking garage
with availability, then has to further search each garage for an available spot.
1.1 Description of Competing Solutions
The form of solution (or lack thereof) that many parking garages pursue takes the
form of maintaining a total count of the occupancy of each facility. Oftentimes a garage
will use this information in a binary fashion through a red/green availability indicator light
or the like to indicate parking spot vacancies. This method of solution means that if a 10
story parking garage containing 500 spaces has 498 spaces, the customer is left with
the fatiguing task of locating that spot, making it less likely that driver will bother going to
that garage again to find parking. This information is not granular enough to information
useful enough to fit the expectations of today’s tech-enabled consumer.
There is an alternative that some garages have utilized in the form of spot-byspot occupancy monitoring, these parking garages go to great lengths to install sensors
in each spot that allows them to determine the presence of cars above each individual
spot. This method often leads to a consumer being able to determine which 1 spot in a
row of 20 is available to them. The shortfall of this approach is the cost, often involving
actually altering the existing structure through boring holes for sensors, networking
those sensors together, purchasing infrastructure for each individual spot, and
maintaining the large and complex system. The relative benefit of this type of system
does not make up for the prohibitive cost of installation and maintenance.
1.2 Park of the Covenant System Overview
The solution that Park of the Covenant has embraces a middle of the road
solution. Rather than telling a consumer which specific 3 spots in 20 are vacant with a
system cost of $400 per spot, we think it more appropriate from a cost/benefit
perspective to be able to tell you that out of 20 given spots, there are 3 available. By
guiding the driver to a “zone” of available spots, the consumer can be given information
as to where to find the spot for a tenth of the cost of a slightly more granular information
system.
The way in which we have chosen to provide the consumer with this information
is through isolating “zones” of occupancy through monitoring choke points in and out of
each “zone”. By counting incoming and outgoing cars in each zone, this system can
provide as granular an approach as is needed by isolating smaller or larger zones.
Through utilizing mounted cameras and video processing, we can intelligently
determine the presence and motion of vehicles entering or leaving an area of a parking
facility. Although less granular than monitoring each spot individually, through this
sensor method the consumer can still be provided with an acceptably complete picture
of the total availability of parking spots within the entire garage.
In addition to just gathering information, Park of the Covenant also set out to
come up with a simple way in which these devices could be networked together in order
to provide a complete picture of our data to the consumer. Our design had our devices
connected through a WiFi connection, wherein the video processing happened prior to
transmission of data, allowing for a simpler WiFi subsystem to be put in place than
would be needed to stream video from multiple devices. By doing processing at the
camera side, we can send a very simple packet of information to the user, which can be
integrated with a database containing information of the parking garage’s layout. By
querying the database from a website or mobile application, any customer can easily
access the availability data from anywhere. This information can also be used at the
garage level to guide drivers to spots within the structure, allowing them to decrease
congestion and speed up transit time and decrease frustration at a cost that is
accessible to any parking facility management.
1.3 Summary of Results
We set out to design a system that could accurately determine traffic left and
right across the field of view. We created a system of 4 video processing nodes and
used them to monitor traffic in and out of the area where the senior design projects were
being presented, in order to indicate the occupancy of the poster session area. We
developed an algorithm that could be tuned to detect objects of varying size, which
allowed us to tune it to the human traffic that was passing across its field of vision
during our live test. We then networked the cameras together over WiFi to send the
information to our server and database, allowing us to analyze the information and
display it on a web accessible table indicating occupancy and recent activity in the
system.
There were some shortfalls in the system when applied to a real application such
as the one we set out to tackle. The video processing algorithm would sometimes fail to
process motion in either direction across its field of view, leading to unaccounted traffic
and inaccuracies in our measurements. We found that the system is somewhat
sensitive to placement and tuning, and that the algorithm was somewhat difficult to
adapt to a specific location through tuning the specific parameters of the algorithm,
which lead to some inaccuracy in measurement. Our one camera that did operate well
was placed differently from the other three, in that it had a wider field of view, and more
opportunity to pick up moving objects crossing in front of it.
In addition to this, the algorithm itself has some shortfalls. In a parking garage
environment, one can expect to have some degree of crossing and obstruction where
one car passes in front of another, or when two cars pass each other in opposite
directions. In our testing, we found that the developed algorithm could sometimes
accomplish the task of detecting objects moving in this fashion, but it was not quite as
accurate as we had hoped it to be.
Other errors, although minor, that we encountered were some issues in
transmitting images to our server from the cameras. The video feeds experienced
glitches at times that we did not foresee prior to the day of our testing, and we expect
could be easily fixable with more tuning of the system through which we transmitted
video (which we provided purely for testing and surveillance purposes, and was not
used for video processing in any way).
We had envisioned allowing these cameras to pan and tilt in order to give the
devices a degree of versatility. By allowing the cameras some degree of motion the
garage managers (or perhaps even the algorithm itself) could tune the position of the
camera to best detect vehicle movement. In addition, we saw a system in which these
cameras could serve a dual function as a crude security camera. This system did not
reach a level of function to be considered operational, as there were issues with
interfacing our board’s input/output pins with the servos to operate the pan/tilt
functionality.
2 System Requirements
2.1 System Intelligence
2.1.1 Video Processing
For video processing, each node has to be able to receive a video of
everything passing in front of the camera, determine whether the passing object
is a motor vehicle or non-motor vehicle, using edge detection and object size
analysis video processing functions. Also, if multiple vehicles are crossing a point
at the same time, the processor must be able to which direction both vehicles are
travelling. Also, the processor must be able to determine objects that stop in the
zone or that move at varying speeds through the zone. If the object passing is
determined to be a motor vehicle, then the video processing system needs to
determine the direction in which the motor vehicle is moving. To do this, the
algorithm must be able to determine whether an object is the same object
through multiple frames. Also, if instead people are to be tracked inside a certain
area, the parameters should be adjustable so that people can be tracked instead
of cars. If the system is tracking people, it must be able to determine how many
people are passing, whether they are moving in opposite directions, or the same
direction. To be effective, the algorithm must be able to make these calculations
whether the people passing are close in proximity or far apart from each other.
In order to accomplish this, the camera and processor must be able to
handle an adequate resolution and frame rate. A higher frame rate allows for
more accurate determinations of motion. A higher resolution allows for more
determination of whether there are multiple objects moving in the camera’s field
of view, as there will be more pixels between different moving objects, so the
parameters to detect objects can be more finely tuned. The larger the image is
and the faster the frame rate, the more processing power is required.
2.1.2 Networking
In order to determine how many cars are in each zone, we also need to
network the different processing units. Each Raspberry Pi node must
communicate to a central server via a post to a web service which tells the web
service which pi saw an event, and what the event was. The same web service
must then place all of these events into a database. The Database should be
able to store a very large amount of events. Another web service must be able to
query the database to determine the number of cars in each zone.
2.2 Security Camera
Another function of our system besides tracking cars is that it can be used as a
security camera system. Because we are already taking video of strategic choke points
in a parking garage, we could also send this video to an end user such as a security
guard. In order to do this, we must send the video that the processing algorithm is
seeing to the server which can then broadcast it to users who are authenticated to view
it. The security feed should be at a high enough resolution and frame rate so that a
human user could identify individuals. The system also should stream the video as
close to live as possible so that security personnel have an accurate idea of what is
going on in the parking garage.
2.3 System Power
The Raspberry Pis and can be powered from the wall outlets that would be
standard inside any parking garage. The Raspberry Pis require 5 V to run, but they’re
power supply converts the 120 V AC to 5 V DC required to run. The camera and Wi-Fi
dongle are all powered from the Raspberry Pi board. If necessary, we could also power
the Raspberry Pi with 5 V batteries, but this would require changing or recharging the
batteries intermittently.
2.4 User Interfaces
In a parking garage implementation, we would display the number of spots
available in each zone on a screen at the front of the parking lot. We would also want to
display this information to a website which we would host on our server. This website
should display the number of cars available in each zone so that a user can easily find a
zone with available spaces. The website should be optimized for mobile devices, as that
is the most common type of use that would access the website.
2.5 Usage and installation
Video input sources will be placed at entrances and exits to “zones” or parking
garages where traffic passes through. A zone is defined as any area with a limited
number of ways in which to enter/exit, so as to be easily monitored. These devices will
network with a central processor which analyzes data and outputs to the display
system(s). Installation of a system will be somewhat different for each garage, as
increased granularity will be provided by cutting the area in to more zones. Raspberry Pi
modules will have to be placed in an area where they could monitor the choke points for
each zone, at a range where the camera can properly view passing vehicles.
2.6 Safety Considerations
Our devices do not operate at voltages or currents that are considered
dangerous to human users, but there are safety concerns inherent in the installation of
the system into the wiring system of the parking garage, as that voltage or current could
possibly be considered dangerous to humans, so caution should be exercised in the
installation of our system. Other safety concerns involve the distraction of drivers in the
garage, the system cannot pose as a significant distraction to drivers. To avoid this, the
information display will be placed in a location where drivers will have to be stopped in
order to see it, at a location such as an entry gate or other speed-inhibiting choke point.
This will prevent any traffic incidents due to driver distraction caused by our system. We
cannot stop drivers from looking at the website when they are driving, but hope that they
only access it when they are at a stop. We hope that this website is no more distracting
than any navigational system that they would be using. The information that the user
sees would not be complex, so it would not take long to process and would not be a
major distraction. The system sensors will also be placed in locations that are
inconspicuous and will not have to be avoided by drivers, and will not cause any sort of
noises or output any light signal which could be distracting to drivers passing the system
sensors.
3 Project Description
3.1 System Theory of Operation
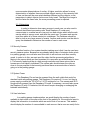
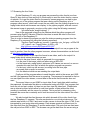
In designing our system, we decided that the information of which precise
parking spots are available is not much more useful than knowing how many spots are
available in a certain area. The figure below shows an example of this. Knowing which
two spots are available is no more useful to the user than knowing that two of those ten
spots are available. So the best way to determine how many spots are available in any
given zone is to set up choke points at the beginning and end of each zone in order to
monitor traffic in and out of each zone.
If we can calculate how many cars entered and exited any zone, then we can
determine the total occupancy of any zone. If we know the capacity of each zone, then
we can determine the number of parking spots available in a zone by subtracting the
occupancy from the capacity. The goal of the system then is to determine the
occupancy of any zone by monitoring the choke points of each zone.
To accomplish this, we place a Raspberry Pi computer and a Raspberry Pi
camera at the entrance and exit of each zone. The camera is placed in a position that it
can capture all of the motion in both directions past the choke point it is monitoring. The
camera then will see any motion past it. The Raspberry Pi computer is constantly
running a video processing algorithm that detects motion in the video feed of the
camera. The reason that we decided to do the processing locally rather than on an
external server is that we are not confident that most parking lots would have the
wireless capabilities to stream multiple video feeds at high enough resolutions to
accomplish our goals. If the video processing algorithm detects motion, it determines
whether it is a car of some other object like a human based off of the size of the object
that it detected moving. Then, it keeps track of the moving object’s position over several
frames to determine the direction that the object is moving. Whenever the video
processing program determines that an object has either entered or exited the zone, it
sends an HTTP post to a web service that is continuously listening for posts on an
external virtual private server. The post contains 2 fields, the id of the Raspberry Pi
node, and the direction that the motion was determined to be going. If the motion was in
a direction that was exiting the zone, a -1 is sent for direction. If the motion is in a
direction that was entering the zone, a 1 is sent. The database also attaches a
timestamp to each entry, so that total traffic could be queried over a certain amount of
time.
Once the web service receives the post from the camera, it sends the information
it received to the database. The web service also contains a get all function which can
get all of the entries into the database. The web service gets all of the entries, and
calculates how many cars are in each zone by using the data that was sent from the
individual nodes. Section 5.6 explains more in depth how the database is queried to
calculate the number of cars in each zone. A website hosted on the same server then
displays the occupancy information that the web service calculated. If we had a parking
lot where we knew the capacity, we could just subtract the occupancy in zone from the
capacity in each zone to get the spots available in each zone. All of this happens in real
time, so there is little latency between when the Raspberry Pi module sees the motion
and when the website displays the updated count.
Along with sending the motion detection data, we also send each frame that the
video processing program sees to the server which then broadcasts the video for
security purposes. For an actual parking lot implementation, this would be an optional
subsystem, and would only be used if the parking lot had reliable wireless internet
capable of sending multiple video feeds. The end user of the security footage would
likely be a security guard for the parking lot. At each frame, we pipe the video frame
data out of the processing program to the command line, where the AVCONVERTER
program converts the image to a usable video format, then sends the data to a listening
port on our server. The server gets this information and then broadcasts the video feed
using websockets. We broadcast the video from the server rather than the Raspberry Pi
because if multiple users tried to directly access the video feed from the Raspberry Pi
the processing unit of the Raspberry Pi would become overwhelmed and slow down
considerably. We host the website that shows the video feeds on our server, so that
anyone with access to the internet can view the video feeds. In an actual parking lot
implementation, we would only broadcast the video feeds to users who are authorized
to view the feeds.
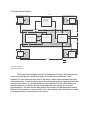
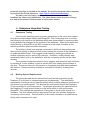
3.2 System Block Diagram
Video Feed
Camera Box
Raspberry Pi Board
Camera Box
Camera
Camera
Display Website:
4 Video Feeds
And Occupancy Results
Raspberry Pi Board
Video Feeds
Server
Occupancy Data
Post
Post
Video Feed
Post
MongoDB DataBase
Node.js Web Service
Streaming Service
Get
Video Feed
Post Post
Camera Box
Camera Box
Raspberry Pi Board
Camera
Camera
Raspberry Pi Board
Video Feed
Wireless Wired
Park of the Covenant
System Block Diagram
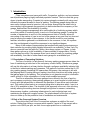
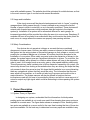
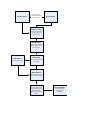
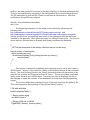
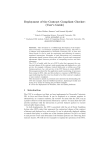
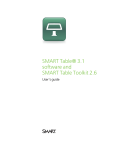
The system block diagram shows four Raspberry Pi nodes. Each can post an
event to the web service, which then stores that event into the database. Each
Raspberry Pi also sends its video feed to the server, which then broadcasts that feed
using websockets. Users that know the correct websocket ports and password can then
view the video feeds. In our demonstration, we broadcast all of the video feeds on a
website hosted on our server, but we could make this more secure for an actual
implementation. The web service also gets all the entries in the database and queries
them to find the number of cars in each zone. It then displays this information in a table
on a website which is also hosted on our server.
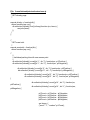
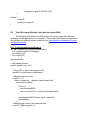
3.3 Operation of Video Processing Algorithm
The video processing was an integral part of the project. It required the detection of cars
moving across the camera’s field of view, and being able to differentiate which direction
each car was traveling. This allows for an accurate count of cars in and out of each
zone in a parking lot. The algorithm was written in Python, which is the native language
used on the Raspberry Pi, so we assumed we would be able to integrate the code onto
the Pi easier. The video processing was done through an open source computer vision
library called OpenCV, found here http://opencv.org/. The installation of this on the Pi
will be discussed in Section 5.4. In order to properly demonstrate that video processing
could be a viable solution, we used a tutorial and example from MathWorks, for
MATLAB, http://www.mathworks.com/help/vision/examples/motion-based-multipleobject-tracking.html.
This was able to give us a rough idea of the approach we should take for the algorithm.
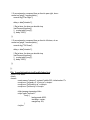
The first step was to create an object that would assigned to each moving car, as well
as one for the current blob contours.
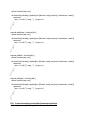
class MovingObject(object):
def
__init__(self,ID,circle,newtrackfound,lastpos,nextpos,invisiblecount,leftdirection,rightdire
ction,
leftCounted,rightCounted):
self.circle=circle
self.newtrackfound=newtrackfound
self.lastpos=lastpos
self.nextpos=nextpos
self.invisiblecount=invisiblecount
self.leftdirection=leftdirection
self.rightdirection=rightdirection
self.leftCounted=leftCounted
self.rightCounted=rightCounted
class Blob(object):
def __init__(self,distance,circle,size,trackassigned):
self.distance=distance
self.circle=circle
self.size=size
self.trackassigned=trackassigned
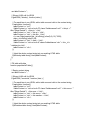
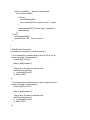
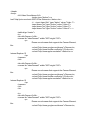
Next, the blob detection object was created. The tutorial for this we found here:
http://nbviewer.ipython.org/github/mantaraya36/201Aipython/blob/master/Computer%20vision.ipynb.
#set the blob detection parameters
params = cv2.SimpleBlobDetector_Params()
params.minDistBetweenBlobs = 5000.0
params.filterByInertia = False
params.filterByConvexity = False
params.filterByColor = False
params.filterByCircularity = False
params.filterByArea = True
params.minArea = 75.0
params.maxArea = 500.0
params.minThreshold = 40
blobdetect = cv2.SimpleBlobDetector(params)
The important things to note are minDistBetweenBlobs being set to 5000. Because of
the chokehold that the Pi placed on the processing power, we had trouble correcting the
problem when a the algorithm would see multiple blobs on a single person. We set this
parameter high to mitigate this, as the generated blobs would be too far apart to be a
single person. This did however make detecting multiple people crossing at the same
time more of an issue, but we felt this was less frequent than the other problem. The
minimum and maximum area are set here for the detection of persons in our
demonstration, however, this could be changed accordingly depending on the size of a
moving car, or for the tracking of other objects.
# Capture frame-by-frame
ret, frame = cap.read()
frame = cv2.cvtColor(frame, cv2.COLOR_BGR2GRAY)
color_image = cv2.GaussianBlur( frame, (0,0), 19 )
cv2.accumulateWeighted( frame, accum, 0.320)
difference = cv2.absdiff( frame, accum.astype(np.uint8))
keypoints = blobdetect.detect(difference)
This section captures the current frame and creates a difference image using the
background from the previous frame. It then detects all of the blobs and saves them in
the variable keypoints.
currentblob=[Blob(0,np.zeros(2),0,0)]*len(keypoints)
i=0
for kp in keypoints:
#draw the circles, and set the center points to the currentblob method
cv2.circle(difference, (int(kp.pt[0]),int(kp.pt[1])), int(kp.size), (255, 0,0), -1)
currentblob[i].circle[0]=int(kp.pt[0])
currentblob[i].circle[1]=int(kp.pt[1])
i=i+1
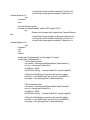
Next, the currentblob object is set to all of this frame’s detected blobs, for easy use.
for j in range(len(car)):
car[j].lastpos=car[j].circle
car[j],currentblob=findNextContour(0,currentblob,car[j],.15)
if car[j].newtrackfound==1:
car[j].circle=car[j].nextpos
if car[j].circle[0]-car[j].lastpos[0]<0:
car[j].leftdirection=car[j].leftdirection+1
if car[j].leftCounted==0 and car[j].leftdirection>10:
car[j].leftCounted=1
carcount=carcount+1
car[j].rightdirection=0
car[j].rightCounted=0
print carcount
elif car[j].circle[0]-car[j].lastpos[0]>0:
car[j].rightdirection=car[j].rightdirection+1
if car[j].rightCounted==0 and car[j].rightdirection>10:
car[j].rightCounted=1
carcount=carcount-1
car[j].leftdirection=0
car[j].leftCounted=0
print carcount
else:
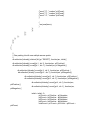
car[j].invisiblecount=car[j].invisiblecount+1
This section iterates through each car object and attempts to find the same object in the
next frame. It does this by finding the closest blob along the x-axis within 15% of the
total frame width. Next, it determines the direction of motion by taking the difference
between the two frames’ x-positions. If the difference is greater than 0, then the car is
moving left. If it is less than 0, it is moving right. The function for finding the next blob,
findNextContour, is shown below.
def findNextContour(start,blob,car,deltaP):
if len(blob)==0:
return car, blob
elif start>len(blob):
return car, blob
else:
for i in range(len(blob)):
if abs(((car.circle[0])-(blob[i].circle[0]))/320)<deltaP and blob[i].trackassigned==0:
car.nextpos=blob[i].circle
deltaP=abs(((car.circle[0])-(blob[i].circle[0]))/320)
car.newtrackfound=1
car.invisiblecount=0
blob[i].trackassigned=1
return findNextContour(i+2,blob,car,deltaP)
After determining the direction, the Pi will send either a 1 or -1, as well as its ID to the
database.
data={'pi':1,'dir':1}
data=json.dumps(data)
url='http://potc.ee.nd.edu:3000/adduser'
req=urllib2.Request(url,data,{'Content-Type':'application/json'})
f=urllib2.urlopen(req)
response=f.read()
f.close()
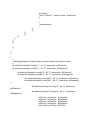
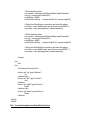
Finally, the Pi deletes all car objects that did not find a new blob for a set number of
consecutive frames, as well as creates new objects for newly detected blobs.
k=0
for i in range(len(car)):
if car[i].newtrackfound==1:
car[k]=car[i]
car[k].ID=k
k=k+1
elif car[i].invisiblecount<15:
car[k]=car[i]
car[k].ID=k
k=k+1
car=car[0:k]
#add new car
for i in range(len(currentblob)):
if currentblob[i].trackassigned==0:
car.append(MovingObject(k,currentblob[i].circle,0,0,np.zeros(2),np.zeros(2),0,0,0,0,0,0,
0,0))
k=k+1
#reset newtrackfound
for i in range(len(car)):
car[i].newtrackfound=0
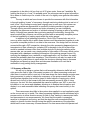
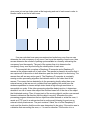
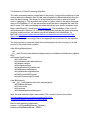
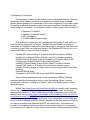
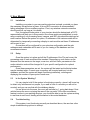
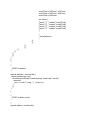
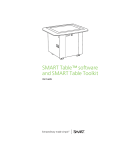
A simple block diagram of how the algorithm works is shown below.
Previous Frame
After Each loop,
current frame becomes
previous Frame
Current Frame
Difference Image
Created from subtracting current frame from previous frame
Blob Detection
Set threshold, minimum distance, minimum area, maximum area.
Blob Objects
Blobs in previous frame
Blob Objects
Save blobs detected in each frame
Blob Comparer
Match blobs from current frame to previous frame
Motion Detector
If blobs are matched for previously determined number of frames, determine direction of motion
Post to Database
Post direction and raspberry pi ID to database
3.4 Raspberry Pi Computer
The Raspberry Pi platform was chosen as our main hardware device. The main
advantage of this platform was being an inexpensive, versatile, ready designed
device—which allowed us to concentrate on the main subsystems of our project (Video
Processing and Server Operations) rather than spend significant time designing and
constructing our own boards. The hardware included in each system node consisted of:
1 Raspberry Pi Model B
1 Raspberry Pi camera module
1 WiFi usb adapter
1 5V MicroUSB wall power supply
A large amount of effort went into configuring the Raspberry Pi and getting it to
work the way we wanted for our project. Thanks to its open-source community of
developers and hobbyists, many of the tasks we wanted to accomplish had been done
in whole or in part. From our initial fresh install of the Raspbian OS, this is a list of our
major modifications in use in the final Pi iteration:
Enabled WiFi and connected to a network with WPA encryption (SDNet)
Installed and configured Motion software, our first live streaming solution
Modified network interfaces to allow hotswapping of Ethernet cable or WiFi
Compiled and installed OpenCV video processing library
Installed PiCamera library to allow Python OpenCV access to camera
Installed VNC server on Pi to allow for remote virtual desktop access
Installed AVconv package to stream video to server through websockets while
encoding
Removed Motion library
Connected to WPA2 WiFi (NDsecure) with PEAP authentication
Some of these modifications were trivial (connecting to SDNet, installing
packages) and this documentation will not cover the methods utilized. However,
configuration of Motion, compilation of OpenCV and virtual desktop access will be
discussed below.
Motion (http://www.lavrsen.dk/foswiki/bin/view/Motion) was the video streaming
solution for our system until the piping method through AVconv was developed as
documented in section 5.7. After installing the package, the program was configured
based heavily from this (http://www.instructables.com/id/Raspberry-Pi-as-low-cost-HDsurveillance-camera/?ALLSTEPS) tutorial, with our own tweaks. Framerate and
resolution were adjusted for streaming as close to live as possible, and the video was
sent to a local IP address in MJPEG format—viewable on the local network as long as
you were in a browser that supported MJPEG, we used Firefox. This stream was
suitable for our implementation at the time, but as we discovered, only one program
could access the Pi camera at a time, which meant that the video processing algorithm
could not run at the same time as the Motion stream, leading to our abandonment of
this method.
OpenCV, as discussed above in the Video Processing section, is the opensource video processing library we used in our system. To include this library in our
python code, it needed to be compiled directly on the Raspberry Pi. The compilation
process drew from this example (http://robertcastle.com/2014/02/installing-opencv-on-araspberry-pi/) with our own modifications. OpenCV 2.4.8 was the version we installed,
options we changed from the above example were including C and Python examples to
get an idea of the Pi processing power. Other changes included switching version
numbers around to coincide with newer dependencies installed before compiling and
including the QT library in case we wanted to make a GUI at any point on-device.
Compilation took around 10 hours, due to the limited processing power of the Pi, and
the final library size was roughly 1.6 GB.
Virtual desktop access was a fairly simple process when compared to OpenCV
compilation, but we grew to find the functionality extremely important. As the Pi only has
2 USB ports, and 1 is usually in use from the WiFi adaptor, having a mouse and
keyboard accessible at all times without swapping plugs constantly was a huge time
saver. The package installed on the Pi is tightVNC, and once logged into the board, to
start the virtual desktop the command is:
vncserver :X where X is the port number to access, usually 1.
After installing a VNC viewer on your own machine (we used xTightVNCviewer for
Ubuntu Linux) the Pi desktop can be seen and interacted with exactly as if you are
directly controlling it.
Other major modifications were tested on the Pi and discarded after it was
determined they did not suit our needs, or didn’t work. These include:
External USB webcam access in OpenCV
Compilation and installation of video library FFMPEG
Installation and configuration of ServoBlaster and RPIO packages, to control
servos
Attempts to overclock the processor and RAM on the board
Finally, full schematics of the Raspberry Pi model B are included in the Appendix.
3.5 Web Application and Database Setup
The creation of a website was needed to display the current occupancy of a
parking zone in a format that can be viewed easily from any browser, whether on a
laptop or mobile device. Also, the site would allow for the 4 video streams from the
Raspberry Pi’s to be viewed in real time. To accomplish this, a Debian Linux server on
campus with a host name of potc.ee.nd.edu was setup with 10 GB of storage space.
Node.js was chosen as the platform for development of the web application and
MongoDB was selected as the database software that would track all traffic events that
would later be processed to determine occupancy. Both Node.js and MongoDB are
relatively new tool s but are quickly growing in popularity. The fact that they are both
JavaScript based made for simpler integration.
Using SSH to access the server, Node.js (version 0.10.16) and Express were
first installed on the server following the instructions as seen in the link below. The
section regarding the installation of Socket.io was skipped.
https://www.digitalocean.com/community/articles/how-to-install-express-a-node-jsframework-and-set-up-socket-io-on-a-vps
The website created through these instructions is listening on port 3000. Later
on, our final website continues to be viewable on the ND network on port 3000 at
potc.ee.nd.edu:3000. After logging into the server and navigating to the desired project
directory, the web application is started with the following commands:
$nvm use 0.10.16
$node app.js
Once the application development was coming to a close, we needed to have the
web application running even when we were not logged into the server. The following
commands were used to install the necessary software, run an app indefinitely, and
stop it.
$npm install forever –g
$forever start app.js
$forever stop app.js
MongoDB (version 2.4.9) was then installed following the instructions at:
http://docs.mongodb.org/manual/tutorial/install-mongodb-on-debian/ To use MongoDB,
the commands issued to access the created database are:
$mongo
$use potc
Because the database needed to be always accessible to the Raspberry Pi’s that
would access it through the server, the REST interface needed to be enabled. In
addition, the data needed to be stored in the same directory as the web application files.
This was accomplished by navigating to the configuration file at vim/etc/mongodb.conf.
The file was edited so that the first 2 lines of code read as follows below. After this
modification, MongoDB was restarted.
dbpath = /home/bshenk/potctest/data
rest = true
The beginning framework for the website was created by referencing the
following sites:
http://cwbuecheler.com/web/tutorials/2013/node-express-mongo/ and
http://cwbuecheler.com/web/tutorials/2014/restful-web-app-node-express-mongodb/
Several modifications and additions were made to this framework with the final code
viewable in the appendix. Much effort was spent on editing the user.js file. The function
shown below is included here to illustrate how Node.js accesses the database.
/*
* GET all the documents in the driveby collection and put into an array.
*/
exports.driveby = function(db) {
return function(req, res) {
db.collection('driveby').find().toArray(function (err, items) {
res.json(items);
})
}
};
This function is passed the database as a parameter and is told to return data in
JSON format. “driveby” is the collection (table) in the database where all the events are
stored. The .find().toArray(function (err, items)) command returns all documents in the
collection as an array and this array is stored in “items.” The res.json(items) command
finally sends the array as a JSON object. The array can then be displayed on the on
the webpage to show the contents of the database in a much more visually appealing
format.
The function below demonstrates the part of the code located in the global.js file.
This code segment is the beginning of the populateTable() function.
// Fill table with data
function populateTable() {
// Empty content string
var tableContent = '';
// jQuery AJAX call for JSON
$.getJSON( '/driveby', function( data ) {
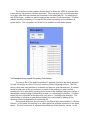
The final line of code segment shown above is where the JSON is received after
it was sent by the previous function discussed. The code goes on to actually add data
to an html table that was created and formatted in the index.jade file. For each item in
the JSON object, a table row and the appropriate number of cells are added. The final
website showing occupancy of a zone and the event log making up the database is
shown below. The occupancy and event log is updated on each page refresh.
3.6 Database Querying and Occupancy Calculations
The user.js file of the website contained 3 separate functions that were designed
to track occupancy in a few of the most common parking lot/garage setups. The first
setup is that were each parking lot is distinct and has only one entrance/exit. A camera
would be stationed at this one entrance for each of the parking lots and a vehicle
entering the lot is recorded by sending a document to the database listing the number of
the camera corresponding to the parking lot and a +1 indicating the direction. A vehicle
exiting the lot is recorded in the same way, only with a -1 indicating the direction. The
total number of vehicles in each distinct parking lot is calculated by adding all the
direction values corresponding to a particular lot.
The second setup was the one used for the final project demonstration in Stinson
Remick. In this setup, the parking lot or other space has multiple entrances to the same
space. The total occupancy is computed by adding up all the direction values. In this
case, it does not matter which camera records an event. All that matters is that the
Raspberry Pi is setup so that a +1 is sent when the camera tracks a vehicle (or person)
entering a space and a -1 is sent when the camera tracks a vehicle or person exiting the
space.
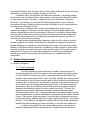
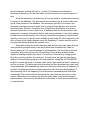
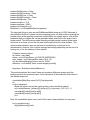
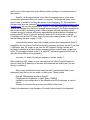
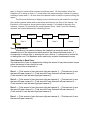
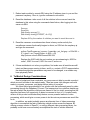
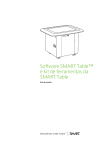
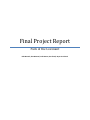
The third and final setup is slightly more involved and is well suited for a multiple
floor parking garage where each zone being monitored is one floor of the garage. An
illustration of this setup is shown below where camera 1 is located at the main floor
entrance, camera 2 is located at the ramp between floors 1 and 2, and the following
cameras are located between the remaining floors.
Camera 1
Camera 2
Zone 1
Camera 3
Zone 2
Camera 4
Zone 3
Zone 4
Theory of Operation:
Whenever a car passes a camera, the raspberry pi computer sends to the
database the id of the camera and which direction the camera detected motion. A 1
corresponds to motion right, or entering the zone, while a -1 corresponds to motion left,
or leaving the zone. The database stores each entry and also timestamps the entry.
Total Quantity in Each Zone:
The total amount of cars is calculated by totaling the amount of cars that entered a zone
minus the amount of cars that left a zone.
For each zone this corresponds to:
Zone 1 = (Total amount of cars that went right past camera 1) – (Total amount of cars
that went left past camera 1) + (Total amount of cars that went left past camera 2) –
(Total amount of cars that went right past camera 2).
Zone 2 = (Total amount of cars that went right past camera 2) – (Total amount of cars
that went left past camera 2) + (Total amount of cars that went left past camera 3) –
(Total amount of cars that went right past camera 3).
Zone 3 = (Total amount of cars that went right past camera 3) – (Total amount of cars
that went left past camera 3) + (Total amount of cars that went left past camera 4) –
(Total amount of cars that went right past camera 4).
Zone 1 = (Total amount of cars that went right past camera 4) – (Total amount of cars
that went left past camera 4);
3.7 Streaming the Live Video
On the Raspberry Pi, only one program can access the video feed at one time.
OpenCV also does not have any built in functionality to send the video feed to a server
or website. So to get the video feed for the security camera purposes, we had to pipe
each frame out of the python program that was running on the Raspberry pi to a
program called avconv, which can convert the raw video from the python program to an
mpeg1video which web browsers can display. In the python program, after we convert
the camera image to grayscale, we pipe out the video using the following command.
“sys.stdout.write( image.tostring() ).”
Here is the grayscale image from the camera which the python program will
process using OpenCV libraries. What this line does is sends the video to the Linux
command line of the Raspberry Pi.
Then in order to stream the program we start the video processing program from the
Raspberry Pi’s command line using the following command.
“$ python FinalProgram.py | avconv –f rawvideo –pix_fmt gray –s 200x160
–r 5 –i pipe:0 –an –f mpeg1video –b 600k –r 25
http://potc.ee.nd.edu:8083/secret/200/160/”
Here | is the linux pipe symbol, which means the output from one program is the
input to another. Here the other program is avconv, whose documentation can be found
at http://libav.org/avconv.html.
–f means format, for the input the format is raw video, and for the output it is
mpeg1video which internet browsers can see.
-pix-fmt is the pixel format, which is grayscale for our purposes.
–s is the size of the image, which we were using at 200x160.
–r is the frame rate, mpeg1video’s minimum is 25 frames per second, so avconv
upscales this rate from the 5 at which the python program can process.
–i is the input, which we tell avconcv is coming from the linux pipe.
–an means that no audio is encoded.
–b is the bitrate at which we are sending the output data.
Finally we tell the program where to send the data, which is the server port 8083
and tell it the password that the server is expecting. The password is required so that no
one can hijack the video stream, or send data to the server that the server does not
want.
The server listens on port 8083 for input data. Once it gets data which matches
the password, it broadcasts the data on a websocket using port 8085. Any program that
know the url and port number to listen too can then view the video feed. Websockets
are an internet protocol which allow for real time transfer of data without the client
needing to constantly ask the server for updates. This is perfect for streaming video,
because the server can constantly and in real time send out the video data to the client
browser.
We also hosted the client browser site which showed all four video feeds from
the four Raspberry Pi cameras. This site was hosted on our virtual private server. The
website was written in HTML 5 and used a video canvas to show the video. HTML 5 can
interpreted by most major internet browsers. Each stream required a different port for
the video feed from the Raspberry Pi and the websockets. The ports that we used were
the odd ports from 8083 to 8097. The browser can get the data from the server using a
javascript script that is included on the website. We used the javascript video interpreter
we found on this GitHub depository. https://github.com/phoboslab/jsmpeg.
We had to use linux piping, and then streamed to our server which then
broadcast the videos using websockets. The video streams were very close to being
live, and all four streams could be seen in one browser window.
4 Subsystem Integration Testing
4.1
Subsystem Testing
As the server was being setup, the main subsystems on the server that needed
to be tested were between Node.js and MongoDB. First, testing was done to confirm
that Node.js could read from the database which was demonstrated by creating a table
on the website that displayed all the contents of the database. When a document was
added directly to MongoDB via an SSH connection to the server, the table on the
website would also show the added document.
The display is listed as a separate component in the block diagram because
there must be testing to make sure that Node.js shows the contents of the database in
an understandable format. This integration was tested by viewing the website on
multiple computers and on various ND networks. In addition, mobile devices were
successfully able to pull up the website for both the occupancy results and the video
streams.
The successful integration between the pi cameras and the server was confirmed
by sending all 4 video streams to potc.ee.nd.edu:5000 and viewing these streams in
real time. The server listens for the streams on 4 separate ports and then broadcasts
the streams. Camera mounting orientation could also be tested by viewing these
streams.
4.2
Meeting System Requirements
The testing showed that the camera feed could be both processed on the
Raspberry Pi’s and sent to a streaming service simultaneously. This satisfied the
requirement of having a security camera system where multiple areas can monitored on
one screen by a security guard. This also met the requirement that all the Raspberry
Pi’s be networked to one central server. The program processing the camera feed on
the Raspberry Pi could access Node.js on the server which in turn could access
MongoDB. This satisfied the requirement of being able to log all traffic events in a
database. The final website met the requirement that the user interface display the
occupancy of the zone(s). This information is also easily viewable on a mobile device
which adds convenience for users.
5 User Manual
5.1
Installation
Installing our system in your own parking structure is simple, provided you have
the necessary infrastructure in place. A strong WiFi connection is recommended if
taking advantage of the surveillance option—if not, any wireless network connection
should work fine, as long as it is reliable.
First, the optimal choke points of your structure should be determined; a POTC
representative will help you in this process. Once these points are established, a node
setup consisting of our processing board, camera, and WiFi chip should be deployed at
each location. Before the system is in place, IP addresses of the various nodes will be
determined by temporarily connecting a display to each module and these IP addresses
will be sent to you.
Our servers will be configured for your structure configuration and the web
addresses and credentials will be sent to you for viewing of the database and live
surveillance streams.
5.2
Setup
Once the system is in place and all the IP addresses of the Pi’s are known, the
processing code of each module will be tweaked. Depending on such factors as the
distance from the camera to the target, zone size, and foot traffic, parameters in the
motion detection code will be changed to fit your specific configuration for optimal
performance.
Once these parameters are set, the system will be tested and individual nodes
may be tweaked again. Current zone occupancy will be noted and input into the
database, and then the system will begin functioning indefinitely, counting and
displaying the number of open spots in each zone.
5.3
Is the System Working?
It is very simple to tell if the system is functioning correctly—since it will be set up
to detect only vehicles and not people, if you walk in front of a module you will not be
counted, and you can see that with the database display.
If a car drives into the zone, the count will increase by 1, going back down if that
vehicle leaves the zone or staying the same if the car parks. If the video surveillance
feature is active in your parking structure, you should be able to see the system working
in real time at each zone, feeding all information to the central database.
5.4
Troubleshooting
If the system is not functioning correctly as described above, the user has a few
simple troubleshooting options to attempt:
1. Reboot each module by remote SSH using the IP address given to you and the
password raspberry. Once in, type the command sudo reboot.
2. Reset the database—take count of all the vehicles in the zone and reset the
database to this value using the commands listed below, after logging into the
server via SSH:
$mongo
$use potc
$db.driveby.remove({ })
$db.driveby.insert({pi: RESET, dir: XX})
Replace XX by the number of vehicles you want to reset the zone to.
3. Reset the cameras—sometimes when there is heavy motion activity the
surveillance camera functionality begins to distort, so SSH into the raspberry pi
and type the command:
python FinalProgram.py | avconv –f rawvideo –pix_fmt gray –s 200x160 –r
5 –i pipe:0 –an –f mpeg1video –b 500k –r 25
http://potc.ee.nd.edu:XXXX/secret/200/160/
Replace the XXXX with the port number you are streaming to, 8083 for
zone 1, 8087 for zone 2, 8091 for zone 3, and so on.
4. If these methods do not solve your problem, first make sure all modules are still
intact and have power running to them, and if so, contact a POTC representative,
the detection algorithm parameters may need to be changed, or a module may
have physically failed.
6 To-Market Design Considerations
Due to budget and time constraints, our group was not able to provide a product
which we could consider to be market-ready. There are some vital changes we would
make to our parts, processes, and design before taking it to market.
We found that a large shortfall in our solution was the bottleneck posed by video
processing through the Raspberry Pi board. The inexpensive Linux platform hamstrung
the rate at which the algorithm could process frames of the live video, meaning that the
algorithm had less of an opportunity to detect movement in front of it. A market ready
version of this product would absolutely feature a more powerful method of video
processing, which would give us more power to do the various processes we would like
to do.
In addition, we would probably pursue an alternate form of video processing
algorithm to accomplish the task of detecting vehicle motion across the camera. By
utilizing a newer version of OpenCV, or using a different video processing library, we
probably could have more accurately accomplished the task of vehicle detection.
The video processing hardware was not the only piece which we would have
replaced given a bigger budget. The WiFi chip we ended up using was inexpensive, and
the cost certainly reflected the performance of the part, or lack thereof. A future version
of this project would have some sort of better integrated, more powerful WiFi antenna
which would make it easier for the project to communicate quickly and reliably over the
sort of distances we could expect to see in a real-size parking garage.
There are many additions which we would also choose to make to our product
given a larger budget. We would like to include more artificial intelligence in our
algorithm, allowing the algorithm to determine which parameters best detect vehicles
across its point of view. We would also like to include a security camera alternative
function, which would allow the management to increase the safety of their facility
through the use of our system. We would also foresee the addition of a backup battery
system and independent lighting to assure functionality in low-light power outage
situations. We believe that these additions and changes add more utility to our system
and increase the robustness of our system.
7 Conclusions
The problem we set out to find a solution for is certainly one worth solving. Any city
dweller with a driver’s license can testify to the headache caused by having to scour
and scan a parking garage to find the one open space, all the while eating up, and
being charged for, precious time. We believe that any customer-driven business can
benefit from decreased frustration, necessitating some sort of system to make parking
easier, but these businesses need not pay extravagant amounts of money implementing
extra-granular occupancy monitoring systems, but can make their customers’ lives
simpler by implementing our system. A tunable algorithm that can easily process a
camera feed, sending data digitally to the customer, can easily speed up flow of traffic,
decrease customer frustration, and ultimately increase the success of a parking
structure.
8 Appendices
8.1
Occupancy Website Code (potc.ee.nd.edu:3000)
File: /home/bshenk/potctest/app.js
/*
* Module dependencies.
*/
var express = require('express');
var routes = require('./routes');
var user = require('./routes/user');
var http = require('http');
var path = require('path');
// Database
var mongo = require('mongoskin');
var db = mongo.db("mongodb://potc.ee.nd.edu:27017/potc", {native_parser:true});
var app = express();
// all environments
app.set('port', process.env.PORT || 3000);
app.set('views', path.join(__dirname, 'views'));
app.set('view engine', 'jade');
app.use(express.favicon());
app.use(express.logger('dev'));
app.use(express.json());
app.use(express.urlencoded());
app.use(express.methodOverride());
app.use(app.router);
app.use(express.static(path.join(__dirname, 'public')));
// development only
if ('development' == app.get('env')) {
app.use(express.errorHandler());
}
app.get('/', routes.index);
app.get('/driveby', user.driveby(db));
app.get('/zonetotal',user.zonetotal(db));
app.post('/adduser', user.adduser(db));
http.createServer(app).listen(app.get('port'), function(){
console.log('Express server listening on port ' + app.get('port'));
});
File: /home/bshenk/potctest/package.json
{
"name": "application-name",
"version": "0.0.1",
"private": true,
"scripts": {
"start": "node app.js"
},
"dependencies": {
"express": "3.5.1",
"jade": "*",
"mongodb": "*",
"mongoskin": "*"
}
}
File: /home/bshenk/potctest/views/index.jade
extends layout
block content
//h1= title
// Wrapper
#wrapper
h1 Occupancy
#lotstatus
table
thead
th Zone
th Number
tbody
// /Lot Status
// ADD Event
//h2 Add Event
//#addUser
// fieldset
// input#inputpi(type='number', placeholder='pi')
// input#inputdir(type='number', placeholder='dir')
// br
// button#btnAddUser Add Event
// br
// br
// br
// /ADD USER
// driveby
h2 Event Log
#driveby
table
thead
th Camera
th Direction
th Timestamp
//th Delete?
tbody
// /Parking Status
// driveby
//h2 Test Buttons
//#addUp
// button#btnAddUp Up
// /Up
//h9
// #addLeft
// button#btnAddLeft Left
//
#addRight
//
button#btnAddRight Right
// /Left & Right
//h9
//#addDown
// button#btnAddDown Down
// /Down
// /WRAPPER
File: /home/bshenk/potctest/views/layout.jade
doctype html
html
head
title= title
link(rel='stylesheet', href='/stylesheets/style.css')
body
block content
<script src='http://ajax.googleapis.com/ajax/libs/jquery/2.0.3/jquery.min.js'></script>
<script src='/javascripts/global.js'></script>
File: /home/bshenk/potctest/routes/index.js
/*
* GET home page.
*/
exports.index = function(req, res){
res.render('index', { title: 'Park of the Covenant' });
};
File: /home/bshenk/potctest/routes/user.js
/*
* GET driveby page.
*/
exports.driveby = function(db) {
return function(req, res) {
db.collection('driveby').find().toArray(function (err, items) {
res.json(items);
})
}
};
/*
* GET zone total.
*/
exports.zonetotal = function(db) {
return function(req, res) {
/*
//
// Individual parking lots with one access point
//
db.collection('driveby').count({pi:'1' , dir:'1'}, function(err, pi1Positive) {
db.collection('driveby').count({pi:'1' , dir:'-1'}, function(err, pi1Negative) {
db.collection('driveby').count({pi:'2' , dir:'1'}, function(err, pi2Positive) {
db.collection('driveby').count({pi:'2' , dir:'-1'}, function(err, pi2Negative) {
db.collection('driveby').count({pi:'3' , dir:'1'}, function(err, pi3Positive) {
db.collection('driveby').count({pi:'3' , dir:'-1'}, function(err, pi3Negative)
{
db.collection('driveby').count({pi:'4' , dir:'1'}, function(err,
pi4Positive) {
db.collection('driveby').count({pi:'4' , dir:'-1'}, function(err,
pi4Negative) {
pi1Count = pi1Positive - pi1Negative;
pi2Count = pi2Positive - pi2Negative;
pi3Count = pi3Positive - pi3Negative;
pi4Count = pi4Positive - pi4Negative;
var items = [
{"zone":"1" , "number":pi1Count},
{"zone":"2" , "number":pi2Count},
{"zone":"3" , "number":pi3Count},
{"zone":"4" , "number":pi4Count}
];
{
res.json(items);
}
});
});
});
});
});
});
});
});
}
};
*/
//
// One parking lot with one multiple access points
//
db.collection('driveby').distinct('dir',{pi: "RESET"}, function(err, initial){
db.collection('driveby').count({pi:1 , dir:1}, function(err, pi1Positive) {
db.collection('driveby').count({pi:1 , dir:-1}, function(err, pi1Negative) {
db.collection('driveby').count({pi:2 , dir:1}, function(err, pi2Positive) {
db.collection('driveby').count({pi:2 , dir:-1}, function(err, pi2Negative) {
db.collection('driveby').count({pi:3 , dir:1}, function(err, pi3Positive) {
db.collection('driveby').count({pi:3 , dir:-1}, function(err, pi3Negative) {
db.collection('driveby').count({pi:4 , dir:1}, function(err,
pi4Positive) {
db.collection('driveby').count({pi:4 , dir:-1}, function(err,
pi4Negative) {
initial = initial - 0;
pi1Count = pi1Positive - pi1Negative;
pi2Count = pi2Positive - pi2Negative;
pi3Count = pi3Positive - pi3Negative;
pi4Count = pi4Positive - pi4Negative;
totalCount = pi1Count + pi2Count + pi3Count +
pi4Count;
var items = [
{"zone":"Stinson" , "number":initial + totalCount}
];
{
res.json(items);
}
});
});
});
});
});
});
});
});
});
}
};
/*
//
// Parking garage with multiple levels and one access point between levels
//
db.collection('driveby').count({pi:'1' , dir:'1'}, function(err, pi1Positive) {
db.collection('driveby').count({pi:'1' , dir:'-1'}, function(err, pi1Negative) {
db.collection('driveby').count({pi:'2' , dir:'1'}, function(err, pi2Positive) {
db.collection('driveby').count({pi:'2' , dir:'-1'}, function(err, pi2Negative) {
db.collection('driveby').count({pi:'3' , dir:'1'}, function(err, pi3Positive) {
db.collection('driveby').count({pi:'3' , dir:'-1'}, function(err, pi3Negative)
{
db.collection('driveby').count({pi:'4' , dir:'1'}, function(err,
pi4Positive) {
db.collection('driveby').count({pi:'4' , dir:'-1'}, function(err,
pi4Negative) {
pi1Count = pi1Positive - pi1Negative;
pi2Count = pi2Positive - pi2Negative;
pi3Count = pi3Positive - pi3Negative;
pi4Count = pi4Positive - pi4Negative;
zone1Total = pi1Count - pi2Count;
zone2Total = pi2Count - pi3Count;
zone3Total = pi3Count - pi4Count;
zone4Total = pi4Count;
var items = [
{"zone":"1" , "number":zone1Total},
{"zone":"2" , "number":zone2Total},
{"zone":"3" , "number":zone3Total},
{"zone":"4" , "number":zone4Total}
];
{
res.json(items);
}
});
});
});
});
});
});
});
});
}
};
*/
/*
* POST to adduser.
*/
exports.adduser = function(db) {
return function(req, res) {
db.collection('driveby').insert(req.body, function(err, result){
res.send(
(err === null) ? { msg: '' } : { msg: err }
);
});
}
};
/*
* POST up button event.
*/
/*
exports.addup = function(db) {
return function(req, res) {
db.collection('driveby').update({ver:{$exists: true}},req.body, function(err, result){
res.send(
(err === null) ? { msg: '' } : { msg: err }
);
});
}
};
exports.adddown = function(db) {
return function(req, res) {
db.collection('driveby').update({ver:{$exists: true}},req.body, function(err, result){
res.send(
(err === null) ? { msg: '' } : { msg: err }
);
});
}
};
exports.addleft = function(db) {
return function(req, res) {
db.collection('driveby').update({hor:{$exists: true}},req.body, function(err, result){
res.send(
(err === null) ? { msg: '' } : { msg: err }
);
});
}
};
exports.addright = function(db) {
return function(req, res) {
db.collection('driveby').update({hor:{$exists: true}},req.body, function(err, result){
res.send(
(err === null) ? { msg: '' } : { msg: err }
);
});
}
};
*/
File: /home/bshenk/potctest/public/javascripts/global.js
// driveby data array for filling in info box
var drivebyData = [];
// lotstatus data array for filling in info box
var lotstatusData = [];
// counter to keep track of servo commands
// var verPosition = 0;
// var horPosition = 0;
var d;
var date;
// DOM Ready
=============================================================
$(document).ready(function() {
// Populate the driveby table on initial page load
populateTable();
// Populate the lotstatus table on initial page load
populateLotTable();
// Add User button click
$('#btnAddUser').on('click', addUser);
// Add Up botton click
//$('#btnAddUp').on('click', addUp);
// Add Down button click
//$('#btnAddDown').on('click', addDown);
// Add Left button click
//$('#btnAddLeft').on('click', addLeft);
// Add Right button click
//$('#btnAddRight').on('click', addRight);
});
// Functions
=============================================================
// Fill table with data
function populateTable() {
// Empty content string
var tableContent = '';
// jQuery AJAX call for JSON
$.getJSON( '/driveby', function( data ) {
// For each item in our JSON, add a table row and cells to the content string
$.each(data, function(){
tableContent += '<tr>';
//tableContent += '<td><a href="#" class="linkshowuser" rel="' + this.pi + '"
title="Show Details">' + this.pi + '</td>';
tableContent += '<td>' + this.pi + '</td>';
tableContent += '<td>' + this.dir + '</td>';
d = new Date(parseInt(this._id.toString().slice(0,8), 16)*1000);
date = d.toString().slice(0,24);
tableContent += '<td>' + date + '</td>';
//tableContent += '<td><a href='#' class='linkdeleteuser' rel='' + this._id +
''>delete</a></td>';
tableContent += '</tr>';
});
// Inject the whole content string into our existing HTML table
$('#driveby table tbody').html(tableContent);
});
};
// Fill table with data
function populateLotTable() {
// Empty content string
var tableContent = '';
// jQuery AJAX call for JSON
$.getJSON( '/zonetotal', function( data ) {
// For each item in our JSON, add a table row and cells to the content string
$.each(data, function(){
tableContent += '<tr>';
//tableContent += '<td><a href="#" class="linkshowuser" rel="' + this.zone + '"
title="Show Details">' + this.zone + '</td>';
tableContent += '<td>' + this.zone + '</td>';
tableContent += '<td>' + this.number + '</td>';
tableContent += '</tr>';
});
// Inject the whole content string into our existing HTML table
$('#lotstatus table tbody').html(tableContent);
});
};
// Add User
function addUser(event) {
event.preventDefault();
// Super basic validation - increase errorCount variable if any fields are blank
var errorCount = 0;
$('#addUser input').each(function(index, val) {
if($(this).val() === '') { errorCount++; }
});
// Check and make sure errorCount's still at zero
if(errorCount === 0) {
// If it is, compile all user info into one object
var newUser = {
'pi': $('#addUser fieldset input#inputpi').val(),
'dir': $('#addUser fieldset input#inputdir').val(),
}
// Use AJAX to post the object to our adduser service
$.ajax({
type: 'POST',
data: newUser,
url: '/adduser',
dataType: 'JSON'
}).done(function( response ) {
// Check for successful (blank) response
if (response.msg === '') {
// Clear the form inputs
$('#addUser fieldset input').val('');
// Update the table
populateTable();
// Update Lot table
populateLotTable();
}
else {
// If something goes wrong, alert the error message that our service returned
alert('Error: ' + response.msg);
}
});
}
else {
// If errorCount is more than 0, error out
alert('Please fill in all fields');
return false;
}
};
File: /home/bshenk/potctest/public/stylesheets/style.css
body {
padding: 30px;
font: 14px "Lucida Grande", Helvetica, Arial, sans-serif;
background-color:#819FF7;
}
h2 {
margin:0 0 .5em 0;
}
a{
color:#00B7FF;
}
#wrapper {
padding-left:312px;
position:relative;
}
#driveby {
margin:0 0 30px 0;
}
#driveby table {
border-collapse:separate;
border-spacing:1px;
background:#CCC;
}
#driveby table th {
background:#EEE;
font-weight:1200;
padding:10px 20px;
text-align:center;
}
#driveby table tbody {
padding:0; margin:0;
border-collapse:collapse;
border-spacing:0px;
}
#driveby table td {
background:#FFF;
padding:5px 10px;
text-align:center;
}
#lotstatus {
margin:0 0 30px 0;
}
#lotstatus table {
border-collapse:separate;
border-spacing:1px;
background:#CCC;
}
#lotstatus table th {
background:#EEE;
font-weight:1200;
padding:10px 20px;
text-align:center;
}
#lotstatus table tbody {
padding:0; margin:0;
border-collapse:collapse;
border-spacing:0px;
}
#lotstatus table td {
background:#FFF;
padding:5px 10px;
text-align:center;
}
#userInfo {
width:250px;
position:absolute;
top:0; left:0;
}
#userInfo p {
padding:15px;
border:1px solid #CCC;
background:rgba(80,120,255,0.05);
}
fieldset {
border:0;
padding:0; margin:0;
}
8.2
Video Streaming Website Code (potc.ee.nd.edu:5000)
The following code does not include some of the much larger files that were
necessary for the application to run properly. These other files that are not listed here
did not require modification and can be found at: https://github.com/jaredwolff/nodejswebsocket-example.
File: /home/bshenk/potctest2/app.js
var app = require('http').createServer(handler)
, io = require('socket.io').listen(app)
, url= require('url')
, fs = require('fs')
app.listen(5000);
// Http handler function
function handler (req, res) {
// Using URL to parse the requested URL
var path = url.parse(req.url).pathname;
// Managing the root route
if (path == '/') {
index = fs.readFile(__dirname+'/public/index.html',
function(error,data) {
if (error) {
res.writeHead(500);
return res.end("Error: unable to load index.html");
}
res.writeHead(200,{'Content-Type': 'text/html'});
res.end(data);
});
// Managing the route for the javascript files
} else if( /\.(js)$/.test(path) ) {
index = fs.readFile(__dirname+'/public'+path,
function(error,data) {
if (error) {
res.writeHead(500);
return res.end("Error: unable to load " + path);
}
res.writeHead(200,{'Content-Type': 'text/plain'});
res.end(data);
});
} else {
res.writeHead(404);
res.end("Error: 404 - File not found.");
}
}
// Web Socket Connection
io.sockets.on('connection', function (socket) {
// If we recieved a command from a client to tilt up, do so
socket.on('ping1', function(data) {
console.log("Tilt Up");
delay = data["duration"];
// Set a timer for when we should stop
//setTimeout(function(){
// socket.emit("pong");
//}, delay*1000);
});
// If we recieved a command from a client to pan left, do so
socket.on('ping2', function(data) {
console.log("Pan Left");
delay = data["duration"];
// Set a timer for when we should stop
//setTimeout(function(){
// socket.emit("pong");
//}, delay*1000);
});
// If we recieved a command from a client to pan right, do so
socket.on('ping3', function(data) {
console.log("Pan Right");
delay = data["duration"];
// Set a timer for when we should stop
//setTimeout(function(){
// socket.emit("pong");
//}, delay*1000);
});
// If we recieved a command from a client to tilt down, do so
socket.on('ping4', function(data) {
console.log("Tilt Down");
delay = data["duration"];
// Set a timer for when we should stop
//setTimeout(function(){
// socket.emit("pong");
//}, delay*1000);
});
});
File: /home/bshenk/potctest2/public/index.html
<!DOCTYPE html>
<html>
<head>
<meta name="viewport" content="width=320, initial-scale=1"/>
<script src="/js/jquery-2.1.0.min.js"></script>
<script src="/js/socket.io.js"></script>
<script src="/js/client.js"></script>
<title>jsmpeg streaming</title>
<style type="text/css">
body {
background: #555;
text-align: center;
margin-top: 0%;
}
</style>
</head>
<body>
<h2>Video Surveillance</h2>
<button type="button"><a
href="http://potc.ee.nd.edu:3000">Zone Status</a></button><br>
<!-- <input class="btn" type="button" value="Video 1">
<input class="btn" type="button" value="Video 2">
<input class="btn" type="button" value="Video 3">
<input class="btn" type="button" value="Video 4"> -->
<table align="center">
<tr>
<td><h4>Camera 1</h4>
<canvas id="videoCanvas1" width="200" height="160">
<p>
Please use a browser that supports the Canvas Element,
like
<a href="http://www.google.com/chrome">Chrome</a>,
<a href="http://www.mozilla.com/firefox/">Firefox</a>,
<a href="http://www.apple.com/safari/">Safari</a> or
Internet Explorer 10
</p>
</canvas>
</td>
<td><h4>Camera 2</h4>
<canvas id="videoCanvas2" width="200" height="160">
<p>
Please use a browser that supports the Canvas Element,
like
<a href="http://www.google.com/chrome">Chrome</a>,
<a href="http://www.mozilla.com/firefox/">Firefox</a>,
<a href="http://www.apple.com/safari/">Safari</a> or
Internet Explorer 10
</p>
</canvas>
</td>
</tr>
<tr>
<td><h4>Camera 3</h4>
<canvas id="videoCanvas3" width="200" height="160">
<p>
Please use a browser that supports the Canvas Element,
like
<a href="http://www.google.com/chrome">Chrome</a>,
<a href="http://www.mozilla.com/firefox/">Firefox</a>,
<a href="http://www.apple.com/safari/">Safari</a> or
Internet Explorer 10
</p>
</canvas>
</td>
<td><h4>Camera 4</h4>
<canvas id="videoCanvas4" width="200" height="160">
<p>
Please use a browser that supports the Canvas Element,
like
<a href="http://www.google.com/chrome">Chrome</a>,
<a href="http://www.mozilla.com/firefox/">Firefox</a>,
<a href="http://www.apple.com/safari/">Safari</a> or
Internet Explorer 10
</p>
</canvas>
</td>
</tr>
</table>
<script type="text/javascript" src="jsmpg.js"></script>
<script type="text/javascript">
// Show loading notice
var canvas = document.getElementById('videoCanvas1');
var ctx = canvas.getContext('2d');
ctx.fillStyle = '#444';
ctx.fillText('Loading...', canvas.width/2-30, canvas.height/3);
// Setup the WebSocket connection and start the player
var client = new WebSocket( 'ws://potc.ee.nd.edu:8085/' );
var player = new jsmpeg(client, {canvas:canvas});
// Show loading notice
var canvas = document.getElementById('videoCanvas2');
var ctx = canvas.getContext('2d');
ctx.fillStyle = '#444';
ctx.fillText('Loading...', canvas.width/2-30, canvas.height/3);
// Setup the WebSocket connection and start the player
var client = new WebSocket( 'ws://potc.ee.nd.edu:8089/' );
var player = new jsmpeg(client, {canvas:canvas});
// Show loading notice
var canvas = document.getElementById('videoCanvas3');
var ctx = canvas.getContext('2d');
ctx.fillStyle = '#444';
ctx.fillText('Loading...', canvas.width/2-30, canvas.height/3);
// Setup the WebSocket connection and start the player
var client = new WebSocket( 'ws://potc.ee.nd.edu:8093/' );
var player = new jsmpeg(client, {canvas:canvas});
// Show loading notice
var canvas = document.getElementById('videoCanvas4');
var ctx = canvas.getContext('2d');
ctx.fillStyle = '#444';
ctx.fillText('Loading...', canvas.width/2-30, canvas.height/3);
// Setup the WebSocket connection and start the player
var client = new WebSocket( 'ws://potc.ee.nd.edu:8097/' );
var player = new jsmpeg(client, {canvas:canvas});
</script>
<br>
<br>
<br>
<h3>Camera Control</h3>
<button id="up" type="button">
Up
</button><br>
<button id="left" type="button">
Left
</button>
<button id="right" type="button">
Right
</button><br>
<button id="down" type="button">
Down
</button>
</body>
</html>
File: /home/bshenk/potctest2/public/js/client.js
//var socket = io.connect('http://localhost:5000');
var socket = io.connect('http://potc.ee.nd.edu:5000');
socket.on('pong', function (data) {
console.log("pong");
});
$(document).ready(function() {
$("#up").click(function(){
socket.emit('ping1', { duration: 2 });
});
$("#left").click(function(){
socket.emit('ping2', { duration: 2 });
});
$("#right").click(function(){
socket.emit('ping3', { duration: 2 });
});
$("#down").click(function(){
socket.emit('ping4', { duration: 2 });
});
});
8.3 Raspberry Pi Model B Schematic
Schematic from:
http://www.adafruit.com/blog/2012/10/22/raspberry-pi-model-b-revision-2-0-schematicsraspberrypi-raspberry_pi/
Pi Specs:
CPU: 700 MHz ARM1176JZF-S core
Video: Broadcom VideoCore IV,[58] OpenGL ES 2.0, 1080p30 h.264/MPEG-4 AVC
high-profile decoder Memory: 512 MB (shared with GPU)
USB ports: 2
Video Outputs: Composite RCA (PAL & NTSC), HDMI (rev 1.3 & 1.4)
Audio Outputs: 3.5 mm jack, HDMI
Onboard Storage: SD Card Slot
Networking: 10/100 Ethernet (RJ45)
Power Rating: 700 mA, 5 V
Dimensions: 85.60 × 53.98 mm (3.370 × 2.125 in)
Weight: 45 g (1.6 oz)