1
Application Note:QCI-AN036
Date: 31 January 2005
www.QuickSilverControls.com
Data Acquisition With QuickControl®
This application note describes how to acquire data using QuickControl’s Register Watch and
Strip Chart tools. It assumes the reader is familiar with programming SilverLode products (see
chapters 1 and 2 of the SilverLode User Manual).
Test Setup
A simple test setup can be used to illustrate the use of the Register Watch tool. Wire a
potentiometer to Analog Input#1 (I/O #4). See the Application Note QCI-AN023 – Analog
Inputs for details. Many of QCI Start-Up Kits are provided with this potentiometer already
wired.
Create the single line program shown below (Program 1). Analog Continous Read (ACR) is
used to store analog values from Analog Channel #1 (I/O #4) into User[11] register.
Program 1
Download and run the above program to put the servo into a continuous analog read mode.
This mode will persist even after the servo finishes running the above program.
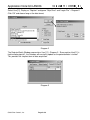
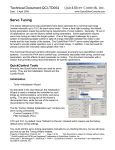
Register Watch
Register Watch is found under Tools in QuickControl. Press Add Register in the Register
Watch Window.
4
Diagram 1
"! #%$ & ! ' ( )+*%,%-."/ * -' 0 1%2 ."#"3
Property of QuickSilver Controls, Inc.
Page 1 of 8
QuickControl® is a registered trademark of
ther trade names cited are property of their explicit owner.
This document is subject to change without notice.
Application Note:QCI-AN036
567 89:7 ; <=>?@AB > @; CDE A8F
Select User[11], Display as “Register” and ignore “Strip Chart” and “Log to File” – Diagram 2.
Click ‘OK’ and choose long as the data format.
Diagram 2
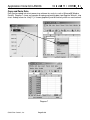
The Register Watch Window now contains User[11] – Diagram 3. Since register User[11] is
tied to analog input #1, the Data box will constantly update as the potentiometer is turned.
This provides the simplest form of data acquisition.
Diagram 3
QuickSilver Controls, Inc.
Page 2 of 8
Application Note:QCI-AN036
GHI JKLI M NOPQRST P RM UVW SJX
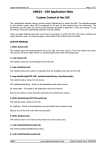
Register Watch Charting
Data is acquired approximately every 500 ms depending on the number of registers being
watched. Multiple strip charts can be opened at a time, but only one channel per strip chart is
allowed. Right-click User[11] register and choose Strip Chart as shown in Diagram 4. The Strip
Chart loads and contains data within x-y axes with features to save, copy, zoom, print and
pause.
Diagram 4
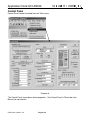
Register Watch Logging
Right-click User[11] and choose Log to File. A window pops up prompting for the file name to
be saved within the Log Folder. Specify a name or accept the default name and click save –
Diagram 5.
Diagram 5
QuickSilver Controls, Inc.
Page 3 of 8
Application Note:QCI-AN036
YZ[ \]^[ _ `abcdef b d_ ghi e\j
Diagram 6
Data within the log file is stored in two columns – Diagram 6. The data type for the first column
is time and the second reflects the data format specified during ‘Add Register’ routine. The
actual data seen in Diagram 6 is the analog value stored into User[11] register.
Note: Avoid opening the file until the program ends – Register Watch Window is closed. This
eliminates errors and ensures that QuickControl has complete control while writing.
QuickSilver Controls, Inc.
Page 4 of 8
Application Note:QCI-AN036
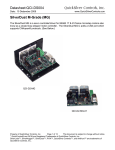
Copy and Paste Data
klm nopm q rstuvwx t vq yz{ wn|
Data can be copied into a text processing software for analysis such as Microsoft® Word or
Excel®. Diagram 7 shows an example of coping and pasting data from Register Watch’s strip
chart. Analog values for User[11] is shown graphically and distinctively within an excel column.
Diagram 7
QuickSilver Controls, Inc.
Page 5 of 8
Application Note:QCI-AN036
}~
Control Panel
Control Panel can be launched from the Tools menu.
Diagram 8
The Control Panel shows basic device properties. See Control Panel in SilverLode User
Manual for more details.
QuickSilver Controls, Inc.
Page 6 of 8
Application Note:QCI-AN036
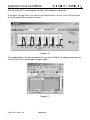
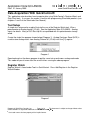
Control Panel Strip Chart
The Control Panel’s strip chart provides faster data acquisition than Register Watch and allows
up to four channels on the same chart for analysis as in Diagram 9. The strip chart cannot be
used while a program is running and is only active when the control panel is opened.
Diagram 9
Data is acquired for a maximum of ten seconds. Data point segments can be viewed
individually by zooming. Click zoom and drag the mouse over the range of points while holding
the upper right button. Double-click a point for the actual value.
To copy the data values for all four channels to a spreadsheet, follow the following steps:
1. Click Edit -> Copy.
2. Open Excel and highlight four columns.
3. Right-Click and paste.
Heading is automatically assigned as well as its respective data.
Download And Chart
A Control Panel like strip chart can be run on any program file (qcp) using QuickControl’s
Download and Chart feature.
With the QCP file open, select
Programs->Download and Chart
QuickSilver Controls, Inc.
Page 7 of 8
Application Note:QCI-AN036
¡¢£ ¤¥¦£ § ¨©ª«¬® ª ¬§ ¯°± ¤²
After the active QCP is downloaded, the Strip Chart dialog box is displayed.
At this point, the strip chart is the same as the Control Panel’s version. Press Run and Chart
to run the program file and chart the results.
Diagram 10
The window below is the data acquired by the strip chart (Diagram 10) copied and pasted into
Excel®. Refer to the section copy and paste above.
Diagram 11
QuickSilver Controls, Inc.
Page 8 of 8