1
User Manual
Table of Contents
TradeMiner Pro Theory................................................................................................................................. 3
Step 1: Search ............................................................................................................................................... 4
User Inputs ................................................................................................................................................ 4
Results Window ........................................................................................................................................ 9
Charts ...................................................................................................................................................... 11
Step 2: Neural Network .............................................................................................................................. 14
Neural Network Prediction Model .......................................................................................................... 14
Step 3: Portfolio .......................................................................................................................................... 23
Pick List.................................................................................................................................................... 23
Portfolio .................................................................................................................................................. 23
Step 4: Accounting ...................................................................................................................................... 26
Settings Tab................................................................................................................................................. 27
Education Tab ............................................................................................................................................. 28
Risk Disclosure ............................................................................................................................................ 29
End-User-License-Agreement ..................................................................................................................... 32
2
TradeMiner Pro Theory
The TradeMiner Pro Software enables a trader to search for historical trends and patterns that meets a
certain criteria, or level of success. The user focuses on the month/symbol they wish to see the trend
for, how many years to include in the pattern, how often it should win, what the minimum average gain
should be to consider it a successful trend, how far the market can retrace before considering it a losing
trend and how long the trend should last.
The concept is that if we find patterns, cycles or trends that continually repeat themselves in our
historical log, then it is likely that these same patterns, cycles and trends will repeat in the future.
When you dig for results, the software looks for month/symbol based trading patterns by calculating the
following question for every trading day available in the year. "If I enter on the first trading day of the
month and exit on the third to the last trading day, do I find a pattern that wins historically?" The entry
and exit dates aren't constrained to be in the same month.
In order to answer these questions and to look for patterns based on the days since the first of the
month or before the end of the month, the historical data is lined up so that the trading days for each
month are always at the same offset from the beginning. Because a month will have more trading days
some years and less in other years, we use a proprietary method of calculation to even up the data. It’s
through this secret formula that we are able to obtain such a high degree of accuracy over time; beyond
what anyone else has ever been able to achieve.
The software is divided into four steps: Search, Neural Network, Portfolio, and Accounting. The Settings
tab allows you make changes to the commodities, currency pairs, and/or equities that will be included in
the search tab. The Education tab launches a web browser to the electronic education center
3
Step 1: Search
Each time you use Trade Miner you will need to dig for some results based on your criteria. There are
several parameters to change, each with a different effect on the results. The software will have some
default settings on the first run. It will remember your settings automatically for subsequent runs.
User Inputs
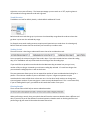
The user interface in the search tab reads like a sentence with select parameters you the user can
change and adjust to find the trends that meet your criteria. Below is the user interface found in the
Forex Version.
Each of the user defined fields will be described below:
Month or Symbol
The First dropdown box will allow you to select either a search by month or a search by symbol.
Choosing a month focuses the selection of historical trends on those that have trend start date within
the selected month. If you choose November, then only trends that start in November will be selected.
The trades may last past the end of November, depending on your maximum days setting.
Choosing a symbol will allow you to see the historical trends for the entire year of the selected
commodity, currency pair, and/or equity. You can then sort the column by date to get a chronological
timeline of the historical trends.
The second dropdown box will contain a list of months if month is selected in the first dropdown, and if
symbol is selected then you can type or scroll to the available symbol you would like to search.
Won at least [Blank] %
The percent parameter allows you to ignore a set of historical trades unless they win (don't lose money)
at least that percent of the time over the number of years examined.
If you want to see a winner at least 80% of the time and you go back ten years, at least eight of those
years will need to be winners. If you go back five years, at least four of them need to be winners.
The granularity of the percent parameter is fairly rough due to the amount of history available. Without
going back 100 or more years, there is no difference between 79% and 80%. Both would require at least
4
eight wins on ten years of history. The lowest percentage you can search on is 75%, anything lower is
not considered a strong seasonal trend and is ignored.
Trend Direction
TradeMiner can look for Bullish, Bearish, or Both Bullish and Bearish Trends.
Bullish trends are trends that go up in price over the selected day range. Bearish trends are those that
go down in price over the selected day range.
For Example some stock trading accounts require special permissions to trade short. So selecting only
Bullish Trends will ensure that one would only see trends they are able to take.
Trading Period
The next criterion is how long a trade would have to last to be considered a trend.
You may specify the minimum length of the trade in days. If you select trends that last at least 20 trading
days, then TradeMiner will only show trends that last longer than 20 trading days.
If you would like to cap when a trend ends then the Maximum day parameter lets you type in any
number of days as long as it exceeds your minimum trading day selected. If a trade lasts longer than
your maximum trading days then it will not be shown.
The years parameter allows you to limit or expand the number of years considered when looking for a
pattern. The minimum number of years to look back is 5 years. Longer term patterns may be
considered to be more reliable than a short term one. On the other hand, markets can change over
time and greater number of years may ignore a more recently developed trend. This is a minimum field,
if you are looking back 8 years, you would see all trends that last 8 or more years.
Filtering Results
There are two filters which help to remove redundant trades.
When performing a search, there are symbols that will have the same start date but have a different end
date. If you wish to see all the different trends and statistics related to each un-checking the filter and
performing a dig will reveal all the trades that were filtered out.
5
Some Trends will begin the day after or occur while a longer term trend is happening. If this is the case
then the filter to remove same symbols overlapping trend dates, will not show the trends that happen in
the middle of a longer tend. Again removing this filter will show the trends that were removed.
Dig Now
When all your parameters are set selecting the Dig Now button will initiate a search through the data
cube and then will present all the trades that meet the criteria.
After a dig has been initiated a green progress bar will appear as the software advances through the
DataCube. The Dig Now Button will also change to read Cancel which if selected will stop the search and
display the results that it was able to find to the point of canceling.
User Preferences
The User preferences dialog box can be accessed by selecting the User Preferences button
6
Trade Allocation Preferences allow you to set your account balance. You can then choose if you would
like to allocate a specific percentage of your account balance to each trade (which will vary the quantity
per trade) or you may choose to allocate a fixed quantity to each trade (note: choosing to allocate based
on quantity will allow the per trade quantity to be the same on every trade every trade regardless of
your account size).
The Neural Network Risk Tolerance Preferences Tab allows you to set your individual risk tolerance.
Conservative
The Conservative setting is for risk-adverse traders and this simply means that , when building the
neural network classification model, this setting will tell the model to avoid as many unsuccessful trades
as possible (this also means that some potentially large gains will likely be missed). When this setting is
selected there will typically be fewer trades classified as successful and more trades classified as
unsuccessful, because the neural network is putting most of its effort towards identifying the trades that
look like they will be unsuccessful trades. Lastly, this setting is typically used by those who are relatively
passive investors.
Moderate
The Moderate setting is for traders who are somewhat risk-adverse, but also do not want to miss out on
too many large gains. This setting is in between Conservative and Aggressive, which means that the
classification model will give an equal amount of effort to trying to identify successful trades as it does
trying to identify unsuccessful trades. In other words, instead of focusing on one type of trade over the
other, both types of trades will be treated equally, which means that there should be, on average, a
more equal number of both types of trades (successful vs. unsuccessful) included in the output of the
neural network model. Lastly, this setting is typically used by those who aren’t completely active traders
but also aren’t completely passive investors.
Aggressive
The Aggressive setting is for traders who have very little risk aversion and this simply means that, when
building the neural network classification model, this setting will tell the model to focus on identifying as
many successful trades as possible (this also means that some potentially large losses will be included as
well). When this setting is selected there will typically be more trades classified as successful and fewer
trades classified as unsuccessful, because the neural network Is putting most of its effort towards
identifying the trades that look like they will be losing trades. Lastly, this setting is typically used by
those who are relatively active traders
The Portfolio Optimization Preferences section will allow you to set your preference of how you would
like the auto-selection algorithm to help choose an optimal portfolio for you based on your risk profile:
Minimize Risk
The Minimize Risk setting attempts to choose trades for your portfolio that are not as volatile and work
well with other uncorrelated similar trades.
Maximize Return
7
The Maximize Return setting attempts to choose trades for your portfolio that maximize return, which
can mean bigger potential gains as well as bigger potential losses due to historically higher volatility and
attempts to group them with other uncorrelated similar trades.
Minimize Risk and Maximize Return
The Minimize Risk and Maximize Return setting attempts to choose trades that are a happy medium of
both minimizing risk and maximizing return and attempts to assemble a portfolio meeting these criteria
with as low of correlation as possible.
The last optional checkbox in this preference is whether you want the auto-selection algorithm to
choose the max number of trades for you to be in consistently based on the choices it has to choose
from in your pick list. So for example if your max number of trades is 5 and 1 of those trades ends before
the other trades end then the algorithm will attempt to add in another trade so you are always in 5
trades as often as possible. By not having this box checked it will simply choose 5 trades total from the
pick list for you to be in.
The Closed Trades Preferences Help section allows you to choose to have your closed trades (where the
End Date has passed) automatically moved to step 4 to the closed trades accounting tab or whether you
would like to manually move them. If you choose to have them automatically moved, you have to keep
this in mind when back testing on past months because when you attempt to move trades from your
pick list to your portfolio they will recognize that the end date has past and move automatically over to
your closed trades in step 4. So for back testing you would want this in manual mode and for forward
trading and analyzing you may choose either mode.
The Score Weight Preferences system uses many different factors to score each individual trade.
Volatility of Returns, Average Returns, Percent Accuracy, and Drawdown are the four factors that can be
adjusted by the user (the other factors are proprietary and cannot be adjusted0 and adjusting their
percentages will adjust the impact that each respective factor has on the score of the trade. Volatility of
Returns and Drawdown are negative factors and increasing their percentages will increase the score of
trades that are less volatile and have smaller drawdowns and will decrease the score of trades that are
more volatile and have larger drawdowns. Average Returns and Percent Accuracy are positive factors
and increasing the percentages will increase the score of trades that have high percentage returns and
high percentage accuracy and will decrease the score of trades that have low percentage returns and
low percentage accuracy.
8
Note: The impact to the score that occurs when the percentage for each factor is adjusted will be
different for different trades. The impact to the score of trades with higher scores will be less noticeable
when compared to the impact to the score of trades with lower scores, and the reason that this will
typically be the case is because the un-adjustable, proprietary factors have a greater impact on trades
with higher scores.
All of these descriptions can be accessed in the software by selecting the Help button.
Results Window
Once you have a list of trends that meet your search criteria, you can drill down on the specifics of
individual trade opportunities. You are able to sort by any of the columns in the table to group your
preferred trades together.
Columns
Add - Checked trades are in your Neural Network tab. Toggling the check box in this column
adds or removes them from the Watch List. Double-clicking the row adds that trade to your
Neural Network if it was not already selected and switches to the Neural Network tab.
Score - A software ranking system on a scale of 5-0, with 5 being the high. Score takes into
account volatility of returns, average returns, percent accuracy, and drawdown. This score is
the software’s way of filtering through the results and providing trends that are stronger as a
higher score.
Trend - The direction of the entry trade, bullish (buying) bearish (selling)
Symbol - The symbol to buy or sell
Instrument – Name of the Commodity, Currency Pair, or Equity.
Begin (Open) - The date the trend generally begins, projected into this year's calendar.
End (Close) - The date the trend tends to end.
Win % - Percentage of years that were winners.
Years – Number of years in the pattern.
Cal Days – Number of calendar days in the trade.
Avg Profit (% or %ROM) – The average closed profit and loss for this trade historically displayed
as a percentage rate.
9
Avg Profit ($)- The average closed profit and loss for this trade historically displayed in dollars.
Avg Profit (Tics, Pips) – [Futures and Forex only] – The average profit displayed in tics or pips
Risk:Reward – Historical Risk vs Reward for the number of years the trend has existed.
Avg Daily Profit (% or %ROM) - Average daily profit displayed as a percentage rate.
Max Gain (Pips or Tics) – [Futures and Forex only] – The biggest historical single-year closed
profit for the number of years the trend has existed.
Tic Value/Pip Value – [Futures and Forex only] – The value of the tic or pip price.
Quantity – How many contracts, shares, or pairs purchased. This amount is set in the user
preferences.
Margin/Contract – [Futures and Forex only] – The price of the margin or contract price.
Avg Daily Profit (Tics or Pips) – [Futures and Forex only] – Average daily profit displayed in tics or
pips.
Avg Daily Profit ($) – Average daily profit displayed in dollars.
Biggest Profit (Tics or Pips) – [Futures and Forex only] – The biggest historical single-year closed
profit and loss for this trade displayed in tics or pips.
Biggest Profit (% or %ROM) - The biggest historical single-year closed profit and loss for this
trade displayed as a percentage.
Biggest Profit ($) - The biggest historical single-year closed profit and loss for this trade.
Max Draw (Tics or Pips) – [Futures and Forex only] - The most the market moved against the
trade historically displayed in tics or pips
Max Draw (% or %ROM) - The most the market moved against the trade historically displayed as
a percentage rate.
Max Daw ($) - The most the market moved against the trade historically in dollars
Avg Draw (Tics or Pips) – [Futures and Forex only] - The average draw down for this trade
historically displayed in tics or pips.
Avg Draw (% or %ROM) - The average draw down for this trade historically displayed as a
percentage rate.
Avg Draw ($) - The average draw down for this trade historically in dollars.
Total Wins - Total count of winning years.
Total Losses - Total count of loosing years.
Max Gain (% or %ROM) - The biggest historical single-year closed profit for the number of years
the trend has existed displayed as a percentage rate
Max Gain ($) - The biggest historical single-year closed profit for the number of years the trend
has existed displayed in dollars
Trading Days - Number of trading days in the trade.
Total Historical Profit (% or %ROM)
Total Historical Profit ($) - Sum of the profit (or loss) from all the years in the pattern.
Amount/Trade – The dollar amount traded for the displayed results.
Optionable - [Stocks and Futures only] – signifies if the commodity or equity Is available for
option trading.
Group – [Futures only] – Classification of a Commodity, i.e. Grains, Metals, Energies, etc…
10
Previous Close - [Stocks only] – will display the last close price of the equity at the time of last
internet connection. Internet is required to update the close prices.
Sector - [Stocks only] - Classification of equities, i.e. Healthcare, Financial, Technology, etc...
Industry - [Stocks only] – Deeper Classification of equities
You may drag any column to a different location in the results window. You can also select the Colum
Options Button and add, remove, or position any of the columns as you prefer.
Column Formulas
Average Profit:
Total profit / years
Total Historical Profit:
Sum(profit(top year):profit(top year - years))
Max Draw:
If buying, the difference between the entry price and the lowest low during the trade. If selling, the
difference between the entry price and the highest high during the trade.
Avg Draw:
Total draw / years
Avg Daily Profit Percent:
Daily percent profit = percent profit / calendar days in trade
Total daily percent profit = sum of daily percent profit for all years in the trade
Average daily percent profit = total daily percent profit / years
Avg Daily Profit Dollars:
Daily profit = profit / calendar days in trade
Total daily profit = sum of daily profit for all years in the trade
Average daily profit = total daily profit / years
Risk Reward Ratio:
Risk reward ratio = average profit / average draw
Score:
Proprietary formula that determines which opportunities make the most amount of money, in the
shortest amount of time, with the least amount of risk.
Charts
TradeMiner provides several charts to help display the information in the results window. On the right
hand side of the software are 4 clickable windows. When a chart is clicked a larger table/chart will be
shown beneath the Results Window.
11
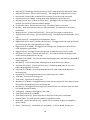
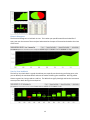
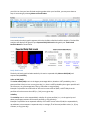
Historic Histogram
The historical Histogram is a look back in time. This is what your portfolio would have looked like if
every year over the course of the trend you had entered at the open of the trend and exited at the close
of the trend.
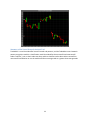
Year-by-Year look back
The Year-by-Year looks back is a graph that allows you to quickly see the winning and losing years, also
you can identify the max draw downs and max the market hit during the trend dates. Winning trades
show as a green bar, losing trades as a red bar. The White lines signify how high and low the investment
went up and or down during the trend period.
12
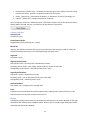
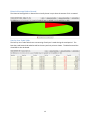
Historical Average Risk vs. Reward
The Historical Average Risk vs. Reward chart visually shows in a pie chart the amount of risk vs reward.
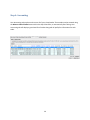
Year-by-Year Trade Table
The Year-by-Year Trade Table shows a accounting of each year’s trade during the trend period. The
Date the trade Started and ended as well as the entry and exit price are shown. The Max Draw and the
closed P&L is also calculated.
13
Step 2: Neural Network
You can add trades to the Neural Network tab in Step 1 by selecting the add column on the desired
trend, or by double clicking the trend. Switching over to the Neural Network Tab you will see the User
interface on this tab.
In Step 2 TradeMiner will calculate a High, Medium, Low, and Very Low probability that the trade will act
as it has in the past. In other words the software runs the selected trades through a neural network and
attempts to identify if the historical trend will repeat this upcoming year. Because the neural network
looks at current market data you must have an internet connection to receive a probability.
Neural Network Prediction Model
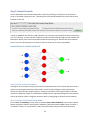
Brief Overview of Neural Networks
A biological neural network is simply a series of interconnected neurons that interact with each other in
order to transmit signals and process information. In other words, biological neural networks give
humans the ability to learn complex patterns. Similarly, an artificial neural network (which is what we
used for our prediction model) is a mathematical model that was inspired by biological neural networks,
and can be used for pattern recognition purposes. We are simply going to call them neural networks.
Overview of the Trade Classification Model
The TradeMiner Probability column, which is located in Step 2: Neural Network, uses a neural network
pattern recognition model to classify each TradeMiner trade that has been added to Step 2 as either a
“successful” trade or an “unsuccessful” trade (a successful trade is simply a trade that has positive
14
returns and, inversely, an unsuccessful trade is simply a trade that has negative returns). In order to do
this, the neural network model uses various technical indicators, which are calculated using the price
action that occurs prior to each trade entry date, to determine what a trade “looks like” (i.e., whether it
looks like it will be a successful trade or whether it looks like it will be an unsuccessful trade) by
comparing the current-year indicator values to the same values for historical trades.
Once a trade is classified as either successful trade or an unsuccessful trade (this is the current-year
directional bias of the trade), then each trade is further classified as either High, Medium, Low or Very
Low, where High/Medium classifications are given to trades that look like they will be successful and
Low/Very Low trades classifications are given to trades that look like they will be unsuccessful. In
addition to the directional bias, there is another important characteristic that distinguishes High from
Medium and Low from Very Low, which is whether or not a trade looks like it will be an average trade.
For example, if a trade looks like it will have a greater-than-average gain then that trade will be classified
as High, but if the trade looks like it will have an average gain then that trade will be classified as
Medium. Similarly, if a trade looks like it will have a greater-than-average loss then that trade will be
classified as Very Low, but if the trade looks like it will have an average loss then that trade will be
classified as Low.
Using the Neural Network Classification Model
The first thing that needs to be done, prior to using the classification model, is to make sure that you
have specified your individual risk tolerance preferences, where you will be able to select from
conservative, moderate, or aggressive. This preference can be set by selecting the User Preferences
button that is located in the top-right corner of Step 1 through Step 4.
Another important thing to remember is that since the neural network classification model uses currentyear daily prices, trade classifications can only be made up to 15 trading days before the actual trade
entry date; however, as would be expected, the closer to the trade entry date that a trade classification
is made, the more accurate the classification will likely be (e.g., using the neural network to classify a
trade the day before the trade entry date means that the model will be using relatively more accurate
price data, when compared to a classification that is made 15 trading days before the trade entry date).
Additionally, the classification for each individual trade can only be made one time each day (which
makes sense because the neural network uses daily price data) and, as new price data is included in the
classification model, trade classifications will sometimes change so it is a good idea to re-calculate the
neural network model one last time prior to placing any trades.
If you would like to only calculate classifications for trades that are within a specified number of trading
days before the trade start date, you can adjust the number of trading days before the trade start date
that classifications will be allowed. However, it is important to remember that the greater the number
of classifications models that need to be built, the longer it will take to calculate the neural network
results, so the computation time can be reduced by only classifying trades that are within a smaller
number of trading days. The setting for the total number of trading days prior to the trade start date,
which controls how soon classifications can be made, can be adjusted prior to pressing the Calculate
Now button to classify each of the trades.
15
After running the neural network model, trades that are not yet close enough to the trade start date will
not receive a trade classification. Instead, the TradeMiner Probability column will tell you the number of
days until a classification can be calculated. If the trade is close enough to the trade start date so that a
classification can be calculated, the trade classification will show up in the Probability column after the
trade has been classified.
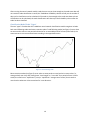
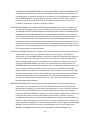
Classification Model Trade “Types”
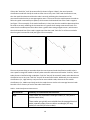
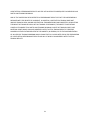
The two “types” of trades that the TradeMiner neural network classification model recognizes includes
both trend following trades and mean reversion trades. Trend following trades (see figure 1) occur when
an asset tends to move in one particular direction for an extended period of time and, after which, the
asset reverses its current trend and starts trending in the opposite direction.
Figure 1: Trend Following Trade
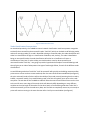
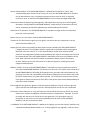
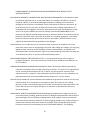
Mean reversion trades (see figure 2) occur when an asset tends to revert back to its mean value (i.e.,
average value) over time, after having been “over-bought” or “over-sold” for a period of time. In other
words, the asset has an “equilibrium” price (or “equilibrium” average rate of return) that it tends to
revert back to whenever it has moved too far in one direction.
16
Figure 2: Mean Reversion Trade
Trade Classification Characteristics
As mentioned previously, the TradeMiner neural network classification model uses pattern recognition
to identify what successful and unsuccessful trades “look like” (which can be both trend following trades
and mean reverting trades). If a trade is identified as being a successful trade, the trade classification will
either be a classification of High or a classification of Medium, and, similarly, if a trade is identified as
being an unsuccessful trade, the trade classification will either be a classification of Low or a
classification of Very Low. In order to help you visualize what I mean by what successful and
unsuccessful trades “look like,” I am going to provide a hypothetical example of a trend following trade
that will give you an idea of what pattern that type of trade might follow, for each of the different trade
classifications.
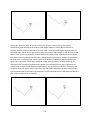
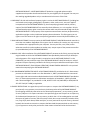
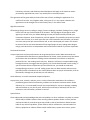
A trend following trade that “looks like” it will be successful will typically start building momentum after
prices reverse course and start a new trend and, after the new trend has been established (see figure 3),
the price action will need to further confirm the validity of the trend reversal (assuming that the trade is,
indeed, a successful trade). For a trend following trade, all of this will typically occur prior to the trade
entry date. The exit date of the TradeMiner trade will either be near the end of the entire trend or close
to the end of one or more legs of the trend, which will obviously differ depending on many different
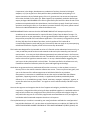
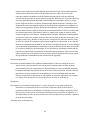
variables such as the length of the trade. On the other hand, a trend following trade that “looks like” it
will be unsuccessful, prior to the trade entry date, won’t be able to completely reverse its prior trend, so
prices will continue moving in the same direction after a brief price consolidation (see figure 4).
17
Figure 3: Characteristics of a Successful Trade
Figure 4: Characteristics of a Unsuccessful Trade
If the trade “looks like” it will be successful (as shown in figure 3 above), the neural network
classification model will classify the trade as either High or Medium. If the trade classification is
Medium, then the model has determined that the trade is currently exhibiting the characteristics of a
successful trade that has an average positive return (an average trade is simply a trade where the trade
metrics, such as return and volatility, have values that are similar to their respective historical values).
This means that the model expects the trade to follow its typical price pattern and that it also expects
the trade to be a successful trade, which is the directional bias of a Medium trade classification (see
figure 5 for an example). If the trade is classified as High, then the trade is currently exhibiting the
characteristics of a successful trade that has a greater-than-average positive return (a greater-thanaverage trade is simply a trade where the trade metrics, such as return and volatility, have values that
are greater than their typical values). This means that the trade is expected to be more volatile than a
typical trade and that it also expects the trade to be a successful trade, which is the directional bias of a
High trade (see figure 6 for an example).
Figure 5: Characteristics of a Medium Trade
Figure 6: Characteristics of a High Trade
18
If the trade “looks like” it will be unsuccessful (as shown in figure 4 above), the neural network
classification model will classify the trade as either Low or Very Low. If the trade classification is Low,
then the model has determined that the trade is currently exhibiting the characteristics of an
unsuccessful trade that has an average negative return. This means that the model expects the trade to
follow its typical unsuccessful price pattern, which means the directional bias of the trade is negative
(see figure 7 for an example). If the trade classification is Very Low, then the model has determined that
the trade is currently exhibiting the characteristics of a greater-than average unsuccessful trade. This
means that the model expects the trade to have a greater-than-average negative return, which means
that the directional bias of the trade is negative and that the trade “looks like” it will be more volatile
that the typical unsuccessful trade (see figure 8 for an example).
Figure 7: Characteristics of a Low Trade
Figure 8: Characteristics of a Very Low Trade
The most important thing to remember about the neural network trade classification model is that it
uses a pattern recognition model to identify what successful and unsuccessful trades “look like,” where
trades that are classified as High or Medium “look like” they will be successful trades and trades that are
classified as Low or Very Low “look like” they will be unsuccessful trades. Additionally, the two extreme
classifications (i.e., High and Very Low) tend to be more volatile trades, whereas the two middle
classifications (i.e., Medium and Low) tend to be trades that are similar to the average historical trade.
See table 1 for a summary of each of the trade classifications.
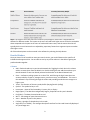
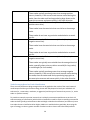
Table 1: Trade Classification Characteristics
Classification
Summary of Classification Characteristics
High
These trades are classified as successful trades (i.e., they have a
positive return bias).
These trades are typically more volatile than the average historical
trade, especially when prices are either overbought (for long
trades) or oversold (for short trades).
19
Medium
These trades typically produce greater-than-average positive
returns; however, if the current trend reverses course during the
trade, then the trade could end up producing large losses as the
asset price reverses and moves quickly in the other direction.
These trades are classified as successful trades (i.e., they have a
positive return bias).
These trades have characteristics that are similar to the average
trade.
Low
These trades do not have any particular trade behavior to watch
out for.
These trades are classified as unsuccessful trades (i.e., they have a
negative return bias).
These trades have characteristics that are similar to the average
trade.
Very Low
These trades do not have any particular trade behavior to watch
out for.
These trades are classified as unsuccessful trades (i.e., they have a
negative return bias).
These trades are typically more volatile than the average historical
trade, especially when prices are either oversold (for long trades)
or overbought (for short trades).
These trades typically produce greater-than-average negative
returns; however, if the current price trend reverses course during
the trade, then the trade could end up producing large gains as
the asset price reverses and moves quickly in the other direction.
Trade Strategies Based on Trade Classification
There are many different trading strategies that can be applied to the results of the neural network
model output and the type of trade strategy chosen will likely depend on both your individual risk
tolerance (i.e., conservative, moderate, or aggressive) and the type of investor that you are (i.e., active
trader vs. passive investor).
To provide an example, a passive investor that is relatively conservative would want to set their risk
tolerance setting to conservative (which tells the classification model to focus on avoiding unsuccessful
trades and will typically produce fewer trades with High or Medium classifications) and then only enter
into trades that are classified as either High or Medium. It would also be a good idea, when using this
type of strategy, to select a greater number of trades in order to have a more diversified portfolio.
20
On the other hand, an active trader that is relatively aggressive would want to set their risk tolerance to
aggressive (which tells the classification model to focus on not missing out on successful trades and will
typically produce a relatively greater number of trades with High or Medium classifications) and enter
into trades that are either classified as High or Medium, while watching trades classified as Very Low in
order to see if they reverse course. It would also be a good idea, when using this type of strategy, to
select a relatively smaller number of trades in order to have a more concentrated portfolio, so that each
trade can be watched more closely.
Lastly, the two strategies presented in this section are definitely an exhaustive list of the types of
strategies that could be used with the TradeMiner Neural Network Analysis Tool, and the only reason
that I am providing these examples is to illustrate of a couple of different ways that the neural network
model could be used.
Non-Normal Events (and other market events)
When using the neural network classification model, it is important to pay attention to both non-normal
market events (a non-normal event is an uncommon event that impacts the markets in a way that
reduces the likelihood of a historical trend recurring, at least for the time being) and market events,
especially when one occurs after the trade entry date. A good example of a non-normal market event is
the 2011 Japanese earthquake and tsunami, which had a large impact on nuclear-related stocks
(especially uranium producers), because of the nuclear disaster that occurred at the Fukushima Daiichi
nuclear power plant and the negative sentiment towards nuclear power generation that resulted. This
type of non-normal market event will likely invalidate any ongoing historical trend that might be
occurring at the time (assuming that the event doesn’t have the same directional impact as the trend)
and it is definitely be a good idea to take the expected impact of the event into consideration before any
trading decisions are made (assuming that the trade hasn’t yet been made).
A good example of an important market event to pay attention to is an earnings release (for stocks) or a
crop report (for commodities) that occurs during a trade’s entry and exit dates, and even though these
market events could be what cause the historical trend to occur (at least most of the time), they also
bring in additional uncertainty and risk if their results don’t turn out as expected. For example, if a stock
has a strong rally right before an upcoming earnings release, the risk associated with a bad earnings
report may outweigh the potential reward from a good earnings report, and the best strategy might be
to simply take your profits a little bit early (or, potentially, purchase some protection in order to hedge
your position). This would have definitely been a prudent strategy to take for a Select Comfort (SCSS)
trade, which had an entry date of 01-02-2013 and an exit date of 01-29-2013, because they ended up
reporting pretty weak results and giving a negative future outlook (which was released after market
close on the 24th of January and was only a few days before the trade exit date), and their shares ended
up sinking the following day
21
Summary of the Neural Network Analysis Tool
TradeMiner is a tool that identifies historical trends and patterns, and the TradeMiner neural network
pattern recognition model is a classification model that identifies what successful and unsuccessful
trades “look like,” prior to their trade start date, and then classifies each trade as either successful or
unsuccessful and whether or not the trade looks like an average trade or a greater-than-average trade.
22
Step 3: Portfolio
The Portfolio tab may be used to create and analyze a list of desired contracts within a customizable
trading portfolio. Once trades have been added into your Pick List, you may then choose the number of
active trades to be displayed, how many additional trades you may wish to add, and you may have
TradeMiner automatically choose which trades out of your Pick List to be added into your Portfolio.
You may expand or collapse your Pick List/Portfolio sections by select the black arrows which separate
the two sections. Click the up arrow to expand the Portfolio, click the down arrow to expand the Pick
List. These arrows appear within the follow graphic:
Pick List
You may add trades into the Step 3 tab by selecting Add to Pick List from Step 2. Your Pick List will be
used to determine which trades to add into your Portfolio when choosing to Auto Select. From this
section you may choose to Print your Pick List, Remove Selected to return highlighted trades into Step
2, Remove All trades into Step 2, or Move to Portfolio all trades listed within your current Pick List.
Portfolio
Once trades have been added into your Portfolio from your Pick List, you may analyze the current
profit/loss of all open trades from the Open Trades Total: beneath your trades list. You may also see the
combined profit of all closed and open trades from the Grand Total. If you would like to remove a trade
from your Portfolio, select to either Remove Selected or Remove All. Removed trades will return to
23
your Pick List. Once you have finished analyzing trades within your Portfolio, you may move them to
Step 4: Accounting by selecting Move to Closed Trades.
Portfolio Analytics
A new technical analysis graphic appears within the Portfolio called the Portfolio Analytics. The Portfolio
Analytics will display a bar graph of your Expected Daily Risk Levels along with your Total Period
Portfolio Metrics as show below:
Daily Risk Levels
The daily risk levels graph includes two daily risk metrics: expected daily Value at Risk (VaR) and
expected daily Volatility.
Value at Risk (VaR):
The Value at Risk (VaR) metric is the largest percentage decline, based on a 95% probability, that a
given portfolio is likely to incur on any given day (i.e., there is a 95% probability that a given portfolio will
not lose more, on a percentage basis, than its VaR value on any given day).
Example: If a portfolio has a VaR value of 10% and a current value of $100, it is 95% likely that the
portfolio will not lose more than 10% (i.e., $10), on any given day.
Volatility:
The Volatility metric us the expected daily volatility of a given portfolio (i.e., it is the typical up and
down percentage movement of the entire portfolio on any given day).
Example: If a portfolio has an expected volatility of 5% and a current value of $100, the expected daily
up and down price movement is expected to be, on average, 5% of the total portfolio value (i.e., $5, up
or down, on any given day).
24
Total Period Portfolio Metrics
The total period portfolio metrics section includes two types of values; expected confidence intervals
and actual metric values. The expected confidence intervals and the actual metric values are provided
for both Portfolio Return and Portfolio Max Drawdown.
Portfolio Return:
The Portfolio Return confidence interval is an estimate of the expected portfolio return that will occur
over the entire portfolio period (the “expected portfolio return will fall within the interval range). The
“Worst” value is the bottom of the range and the “Best” value is the top of the range, whereas the
“Expected” value is simply the estimated portfolio return value.
Example: If a portfolio has an expected portfolio return of 10% (with 8% as its “worst” estimate and 12%
as its “best” estimate) and a beginning value of $100, the expected range of the portfolio return, based
on a 95% probability, is 8% ($8) to 12% ($12), with an expected value of 10% ($10).
Portfolio Max Drawdown (Confidence Interval):
The Max Drawdown confidence interval is an estimate of the expected maximum drawdown during the
portfolio period (the “Max Drawdown” of portfolio is the maximum percentage decline that occurs
during a given period) and its 95% confidence interval (I.e., there is 95% confidence that the maximum
drawdown will fall within the interval range). The “Worst” value is the bottom of the range and the
“Best” value is the top of the range, whereas the “Expected” value is simply the estimated max
drawdown value.
Example: If a portfolio has an expected maximum drawdown of 7% (with 8% as its “worst” estimate and
6% as its “best” estimate) and a begging value of $100, the expected range of the portfolio drawdown,
based on a 95% probability, is 6% ($6) to 8% ($8), with an expected value of 7% ($7).
Portfolio Return & Portfolio Max Drawdown (Actual Values):
The values for the Portfolio Return and Portfolio Max Drawdown metrics are simply the actual historical
values that occurred, for an individual portfolio, during the prior year and during the current year
(current year values will be 0% if the portfolio isn’t yet active, have blue text if portfolio is currently
active, and have black text if the portfolio is no longer active and all trades are over).
25
Step 4: Accounting
Your Accounting tab may be used to store all of your closed trades. These trades may be entered using
the Move to Closed Trades button within the Step 3 Portfolio, or automatically after closing. Your
Accounting tab will display a grand total for all trades along with all profit/loss information for each
trade.
26
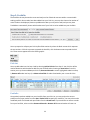
Settings Tab
In the setting tab you will find all the commodities, currency pairs, or Stock equities included in the data
cube. In the settings tab you can create customized groups to search for trends in. Any symbol that has
a checkmark in the “Use” column will be included when you run a search in step 1. Each of the columns
in the settings tab can be clicked on to sort in ascending/descending order.
Examples of custom groups include all grain contracts in the futures version. This group would be
created by sorting by the Group option and selecting all the contracts with a Grain grouping. Another
Example is stocks that trade between $10-$20, Sorting by the previous close and then selecting only
those stocks in the $10-$20 price range would create the custom group desired.
Once all the symbols you desire in your group are selected you can select “Save Group” and a dialogue
box will appear asking you to name your group. After you have named your group you can find in the
drop down any time after.
27
Education Tab
The TradeMiner Education center has step-by-step videos walking through each aspect of the software.
28
Risk Disclosure
High Risk Investments
Trading Stocks, Futures, Foreign Exchange (Forex), or Options on margin carries a high level of risk, and
may not be suitable for all investors. The high degree of leverage can work against you as well as for
you. Before deciding to trade any of these markets you should carefully consider your investment
objectives, level of experience, and risk appetite. The possibility exists that you could sustain a loss of
some or all of your initial investment and therefore you should not invest money that you cannot afford
to lose. You should be aware of all the risks associated with trading these markets, and seek advice from
an independent financial advisor if you have any doubts.
Internet Trading Risks
There are risks associated with utilizing an Internet-based deal execution trading system including, but
not limited to, the failure of hardware, software, and Internet connection. Since Gecko Software and any
partners do not control signal power, its reception or routing via Internet, configuration of your
equipment or reliability of its connection, we cannot be responsible for communication failures,
distortions or delays when trading via the Internet. Our partners, employ back-up systems and
contingency plans to minimize the possibility of system failure, and trading via telephone to the clearing
firm is an additional option if such an event occurs.
Accuracy of Information
The content in this manual and on the website is subject to change at any time without notice, and is
provided for the sole purpose of assisting traders to make independent investment decisions. Gecko
Software has taken reasonable measures to ensure the accuracy of the information on the website,
however, does not guarantee its accuracy, and will not accept liability for any loss or damage which may
arise directly or indirectly from the content or your inability to access the website, for any delay in or
failure of the transmission or the receipt of any instruction or notifications sent through this website or
by email.
Distribution
This site is not intended for distribution, or use by, any person in any country where such distribution or
use would be contrary to local law or regulation. None of the services or investments referred to in this
website are available to persons residing in any country where the provision of such services or
investments would be contrary to local law or regulation or to the laws of the United States. It is the
responsibility of visitors to this website to ascertain the terms of and comply with any local law or
regulation to which they are subject.
Market Risks and Online Trading
The trading program(s) provide sophisticated order entry and tracking of orders. All stop-loss, limit and
entry orders are generally deemed reliable against slippage, but slippage may still occur based on
market conditions and liquidity. Trading on-line, no matter how convenient or efficient does not
29
necessarily reduce risks associated with stocks, futures, forex, or options trading. All quotes and trades
are subject to the terms and conditions of the End-User License Agreement and Client Agreement.
Testimonial Disclaimer
Unique experiences and past performances are not necessarily indicative of future results! Testimonials
herein are unsolicited and are non-representative of all clients; certain accounts may have worse
performance than that indicated. Trading Stocks, Futures, Forex, or Options involves substantial risk and
there is always the potential for loss. Your trading results may vary. Because the risk factor is high
trading any leverage markets, only genuine “risk” funds should be used in such trading. If you do not
have the extra capital that you can afford to lose, you should not trade. No completely “safe” trading
system has ever been devised, and no one can guarantee profits or freedom from loss. Gecko Software
does not pay for testimonials, most of our testimonials are unsolicited and voluntary.
Gecko Software Market Opinions
Any opinions, news, research, analyses, prices, or other information contained on this website are
provided as general market commentary, and do not constitute investment advice. Gecko Software is
not liable for any loss or damage, including without limitation, any loss of profit, which may arise directly
or indirectly from use of or reliance on such information. Gecko Software has taken reasonable
measures to ensure the accuracy of the information on the website. The content on this website is
subject to change at any time without notice.
Views, Opinions, and outside links
The views and opinions represented in any link to an outside website link and/or resources are not
controlled by Gecko Software or by our associated firms. Further, Gecko Software nor our associated
firms are responsible for their availability, content, or delivery of services.
DISCLAIMER: THE DATA CONTAINED HEREIN IS BELIEVED TO BE RELIABLE BUT CANNOT BE
GUARANTEED AS TO RELIABILITY, ACCURACY, OR COMPLETENESS; AND, AS SUCH ARE SUBJECT TO
CHANGE WITHOUT NOTICE. WE WILL NOT BE RESPONSIBLE FOR ANYTHING, WHICH MAY RESULT FROM
RELIANCE ON THIS DATA OR THE OPINIONS EXPRESSED HERE IN.
DISCLOSURE OF RISK: THE RISK OF LOSS IN TRADING STOCKS, FUTURES, FOREX, AND OPTIONS CAN BE
SUBSTANTIAL; THEREFORE, ONLY GENUINE RISK FUNDS SHOULD BE USED. STOCKS, FUTURES, FOREX,
AND OPTIONS MAY NOT BE SUITABLE INVESTMENTS FOR ALL INDIVIDUALS, AND INDIVIDUALS SHOULD
CAREFULLY CONSIDER THEIR FINANCIAL CONDITION IN DECIDING WHETHER TO TRADE. OPTION
TRADERS SHOULD BE AWARE THAT THE EXERCISE OF A LONG OPTION WOULD RESULT IN A FUTURES OR
FOREX POSITION.
HYPOTHETICAL PERFORMANCE RESULTS HAVE MANY INHERENT LIMITATIONS, SOME OF WHICH ARE
DESCRIBED BELOW.
NO REPRESENTATION IS BEING MADE THAT ANY ACCOUNT WILL, OR IS LIKELY TO, ACHIEVE PROFITS OR
LOSSES SIMILAR TO THOSE SHOWN. IN FACT, THERE ARE FREQUENTLY SHARP DIFFERENCES BETWEEN
30
HYPOTHETICAL PERFORMANCE RESULTS AND THE ACTUAL RESULTS SUBSEQUENTLY ACHIEVED BY ANY
PARTICULAR TRADING PROGRAM.
ONE OF THE LIMITATIONS OF HYPOTHETICAL PERFORMANCE RESULTS IS THAT THEY ARE GENERALLY
PREPARED WITH THE BENEFIT OF HINDSIGHT. IN ADDITION, HYPOTHETICAL TRADING DOES NOT
INVOLVE FINANCIAL RISK, AND NO HYPOTHETICAL TRADING RECORD CAN COMPLETELY ACCOUNT FOR
THE IMPACT OF FINANCIAL RISK IN ACTUAL TRADING. FOR EXAMPLE, THE ABILITY TO WITHSTAND
LOSSES OR TO ADHERE TO A PARTICULAR TRADING PROGRAM, IN SPITE OF TRADING LOSSES, ARE
MATERIAL POINTS WHICH CAN ALSO ADVERSELY AFFECT ACTUAL TRADING RESULTS. THERE ARE
NUMEROUS OTHER FACTORS RELATED TO THE MARKETS, IN GENERAL, OR TO THE IMPLEMENTATION
OF ANY SPECIFIC TRADING PROGRAM WHICH CANNOT BE FULLY ACCOUNTED FOR IN THE PREPARATION
OF HYPOTHETICAL PERFORMANCE RESULTS AND ALL OF WHICH CAN ADVERSELY AFFECT ACTUAL
TRADING RESULTS.
31
End-User-License-Agreement
IMPORTANT-READ CAREFULLY: This Gecko End-User License Agreement ("EULA") is a legal agreement
between you (either an individual or a single entity) and Gecko Software, Inc., corporation for
the Gecko software product identified above, which includes computer software and may
include associated media, printed materials, and "online" or electronic documentation and data
("SOFTWARE PRODUCT"). The SOFTWARE PRODUCT also includes any updates and supplements
to the original SOFTWARE PRODUCT provided to you by Gecko. Any software provided along
with the SOFTWARE PRODUCT that is associated with a separate end-user license agreement is
licensed to you under the terms of that license agreement. By installing, copying, downloading,
accessing or otherwise using the SOFTWARE PRODUCT, you agree to be bound by the terms of
this EULA. If you do not agree to the terms of this EULA, do not continue to install or use the
SOFTWARE PRODUCT. No verbal or written agreement may supersede this agreement.
SOFTWARE PRODUCT LICENSE
The SOFTWARE PRODUCT is protected by copyright laws and international copyright treaties, as well as
other intellectual property laws and treaties. The SOFTWARE PRODUCT is licensed, not sold.
1. GRANT OF LICENSE. This EULA grants you the following rights: You may install This Product on one (1)
computer system per license. You are not allowed to share your key code with anyone else
whosoever; in so doing, you will be in violation of this agreement. You may not allow remotely
connected COMPUTERS, nor to invoke application sharing of the software. This connection
includes any indirect connections made through software or hardware which pools or
aggregates connections. It is the user's responsibility to keep their key code safe and secure,
Gecko Software will not be liable for loss due to lost or stolen login information, or key codes,
Gecko Software recommends users use highly cryptic login and password information. If you
feel your login and password information has been compromised, contact Gecko Software
immediately. )
Storage/Network Use. You may also store or install a copy of the SOFTWARE PRODUCT on a storage
device, such as a network server, used only to install or run the SOFTWARE PRODUCT on YOUR
computer.
License Pak. If this package is a Gecko License Pak, you may install and use additional copies of the
computer software portion of the SOFTWARE PRODUCT up to the number of copies specified
above as "Licensed Copies".
2. DESCRIPTION OF OTHER RIGHTS AND LIMITATIONS
Academic Edition Software. If the SOFTWARE PRODUCT is identified as "Academic Edition" or "AE," you
must be a "Qualified Educational User" to use the SOFTWARE PRODUCT. If you are not a
Qualified Education User, you have no rights under this EULA. To determine if you are a
Qualified Educational User, please contact the Gecko Sales Information Center in the USA at
435-752-8026.
32
Not For Resale Software. If the SOFTWARE PRODUCT is labeled "Not For Resale" or "NFR," then,
notwithstanding other sections of this EULA, your use of the SOFTWARE PRODUCT is limited to
use for demonstration, test, or evaluation purposes and you may not resell, or otherwise
transfer for value, or install the SOFTWARE PRODUCT on more than one single COMPUTER.
Limitations on Reverse Engineering, Decompilation, and Disassembly. You may not reverse engineer,
decompile, or disassemble the SOFTWARE PRODUCT, except and only to the extent that such
activity is expressly permitted by applicable law notwithstanding this limitation.
Separation of Components. The SOFTWARE PRODUCT is licensed as a single product. Its component
parts may not be separated.
Rental. You may not rent, lease or lend the SOFTWARE PRODUCT.
Trademarks. This EULA does not grant you any rights in connection with any trademarks or service
marks of Gecko Software, Inc.
Support Services. Gecko may provide you with support services related to the SOFTWARE PRODUCT
("Support Services"). Use of Support Services is governed by the Gecko policies and programs
described in the user manual, in "on line" documentation and/or other Gecko-provided
materials. Any supplemental software code provided to you as part of the Support Services shall
be considered part of the SOFTWARE PRODUCT and subject to the terms and conditions of this
EULA. With respect to technical information you provide to Gecko as part of the Support
Services, Gecko may use such information for its business purposes, including for product
support and development.
Software Transfer. The user of the SOFTWARE PRODUCT may make a one-time permanent transfer of
this EULA and SOFTWARE PRODUCT only directly to an end user. This transfer must include all of
the SOFTWARE PRODUCT (including all component parts, the media and printed materials, any
upgrades, this EULA, and, if applicable, the Certificate of Authenticity). Such transfer may not be
by way of consignment or any other indirect transfer. The transferee of such one-time transfer
must agree to comply with the terms of this EULA. Both parties must contact Gecko Software to
make the transfer complete.
Even though we have given the right to transfer the software application license, we do not give the
right to transfer data subscription services. Data subscription services are non-transferable.
Termination. Gecko Software, Inc. may terminate your license and this EULA at any time for any reason
what so ever; without the obligation of reimbursement or compensation. Therefore, if you fail
to comply with the terms of use set forth in this agreement, or if Gecko gives notice of
termination of your license, you must immediately destroy all copies of the SOFTWARE
PRODUCT and all of its component parts.
3. UPGRADES. If the SOFTWARE PRODUCT is labeled as an upgrade, you must be properly licensed to use
a product identified by Gecko Software, Inc. as being eligible for the upgrade in order to use the
33
SOFTWARE PRODUCT. A SOFTWARE PRODUCT labeled as an upgrade replaces and/or
supplements the product that formed the basis for your eligibility for the upgrade. You may use
the resulting upgraded product only in accordance with the terms of this EULA.
4. COPYRIGHT. All title and intellectual property rights in and to the SOFTWARE PRODUCT (including but
not limited to any images, photographs, animations, video, audio, music, text, and "applets"
incorporated into the SOFTWARE PRODUCT), the accompanying printed materials, and any
copies of the SOFTWARE PRODUCT are owned by Gecko Software, Inc. or its suppliers. All title
and intellectual property rights in and to the content which may be accessed through use of the
SOFTWARE PRODUCT is the property of the respective content owner and may be protected by
applicable copyright or other intellectual property laws and treaties. This EULA grants you no
rights to use such content. All rights not expressly granted are reserved by Gecko Software, Inc.
5. DUAL-MEDIA SOFTWARE. You may receive the SOFTWARE PRODUCT AND/OR Educational materials in
more than one medium. Regardless of the type or size of medium you receive, you may use only
one medium that is appropriate for your computer. You may not loan, rent, lease, lend or
otherwise transfer the other medium to another user, except as part of the permanent transfer
(as provided above) of the SOFTWARE PRODUCT.
6. BACKUP COPY. After installation of the SOFTWARE PRODUCT pursuant to this EULA, you may keep the
original media on which the SOFTWARE PRODUCT was provided by Gecko solely for backup or
archival purposes. If the original media is required to use the SOFTWARE PRODUCT on the
COMPUTER, you may make one copy of the SOFTWARE PRODUCT solely for backup or archival
purposes. Except as expressly provided in this EULA, you may not otherwise make copies of the
SOFTWARE PRODUCT, EDUCATIONAL LITERATURE, OR MULTIMEDIA PRODUCTS or the printed
materials accompanying the SOFTWARE PRODUCT.
7. U.S. GOVERNMENT RESTRICTED RIGHTS. All SOFTWARE PRODUCTS provided to the U.S. Government
pursuant to solicitations issued on or after December 1, 1995 is provided with the commercial
license rights and restrictions described elsewhere herein. All SOFTWARE PRODUCT provided to
the U. S. Government pursuant to solicitations issued prior to December 1, 1995 is provided
with "Restricted Rights" as provided for in FAR, 48 CFR 52.227-14 (JUNE 1987) or DFAR, 48 CFR
252.227-7013 (OCT 1988), as applicable.
8. EXPORT RESTRICTIONS. You agree that you will not export or re-export the SOFTWARE PRODUCT, any
part thereof, or any process or service that is the direct product of the SOFTWARE PRODUCT
(the foregoing collectively referred to as the "Restricted Components"), to any country, person
or entity subject to U.S. export restrictions. You specifically agree not to export or re-export any
of the Restricted Components: (i) to any country to which the U.S. has embargoed or restricted
the export of goods or services, which currently include, but are not necessarily limited to Cuba,
Iran, Iraq, Libya, North Korea, Sudan and Syria, or to any national of any such country, wherever
located, who intends to transmit or transport the Restricted Components back to such country;
(ii) to any person or entity who you know or have reason to know will utilize the Restricted
34
Components in the design, development or production of nuclear, chemical or biological
weapons; or (iii) to any person or entity who has been prohibited from participating in U.S.
export transactions by any federal agency of the U.S. government. You warrant and represent
that neither the BXA nor any other U.S. federal agency has suspended, revoked or denied your
export privileges. MISCELLANEOUS This EULA is governed by the laws of the State of Utah. If this
product was acquired outside the United States, then local law may apply. Should you have any
questions concerning this EULA, or if you desire to contact Gecko for any reason, please contact
Gecko on the World Wide Web at: www.GeckoSoftware.com.
LIMITED WARRANTY Gecko warrants that the SOFTWARE PRODUCT will attempt to perform in
accordance to our advertisements for a period of three (3) days from the date of receipt. If it
does not perform to your expectation, the only guarantee Gecko Software gives is a refund of
the purchase price paid of the said software application. This warranty is only good for a period
of thirty (30) days from the date of purchase, and only applies to This Product & its
corresponding expansion packs and plug-ins; this warranty does not apply to any accompanying
educational materials or supplies, which carries no warranty whatsoever.
This Product was designed for the intended use to be of a financial market educational resource only, as
a way to educate yourself to the normal seasonal trends and cycles created by past historical
market action. In no way can Gecko Software guarantee that markets will react in the future as
they have in the past, and therefore this tool is intended for reference purposes only, and is only
meant to be used as a guide to seasonal trends. In no way is Gecko Software suggesting that
you buy on the buy date and sell on the sell date. The dates specified in the software are only
intended as educational reference points for past trend beginnings and endings.
Gecko does not guarantee that any mathematical formulas are correct, or that any data is correct, or
that any of the rules used to create the software are correct. These are just our best guess, and
you as the licensee of the software agree not to hold Gecko liable for any mistakes,
discrepancies, inaccuracies or mathematical errors that may be included with the software
application, supporting materials, manuals, or supplemental products provided by Gecko
Software, Inc. or its subsidiaries, groups, friends, associates, managers, employee's, spouses, or
anyone else who lives on planet earth. You agree to use this software totally and 100% at your
own risk.
You must also agree to and recognize that the list of support technologies, provided by numerous
companies, is long and the ability to bring all these capabilities together in a workable solution is
magic at best, and the user recognizes that any failure of any of these technologies along the
way could cause any part of or all of this program and associated features to fail, and agrees to
hold Gecko and all associated companies harmless in all respects.
If an implied warranty or condition is created by your state/jurisdiction and federal or state/provincial
law prohibits disclaimer of it, you also have an implied warranty or condition, BUT ONLY AS TO
DEFECTS DISCOVERED DURING THE PERIOD OF THIS LIMITED WARRANTY (THREE (3) DAYS). AS
35
TO ANY DEFECTS DISCOVERED AFTER THE THREE (3) DAY PERIOD, THERE IS NO WARRANTY OR
CONDITION OF ANY KIND. Some states/jurisdictions do not allow limitations on duration of an
implied warranty, so the above limitation may not apply to you. Any supplements or updates to
the SOFTWARE PRODUCT, including without limitation, any (if any) service pack or hot fixes
provided to you after the expiration of the three (3) day Limited Warranty period are not
covered by any warranty or condition, express or implied.
LIMITATION ON REMEDIES; NO CONSEQUENTIAL OR OTHER DAMAGES Your exclusive remedy for any
breach of this Limited Warranty is as set forth below. Except for any refund elected by Gecko,
YOU ARE NOT ENTITLED TO ANY DAMAGES, INCLUDING BUT NOT LIMITED TO CONSEQUENTIAL
DAMAGES, if the SOFTWARE PRODUCT does not meet Gecko's Limited Warranty, and, to the
maximum extent allowed by applicable law, even if any remedy fails of its essential purpose. The
terms "Exclusion of Incidental, Consequential and Certain Other Damages" below are also
incorporated into this Limited Warranty. Some states/jurisdictions do not allow the exclusion or
limitation of incidental or consequential damages, so the above limitation or exclusion may not
apply to you. This Limited Warranty gives you specific legal rights. You may have others that vary
from state/jurisdiction to state/jurisdiction.
YOUR EXCLUSIVE REMEDY Gecko and its suppliers' entire liability and your exclusive remedy shall be, at
Gecko's option from time to time, (a) return of the price paid (if any) for, or (b) repair or
replacement of, the SOFTWARE PRODUCT that does not meet this Limited Warranty and that is
returned to Gecko with a copy of your receipt. You will receive the remedy elected by Gecko
without charge, except that you are responsible for any expenses you may incur (e.g. cost of
shipping the SOFTWARE PRODUCT to Gecko). This Limited Warranty is void if failure of the
SOFTWARE PRODUCT has resulted from accident, abuse, misapplication, abnormal use a virus or
as an act of god as defined by the laws of the state of Utah. Any replacement SOFTWARE
PRODUCT will be warranted for the remainder of the original warranty period of three (3) days.
Outside the United States, neither these remedies nor any product support services offered by
Gecko are available without proof of purchase from an authorized international source. To
exercise your remedy, contact: Gecko Software, Inc., Attn. Gecko Sales Information Center at
the Web address specified above.
DISCLAIMER OF WARRANTIES The limited warranty that appears above is the only express warranty
made to you and is provided in lieu of any other express warranties (if any) created by any
documentation, packaging, or outside reseller advertisements or claims. Except for the limited
warranty and to the maximum extent permitted by applicable law, Gecko and its suppliers
provide the SOFTWARE PRODUCT and Support Services (if any) AS IS AND WITH ALL FAULTS, and
hereby disclaim all other warranties and conditions, either express, implied or statutory,
including, but not limited to, any (if any) implied warranties or conditions of merchantability, of
fitness for a particular purpose, of lack of viruses, of accuracy or completeness of responses, of
results, and of lack of negligence or lack of workmanlike effort, all with regard to the SOFTWARE
PRODUCT, and the provision of or failure to provide Support Services. ALSO, THERE IS NO
WARRANTY OR CONDITION OF TITLE, QUIET ENJOYMENT, QUIET POSSESSION, AND
36
CORRESPONDENCE TO DESCRIPTION OR NON-INFRINGEMENT WITH REGARD TO THE
SOFTWARE PRODUCT.
EXCLUSION OF INCIDENTAL, CONSEQUENTIAL AND CERTAIN OTHER DAMAGES To the maximum extent
permitted by applicable law, in no event shall Gecko or its suppliers be liable for any special,
incidental, indirect, or consequential damages whatsoever (including, but not limited to,
damages for loss of profits or confidential or other information, for business interruption, for
personal injury, for loss of privacy, for failure to meet any duty including of good faith or of
reasonable care, for negligence, and for any other pecuniary or other loss whatsoever) arising
out of or in any way related to the use of or inability to use the SOFTWARE PRODUCT, the
provision of or failure to provide Support Services, or otherwise under or in connection with any
provision of this EULA, even in the event of the fault, tort (including negligence), strict liability,
breach of contract or breach of warranty of Gecko or any supplier, and even if Gecko or any
supplier has been advised of the possibility of such damages.
Gecko Software, Inc. at its discretion may, from time to time, contact you by telephone, fax, email,
paper mail, express mail, etc. By agreeing to this EULA and installing this software, you are giving
digitally written consent to receive telephone calls from Gecko Software, its affiliates, and
associated vendors, and you wave your rights to any laws prohibiting Gecko from contacting you
via telephone, fax, email, or any other method preferred by Gecko.
DATA DOWNLOAD/DATA CUBE IS DEFINED AS: This is a non-guaranteed service, with no rights or
privileges whatsoever, and is only an extension of the service provided by Gecko Software, Inc.
for This Product.
SUBSCRIPTION BASED DATA DOWNLOAD IS DEFINED AS: Data in which Gecko Software provides by
computer transmission services to their subscribing customers. This service is not a guaranteed
service, and may be discontinued, off line, or late for any given period or amount of time
without warranty or restitution. Data subscription services and fees are a non-refundable, nonguaranteed extension of service provided by Gecko Software Inc., for This Product.
Data has been provided from sources believed to be reliable but no guarantee is made as to its accuracy,
if/when trading "real" markets do not rely singularly upon This Product for your trading
decisions, consult a licensed brokerage firm to confirm ALL decisions and price information. This
license does not give any recipient the right to re-transmit or re-distribute this data in any
format whatsoever.
LIMITATION OF LIABILITY AND REMEDIES Notwithstanding any damages that you might incur for any
reason whatsoever (including, without limitation, all damages referenced above and all direct or
general damages), the entire liability of Gecko and any of its suppliers under any provision of
this EULA and your exclusive remedy for all of the foregoing (except for any remedy of repair or
replacement elected by Gecko with respect to any breach of the Limited Warranty) shall be
limited to the amount actually paid by you for the SOFTWARE PRODUCT. The foregoing
37
limitations, exclusions and disclaimers described above shall apply to the maximum extent
permitted by applicable law, even if any remedy fails its essential purpose.
This agreement will be governed by the laws of the state of Utah, excluding the application of its
conflicts of law rules. Any litigation under, arising out of, or in any manner related to this
agreement must be brought in the Cache County court, in the state of Utah.
High Risk Investment
Off-exchange foreign currency trading on margin, Futures on Margin, and Stock Trading all carry a high
level of risk and may not be suitable for all investors. The high degree of leverage can work
against you as well as for you. Before deciding to invest you should carefully consider your
investment objectives, level of experience, and risk appetite. The possibility exists that you could
sustain a loss of some, all, or even more than your initial investment and, therefore, you should
not invest money that you cannot afford to lose, or take risks beyond your means. You should
be aware of all the risks associated with off-exchange foreign currency trading and trading on
margin; seek advice from an independent and licensed financial advisor if you have any doubts.
Testimonial Disclaimer
Unique experiences and past performances do not guarantee future results! Most testimonials are
unsolicited and are therefore non-representative of all clients; certain accounts may have worse
performance than that indicated. Trading involves substantial risk and there is always the
potential for loss. Your trading results may vary. When the risk factor is compounded through
leveraged accounts, we suggest that only genuine 'risk' funds should be used in such trading. If
you do not have the extra capital that you can afford to lose, you should not trade with
leveraged/margin accounts. No 'safe' trading system has ever been devised, and no one can
guarantee profits or freedom from loss. Gecko Software does not pay for testimonials, all of our
testimonials, although may be solicited, are still voluntary.
Gecko Software, Inc. and its associated companies Opinions:
Any opinions, news, research, analyses, prices, or other information contained on this software is
provided as general market commentary, and does not constitute investment advice. Gecko
Software, Inc., or its associated firms will not accept liability for any loss or damage, including
without limitation to, any loss of profit, which may arise directly or indirectly from use of or
reliance on such information, products or services.
System Failure.
Client understands and acknowledges that technical problems or other conditions may delay or prevent
GECKO and/or GECKO Customers from receiving software updates. Gecko nor their partners
shall not be liable for, and clients agree not to hold or seek to hold Gecko or Gecko Partners
liable for any technical problems, system failures, and/or malfunctions, communication line
failures, equipment or software failures and/or malfunctions, system access issues, system
38
capacity issues, high Internet traffic demand, security breaches and unauthorized access that
are beyond the reasonable control of Gecko or their partners, and/or any other similar
computer problems and defects. Gecko and Gecko's Partners agree to use best efforts to
maintain the functioning of all system necessary programs, but Gecko nor its partners represent,
warrant or guarantee that GECKO and/or GECKO Customers will be able to access or use the
Partner Programs at times or locations of GECKO and/or GECKO Customers' choosing, or that
Gecko Partners will have adequate capacity for the Gecko and/or Gecko Partner Programs as a
whole or in any geographic location. Gecko does not represent, warrant, or guarantee that the
Gecko or Gecko Partner Programs will provide uninterrupted and error-free service. Gecko does
not make any warranties or guarantees, express or implied, with respect to Gecko or Gecko
Partners Programs or their function, including without limitation, warranties of merchantability
or fitness for a particular purpose. Gecko nor their partners shall not be liable for any loss, cost,
damage or other injury, whether in contract or tort, arising out of or caused in whole or in part
by use of or reliance on the Gecko or Gecko Partner Programs or their content. In no event will
Gecko or any Gecko Partner be liable for any punitive, consequential, special, or similar damages
even if advised of the possibility of such damage. If some jurisdictions do not allow the exclusion
or limitation of liability for certain damages, in such jurisdictions, the liability of Gecko shall be
limited in accordance with this Agreement to the extent permitted by law. Gecko reserves the
right to suspend service and deny access to any Gecko or Gecko Programs without prior notice
during scheduled or unscheduled system maintenance or upgrading.
Accuracy of Information
The content on Gecko Software & This Products related websites is subject to change at any time
without notice, and is provided for the sole purpose of assisting traders to make software
purchasing decisions, not trading decisions. Gecko Software, Inc. and its associated companies
have taken reasonable measures to ensure the accuracy of the information, however, does not
guarantee its accuracy, and will not accept liability for any loss or damage which may arise
directly or indirectly from the content or your inability to access the information, for any delay
in or failure of the transmission or the receipt of any instruction or notifications.
Distribution
This software is not intended for distribution, or use by, any person in any country where such
distribution or use would be contrary to local law or regulation. None of the services or
investments referred to in this software are available to persons residing in any country where
the provision of such services or investments would be contrary to local law or regulation. It is
the responsibility of visitor to ascertain the terms of and comply with any local law or regulation
to which they are subject.
Views, Opinions, and outside links
39
"The views and opinions represented in any link to an outside website links and/or resources are not
controlled by Gecko Software or by our associated firms. Further, Gecko Software nor our
associated firms are responsible for their availability, content, or delivery of services.
DISCLAIMER: THE DATA CONTAINED HEREIN IS BELIEVED TO BE RELIABLE BUT CANNOT BE GUARANTEED
AS TO RELIABILITY, ACCURACY, OR COMPLETENESS; AND, AS SUCH ARE SUBJECT TO CHANGE
WITHOUT NOTICE. WE WILL NOT BE RESPONSIBLE FOR ANYTHING, WHICH MAY RESULT FROM
RELIANCE ON THIS DATA OR THE OPINIONS EXPRESSED HERE IN.
DISCLOSURE OF RISK: THE RISK OF LOSS IN TRADING STOCKS, FUTURES, FOREX AND OPTIONS CAN BE
SUBSTANTIAL; THEREFORE, ONLY GENUINE RISK FUNDS SHOULD BE USED. STOCKS, FUTURES,
FOREX AND OPTIONS MAY NOT BE SUITABLE INVESTMENTS FOR ALL INDIVIDUALS, AND
INDIVIDUALS SHOULD CAREFULLY CONSIDER THEIR FINANCIAL CONDITION IN DECIDING
WHETHER TO TRADE. OPTION TRADERS SHOULD BE AWARE THAT THE EXERCISE OF A LONG
OPTION WOULD RESULT IN A FUTURES OR FOREX POSITION.
HYPOTHETICAL PERFORMANCE RESULTS HAVE MANY INHERENT LIMITATIONS, SOME OF WHICH ARE
DESCRIBED BELOW.
NO REPRESENTATION IS BEING MADE THAT ANY ACCOUNT WILL, OR IS LIKELY TO, ACHIEVE PROFITS OR
LOSSES SIMILAR TO THOSE SHOWN WITHIN THIS PRODUCT. IN FACT, THERE ARE FREQUENTLY
SHARP DIFFERENCES BETWEEN HYPOTHETICAL PERFORMANCE RESULTS AND THE ACTUAL
RESULTS SUBSEQUENTLY ACHIEVED BY ANY PARTICULAR TRADING PROGRAM.
WE ARE NOT RECOMMENDING TO BUY, SELL OR INVEST IN ANY SPECIFIC STOCK, FUTURES, FOREX OR
OPTION. THIS PRODUCT WAS DESIGNED FOR EDUCATIONAL AND RESEARCH PURPOSES ONLY.
ONE OF THE LIMITATIONS OF HYPOTHETICAL PERFORMANCE RESULTS IS THAT THEY ARE GENERALLY
PREPARED WITH THE BENEFIT OF HINDSIGHT. IN ADDITION, HYPOTHETICAL TRADING DOES NOT
INVOLVE FINANCIAL RISK, AND NO HYPOTHETICAL TRADING RECORD CAN COMPLETELY
ACCOUNT FOR THE IMPACT OF FINANCIAL RISK IN ACTUAL TRADING. FOR EXAMPLE, THE
ABILITY TO WITHSTAND LOSSES OR TO ADHERE TO A PARTICULAR TRADING PROGRAM, IN SPITE
OF TRADING LOSSES, ARE MATERIAL POINTS WHICH CAN ALSO ADVERSELY AFFECT ACTUAL
TRADING RESULTS. THERE ARE NUMEROUS OTHER FACTORS RELATED TO THE MARKETS, IN
GENERAL, OR TO THE IMPLEMENTATION OF ANY SPECIFIC TRADING PROGRAM WHICH CANNOT
BE FULLY ACCOUNTED FOR IN THE PREPARATION OF HYPOTHETICAL PERFORMANCE RESULTS
AND ALL OF WHICH CAN ADVERSELY AFFECT ACTUAL TRADING RESULTS.
40