1
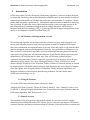
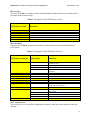
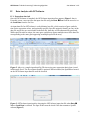
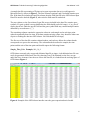
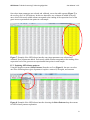
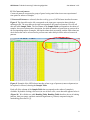
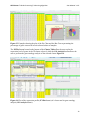
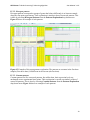
OPTricluster Order Preserving Triclustering Algorithm
User Manual - v1.0
Order Preserving Triclustering Algorithm
User Manual
(Version1.0)
Alain B. Tchagang
Ziying Liu
Sieu Phan
Fazel Famili
[email protected]
[email protected]
[email protected]
[email protected]
Knowledge Discovery Group,
Institute for Information Technology
National Research Council Canada
1200 Montreal Road, Ottawa, ON K1A 0R6, Canada
© 2012
0
OPTricluster Order Preserving Triclustering Algorithm
User Manual - v1.0
Content
I.
II.
III.
IV.
V.
VI.
VII.
Introduction...............................................................................................................
I.1. OPTricluster clustering method overview.......................................................
I.2. Citing OPTricluster..........................................................................................
I.3. Manual overview..............................................................................................
Running OPTricluster...............................................................................................
Input Interface............................................................................................................
III.1. Menu bar........................................................................................................
III.2. Tool bar.........................................................................................................
III.3. Working space...............................................................................................
Data Analysis with OPTricluster..............................................................................
IV.1. Expression data info......................................................................................
IV.2. OPTricluster input parameters interface........................................................
IV.3. Exploring OPTricluster patterns....................................................................
i. Conserved patterns................................................................................
ii. Divergent patterns.................................................................................
iii. Constant patterns...................................................................................
Integration with Gene Ontology.................................................................................
Integration with JFreeChart.......................................................................................
References......................................................................................................................
2
2
2
2
3
3
4
4
4
5
5
7
8
9
13
13
14
15
16
1
OPTricluster Order Preserving Triclustering Algorithm
I.
User Manual - v1.0
Introduction
OPTricluster stands for Order Preserving Triclustering Algorithm, a software package designed
for clustering, visualizing, and studying similarities and differences between samples in terms of
temporal expression profiles in 3D short time series gene expression data (2-4 samples, 3-8 time
points) from microarray experiments [1]. OPTricluster implements a novel method for analyzing
and visualizing 3D short time series expression data using the order preserving concept on the
time dimension and a combinatorial approach on the sample dimension. OPTricluster is
integrated with the Gene Ontology (GO) [2-3] allowing efficient biological interpretations of the
data. It is also integrated with the JFreeChart library [4].
I.1. OPTricluster clustering method overview
The triclustering algorithm we developed identifies triclusters of genes with expression level
having same direction across the time point experiments in subsets of samples. OPTricluster
takes into consideration the sequential nature of the time-series and is able to cope with the effect
of noise through the order preserving approach. Basically, for a given subset of samples, we say
that a tricluster is order preserving if there exists a permutation of the time points such that the
expression levels of the genes are monotonic functions. In all, after the data pre-processing and
normalization, OPTricluster has five main steps. First, OPTricluster performs the gene
expression data quantization. Second, it ranks the expression level of the genes across the timedimension in all the samples for a given filtering threshold (δ). Third, it identifies the set of
distinct coherent 3D patterns in the 3D dataset. Fourth, triclusters of coherent patterns are formed
by assigning genes with similar ranking along the time-dimension and across subsets of samples
to the same group, then divergent patterns are identified. Finally, statistical significance and
biological evaluation of the triclusters identified are performed. For more details about
OPTricluster methodology, see [1].
I.2. Citing OPTricluster
To cite the OPTricluster software please reference the paper:
Tchagang A.B, Phan S, Famili F, Shearer H, Fobert P, Huang Y, Zou J, Huang D, Cutler A, Liu
Z, and Pan Y. Mining biological information from 3D short time-series gene expression data: the
OPTricluster algorithm. BMC Bioinformatics, 2012.
I.3. Manual overview
The remainder of the main portion of the manual contains five sections. Section 2 contains
instructions on installing and starting OPTricluster. Section 3 discusses the input to OPTricluster.
Section 4 describes data analysis scenarios using OPTricluster, which allows users to explore and
2
OPTricluster Order Preserving Triclustering Algorithm
User Manual - v1.0
visualize different type of patterns. Section 5 describes the integration of OPTricluster with Gene
Ontology, and Section 6 its integration with the JFreeChart library.
II.
Running OPTricluster
•
To use OPTricluster a version of Java 1.6 or later must be installed. If Java 1.6 or later is
not currently installed, then it can be downloaded from http://www.java.com.
•
To install OPTricluster simply save the file OPTricluster.zip locally and then unzip it.
This will create a directory called OPTricluster.
•
To execute OPTricluster in Windows with its default initialization options simply double
click on the file runOPTricluster_Windows in the OPTricluster directory.
•
To execute OPTricluster in Linux with its default initialization options simply double
click on the file runOPTricluster_Linux in the OPTricluster directory.
•
To execute OPTricluster from a command line, change to the OPTricluster directory then
type: java -mx1024M -jar OPT.jar.
•
By only double clicking on the OPT.jar file in the OPTricluster directory, or type java
OPT.jar in the command line, OPTricluster will run without its defaults initialization
options.
III.
Input Interface
The first window that appears after OPTricluster is launched is the user input interface (Figure
1), which includes three sections: the menu bar, the tool bar, and the working space.
menu bar
tool bar
working space
Figure 1: Main user input interface of OPTricluster software. It is the first screen that appears
when OPTricluster is launched. It is divided into three sections: the menu bar, the tool bar, and
the working space.
3
OPTricluster Order Preserving Triclustering Algorithm
User Manual - v1.0
III.1. tool bar
The tool bar (Table 1) contains several command buttons which in some cases are short-cuts to
the menu items of the menu bar.
Table 1: Description of the OPTricluster tool bar
OPTricluster tool bar
Functions
OPTricluster
Load Data
Run OPTricluster
Select Patterns
Label
Information relative to the current version of OPTricluster
Loads new data for analysis
Calls the OPTricluster input parameters panel
Allows user to select type of patterns to explore (Conserved, Divergent, Constant)
Tells the user what to do at each step of the analysis
III.2. menu bar
The menu bar (Table 2) contains four menus; it can be used to access the functionalities of
OPTricluster.
Table 2: Description of the OPTricluster menu bar
OPTricluster menu bar
Menu items
Functions
File
New
Opens a new OPTricluster window while keeping
the last one open
Refreshes the current OPTricluster window
Closes the current OPTricluster window
Exits OPTricluster (close all the open OPTricluster
windows)
Refresh
Close
Exit
Edit
Open Data with Excel
Histogram
Opens the table data in excel
Distribution of the input data
Data
New
Testing
Update
Allows the user to load new dataset for analysis
Loads datasets that can be used to test OPTricluster
Allows the user to update the Gene Ontology and
the species annotation files
Help
About OPTricluster
Information relative to the current version of
OPTricluster
Information relative to the license of OPTricluster
Quick tutorial in PDF format
User manual in PDF format
Licensing
Quick Tutorial
User Manual
III.3. working space
The working space is reserved for displaying the results at each step of the analysis in the form
of tables.
4
OPTricluster Order Preserving Triclustering Algorithm
IV.
User Manual - v1.0
Data Analysis with OPTricluster
IV.1. Expression data info
Once the OPTricluster is launched, the OPTricluster input interface appears (Figure 1 above).
From this screen a user specifies the input data file using the Data New from the menu bar or
the Load Data from the tool bar.
An input data file for OPTricluster is a tab delimited text file, which consists of gene symbols,
time series expression values, and optionally spot IDs. Spot IDs uniquely identify an entry in the
data file, and if they are not included in the data file, then they will be automatically generated.
While spot IDs must be unique, the same gene symbol may appear multiple times in the data file
corresponding to the same gene appearing on multiple spots on the array.
Figure 2: Above is a sample input data file (3D time series gene expression data) when viewed
in Microsoft Excel. The first column SpotID is optional. When included, the SpotID box located
on the OPTricluster input data file must be checked.
Figure 3: OPTricluster input interface showing the OPTricluster input data file when Data New or Load Data is selected. The Spot ID box must be check if the data contains a SpotID
column (Figure 2).
5
OPTricluster Order Preserving Triclustering Algorithm
User Manual - v1.0
A sample data file representing a 3D time series gene expression data as it would appear in
Microsoft Excel is shown in Figure 2. The first column is optional, and if included contains spot
IDs. If the data file includes the spot IDs column, then the field Spot ID in the OPTricluster input
Data File must be checked (Figure 3), otherwise the field must be unchecked.
The next column, or the first column if spot IDs are not included in the data file, contains gene
symbols. If a gene symbol is not available then the field should not be left empty. A “no_match”
can be placed in it. Both the spot ID field and the gene symbol field may contain multiple entries
delimited by an underscore (“_”).
The remaining columns contain the expression values in each sample and at each time point
ordered sequentially based on time. If the data contains missing values, they should be taken care
of prior to loading the data into OPTricluster. No field should be left empty.
The first row of the data file contains column headers, and each row below the column header
corresponds to a spot on the microarray. The column header describes the sample, the time
points and the unit of the time point and should respect the following format:
Sample_Time_Unit. Example, Salt_16_h
OPTricluster currently only accepts tab-delimited data file as input. A tab-delimited text file can
easily be generated in Microsoft Excel by choosing Text (Tab delimited) as the Save as type
under the Save As menu. Once the user selects the data file, it is loaded into the working space of
OPTricluster Figure 4.
Figure 4: Example of the OPTricluster interface once the gene expression data is loaded.
6
OPTricluster Order Preserving Triclustering Algorithm
User Manual - v1.0
Figure 5: Example of the OPTricluster interface once the gene expression data is loaded and the
user selects Edit Histogram to view the distribution of the data.
IV.2. OPTricluster input parameters interface
Once the data is loaded, the user clicks on the Run OPTricluster from the tool bar. This action
brings up the OPTricluster input parameters interface (Figure 6). From this interface, the user
can input the different parameters necessary to run OPTricluster. These input parameters are: the
minimum number of genes in a cluster, the minimum number of samples in a cluster, and the
ranking threshold.
Figure 6: OPTricluster input parameters interface. It is used by the user to input the parameters
necessary for running OPTricluster.
7
OPTricluster Order Preserving Triclustering Algorithm
User Manual - v1.0
Once these input parameters are selected and validated, a new data table appears (Figure 7) in
the working space of OPTricluster. In this new data table, new columns are added to the old
ones, where each newly added column correspond to the ranking of the expression level of the
genes across experimental time points in each sample.
Figure 7: Example of the OPTricluster interface once input parameters are selected and
validated. New columns are added. Each newly added column corresponds to the ranking of the
expression level of the genes across experimental time points in each sample.
IV.3. Exploring OPTricluster patterns
Using the drop down menu (Select Patterns) from the tool bar (Figure 8), the user can select
one of the following three types of patterns to explore: conserved, divergent, and constant.
Figure 8: Example of the OPTricluster interface showing the Select Patterns drop down menu
for OPTricluster patterns exploration.
8
OPTricluster Order Preserving Triclustering Algorithm
User Manual - v1.0
IV.3.1 Conserved patterns
Conserved patterns correspond to group of genes having same behaviour across experimental
time points in subsets of samples.
If Conserved Patterns are selected, then the working space of OPTricluster interface becomes
Figure 9. The data table on the left corresponds to the input gene expression data with their
ranking profile. The new table on the right corresponds to the conserved patterns. We will call
this new table Sample Table. The fist column of the Sample Table corresponds to the subset of
samples, the second column their description, the third the number of genes that are conserved in
the corresponding subset of samples, the fourth column their percentage, and the fifth column are
check boxes that can be selected and to perform some other analysis on the selected conserved
patterns.
Figure 9: Example of the OPTricluster interface when a type of patterns (conserved patterns) to
be explored is selected, showing the Sample Table.
Each cell of the column of the Sample Table that corresponds to the subset of samples is
clickable. By double clicking (click twice) in one of these cells, a new data table appears below it
(Figure 10). We call this new table Ranking Table. Ranking Table describes the set of ranking
patterns, their percentage, and their statistical significance (p-values) computed using the
methodology describes in [1].
9
OPTricluster Order Preserving Triclustering Algorithm
User Manual - v1.0
Figure 10: Example of the OPTricluster interface when a pattern to be explored is selected and a
subset of sample selected (double clicking twice in a row of the Sample Table), showing the
Ranking Table.
Furthermore, each cell of the first column of the Ranking Table is clickable. By double clicking
(click twice) in one of these cells, a new table appears below it (Figure 11). This new data table
is the Cluster Table. The Cluster Table describes the set of genes that belong to this group,
their expression level, sample sets and time points.
Figure 11: Example of the OPTricluster interface when a pattern to be explored is selected
(Conserved Patterns Selected), a subset of sample selected (double clicking twice in a row of the
Sample Table), and a ranking profile selected (double clicking twice in a row of the Ranking
Table), showing the Cluster Table.
10
OPTricluster Order Preserving Triclustering Algorithm
User Manual - v1.0
At each step along the way, via the “Open Table in Excel” button that appears under the
Sample Table (Figure 12), Ranking Table, and the Cluster Table, the user can open the table
in Excel and do more analysis in Excel using its rich capabilities.
Figure 12: Additional OPTricluster commands that the user can exploit during the analysis to get
more insights on the gene expression data.
The Select Chart to Plot drop down menu also allows the user to do more on the fly analyses of
the data in the corresponding table (Sample Table and Ranking Table). These on the fly
analyses are described in Table 3.
Table 3: Select Chart to Plot drop down menu description
OPTricluster Explore Menu
Function
Pie Chart
Pie Chart 3D
Bar Chart
Bar Chart 3D
Difference
GO Analysis
Open Selected in Excel
Merge (only in Ranking Table)
Plot the pie chart of the selected items
Plot the 3D pie chart of the selected items
Plot the bar chart of the selected items
Plot the bar chart of the selected items
Take the difference of the selected items
Gene Ontology analysis of the selected item
Open the expression level of the selected item in Excel
Merge the expression level of selected items
11
OPTricluster Order Preserving Triclustering Algorithm
User Manual - v1.0
Figure 13: Example showing the plot of the Pie Chart and the Bar Chart representing the
percentage of genes conserved in each selected subset of samples.
The XYPlot button located at the bottom of the Cluster Table allow the user to plot the
expression level of genes in the 3D cluster selected, while the GO Analysis button allows the
user to perform the gene ontology analysis of the selected cluster Figure 14.
Figure 14: Plot of the expression profile (XYPlot button) of a cluster and its gene ontology
analysis (GO Analysis button).
12
OPTricluster Order Preserving Triclustering Algorithm
User Manual - v1.0
IV.3.2. Divergent patterns
Divergent patterns correspond to groups of genes that behave differently in at least one sample
along the time point experiments. Their exploration is similar to that of conserved patterns. This
is done by selecting Divergent Patterns from the Patterns Exploration drop down menu.
Figure 15 shows an example of such patterns.
Figure 15: Example of divergent patterns exploration. The patterns are constant in the first three
samples (first three chats), but different in the last one (the last chart).
IV.3.3. Constant patterns
Constant patterns are like conserved patterns, but unlike them, their expression level stay
unchanged across experimental time points. Their exploration is carried out similarly to that of
conserved patterns. This is done by selecting Constant Patterns from the Patterns Exploration
drop down menu. Figure 16 shows an example of such patterns.
13
OPTricluster Order Preserving Triclustering Algorithm
User Manual - v1.0
Figure 16: Example of constant patterns exploration. In this example, the patterns are unchanged
in the four samples (four charts).
V.
Integration to Gene Ontology (GO Analysis button)
In a post processing step, OPTricluster also makes use of external Gene Ontology files.
OPTricluster can download the Gene Ontology gene annotation files directly from the websites
of the Gene Ontology [2]. This is done using the menu Data Update Gene Ontology for
the ontology files, and Data Update Species Annotation Files for the species annotation
files. This can also be done using the Update Annotations or the Update Gene Ontology File
buttons located on the OPTricluster GO analysis input parameters interface (Figure 17).
Figure 17: OPTricluster GO Analysis input parameters interface.
14
OPTricluster Order Preserving Triclustering Algorithm
User Manual - v1.0
The GO Analysis button that appears at each step of the analysis allows the user to perform the
gene ontology analysis of the current results. In fact the GO analysis plug-in of the Gene
Ontology Analysis (GOAL) [3] package that we recently developed is integrated into
OPTricluster for biological evaluation of the clusters. Thus the user can use of the rich
functionalities already integrated to the GOAL package to manipulate the GO results table
Figure 18.
Figure 18: Gene Ontology analysis results table. The user can exploit the functionalities already
integrated to the GOAL software to manipulate the table. This could be through the file menu, or
by double clicking in a cell GO term for example to see its description, or on gene count cell for
the gene lists associated to the GO term.
VI.
Integration to the JFreeChart Library
Portions of the interface of OPTricluster are implemented using the JFreeChart [4] library. This
library is mostly used for graphing (Pie Chart, Bar Chart, XYPlot, etc...). The user can use the
15
OPTricluster Order Preserving Triclustering Algorithm
User Manual - v1.0
rich functionalities provided in JFreeChart to manipulate the charts. This is done by right
clicking on the chart and exploring the chart using the dropped down menu Figure 19.
Figure 19: Manipulation of the JFreeChart charts by right clicking on the plot and exploiting the
dropped down menu to manipulate the chart. This includes: changing the properties of the chart,
copying, saving, printing, and zooming.
VII.
References
1. Tchagang A.B, Phan S, Famili F, Shearer H, Fobert P, Huang Y, Zou J, Huang D, Cutler
A, Liu Z, and Pan Y. Mining biological information from 3D short time-series gene
expression data: the OPTricluster algorithm. BMC Bioinformatics, under review.
2. Gene Ontology [http://www.geneontology.org/]
3. Tchagang AB, Gawronski A, Bérubé H, Phan S, Famili F, Pan Y: GOAL: A Software
Tool for Assessing Biological Significance of Genes group. BMC Bioinformatics 2010,
11:229.
4. JFreeChart [http://www.jfree.org/jfreechart/].
16