1
IFREMER
SCOOP
user manual
SYSTEM OF CONTROL ORIENTED
OCEANOGRAPHIC PARAMETERS
SCOOP
USER MANUAL
VERSION APPLICABLE
Written by:
Signature and date:
Approved by:
Signature and date:
D. BARDET
Approved by:
Signature and date:
Approved by:
Signature and date:
SISMER/SCOOP/MU/110
V4.2 02/05/00
Page
1
IFREMER
SCOOP
user manual
VERSION HISTORY
Ver.
Date
Written by
Object of modification
Pages
01
02.95
D. DESCHAMPS
Creation
1.1
03.95
D. BARDET
Following proof-reading
by IFREMER.
all
2.0
02.96
D. BARDET
Modifications related
with the upgrades of
SCOOP version 2.0
7,8, 9, 11, 12,
14, 22, 23, 33,
35, 37, 42, 43
modified
2.1
03.96
D. BARDET
Customer proof-read
added removed
9, 10, 11,
13,14,16,
17,18,1920,21,2
2,23,24,25,26,3
1,33,34,36,37,4
2,43,45
7, 12, 37
3.0
09.96
D. BARDET
Upgrade, file loading
tool added
5,7,8,9,10,11,12 46
,1314,16,19,20,
25,26,27,35,40,
41,42,43,44,45
48, 50
4.0
09/98
G. GOARIN
Upgrade, added the
Merging and Add
parameters tools
5, 7, 10, 26, 34,
35, 43, 46
4.1
08/99
D. BARDET
Upgrades for software
version 4.1
5,38,54
4.2
05/00
D.BARDET
Software version 4.2
4,7,8,9,19,27,28
,36,37,40,41,42,
43,44,45,46,58
SISMER/SCOOP/MU/110
V4.2 02/05/00
Page
2
IFREMER
SCOOP
user manual
CONTENTS
1
OBJECT .................................................................................................................................................. 4
2
DOCUMENTS APPLICABLE AND REFERENCE DOCUMENTS....................................................................... 5
2.1
2.2
DOCUMENTS APPLICABLE ..................................................................................................................... 5
REFERENCE DOCUMENTS ...................................................................................................................... 5
3
TERMINOLOGY....................................................................................................................................... 6
4
PRESENTATION OF THE SCOOP SOFTWARE. ............................................................................................ 7
4.1
4.2
4.3
5
THE TESTS ........................................................................................................................................... 8
ASSOCIATED TOOLS ............................................................................................................................. 9
SOFTWARE INPUT-OUTPUT ..................................................................................................................... 9
APPLICATION PARAMETERS.................................................................................................................. 11
5.1
PRESENTATION OF THE PARAMETERS. ..................................................................................................... 11
5.2
C ONFIGURATION MAINTENANCE. ......................................................................................................... 13
5.2.1
The groups.............................................................................................................................. 13
5.2.2
The parameters ...................................................................................................................... 13
5.2.3
The other reference tables...................................................................................................... 13
6
MONITOR FUNCTION............................................................................................................................ 14
7
QUALITY CHECK RELATED FUNCTIONS.................................................................................................. 17
7.1
QC0: FORMAT CHECK....................................................................................................................... 17
7.2
QC11: AUTOMATIC HEADER CHECK .................................................................................................... 20
7.3
QC12: HEADER VISUAL CHECK. ........................................................................................................... 22
7.4
CP: LOADING PARAMETERS ................................................................................................................ 36
7.5
QC21: AUTOMATIC PARAMETER CHECK ............................................................................................... 39
7.6
QC22: PARAMETERS VISUAL CHECK ..................................................................................................... 41
7.6.1
Description of the functions.................................................................................................... 42
7.6.2
Operating mode.................................................................................................................... 50
8
FILE MANAGEMENT RELATED FUNCTIONS............................................................................................. 51
8.1
8.2
8.3
8.4
8.5
8.6
8.7
8.8
GENERATING SUMMARIES. .................................................................................................................. 51
ADDING PARAMETERS. ....................................................................................................................... 53
SUPPRESSING PARAMETERS . ................................................................................................................ 55
MERGING FILES. ................................................................................................................................ 56
FILE CONCATENATION. ....................................................................................................................... 58
SPLITTING FILES. ................................................................................................................................. 60
STATISTICS ........................................................................................................................................ 61
LOADING FILES .................................................................................................................................. 62
SISMER/SCOOP/MU/110
V4.2 02/05/00
Page
3
IFREMER
SCOOP
1
user manual
OBJECT
The object of this user manual is to describe the use of the SCOOP software (System of Control Oriented
Oceanographic Parameters), designed for the “ Centre National de Données Océanographiques
Français ” (IFREMER/SISMER).
It is a validation assistance expert system. It reads ASCII files (MEDATLAS format), and exports files in the
same format, after adding quality flags for each numeric value controlled.
In addition, it includes file handling tools.
It uses code and reference data tables.
SISMER/SCOOP/MU/110
V4.2 02/05/00
Page
4
IFREMER
SCOOP
user manual
2
DOCUMENTS APPLICABLE AND REFERENCE DOCUMENTS
2.1
Documents applicable
-
2.2
The proposition from ALCATEL TITN ANSWARE.
Reference documents
-
ALCATEL TITN ANSWARE Quality Manual,
ALCATEL TITN ANSWARE Asmodée standard, Project management method,
SCOOP SISMER/SCOOP/PLQ/000 Quality Plan, 1-0, October 1994,
Specifications file for the SCOOP SISMER/SCOOP/DSL/010 software, October 1994 V1.1,
Data dictionary, SISMER/SCOOP/DIC/012 10 January 1995,
Medatlas, specifications for the Mediterranean data banking SISMER/94/IS/014 version 3.1,
Upgrades for the SCOOP software, specifications SISMER/SCOOP/DSL/012 V 1.1 February 1996,
SCOOP version 4, software upgrades time series control (Detailed specifications)
DITI/IDT/SISMER/98/040,
Software architecture file version 4 SISMER/SCOOP/DCD/020,
Implementation of the upgrades of the SCOOP software contract n° 99/2 210 854.
Upgrades of the SCOOP software to version 4.2 contract n° 00/2 210 058
SISMER/SCOOP/MU/110
V4.2 02/05/00
Page
5
IFREMER
SCOOP
3
user manual
TERMINOLOGY
Please refer to the following documents:
• Quality Plan SCOOP SISMER/SCOOP/PLQ/000, Terminology section.
• Specification file for the SCOOP SISMER/SCOOP/DSL/010 software, October 1994 V1.1, Chapter 4
Glossary.
However, the following definitions are reminded:
Current cruise:
Cruise which is described in the window "cruise description" in QC.1.2, and displayed in color on the
map background.
File/Cruise subject to quality check:
File chosen on the sequencing monitor level at the beginning of the current sessions, which is
processed by the SCOOP validation chain.
Parameter couple:
A selection of two parameters in order to produce a graphic representation of one of the
parameters in respect of the other (abscissa, ordinate).
e.g. P,T is a couple of parameters.
Group of parameters:
Internal SCOOP notion. The parameters are grouped, in order to facilitate data validation. Hence,
several parameters are validated in each validation chain process.
A group comprises several parameter couples.
e.g. The TS group comprises the P, T and S parameters and the (P,T), (P,S), (T,S) couples.
There is a fictitious group, matching the validation of the headings, named with the code G00.
Parameter:
Heading of a column of figures matching the same type of measurements or calculations. It is
included in station headings. Encoding for these parameters is identical to that of GF3.
All parameters measured or calculated present in a data file are listed in the station heading.
Type of data:
Information contained in the cruise and station headers. This type corresponds to the ROSCOP code
for data acquired during a cruise for a station.
For a cruise, there can be several types of data; for a station, a single type of data is included in the
heading, i.e. H10 (for CTD data) or H09 (for bottle data).
Progress status:
A value associated with a file, specifying the checks performed. Progress status for the checks is related
with a data file and a group of parameters (on the QC1 level, this group is set to G00).
Time series:
The reference parameter of files containing time series is time, represented using the following
parameters:
• YEAR MNTH DAYX TIME or
• YEAR DATE TIME
SISMER/SCOOP/MU/110
V4.2 02/05/00
Page
6
IFREMER
SCOOP
4
user manual
Presentation of the SCOOP software.
The SCOOP software is a quality check (QC) chain customized for oceanographic data collected:
• At a given point on all or part of the water column on vertical profiles (station):
• At a given point of the water column during a given lapse of time, time series.
This check consists in running a number of standardized tests, in compliance with the recommendations
of the Intergovernmental Oceanographic Commission, upstream any archiving or broadcasting of this
data.
In addition, it enables handling the files.
SCOOP comprises the following functions:
•
The monitor enabling to chain the various functions.
•
The modules of the QC section as such. These modules are independent from one
another.
•
The tools.
The organization of the software in its operating version is:
$(SCOOP_HOME)
bin
(Exécutables)
data
(Traits de côtes,
isobathes, ... )
The $(SCOOP_HOME) directory is indicated with an environment variable.
The application’s environment variables are:
• HOME_CLIMATO, specifying the directory storing the climatology files.
• HOME_ETOPO5, specifying the directory storing the etopo5.dat file.
• SCOOP_HOME, specifying the directory grouping the set of files required for the project.
• SERVEUR_DATA, specifying the directory storing the copies of the data summaries to be archived
in the SISMER server.
SISMER/SCOOP/MU/110
V4.2 02/05/00
Page
7
IFREMER
SCOOP
user manual
4.1 The tests
QC 0: Input format check
Displays the list of any anomalies encountered.
QC 11: Automatic header check
- Search for double entries within a preset space-time radius
- Date check
- Checks ship velocity between two consecutive stations
- Floor depth check
In the case of time series:
• Sensor depth check
• Series duration check
• Search for double entries: acknowledgement of the sensor’s depth
• Land position
QC12: Header visual check
• Station position chart or time series on the map with coastline
• Ship velocity graph
• Viewing possible for a bathymetry selection
• Slightly offset display of another cruise if one or several stations comprise double entries
QC 21: Automatic parameter check (measurement points)
• Presence of at least two parameters (vertical reference + measurement)
• The abscissa (pressure or time) must be monotonous increasing
• Pressure must not exceed the equivalent of the floor depth
• The parameters must be included between the minimum and maximum limits according to
the region (the region is displayed on the error message) and depth
For a time series, in the absence of PRES, SENSOR_DEPTH is used to determine the minimum
and maximum values to be used.
• The profile must not be constant (sensor jammed or faulty)
• Peaks are detected
• Test on deviation in respect of pre-existing climatological statistics for the zone
• Tests specific to certain parameters (no density inversion on the vertical)
• Tests in the case of current meter, of the presence of at least one of the velocity/heading or
East/North couples.
• Specific test on pressure in the case of time series
• In the case of current meter time series, if the heading or velocity of the current is flagged at
3 or 4, the flag is carried over to the East and North components.
QC 22: Parameters Visual Check
•
Superimposed charts
•
Offset charts
•
Zooming
•
Possibility to recall another cruise on the zone
SISMER/SCOOP/MU/110
V4.2 02/05/00
Page
8
IFREMER
SCOOP
user manual
•
•
•
Profile display filtered in the case of time series
Display of the reference profiles and variation envelope
Display specific to certain parameters (Redfield ratio)
4.2 Associated tools
•
•
•
•
•
•
•
Parameter suppression : “Suppress parameters”,
Parameter addition : “Add parameters”,
Merging : “Merge files”,
Concatenation : “Concatenate file”,
File splitting : “Split file”
To prepare the data files upstream the chain
The Statistics tool, “Statistics”, enabling to print the contents of the STAT_GLOBAL and
STAT_PARAM tables.
The Load file tool, “Load Files”, enabling to load a set of files in the MEDATLAS format,
without requiring user intervention.
In addition, a specific SISMER tool:
•
“Create summary”, Summary enabling the generation of operating reports for the
archiving center (SISMER).
4.3 Software Input-Output
Input
•
The data is in the form of an ASCII file in the MEDATLAS format. The file comprises a cruise header
and a series of station + profile headers.
•
The application parameters.
Output
•
The checked files for which each numeric value is completed with an indicator (or flag). The data is
never modified.
•
The list of anomalies encountered during the various checks.
SISMER/SCOOP/MU/110
V4.2 02/05/00
Page
9
IFREMER
SCOOP
user manual
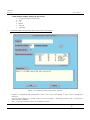
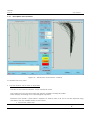
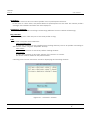
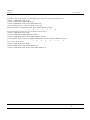
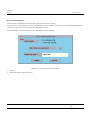
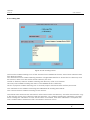
Upon starting, the application displays for 5 seconds (adjustable time), the following logo:
Figure 1 : Logo screen
SISMER/SCOOP/MU/110
V4.2 02/05/00
Page
10
IFREMER
SCOOP
5
Application parameters
5.1
Presentation of the parameters.
user manual
The following parameters must be initialized in a "PARAM_APPLI" table:
•
CH_DIR_TRAVAIL:
Path of the directory for the application’s internal working files.
•
LISTE_IMPRIMANTE:
List of printers available.
•
LISTE_VITESSE :
List of the velocities in the “ Ship velocity in knots ” menu, in the monitor
screen.
•
VITESSE_DEFAUT:
Default ship velocity (15).
• TIME_OUT:
Time-out for the SISMER LOGO screen (time after which the window
disappears, default value 5 seconds) (Monitor).
•
EPS_DEFAUT:
Default value for the vertical instability threshold accepted (= 0.03 in
sigma-t EPS_DEFAUT: default).(QC21).
•
DECALAGE_PROFILS:
Default offset for offset profiles (Default value: 30
pixels) (QC22).
•
DOUBLE_NB_STATIONS Number of double stations (default: 1 station) (QC11) to detect double
cruises.
•
DOUBLE_DIFF_TEMPS:
Time deviation defining the double stations between 2 cruises (1440
minutes: default value) (QC11).
•
DOUBLE_DIFF_POSITION: Deviation in positions defining the double stations between 2 cruises (1
mile: default value) QC11).
•
DOUBLESTA_DIFFTEMPS: Time deviation defining the double stations within the same cruise (QC11).
Default value: 30 minutes.
•
DOUBLESTA_DIFFPOSITION: Position deviation defining the double stations within a same cruise
(QC11). Default value: 1 mile.
•
STAT_FACMAXPRES,
Pressure test in respect of ETOPO5(QC21).
•
LIMITE_ZONE1:
Upper depth for zone 1 (QC21).
•
LIMITE_ZONE2:
Upper depth for zone 2 (QC21).
•
STAT_FACTEUR1:
Number of standard deviations in highly variable zone (QC21) between
the surface and LIMITE_ZONE1 (default value 4).
•
STAT_FACTEUR2:
Number of standard deviations authorized in medium variable zone (3)
(QC21) between LIMITE_ZONE1 and LIMITE_ZONE2.
•
STAT_FACTEUR3:
Number of standard deviations authorized in low variation zone (QC21)
between
LIMITE_ZONE2 and the floor (default value 2).
•
DEC_DOUBLE_AFFICHAGE: Default offset for double profiles (Default value: 10 pixels) (QC12)
(default value 2).
•
INCERTITUDE_PROF:
Uncertainty on ETOPO5 for pressure control: PRES > PROF heading +
INCERTITUDE_PROF (Default value + 5%) (QC21).
•
NBPRESCROISSANT :
Number of points at beginning and end of profile, to test whether a profile
is reversed
(Default value 5) (QC21).
•
POURCENTAGE_QCPROFIL : QC percentage of the profile points in order to assign the global QC
to the profile (Default value 50 %) (QC22).
•
POURCENTAGE_PROFSTAT: Uncertainty on ETOPO5 for station depth control (QC11).
Default value 20 %
SISMER/SCOOP/MU/110
V4.2 02/05/00
Page
11
IFREMER
SCOOP
user manual
•
LANGUE_DEFAUT:
Default language ('E' English and 'F' French). If this choice is not modified
on the monitor level, the language chosen is used for all labels in the SCOOP software.
•
ECART_PRESSION:
Pressure deviation for file merge.
•STAT_FACTEUR_ST:
QC21 – Number of times standard deviation for a time series, intervening
in out of envelope detection.
•POURCENTAGE_DISTFOND: QC21 – Uncertainty on time series depth.
•LARGEUR_FILTRE:
QC21 – Width of the LANCZOS filter.
•DUREE_SERIE_MIN:
QC21 – Minimum duration of a time series ensuring it passes in the
LANCZOS filter.
•INTERVALLE_SERIE:
QC21 – Minimum gap between two time series measurements for the
LANCZOS filter.
•DOUBLE_DIFFPROF:
QC21 – Sensor depth difference for double time series detection.
•LISTE_EPS:
List of instabilities proposed on the monitor screen.
SISMER/SCOOP/MU/110
V4.2 02/05/00
Page
12
IFREMER
SCOOP
5.2
user manual
Configuration maintenance.
This module is a self-standing module, as it is not called by the chaining monitor.
It enables creating a group of parameters (GROUP table) matching a list of parameters to check. These
parameters are grouped into couples (X/Y) (COUPLE table) in order to enable their viewing in the form
of a curve.
It also enables associating, with each parameter, value limits per geographical zone, and valid default
values which will be used per geographical zone, and default value limits which will be used for
specific regions (table PARAM_REGION).
Finally, it enables performing maintenance for the reference tables: CLIMATOLOGIE, CENTRE, PAYS,
APPLICATION, NAVIRE, TYPE_DONNEE, REGION, FIC_PARAM, PARAMETRE, and the application’s
configuration table: PARAM_APPLI.
Description of the functions.
5.2.1
The groups.
The user enters a group name and links parameters with it. To these parameters must be associated
with a reference climatology, which will be used in the processes as the default climatology.
Once the group name has been entered or selected in a list (NOM_GROUPE from the GROUPE table),
the parameters can display in the form of a list of values (code GF3 + label, matching the
CODE_PARAMETRE and NOM_PARAMETRE fields of the PARAMETRE table) and the user can select one or
several parameter couples, and associate them with a climatology (CLIMATOLOGIE table). By default,
this climatology is "LEVITUS 98" when the user does not enter one.
If the group name exists, the user modifies the group required. The list of couples of parameters displays
and the user can:
• modify an existing couple (change a parameter or the climatology),
• suppress a couple,
• add a couple.
5.2.2
The parameters
The user can create, suppress, or modify parameters and their different associated values.
For each parameter, the user can associate minimum and maximum values for a specific zone
(MIN_REGION,MAX_REGION,PIC_REGION,PIC_BORNE_REGION,PRESSION_MIN, PRESSION_MAX fields in the
PARAM_REGION table) and/or the same values regardless of the geographic zone (MIN_PARAM,
MAX_PARAM, PIC, PIC_BORNE fields in the PARAMETRE table).
5.2.3
The other reference tables.
The user creates, modifies or suppresses records in the tables: CLIMATOLOGIE, CENTRE, PAYS,
APPLICATION, NAVIRE, TYPE_DONNEE, REGION, FIC_PARAM, PARAM_APPLI.
SISMER/SCOOP/MU/110
V4.2 02/05/00
Page
13
IFREMER
SCOOP
6
user manual
MONITOR FUNCTION
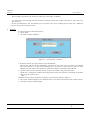
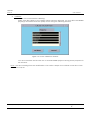
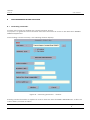
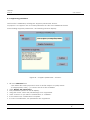
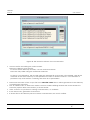
The opening logo displays:
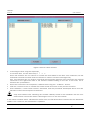
Figure 2: Monitor screen
It is the menu displayed for the user, which remains constantly on screen.
The left-hand column corresponds to the quality check steps, the right-hand column to processes
associated with the tools.
It is on this level that the ship’s maximum velocity can be chosen, required for automatic checking.
The density threshold used by QC21 can be chosen.
To modify the default language for the SCOOP labels, use the Version menu (English or French).
SISMER/SCOOP/MU/110
V4.2 02/05/00
Page
14
IFREMER
SCOOP
user manual
Activating the “ Data ” function results in redisplaying the heading’s visual check screen in the viewing
mode (Button "Validate" and "Quit" invalid).
If the QC21 and QC22 checks have been run, it is possible to skip the QC21 or QC11 check again.
Request "Checks already run. Do you wish to run them again (yes or no) ?"
As its name suggests, the “ Quit ” button enables quitting the application at any time. The state of
progress of the file checked is then that of the last process performed and validated applied to it.
When starting SCOOP, only the "Quit", "File selection" buttons, and those in the right-hand column are
enabled. They will remain so constantly (except during processing).
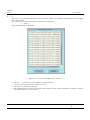
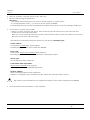
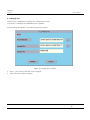
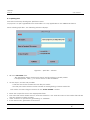
The user can choose the MEDATLAS file to check using the "File selection" button, which provides access
to a file selector:
•
•
Click the "Cancel" button to prevent selecting files. In this case, the chaining monitor will return
systematically to the presentation described above.
Click the "Filter" button to display the files in the selected directory.
Figure 3: Files selection
•
•
•
Select the file using the mouse.
Click "Validate" to confirm your selection.
The name of the file selected then displays in the heading of the monitor window.
The file selected is immediately made inaccessible on all monitors in the network. It will be released
when the user processing it selects a new file. Conversely, the file selected can already be processed on
SISMER/SCOOP/MU/110
V4.2 02/05/00
Page
15
IFREMER
SCOOP
user manual
another monitor. An identical window then displays the message "File being processed on another
monitor", and it returns the user to the selection of another file.
If the file has never been checked, only the "Format" button is enabled.
in the other cases, the "Format", "Header" and "Data" buttons are enabled according to the file’s state
of progress in the quality check chain: The checks possible are those already run, as well as the next one
in the chain.
The
•
•
•
•
•
various states of progress are:
0, format check run ("Format", "Header" enabled).
11, header automatic check run ("Format", "Header" enabled).
12, header visual check ("Header" & "Data" enabled).
21, automatic parameter check run ("Header" & "Data" enabled).
22, parameter visual check run ("Format", "Header" & "Data" enabled).
To move from one button to another, use the mouse or the “ Tab ” key.
The "Header" button enables the automatic header check, and chaining with the header visual check is
immediate and requires no user intervention.
The "Data" button enables changing parameters, then automatic parameter check, and checking the
chaining with the parameter visual checking is performed.
The
•
•
•
•
•
•
•
right-hand part of the monitor screen (similar to a file manager) enables activating:
"Create summary", generates summaries.
"Add Parameters ", adds parameters at their default value in a file.
"Suppress parameters", suppresses parameters in a file.
"Merge files", merges two files.
"Concatenate Files", concatenates files.
"Split File ", splits a global file into N files (1 per station).
"Statistics", Prints the contents of the STAT_GLOBAL and STAT_PARAM tables in a file.
During the checks associated with the "Format", "Header" and "Data" buttons, all the monitor buttons
are disabled, and the mouse pointer changes into an hour glass icon.
It is always possible to repeat a previously run check on a file. In this case, the state of progress is not
modified, and the buttons enabled after the operation are the same as before.
The use of the various buttons, as well as the associated processes, are described in the following
chapters.
SISMER/SCOOP/MU/110
V4.2 02/05/00
Page
16
IFREMER
SCOOP
7
user manual
QUALITY CHECK RELATED FUNCTIONS.
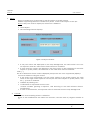
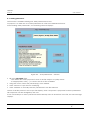
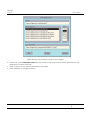
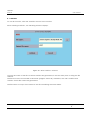
7.1 QC0: Format check.
It is activated using the "Format" button.
It is the first check applicable to a file.
The number of anomalies detected displays upon completion of the process.
A format check without errors is completed with the following window:
Figure 4: Window specifying a valid format
In case of error, the correction operates in the interactive mode, as the anomalies are displayed for the
user, who corrects them and validates the correction as follows:
After completion of the checks, the following window displays with:
On the right, the lines to be corrected, and on the left (across) the labels for the corresponding errors.
SISMER/SCOOP/MU/110
V4.2 02/05/00
Page
17
IFREMER
SCOOP
user manual
Figure 5: Format Check window
•
•
•
•
Correcting the lines using the keyboard.
To scroll the lines, use the arrow keys:↓ ↑ → ←
When the windows are too narrow to contain the error labels for the lines to be corrected, use the
horizontal scroll bars located under the window in order to scroll the messages fully.
Also, if the windows are too small to contain all the messages and lines to be corrected, the vertical
scroll bars in the right-hand side of the window enable scrolling to the rest. In this case, the 2
windows are synchronized.
When the corrections are completed, validate them using the “ Validate ” button.
Click the "Cancel" button to cancel the format check and return to the previous situation.
After validation, a new format check is launched, and the procedure developed above must be
followed until the result required is achieved.
Only errors related with checking the headers already stored in the database and the noncritical errors can remain without affecting the move to the next checks.
If this check succeeds and is validated for the first time, the file information is inserted into the Database
tables. If it is a new run, the information is updated.
SISMER/SCOOP/MU/110
V4.2 02/05/00
Page
18
IFREMER
SCOOP
SISMER/SCOOP/MU/110
user manual
V4.2 02/05/00
Page
19
IFREMER
SCOOP
7.2
user manual
QC11: Automatic header check
It is enabled using the "Header" button and has no user interface.
The following table presents the checks run and the error messages, as well as the value of the
matching flags, in case of error.
Check
The end date exceeds the cruise
begin date.
The year in the begin date
matches the 5 to 8 characters in
the cruise reference.
The date of each station is
between the cruise begin and
end dates.
The velocity between two
stations exceeds the max value
chosen on the level of the
chaining monitor.
Depth is not filled in.
Depth is included within the limits
associated with the
geographical zone.
The station depth is compared
with the 9 depths in the
ETOPO5.DAT file surrounding the
station.
Land position
Double entry tests.
Messages (in case of problem)
Flag (in case of
problem)
End date before cruise begin
date
Cruise reference incompatible
with the begin date
Date not included in the cruise
dates
QC_DATE = 4
Ship velocity too high
Depth out of limits geographical
zone
Doubtful depth compared with
statistics
QC_PROFONDEUR = 9
QC_PROFONDEUR = 4
QC_PROFONDEUR = 3
QC_LAT,QC_LON=4
Double entry station
For time series only:
The sensor cannot be deeper that
the ocean’s depth
The end dates must be higher
than the begin dates
The position specified does not
match a land position
Tests for double entries within the
input file considering the sensor
depth
SISMER/SCOOP/MU/110
Doubtful sensor depth
QC_PROFCAPTEUR = 3
End date before the begin date
QC_EDATE = 4
QC_ETIME = 4
QC_ELAT = 4
QC_ELON = 4
Land end position
Double entry station
V4.2 02/05/00
Page
20
IFREMER
SCOOP
user manual
These messages and flags are logged into the Database according to the following principles:
If, before the check, the flag is different from 5, it is updated in the STATION table and the message is
inserted into the ERREUR_STA table.
The previous checks performed on the headers are automatically followed with detection of the double
entry data. A file will be considered as a double entry of the processed file if:
It has been run through this check.
and
•
It is related with a cruise performed on the same ship at a period matching that of the cruise being
processed, in a different geographical zone.
or
•
It is related with a same cruise for types of data all included in the file processed.
or
•
N stations in this file match stations in the file processed at D miles and T minutes close.
The N, D and T parameters are defined in the PARAM_APPLI table in the database. During the
check, they are read respectively in the fields: DOUBLE_NB_STATIONS, DOUBLE_DIFFPOSITION,
DOUBLE_DIFFTEMPS.
In the case of time series, when detecting a double entry, the depth of the sensor is also taken into
consideration. The depth of the two time series are not equal to plus or minus DOUBLE_DIFFPROF (field in
the PARAM_APPLI table) .
SISMER/SCOOP/MU/110
V4.2 02/05/00
Page
21
IFREMER
SCOOP
7.3
user manual
QC12: Header visual check.
This function is launched automatically after QC11.
It presents the results from QC11, but also enables the user to adjust them:
• Correct cruise header.
• Correct station header.
• Reject a file, in the case of double entry checking.
• Correct the flags set during the QC11 automatic check.
These modifications are taken into account only upon completion of the work, using the "Validate"
button.
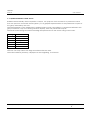
For the presentation, the color code of the data matches the value of the maximum value
flag:
Flag
1
2
3
4
5
9
Color
Green
Yellow
Orange
Red
Purple
Black
Displaying results starts with the following window, which remains constantly displayed during the entire
visual check session:
SISMER/SCOOP/MU/110
V4.2 02/05/00
Page
22
IFREMER
SCOOP
user manual
Figure 6: Header visual checking screen
The main part, on the right-hand side, is the map associated with the cruise.
From the file chosen on the monitor level, the stations display on the map background.
The geographical limits are calculated according to the position of end stations, with a 5%
margin on either side. All the cruise’s stations display on a cartographic background (Coast lines
and even bathymetry from GEBCO). The longitudes and latitudes display in the form of a grid; the
map backgrounds are presented in equidistant cylindrical projection.
When a file processed has already been run through this check, and when errors remain following
correction, related with stations; these display in an information window. The latter can remain
displayed during the entire check.
SISMER/SCOOP/MU/110
V4.2 02/05/00
Page
23
IFREMER
SCOOP
user manual
Upon first display on screen:
• The cruise on which quality check is run displays in color, the points of the stations for which
errors have been detected appear according to the color code defined above.
When several errors are detected on a single station, the display color is that of the quality flag
with the highest value.
• The points of the stations are interconnected, but the station numbers are not displayed.
• Any double cruises detected display identically as the current cruise, with the exception of their
color: Grey.
The station points are translated by n pixels downwards, in order to prevent overlapping which
would hide an exact double.
n is a value read in the PARAM_APPLI: DEC_DOUBLE_AFFICHAGE table (default, n = 2).
• The coastline displays, bathymetry is not displayed.
• A station is circled in bold on the map: It is the current station corresponding to the first station
with an error.
Other functions are accessible on this level:
• Changing the current cruise, by selecting a station from a greyed out cruise.
The description of the cruise selected displays in the "Cruise description" window, and the latter is
presented using the color code of each station’s global quality flag.
• Modifying the current viewing window using the zoom function.
To zoom in, click the Zoom+ button, then outline the new viewing window using the mouse
(second button).
This operation can be renewed.
In any case, to return to the previous situation, press Zoom- and to the initial situation with a 2nd
click on Zoom - .
• Changing certain viewing options:
- Click the bathymetry: Add or cancel the display of bathymetry from the GEBCO or
CARTOLIB files.
A window containing the bathymetry caption displays
- Click the Station numbers: Add or cancel the display of the station numbers.
- Click the Station links: Add or cancel the display of the links between stations, the stations
are related chronologically.
The top left section provides information related with the cruise.
Initially, it is the cruise subject to quality check which is described. Later, it will be the current
cruise, i.e. the one selected by the user when clicking its profile using the mouse.
You can also change the current cruise using the [...] button, located next to the cruise reference.
If the current cruise is the cruise subject to quality check, its fields can be modified; more
particularly for:
• The fields showing a color indicating a problem.
SISMER/SCOOP/MU/110
V4.2 02/05/00
Page
24
IFREMER
SCOOP
user manual
A bar chart represents the ship’s velocity during the cruise.
If required, a cursor enables browsing it fully.
During the entire QC12 session, the velocity displayed remains that of the cruise subject
to quality check, the reference of which is specified in the heading of the "Ship velocity"
window.
•
•
•
•
The window’s heading indicates the reference of the cruise subject to quality check.
The ordinates axis is graduated in knots, the abscissa represents the stations having their
numbers displayed.
A red bar chart indicates that a velocity anomaly has been detected for this station, during the
visual check.
Click one of the chart’s bars to display the station description window for the station matching
the bar chart’s abscissa selected, and the station becomes the current station: It is circled on
the map. Therefore, this functionality provides direct access to the stations for which ship
velocity anomalies have been detected during QC11.
This window is active only when the current cruise is the cruise subject to the quality
check.
SISMER/SCOOP/MU/110
V4.2 02/05/00
Page
25
IFREMER
SCOOP
user manual
Click a current cruise station to display its specifications:
The "Station Description" window then displays, the station becoming the current station, and
circled on the map.
Figure 7: Station description window
This window comprises three sections:
• A description part as such, displaying the station’s main specifications.
If the station selected belongs to the cruise subject to quality check, all the fields can be
modified, except the station’s reference field. The "Validate" button is enabled.
Conversely, if the station selected belongs to a double cruise, none of the fields can be
modified, and the "Validate" button is disabled.
SISMER/SCOOP/MU/110
V4.2 02/05/00
Page
26
IFREMER
SCOOP
•
•
user manual
A second part displaying the characteristics of the station related with the time series. This part
is accessible (field selection …) only in the case of time series data.
A third part listing any errors detected during the QC11 stage for the station considered.
The third part of the screen cannot be modified.
This window also has the following functions:
•
The "Next" and "Previous" buttons enable moving inside the stations list (ordinates by date).
The "Next" button is disabled on the last station and the "Previous" button is disabled on the
first station.
Each action performed moves to another current station and changes the contents of the station
screen.
•
The “ Validate ” button enables global validation of the modifications performed on the
various stations selected using previous buttons.
•
Manual flag modification. For each field, Date, Latitude, Longitude, and Depth, you can
force the value of the flag.
If a flag value is 5, it cannot be modified.
The value modifications (date, position, depth) must be performed during the first run in
QC12. You can modify the flags only during the last run in QC12, which does not require any
automatic check (QC11), otherwise QC11 is run again because modifications have been
made, and the flags are reset automatically.
•
The "Comments" button enables displaying the "Comments" window. This window enables
viewing or modifying the comments for the current station.
Validating the comments modification is performed upon activating the "Validate" button in
the main QC12 window.
It displays the following window:
Figure 8: Comment screen
SISMER/SCOOP/MU/110
V4.2 02/05/00
Page
27
IFREMER
SCOOP
user manual
•
•
The “ Hide station ” push button, when activated, cancels the display of the current station
in the position plan and velocity chart (velocities are recalculated). This station is not
suppressed in the database.
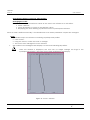
“ Mooring description” button. When several stations are located at the same geographical
point, and when the type of data matches a time series, it is possible to view the mooring in
the vertical plane as below.
Figure 9: Mooring description
The various sensors (stations in the MEDATLAS format file) are drawn: the station number
(characters 14 to 18) and the depth display along a vertical line representing the mooring.
The ocean depth is also displayed in the bottom left corner.
Each sensor displays with the color of the flag assigned by automatic checks.
The “ Quit ” button enables closing this mooring viewing window.
SISMER/SCOOP/MU/110
V4.2 02/05/00
Page
28
IFREMER
SCOOP
user manual
Clicking one of the points matching a sensor results in updating the station description window.
However, as long as the “ Mooring description” window is open, intervening in the “ Station
description ” window is not possible.
SISMER/SCOOP/MU/110
V4.2 02/05/00
Page
29
IFREMER
SCOOP
user manual
6 other buttons enable working in the session:
• Complementary information
• Add
• [...]
• Reject
• Cancel
• Validate
1.
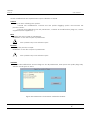
Complementary information about the cruise or mooring:
Figure 10: Complementary information window
Provides complementary information about the cruise described in the "Cruise Description"
window.
For the cruise subject to quality check, only the "Project", "Archiving Centre" and “ Comments ”
fields can be modified.
The [...] button provides the list of archiving centers.
SISMER/SCOOP/MU/110
V4.2 02/05/00
Page
30
IFREMER
SCOOP
user manual
The changes are taken into account when the user clicks "Validate".
You can view and modify the file header comment within the editor located at the bottom of
the window.
All the modifications are recorded into the base only upon exiting QC12 using the "Validate"
button in the QC12 main screen.
2.
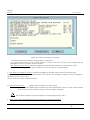
Adding
To add a cruise in the main screen.
• Click "Add".
• An entry window displays.
Figure 11: “ Add cruise ” window
•
Enter the name of a file present in the Database.
All the files present in the Database, processing the same type of data and absent
from the screen, can be listed clicking the [...] button in this window: The list then
displays the file name, the reference and cruise name associated with this file.
• Click the file chosen with the mouse or enter its name using the keyboard.
Using the * character enables choosing all the files with names containing a generic
term, e.g. Fil* selects File1
File2
Validate the file name entered or chosen in the list by pressing “ Return ”
• The cruise added displays as a double cruise, and does not become the current cruise.
• The map scale is recalculated.
SISMER/SCOOP/MU/110
V4.2 02/05/00
Page
31
IFREMER
SCOOP
3.
user manual
[...]
This button then enables viewing the list of cruises which are displayed graphically and changing
the current cruise.
Note: If only one cruise is displayed, this button is disabled.
• Click [...].
The following window displays:
Figure 12: “ List of cruises displayed ” window
•
•
•
•
The star “ * ” marks the cruise subject to quality check.
Choose a cruise and click it using the mouse.
Validate it by clicking "Validate".
The characteristics of the cruise chosen then display in the "Cruise Description" window, and the
cruise becomes the current cruise.
SISMER/SCOOP/MU/110
V4.2 02/05/00
Page
32
IFREMER
SCOOP
4.
user manual
Reject
When a double entry is detected for the file subject to quality check:
Enables suppressing either the double entry cruise, or the cruise subject to the QC.
Note: If only one cruise is displayed, this button is disabled.
•
•
Click "Reject".
The following window displays:
Figure 13: Reject window
•
If only two cruises are displayed on the map background, the valid cruise is the one
not rejected, and the "Valid Cruise" field cannot be modified.
• If more than two cruises are displayed, and if the cruise to be suppressed is the cruise
subject to quality check, the reference of the valid cruise must be entered:
Click [...].
The list of references for the cruises displayed (except the one to be suppressed) displays.
Choose a reference using the mouse.
• If the cruise to be suppressed is not the cruise subject to the quality check, the valid
cruise at the origin of the rejection can only be the cruise subject to quality check, and
the [...] button is disabled.
• Validate by clicking "OK".
• Confirmation is requested from the user:
"Cancel" enables ignoring a rejection, and returning to the main window without
modification.
• In case of confirmation, the rejected cruise is removed from the map background.
5.
"Cancel"
To close visual checking without validation.
None of the modifications are taken into account, and the state of progress remains at
11.
SISMER/SCOOP/MU/110
V4.2 02/05/00
Page
33
IFREMER
SCOOP
user manual
The following screen is the chaining monitor with only the "File selection", "Format" and
"Header" buttons accessible.
SISMER/SCOOP/MU/110
V4.2 02/05/00
Page
34
IFREMER
SCOOP
6.
user manual
"Validate"
To end visual check while validating.
Unless if the file subject to the quality check has been rejected, you must fill in the SISMER
project(s) associated with the quality check using the following window:
Figure 14: Cruise validation window
You must associate the file with one or several SISMER projects among those proposed in
the window.
Note : the error resulting from the modification of a station’s depth is not critical at the time of the
validation of QC12.
SISMER/SCOOP/MU/110
V4.2 02/05/00
Page
35
IFREMER
SCOOP
user manual
7.4 CP: Loading parameters
This module is enabled by clicking the monitor’s "Data" button.
It enables selecting the group of data to be qualified. Therefore, it prepares the following steps:
QC21 & QC22.
Upon launching, the following screen displays:
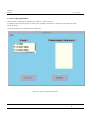
Figure 15: Group selection window
SISMER/SCOOP/MU/110
V4.2 02/05/00
Page
36
IFREMER
SCOOP
•
•
user manual
Choose, in the list of all groups available, the group to be associated with the file to be checked.
When the group has been chosen, the list of possible climatologies displays in the right-hand list, with
one of the climatologies highlighted. This climatology is considered as being the default value. To
change this choice, click another climatology.
The "Validate" button is accessible only when one of the groups has been explicitly chosen:
Figure 16: “ Parameter loading ” window
•
When a group and a climatology have been selected, click the "Validate" button to start loading.
SISMER/SCOOP/MU/110
V4.2 02/05/00
Page
37
IFREMER
SCOOP
•
user manual
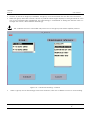
You are prompted to confirm the choice for group and climatology:
Figure 17 : “ Climatology confirmation ” window
If QC21 has been run, you are prompted to confirm whether you wish to run it again:
Figure 18 : “ Running QC21 or not ”
•
Click "Cancel" in the main screen to return to the chaining monitor.
SISMER/SCOOP/MU/110
V4.2 02/05/00
Page
38
IFREMER
SCOOP
user manual
7.5 QC21: Automatic parameter check
Launched immediately after the parameter loading, this function does not have a user interface, and
runs totally seamlessly.
It enables performing the following checks:
•
Acceptable data:
Checks the presence of the PRES reference parameter for vertical profiles and the date for the
time series, and at least one other parameter.
•
Regional data impossible:
Coherence check on the parameter’s value, in respect of the parameter’s minimum and
maximum values for the region considered.
The minimum and maximum values for a parameter can be checked according to the
measurement depth for a given region. A point belongs to a single region. For a time series, in
the absence of PRES, the SENSOR_DEPTH field is used to determine the minimum and maximum
values to be selected.
If an error occurs, the message contains the region’s code.
The regions are not always separate. A station can be located at an intersection between
regions: one region contains only the North and West borders. In this case, the station located
on a border belongs to the region with the highest level of hierarchy (HIERARCHIE field in the
table) if the station is located on a North or West border of the region.
•
Reference parameter (pressure, time) increasing:
Compliance of the profile with marine physical logic (e.g. Pressure increases with depth).
•
Comparison with statistics / Pressure check.
Comparison of pressure with:
- the PROFONDEUR parameter, when the depth is filled in the station header.
- otherwise, statistical references (ETOPO5).
•
Comparison with statistics / Temperature and other parameters check:
The statistics used in the comparison are stored in several files:
In the case of a time series, there are no statistics. Checking is performed in respect of the
medium and standard deviation calculated on the data. Only bearing is excluded (HCDT
parameter) from this calculation.
The FACTMUL_1, FACTMUL_2, FACTMUL_3 fields of the climatology table are multiplied by the
standard deviation of the PARAM_APPLI table, according to the relationship of depth with one
of the three zones defined by LIMITE_ZONE1, LIMITE_ZONE2 and LIMITE_ZONE3 from the
PARAM_APPLI table (matching respectively 1) the continental plateau, 2) the threshold zones
and slope, 3) deep sea).
•
Constant profile:
A constant parameter corresponds to a parameter blocked or failed.
•
Peak test:
Check performed on the entire profile, in order to detect isolated value peaks.
SISMER/SCOOP/MU/110
V4.2 02/05/00
Page
39
IFREMER
SCOOP
user manual
Gradient test at profile beginning and end.
•
Density inversion:
Density anomaly calculation between the previous level and the current level.
Comparison of the difference in density with the threshold chosen on the level of the
“ Monitor ” window.
This threshold corresponds to a maximum accepted instability.
•
Pressure check:
This check is specific to the time series. Pressure coherence is checked with the sensor’s depth,
and the distance separating the sensor from the floor.
•
Current meter check:
This check consists, when using a current meter, in testing for the presence of at least one of
the HCSP/HCDT or NSCT/EWCT couples. If none of these couples is present, the series global flag
is set to 3.
If the direction of the current or the heading is flagged at 3 or 4, the corresponding East and
North components are flagged identically.
At the output of QC21, the contents of the ERREUR_CAM, ERREUR_STAT and ERREUR_VAL tables are
copied into an ASCII file, named after the file being validated, plus the extension ".er2".
SISMER/SCOOP/MU/110
V4.2 02/05/00
Page
40
IFREMER
SCOOP
user manual
7.6 QC22: Parameters visual check
Enabled automatically after completion of QC21, the purpose of this module is to present the result
from the previous automatic checks (QC21). It is a graphic representation of the parameter couples of
the group selected by the user.
The representation of the parameters is performed by couple, according to a sequence defined in the
group. Therefore, only one viewing window displays, with one parameter couple.
The errors found during automatic checking are represented on the screen using color codes:
Flag
1
2
3
4
5
9
Color
Green
Yellow
Orange
Red
Purple
Black
The user can only correct the flags associated with the data.
The main interface (window), displayed at the beginning, is as follows:
SISMER/SCOOP/MU/110
V4.2 02/05/00
Page
41
IFREMER
SCOOP
7.6.1
user manual
Description of the functions
Figure 19: “ Parameters visual check ” window
It is divided into four parts:
•
Top left window: Offset view of all profiles
The title of the window indicates: Cruise number & name.
The horizontal cursor located under the window enables viewing all profiles.
These display according to the chronological sequence.
Between each profile, a pixel offset is applied. Its default value is 30, but it can be adjusted using
the slider in the top middle section of the screen:
• Choose the offset step.
SISMER/SCOOP/MU/110
V4.2 02/05/00
Page
42
IFREMER
SCOOP
user manual
•
Validate using "OK".
In the beginning, the current profile is the first profile containing an error. The color code used to
show the anomalies (flags) detected by the QC21 automatic check is that listed in the table
above.
In the couple, the color used is the color of the highest level flag among the two parameters..
Click on the profile to make it the current profile, and display it in bold. It also becomes the current
profile for the superimposed mode display window.
•
Right-hand window: Superimposed view of all profiles & Climatology selected on the chaining
monitor level.
The chart’s title is the number of the current station.
The scale is calculated from the profiles displayed with a 5% margin on either side.
By default, all profiles display:
The reference profiles display in blue (average in continuous line, standard deviation in dotted line).
If it does not display, this means climatology is not available around the measurement point.
The climatology selected also displays in the case of a parameter according to PRES.
The profiles displayed on the background are greyed.
To show the anomalies detected during QC21, the color code listed in the table above is applied
to the current profile.
For the chemical parameters connected using a reference line, the reference line for the profile’s
geographical region is displayed.
To choose another reference climatology:
• In the "Climatology" section in the center of the screen,
Click [...], next to the climatology window.
• A list of the climatologies available for the validated group of parameters displays.
This choice does not result in a modification of the flags associated to the data, but merely
has an information value for the user.
Click a profile in order to make it the current profile. It also becomes the current profile for the
offset profiles window.
For the current profile, the station number, date, position and depth are displayed on the lower left
part of the screen.
•
Under the offset profiles window:
•
•
The [...] button enables a station description.
Click [...].
The following window displays, presenting the entire station header and data.
SISMER/SCOOP/MU/110
V4.2 02/05/00
Page
43
IFREMER
SCOOP
user manual
Figure 20: "Station Description" window.
A horizontal scroll bar enables viewing all the information.
You can suppress points in the current profile. In order to do this, the lines to be suppressed are
highlighted, and the "Delete" button clicked.
The "Default value" button enables assigning the parameters selected to their default value.
The "Quit" button enables using this window to view the station’s specifications.
• The "Keep" and "Reject" buttons enable managing the double entries detected during QC21.
"Reject" changes the color of the profile to blue (the value of the number of stations is then changed in
the base and the output file).
"Keep" shifts the station number to black.
•
Bottom left window :
Displays error messages found by QC21.
Read-only window displaying constantly any errors detected by QC21 for the current profile,
and under the form: Station number, Pressure & Error message.
This window displays only the messages corresponding to flags 3 & 4.
•
The buttons: Part grouping the buttons common to the entire window.
SISMER/SCOOP/MU/110
V4.2 02/05/00
Page
44
IFREMER
SCOOP
user manual
Changing the distance between offset profiles
Changing the scale:
Enter the minimum and maximum values of the axes in the 4 fields set to this effect.
• Click “ Manual ”
• Click "Automatic" to return to the default values.
• Displaying the new drawing is performed in the superimposed window.
When a scale is defined manually, it is maintained as such when parameter couples are changed.
Zoom:
Applicable only in the window containing superimposed profiles.
• Click "Zoom".
• Using the mouse, outline the zone to enlarge.
• The zone is then enlarged in a new window.
•
the outline for the enlarged area displays on the chart including all profiles.
Once this window is displayed, the user can no longer change the flags in the
superimposed window. (See later for the flag modification technique).
Figure 21: "Zoom" window
SISMER/SCOOP/MU/110
V4.2 02/05/00
Page
45
IFREMER
SCOOP
user manual
The "Next" et "Previous" buttons enable changing the current profile.
SISMER/SCOOP/MU/110
V4.2 02/05/00
Page
46
IFREMER
SCOOP
user manual
All profiles
Displays or removes the non-current profiles in the superimposed window.
In the case of a time series, the profile filtered is superimposed on the data. The current profile’s
average and standard deviation are also displayed.
Climatology selection
The “ ... ” button enables choosing a climatology different from the default climatology.
Flag selection
Select the flag, then click the part of the work profile to flag.
Print
This menu comprises three selections:
"Print superimposed"
To print the contents of the superimposed viewing window (One or all profiles according to
the choices made using the "All profiles" button).
"Print offset"
To print the contents of the offset profiles viewing window.
"Print zoom"
To print the contents of the zoom window if it is present on screen.
The cruise name is added in the printed charts.
Choosing one of these sub-menus results in displaying the following window:
Figure 22: “ Printer list” window
SISMER/SCOOP/MU/110
V4.2 02/05/00
Page
47
IFREMER
SCOOP
user manual
This window enables the user to choose the type of print-out required:
•
•
Print in a POSTSCRIPT file, by checking the "Print in a file" box, and entering the file name in
the "Validate" text field
Normal printing, selecting one of the printers in the list above.
The "Cancel" button closes this window without any action, whereas the "Validate" button starts
the print-out required.
Options
This button displays a menu containing the following choices:
"Plots points of measurements"
This option enables displaying the measurement points on the current profile in the
superimposed profiles window or the zoom window.
You can, by clicking on a measurement point, see the value in x, y for this point.
These values display in a small window, which disappears when releasing the mouse button.
The button’s label is replaced with "Delete points of measurement".
In the case of a time series, the display format for a measurement point is ETDD
(year, month, day, time).
"Delete station"
This option removes the current profile. This profile is suppressed in the output file.
A confirmation prompt displays.
The profile’s color changes (light green).
"Default value"
All the points in the current profile are set to the default value.
In order to enable this function, the Y parameter must be PRES and the X parameter a
measured parameter.
A confirmation prompt displays.
"Update station comments"
This option displays a "Comments" window, enabling the user to view or change the current
profile comments.
"Display a subset of profiles"
This option displays a "Profiles selection" enabling the selection of profiles to display.
"Display the profiles of another file"
This option enables displaying the profiles of a file selected using the "Files selection" window.
This window filters the files containing the same type of data as the current file. File selection
is proposed, and validating these choices results in displaying the profiles of the file selected
in white.
"Erase the profiles of other files"
This option enables suppressing any profiles from another file than the current file. All the
profiles in the window displayed in white disappear.
SISMER/SCOOP/MU/110
V4.2 02/05/00
Page
48
IFREMER
SCOOP
user manual
All the modifications are implemented upon validation of QC22.
Cancel
Displays a menu offering two options:
- "Cancel last modification" Cancels the last profile flagging option and restores the
previous values.
- "Cancel all modifications for this parameter", Cancels all modifications (flags set, station
suppressed, line suppressed, ...).
Next
Displays the next couple of parameters.
Disabled if on the last couple of parameters.
Also updates any zoom window open.
Previous
Displays the previous couple.
Disabled if on the first couple of parameters.
Also updates any zoom window open.
Validate
Records all modifications and the flags set for all parameters, and opens the quality flag entry
window for all types of data.
Figure 23: Parameters visual check validation window
SISMER/SCOOP/MU/110
V4.2 02/05/00
Page
49
IFREMER
SCOOP
user manual
This window displays the list of data types for the file, and enables selecting the data types
validated. A vertical scroll bar enables listing them all.
The user has no obligation to modify the flags present.
•
Validate using "OK".
Quit
Quits the parameters visual check, without validating any modifications.
Confirmation is required.
7.6.2
Operating mode
Modifying flags
To modify the flag level for a zone, proceed as follows:
• Choose the flag level among the 4 buttons located in the middle and bottom sections of the
window.
•
Using the mouse, outline the zone to flag in the superimposed viewing part or in the zoom
window. (See above for zoom technique).
To cancel the flag level selected, click in a zone other than the superimposed viewing window.
In the superimposed viewing window or in the zoom window, you can only modify the
current profile’s flags; provided the parameter to be modified is viewed in respect of the
reference parameter, which is PRES, and that it is a measured parameter. The flag defined
will concern the parameter other than the reference parameter, unless the "Flag PRES"
button is enabled.
•
To flag the "PRES" parameter, use the "Flag PRES" button.
Then, proceed as above.
Once the zone is flagged, flagging PRES is disabled, and it must be explicitly pressed to flag
pressure again.
•
All the points included in this window then receive the flag level selected, and are replotted
using the color matching the flag.
•
In the case of a time series, the "PRES" button is greyed.
•
The profile’s global flag is calculated as being the smallest global flags of the parameters, with
the exclusion of the reference parameter (pressure for vertical profiles and time for time series).
SISMER/SCOOP/MU/110
V4.2 02/05/00
Page
50
IFREMER
SCOOP
user manual
8
FILE MANAGEMENT RELATED FUNCTIONS.
8.1
Generating summaries.
Activate this function by clicking the "Create Summary" button.
Its purpose is to generate cruise summaries and data summaries for cruises to be archived in SISMER’s
SERVEUR application.
After clicking "Create Summary", the following window displays:
Figure 24: “ Summary generation ” window
Entering certain information is required in order to insert the data in SISMER’s SERVEUR base. To fill in the
various fields, proceed as follows:
SISMER/SCOOP/MU/110
V4.2 02/05/00
Page
51
IFREMER
SCOOP
user manual
•
•
Move to the field, using the mouse or the "Tab" key.
Fill in the fields using the keyboard.
File name:
- The default file name proposed is that of the file subject to quality check.
- If it is inappropriate, click [...] to access the list of files available.
If the file selected has not fully succeeded the quality check chain, a pop-up message notifies you.
•
At the output, 2 cases are possible:
- There is a "cruise summary" file and a "data summary" file. All stations are in the same file: This
usually occurs for bottle data (H09).
- There is a "cruise summary" file and as many "data summary" files as there are stations in the cruise:
This often occurs with CTD data (H10).
This selection is performed using the buttons in the section "Summary type".
Cruise number:
Compulsory numeric field, fixed length 8.
Number assigned to the cruise within the SERVER.
Base code:
Compulsory upper case character field, length 6.
Encoding internal to the SERVER application, matching the data.
Sensor type:
Non-compulsory field, length 20.
Code of the data responsible :
Upper case characters field, length 7.
Encoding internal to the SERVER application.
Archive address:
Field comprising maximum 36 characters.
Address on magnetic disk accessible via NFS, where the data files will be stored.
The various codes entered are not checked in respect of the values existing in the SERVER.
•
Once all fields have been filled in, click "Validate".
SISMER/SCOOP/MU/110
V4.2 02/05/00
Page
52
IFREMER
SCOOP
user manual
8.2 Adding parameters.
This function is enabled clicking the "Add parameters" button.
Its purpose is to add one or several parameters in a file in the MEDATLAS format.
After clicking "Add parameters", the following window displays:
Figure 25: “ Add parameters ” window
•
•
•
•
Fill in the File name field:
- The default file name proposed is that of the file subject to quality check.
- If inappropriate, click [...] to access the list of files available.
Using the mouse, select the parameter(s) to be added.
Click "Cancel" to quit without modifying.
Click "Validate" to actually add the parameters in the file selected.
The list of all files present in the output file displays, and a sequence is proposed for these parameters.
This sequence can be changed by the user.
If the user attempts to add a parameter which already exists in all stations in the file, an error message
displays.
SISMER/SCOOP/MU/110
V4.2 02/05/00
Page
53
IFREMER
SCOOP
user manual
Example : File for 3 stations containing respectively the following parameters:
station 1: PRES TEMP PSAL DOX1
station 2: PRES PHOS NTRA NTRI SLCA
station 3: PRES TEMP PSAL PHOS NTRA NTRI SLCA
when adding DOX1 to all the stations in the file.
The list displayed is: PRES TEMP PSAL PHOS NTRA NTRI SLCA DOX1
1
2
3
4
5
6
7
8
If the sequence proposed is not changed the output is
station 1: PRES TEMP PSAL DOX1
station 2: PRES PHOS NTRA NTRI SLCA DOX1
station 3: PRES TEMP PSAL PHOS NTRA NTRI SLCA DOX1
If the sequence proposed is changed: PRES TEMP PSAL PHOS NTRA NTRI SLCA DOX1
1
2
3
5
6
7
8
4
the output obtained is
station 1: PRES TEMP PSAL DOX1
station 2: PRES DOX1 PHOS NTRA NTRI SLCA
station 3: PRES TEMP PSAL DOX1 PHOS NTRA NTRI SLCA
SISMER/SCOOP/MU/110
V4.2 02/05/00
Page
54
IFREMER
SCOOP
user manual
8.3 Suppressing parameters.
This function is enabled by clicking the "Suppress parameters" button.
Its purpose is to suppress one or several parameters in a file in the MEDATLAS format.
After clicking "Suppress parameters", the following window displays:
Figure 26: “ Suppress parameters” window.
•
•
•
•
•
•
•
Fill in the Filename field:
- The default file name proposed is that of the file subject to quality check.
- If inappropriate, click [...] to access the list of files available.
Click "Display the parameters".
The parameters present in the file display.
Using the mouse, select the parameter(s) to be suppressed.
Click "Cancel" to quit without modification, or "Validate".
In the latter case, confirmation is required.
In case of confirmation, the parameters are suppressed.
SISMER/SCOOP/MU/110
V4.2 02/05/00
Page
55
IFREMER
SCOOP
user manual
8.4 Merging files.
This function is enabled by clicking the "Merge files" button.
Its purpose is merging two MEDATLAS files together.
After clicking "Merge files", the following window opens:
Figure 27: "Merge files" window.
•
•
Click [...] for each of the files to be merged.
A file selection window displays.
SISMER/SCOOP/MU/110
V4.2 02/05/00
Page
56
IFREMER
SCOOP
user manual
Figure 28: Selection window for files to be merged.
•
•
•
Then enter, in the Output file name field, the name for the output file. It will be generated in the
application’s current directory.
Click "Cancel" to quit without generating any merge,
Click "Validate" to merge both files.
SISMER/SCOOP/MU/110
V4.2 02/05/00
Page
57
IFREMER
SCOOP
user manual
8.5 File concatenation.
This function is enabled by clicking the "Concatenate files" button.
Its purpose is to concatenate a file comprising the cruise header with one or several files containing the
stations. It takes into account only the MEDATLAS format.
After clicking "Concatenate files", the following window displays:
Figure 29: "Concatenate files" window.
•
•
Click [...].
A file selection window displays.
SISMER/SCOOP/MU/110
V4.2 02/05/00
Page
58
IFREMER
SCOOP
user manual
Figure 30: File selection window for concatenation.
•
Choose the file containing the cruise header.
Select the directory, then the file.
To access all the directory and files, use the vertical scroll bars.
These are fully visible using the horizontal scroll bars.
To launch concatenation, the module takes the selected file to read the cruise header, and all the
other files in the same directory in the alphabetical order to read the stations. Concatenation is
performed only with the files containing the same list of parameters.
•
•
•
•
•
Then enter the name of the output file in the Final file name field. It will be generated in the directory
containing the input files.
The "In a distinct file" or "With each station" buttons enable defining whether the cruise header is in
each file (Option "With each station") or in the first file.
Click "Cancel" to quit without running concatenation, or "Validate".
In the latter case, generation is launched.
If all the files in the directory have not been concatenated, the user is notified.
SISMER/SCOOP/MU/110
V4.2 02/05/00
Page
59
IFREMER
SCOOP
user manual
8.6 Splitting files.
Start this function by clicking the "Split files" button.
Its purpose is to split a global file into several files. It is only applicable to the MEDATLAS format.
When clicking "Split files", the following window displays.
Figure 31: “ Split files” window
•
Fill in the File name field:
- The default file name proposed is that of the file subject to quality check.
- If inappropriate, click [...] to access the list of files available.
•
At the output, 2 cases are possible:
- A file with the cruise header and one file per station.
- One file per station with the cruise header at the beginning of each station file.
This choice is made using the buttons in the "Cruise header" section.
•
•
•
•
Enter the output files root in the appropriate field.
The cruise file name will be the root, with the extension ".ent" and the name of the station files will be
the root with the station number.
Click "Cancel" to quit without generating, or "Validate".
In the latter case, generation is launched.
SISMER/SCOOP/MU/110
V4.2 02/05/00
Page
60
IFREMER
SCOOP
user manual
8.7 Statistics
To use this function, click the "Statistics" button in the monitor.
When clicking "Statistics", the following window displays.
Figure 32: “Print statistics” window
Choose the name of the file on which statistics are generated, in the text entry zone or using the file
selector.
The file must have succeeded in all checks (progress status 22). Otherwise, the user is notified that
statistics for this file cannot be generated.
The file name at output is the name of the file containing the result tables.
SISMER/SCOOP/MU/110
V4.2 02/05/00
Page
61
IFREMER
SCOOP
user manual
8.8 Loading files
Figure 33: File loading screen
This function enables loading a set of files checked in the MEDATLAS format, data format checked and
files already loaded.
Two exclusive buttons enable selecting whether a single MEDATLAS file or all the files in a directory must
be inserted, which must be the first action taken by the user.
The file or directory selector enables selecting the directory or file to be loaded.
The entry zone enables entering the name of the MEDATLAS file or directory.
The list of projects enables selecting one or several projects associated with the files processed.
The "Validate" button enables launching the MEDATLAS file loading executable.
The "Cancel" button enables returning to the monitor.
The critical errors detected are recorded in a file named after the directory, and with the extension ".log"
A file with the name of the directory and the extension ".trc" enables tracking the validation’s progress.
When starting the validation of a file, the file name is recorded, and when validation is complete, the
user is notified about whether the file is recorded in the base or not.
SISMER/SCOOP/MU/110
V4.2 02/05/00
Page
62
IFREMER
SCOOP
user manual
END OF DOCUMENT
SISMER/SCOOP/MU/110
V4.2 02/05/00
Page
63