1
BCA.Net - Highway Project Benefit-Cost Analysis System
User's Manual
Federal Highway Administration
April 2011
Contents
Introduction
1
Purpose of the User’s Manual ................................................................................................................1
About BCA.Net..........................................................................................................................................1
Technical Description
3
A Web-Based Application ......................................................................................................................3
Using BCA.Net – Frequently Asked Questions ...................................................................4
Software and Hardware Requirements..................................................................................................4
Co mputer, Operating System, and Web Browser ...............................................................4
Internet Connection ..................................................................................................................5
Web Browser Sett ings..............................................................................................................5
File Formats ...............................................................................................................................6
Overview of this Manual .........................................................................................................................6
Using BCA.Net
7
Introduction................................................................................................................................................7
Managing Data in BCA.Net .....................................................................................................................7
User .............................................................................................................................................8
Dataset ........................................................................................................................................9
Project .........................................................................................................................................9
Scenario ......................................................................................................................................9
Segment St rategies ...................................................................................................................9
Intersection/Interchange Strategies......................................................................................10
Parameters ................................................................................................................................10
Results.......................................................................................................................................10
The BCA.Net Analysis Process.............................................................................................................10
BCA.Net Page-by-Page
13
Introduction..............................................................................................................................................13
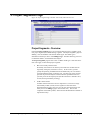
1. Log in Page ...........................................................................................................................................15
Login - Overview....................................................................................................................15
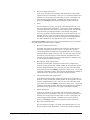
1.a Registration Page ..............................................................................................................................16
Registration - Overview.........................................................................................................16
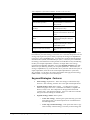
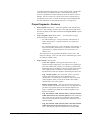
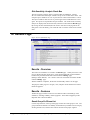
2. Manage Page .......................................................................................................................................17
Manage - Overview ................................................................................................................17
Manage - Features...................................................................................................................17
2.a to 2.d New Data Object (Dataset, Project, Scenario, Results set) Page ..................................21
New Data Object - Overv iew................................................................................................21
2.e Generate Multip le Reports Page ....................................................................................................22
Generate Multiple Reports - Overview ...............................................................................22
3. Seg ment Strategies Page ...................................................................................................................23
Segment St rategies - Overv iew ............................................................................................23
Segment St rategies - Features...............................................................................................28
3.a New Seg ment Strategy Page .........................................................................................................29
BCA.Net - Highway Project Benefit-Cost Analys is System User's Manual
Contents i
New Seg ment Strategy - Overview .....................................................................................29
4. Intersections/Interchanges (ISIC) Strategy Page ..........................................................................30
ISIC Strategies - Overview ...................................................................................................30
ISIC Strategies - Features ......................................................................................................31
4.a New Intersection/Interchanges (ISIC) Strategy Page.................................................................32
New ISIC St rategy - Overv iew.............................................................................................32
5. Pro ject Seg ments Page ......................................................................................................................33
Project Seg ments - Overview ...............................................................................................33
Project Seg ments - Features ..................................................................................................35
6. Pro ject Intersections/Interchanges (ISIC) Page............................................................................39
Project ISIC - Overview ........................................................................................................40
Project ISICs - Features .........................................................................................................41
6.a New Project Intersection/Interchanges (ISIC) Page ...................................................................43
New Pro ject ISIC - Overview...............................................................................................43
7. Parameters Page ..................................................................................................................................43
Parameters - Overview...........................................................................................................43
8. Scenario Page ......................................................................................................................................46
Scenario - Overv iew ...............................................................................................................46
Scenario - Features .................................................................................................................47
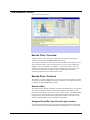
8.a Scenario Input Variab le Chart ........................................................................................................50
Scenario Chart - Overv iew ....................................................................................................51
9. Simulat ion Page ..................................................................................................................................52
Simu lation - Overv iew ...........................................................................................................52
Simu lation - Features .............................................................................................................52
10. Results Page ......................................................................................................................................54
Results - Overview .................................................................................................................54
Results - Features....................................................................................................................54
10.a Results Chart ...................................................................................................................................58
Results Chart - Overview ......................................................................................................58
Results Chart - Features.........................................................................................................58
ii Contents
Glossary of Terms
61
Index
71
BCA.Net - Highway Project Benefit-Cost Analysis System User's Manual
Introduction
Purpose of the User’s Manual
BCA.Net is the Federal Highway Administration’s (FHWA) web-based system for
highway benefit-cost analysis in support of the project-level decision-making
process. This manual provides direction on how to use the BCA.Net system to set up
and conduct a benefit-cost analysis, and incorporate the system’s outputs in projectlevel decision support.
This User’s Manual is directed to candidate users of the system, which includes:
U.S. and State Department of Transportation employees; local government
employees; economists, engineers, budget analysts and other consultants who
support State and local authorities; and, anyone else involved in supporting decisions
for highway development and maintenance.
Following this introduction, the manual contains instructions on getting started with
BCA.Net, a description of the system, and directions on using it to perform benefit cost analyses.
About BCA.Net
The growing requirements for highway investments and constrained fiscal resources
point to the need for a tool to facilitate the benefit-cost analysis of highway
investments. Surveys of available tools show the need for an easy -to-use tool that
incorporates recent research findings, thereby enhancing the accessibility of highway
project benefit-cost analysis to the practitioner. The challenges of deploying
software in diverse information technology environments with increasing security
requirements strongly suggest that a new benefit-cost analysis tool be an Internetbased application.
To meet this need, the FHWA developed BCA.Net, which is a web-based decision
support tool that assists Federal, State and local authority decision -makers in
evaluating the benefits and costs of highway projects. The BCA.Net system enables
users to: manage the data for an analysis; select from a wide array of sample values;
develop cases corresponding to alternative strategies for managing highway
facilities; evaluate and compare the benefits and costs of improvements; and, provide
summary indicators for informing resource allocation decisions.
A BCA.Net analysis evaluates the relative economic merits of pursuing alternative
multi-year improvement and maintenance programs for highway projects. Based on
the users-provided project information, BCA.Net forecasts the transportation and
non-transportation effects of highway investments and maintenance strategies, and
BCA.Net - Highway Project Benefit-Cost Analys is System User's Manual
Introduction 1
estimates the economic value of these effects over the useful life of projects in dollar
terms. The benefit-cost of an investment is calculated by comparing the time-stream
of expected economic benefits with the time-stream of investment-related and other
costs, while adjusting for the timing of the realization of costs and benefits. Known
as “discounting”, this adjustment enables decision makers to inspect future benefits
and costs in terms of their present-day value. This is a standard way of giving
appropriate weight to nearer-term versus distant (thus less valued) outcomes. By
comparing the present values of net benefit (e.g., benefits less costs), the analyst can
determine which alternative has greater economic worth.
The computational approach in BCA.Net allows the users to develop unitary, point
estimates (e.g., single values) for the result metrics. Alternatively, the users can use
the risk analysis features of BCA.Net to develop probabilistic inputs and results. The
probabilistic method is a way of explicitly handling the uncertainty associated with
some of the analysis inputs (e.g., forecast growth) and its impact on the analysis
results. Probability functions describe the probabilistic inputs, which convey the
range of likely inputs and the likelihood of their occurrence. Risk analysis allows for
the simultaneous computation of differing assumptions for many different variables.
The results of a risk analysis are presented as probability distributions , rather than
point estimates. These risk analysis outcomes promote informed decision -making
that accounts for both the downside risk and upside potential of candidate projects.
BCA.Net includes an array of charts and reports that enable the users to interpret
results, refine analyses, and develop risk-mitigating contingencies.
BCA.Net’s underlying methodology is consistent with the current benefit -cost
methodologies employed by the FHWA. The model is transparent in all of its
assumptions and the model inputs are readily accessible to users who may want to
adjust model inputs to reflect local circumstances. BCA.Net is designed to minimize
the data needs and technical expertise required of the users while at the same time
providing analytical flexibility and reliable benefit-cost results.
2 Introduction
BCA.Net - Highway Project Benefit-Cost Analysis System User's Manual
Technical Description
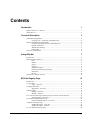
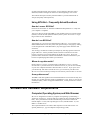
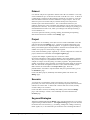
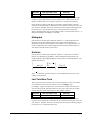
A Web-Based Application
BCA.Net runs over the Internet on a central server. This enables many users to
access the system simultaneously. Any user with a minimally configured computer
having a browser and an Internet connection can use the system and all its features.
The system requires no local installation of special software. Web deployment
addresses the following issues:
Figure 1 Overview Schema of BCA.Net
System Security – State and local agencies are moving increasingly to
secure systems and, in many cases , a requirement to install dedicated
software is a barrier to adoption. BCA.Net does not require any special
software and presents no security risk for system users.
Interoperability - BCA.Net does not does require special hardware or
even a special operating system (it will work on client computers
running Windows, Linux, Unix or Mac operating systems).
Deployment of Upgrades and Modifications -Modifications and
improvements to the software are immediately deployed for all users.
Updates of Data Resources - Most recent data are always available to
the application.
Users analyses and data are run on a central database, thus minimizing the need for
users to track and maintain their data on their local computer. Users have the option
BCA.Net - Highway Project Benefit-Cost Analys is System User's Manual
Technical Description 3
of storing their data locally at the end of a session, deleting it from the central
database, and then restoring their data for use when beginning a new session.
The technical description of the system that follows is presented in the form of
“FAQs” (frequently asked questions).
Using BCA.Net – Frequently Asked Questions
How do I access BCA.Net?
Check the section below on “Software and Hardware Requirements” to verify that
your computer is compliant.
You access BCA.Net from either FHWA’s User Profile and Access Control System
(UPACS) or from the URL (Internet address) of the system. See section “1. Login
Page” below for more information.
How do I use BCA.Net?
After logging on, you can access all the features of BCA.Net. You navigate to the
different functional areas of the system, each represented by a web page, by clicking
on the Navigation Bar of the Main Menu (top of the page, below the banner and
status bar).
You develop your data and conduct your analysis by selecting options on the web
pages of BCA.Net. When you make entries and click on selections in the web
browser, a request is sent over the Internet to the BCA.Net server. The server
performs all the calculations and data transformations and then sends back to your
browser an updated page that reflects your selections.
Where do my data reside?
During a BCA.Net session, your data resides on the BCA.Net server. You may
choose to leave your data on the server between sessions, or, you can store it locally
on your own computer and delete it from the BCA.Net server. If you opt to store
your data locally and remove it from the server, you can restore your data to the
BCA.Net server and continue your analysis at the start of your next BCA.Net session.
Are my data secure?
The FHWA will take significant and reasonable measures to ensure the security and
integrity of your data when they reside on the FHWA’s server. BCA.Net uses secure
socket layer (SSL), 128-bit encrypted communication, so that your data are secure in
transmission.
Software and Hardware Requirements
Computer, Operating System, and Web Browser
BCA.Net is designed for use with any computer and operating system running a
“high level” browser (i.e., browsers that were released in the second half of 1999 or
later). The system has been tested on the following web browsers: Microsoft
Internet Explorer 5 and 6, Netscape Navigator 6 and 7, Mozilla Firefox 1.0, and
Safari 1.3 for Mac OS X.
The required hardware is the same as that required to run the web browser on a
specific platform (i.e., type of computer and operating system).
4 Technical Description
BCA.Net - Highway Project Benefit-Cost Analysis System User's Manual
If for instance, you were running Internet Explorer 6.0 on an Intel-based computer
and the Windows XP operating system, then your minimum hardware requirements
would be as follows:
A Pentium III 450 MHz processor, with 128 MB RAMS.
The application can be activated with a pointing device (i.e., mouse) or via the
keyboard. It complies with all the accessibility requirements of Section 508 of the
Workforce Rehabilitation Act of 1973.
Internet Connection
BCA.Net requires an Internet connection. With a dial-up connection, the speed
should equal or exceed 56kbps (kilobits per second). The system will operate with
lower speed connections, but the response times will be slower.
A faster, broadband connection (either through your local area network or from a
cable or DSL connection) will enhance the user experience.
As a general guideline for what to expect, pages sent to your browser from the
BCA.Net server are between 2KB (kilobytes) and 50KB (pages with graphical
content are at the higher end of this range). With a 56kbps connection, the larger
pages should download to your computer in less than 2 seconds. With a broadband
connection, new pages should take a fraction of a second. Keep in mind that other
factors, like traffic volume on the Internet, may cause slower response times .
Web Browser Settings
This section discusses several browser settings that you may need to adjust in order
to use BCA.Net. Access these settings from your browser’s main menu. In Internet
Explorer use the menu option Tools>Internet Options. With Netscape, select
Edit>Preferences.
Cookies
BCA.Net uses session cookies. Your browser should allow session cookies with
most privacy settings with the exception of “Block all cookies”. Session cookies
promote the security of your session without compromising your privacy.
Security and Other Settings
The following security settings must be enabled in your browser in order to use
BCA.Net and all of its features.
In Internet Explorer, under “Security” you must enable:
“Active scripting”
“Downloading of files”
With Netscape, you must check under Advanced>Scripts & Plug -Ins:
“Enable JavaScript with Navigator”
Also with Netscape, under Navigator>Downloads> you must select one of the
following options:
“Open the download manager”
“Open a progress dialog”
BCA.Net - Highway Project Benefit-Cost Analys is System User's Manual
Technical Description 5
File Formats
Some of the optional features of BCA.Net involve the transfer of files between the
BCA.Net server and your computer. The following are the file formats used in these
transfers:
Files with a BCA extension are used when downloading and uploading
archived data for storage on a local computer between sessions. Thes e
files can only be used by the BCA.Net system.
PDF or portable document files are used with BCA.Net reports. In
order to view and print these files, you should have Adobe Acrobat ©
Reader or other compatible software installed on your computer in
order to read and print these files. Free versions of Adobe Acrobat ©
Reader are available from many sources on the Internet.
Overview of this Manual
The remainder of this document describes how to conduct a BCA.Net analysis and
use the pages that are encountered during an analysis. The manual concludes with a
glossary of terms and an index.
In the text, the following conventions are used:
6 Technical Description
Bold text is used to refer to a page in BCA.Net (e.g., Manage page).
The same bold text will be used when referencing the links to these
pages from the main navigation menu.
Italics are used to designate menu options and selections in BCA.Net
(e.g., Create new dataset)
Choices in browser menu hierarchies are shown with the > symbol
(e.g., “Edit>Paste” means “select menu option Edit then select from its
submenu the option Paste”.
BCA.Net - Highway Project Benefit-Cost Analysis System User's Manual
Using BCA.Net
Introduction
This chapter gives general guidance on working with BCA.Net. The first section
describes data management in BCA.Net. The section that follows presents the
process for conducting a benefit-cost analysis with BCA.Net.
The subsequent chapter, “BCA.Net Page-by-Page”, provides detailed descriptions of
all the features of BCA.Net.
Managing Data in BCA.Net
In order to manage data and conduct analyses effectively in BCA.Net you should be
familiar with its data hierarchy.
Every active session of BCA.Net has a data hierarchy that is populated with values at
all times. These values correspond to the current selections of data that are viewable,
editable and are used in BCA.Net model calculations. You navigate among different
data collections by making selections on the Manage page, which sets the values in
the data hierarchy.
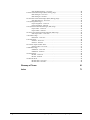
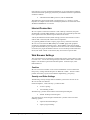
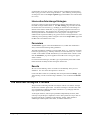
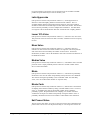
The data hierarchy is shown in the figure below. A brief description of each of the
nodes (boxes) in the figure follows at the end of this section.
BCA.Net - Highway Project Benefit-Cost Analys is System User's Manual
Using BCA.Net 7
Figure 2 Data Hierarchy in BCA.Net
User
Dataset
Project
Segment
Base Year Facility Characteristics
Traffic Profiles
Base Year Signals and Devices
Bases (Base and Alternate)
Intersection/Interchange
Base Year Characteristics
Exiting Flows
Cases (Base and Alternative)
Segment Strategies
Identifiers and Effects
Signals and Devices
Costs
Intersection/Interchange Strategies
Identifiers
Costs
Parameters
Scenario
Results set
The solid connecting lines in the data hierarchy figure mean that the lower node to
the right is a “child” of the parent node above and to its left and to which it is
connected. The dotted lines indicate that the data objects to the right refer to objects
contained in the collection to the left (i.e., a case contains a reference to one or more
strategies; a traffic profile contains a reference to one or more traffic distributions ).
When you change the value of a parent node (by making a selection in the Manage
page), you are also re-populating the nodes in the hierarchy below the parent with
values that represent data collections belonging to the newly selected parent node
value.
The following are descriptions of the nodes in the data hierarchy.
User
When you log in to BCA.Net, a value representing your user account is set in the
User node. This never changes during your session and ensures that users can only
access their own data and not those of others.
8 Using BCA.Net
BCA.Net - Highway Project Benefit-Cost Analysis System User's Manual
Dataset
User data for analyses are organized in datasets in the BCA.Net database. Users may
create and maintain up to 10 datasets at one time on the BCA.Net server. A dataset is
a comprehensive container of data collections used in BCA.Net analyses. Note that
data from different datasets cannot be combined in a single analysis. You can use
datasets to preserve a baseline analysis, and then develop new analyses from
renamed copies of the baseline dataset. You can download a dataset to your
computer and restore it to the system later (thus allowing users to create and store as
many datasets as desired). You can also share data with a colleague by sending your
downloaded dataset to him or her, which your colleague can then upload during a
session with BCA.Net.
Access the options for selecting, creating, deleting, downloading and uploading
datasets from the Actions submenu of the Manage page.
Project
A project has a set of defining values (these can be viewed and modified in the data
grid at the bottom of the Manage page – see Section 2. Manage Page below) and
refers to a set of one or more highway segments. A segment is a specific highway
facility with uniform physical and performance characteristics and traffic flows. It is
common for a project to consist of only a single segment.
Create, delete and modify project segments (i.e., discrete components or sections of a
project) and their associated data on the Project Segment page.
A project with multiple segments may also contain one or more
intersection/interchanges. ISICs represent facilities that connect multiple segments.
They can be as simple as a signaled intersection where four segments connect or as
complex as a major clover leaf joining six roadway segments. The parameterization
of ISICs is intended to capture the delay associated with vehicle traffic traversing the
ISIC as it flows from one segment to the next. Create, delete and modify project
ISICs and their associated data on the Project ISICs page. Enter the
parameterization of an ISIC to represent traffic delay for a particular ISIC types on
the Parameters page.
Create and delete projects, and modify their defining labels and values in the
Manage page.
Scenario
A scenario has a set of defining values (a description, start year of the analysis
period, last year of near term, and end year of the analysis period) and an associated
collection of scenario data. A dataset will contain at least one scenario, and may
contain as many as 30 scenarios.
Create and delete scenarios, and modify their defining values from the Manage
page. After selecting a scenario, view and modify the scenario data from the
Scenario page.
Segment Strategies
Although not defined through the Manage page, each dataset must have one or more
segment strategies defined within it. The Segment Strategy page is used to describe
the actions and costs of actions (e.g., resurfacing, adding lanes , adding or removing
traffic signals, etc.) to be evaluated as part of the base cases and design alternatives
BCA.Net - Highway Project Benefit-Cost Analys is System User's Manual
Using BCA.Net 9
considered for one or more projects. Strategies can be combined and sequenced to
make up any given base case or design alternative. (The combining and sequencing
of strategies is done on the Project Segments page with the Base Case and Alternate
Case view).
Intersection/Interchange Strategies
If a project contains an intersection/interchange, then the dataset must have one or
more ISIC strategies defined within it. The ISIC Strategy page is used to describe
the actions and costs of actions (e.g., modifying an intersection or interchange to
facilitate more efficient traffic flow, by say, upgrading a signaled intersection to a
diamond interchange). The strategies are to be evaluated as part of the base case s
and design alternatives considered for one or more projects. Strategies can be
combined and sequenced to make up any given base case or design alternative. (The
combining and sequencing of ISIC strategies is done on th e Project ISICs page with
the Base Case and Alternate Case view).
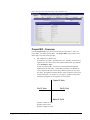
Parameters
The Parameters page is used to hold information on 1) traffic flow distributions
and, 2) intersection/interchange delay parameters.
The traffic distribution parameters represent traffic flows (e.g., peak hours, shoulder
hours) for typical days (e.g., workday, weekend) over the course of a year. There is
no limit on the number of traffic distributions you can define within a dataset. Data
from the Parameters page can be applied to the traffic levels of any given project
within a dataset.
For intersection/interchanges, each ISIC type is represented by three tables of data
that characterize the delay for flows through an intersection.
Results
BCA.Net sets the defining values of a results set automatically when you run a
simulation. You can set the description for a results set.
Create and delete results sets, and modify their descriptions from the Manage page.
After selecting a results set and running a simulation, view results from the Results
page.
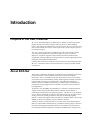
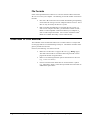
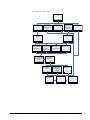
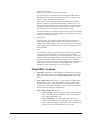
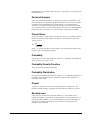
The BCA.Net Analysis Process
The process for conducting a benefit-cost analysis with BCA.Net follows the steps
shown in the workflow figure below. The boxes in the figure show the name of the
step, an identifying number and the name of the BCA.Net system page where the
step’s operations are performed.
As the figure indicates, some steps are performed independently of others, while
other steps require the prior completion of one or more predecessor steps. Each of
the steps in the figure is explained in the following chapter, which includes a
walkthrough and description of the model, its features and their use.
10 Using BCA.Net
BCA.Net - Highway Project Benefit-Cost Analysis System User's Manual
Figure 3 BCA.Net Analysis Workflows
Select dataset
01
Manage
Select project and
set definitions
Select scenario
and set definitions,
including analysis
years
Select results set
and set definitions
Enter data for
maintenance and
improvement
strategies
Enter data for
traffic distributions
02
03
04
05
06
Manage
Manage
Manage
Create project
segments
07
08
Enter data for
base year facility
characteristics
Enter data for
AADT and traffic
profiles in
designated years
Enter data for
base year signal
and traffic devices
09
10
11
Segment
Create and enter
data for new ISIC
type (if not already
specified)
13
Parameters
Set scenario data
Segment
Segment
Strategies
Segment
Scenario
Set base and
alternate cases
12
Segment
Create
Intersection/
Interchange
Parameters
14
ISIC
Enter segments
and intersection
type
15
ISIC
Enter data
allocating flows
entering ISIC to
segments
16
Set simulation
parameters
18
Simulation
BCA.Net - Highway Project Benefit-Cost Analys is System User's Manual
ISIC
Set base and
alternate cases
17
Run simulation
19
Simulation
ISIC
Review results
20
Results
Using BCA.Net 11
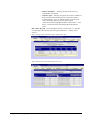
BCA.Net Page-by-Page
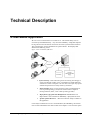
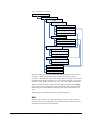
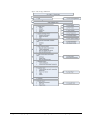
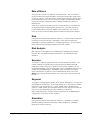
Introduction
The figure below shows the pages in BCA.Net and the means for accessing each page
(pages directly connected to the main navigation menu are accessed from it. Access
other pages from the connecting page to its left in the figure). The following
descriptions of pages each contain an Overview and a Features section.
BCA.Net - Highway Project Benefit-Cost Analys is System User's Manual
BCA.Net Page-by-Page 13
Figure 4 Key to Pages in BCA.Net
14 BCA.Net Page-by-Page
BCA.Net - Highway Project Benefit-Cost Analysis System User's Manual
1. Login Page
Figure 5 View of Login Page
Login - Overview
BCA.Net can be accessed through one of two modes of access, each of which is the
only access mode for a particular category of users. The modes of access and the
user categories are:
FHWA’s User Profile and Access Control System (UPACS),
Users that access BCA.Net with this access mode are FHWA employees or
others that are registered users of FHWA information systems.
The Login and Registration Pages of BCA.Net.
Users that access BCA.Net with this access mode are non-FHWA
employees and those who are not registered users of FHWA information
systems.
Accessing BCA.Net through UPACS
Access BCA.Net by setting your browser to the UPACS login website. After you
login through UPACS, a list of links will appear. Select the link that says BCA.Net
System and your browser will be directed to the BCA.Net welcome page.
Accessing BCA.Net through the BCA.Net Login Page
Set your browser to the BCA.Net URL. The Login Page shown in Figure 5 will
appear. If you have already registered as a BCA.Net user, then enter your user ID
and password, and click submit to begin your session with BCA.Net.
BCA.Net - Highway Project Benefit-Cost Analys is System User's Manual
BCA.Net Page-by-Page 15
1.a Registration Page
Figure 6 View of Registration Page
Registration - Overview
On this page, first-time users who are not FHWA employees and are not regis tered
users of FHWA information systems register for BCA.Net. You arrive at this page by
entering an e-mail address on the right side of the Login Page (Figure 5) and clicking
submit.
Required information for registration includes: a User ID; a password; organization
and type; address; and, a hint question and answer for login assistance.
After registering, you will be redirected to the welcome page.
16 BCA.Net Page-by-Page
BCA.Net - Highway Project Benefit-Cost Analysis System User's Manual
2. Manage Page
Figure 7 Project View of Manage Page
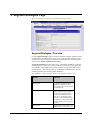
Manage - Overview
Use the controls on the Manage page to set and manage the data objects (e.g.,
datasets, projects, scenarios, result sets) for your analysis (see the section on “The
Data Hierarchy in BCA.Net”). You can also modify the defining values for data
objects, set or restore defaults, select the model type, and, launch the page to create
new data objects or delete existing ones.
Use the Manage>View features in the main menu to toggle the page between the
different views, which correspond to the three data, object types: project, scenario
and results set.
Manage - Features
Enable-Go toggle buttons – The two figures below show two rows
from the Manage page, “Selected dataset” and “Selected Project” (note
that “Selected Project” is specific to “Current View – Project”). In the
first figure, the dataset selection dropdown list is active and the project
selection dropdown list is inactive. Clicking the “Enable” button will
cause the page to change so that the dropdown list to its left becomes
active. When the dropdown list is active, the button to its right will
display “Go”. Clicking the “Go” button will change selected dataset
(or project) to the one showing in the respective dropdown list.
Figure 8 Go-Enable Toggle Buttons - Dataset selection enabled
BCA.Net - Highway Project Benefit-Cost Analys is System User's Manual
BCA.Net Page-by-Page 17
Figure 9 Go-Enable Toggle Buttons - Project selection enabled
Select dataset dropdown list – if you have more than one dataset, select the
one to use with this drop down list. After selecting, click the “Go” to the
right of the dropdown list.
New dataset link - Invoke the page for creating a new dataset.
Delete dataset link – Delete the selected dataset. The link is enabled only
if a non-default dataset is selected. If you wish to delete a default dataset,
and then select a different dataset, set it as the default dataset, and then
delete the former dataset.
Manage>Views menu options: When you select one of the views, you
change the current view to focus on one of the three data objects – project,
scenario or results set. A fourth view on the page allows you to select and
generate BCA.Net reports.
The components on the page below the header “Current View” will change
accordingly when you select one of the first three views:
o
Populate the drop down list for the data object selection (enabled
after clicking on the “Enable” button below the “Current View”
header).
o
Populate the grid at the bottom of the page with the defining values
of the selected data object and enable editing of these values.
o
Enable the “Create New” link to navigate to the corresponding
page when clicked for creating a new data object.
o
The “Delete” link is enabled (only if the selected data object is not
the default data object.)
The reports view on this allows you to select reports for printing and saving.
Manage>Views>Projects menu options:
o
When you click the “Edit” button the grid changes to edit mode
and the editable values will appear in text boxes . Click the
“Update” button when you have completed editing, or, click the
“Cancel” button to undo edits and return to non-edit mode.
o
Modify the defining values for the selected project in edit-mode.
o
Select the model type for the analysis by setting the Project uses
network model parameter to “true” for a Network model type or
“false” for a Basic model type. The First year alternative network
parameter determines the first year the alternative network model
is used in the analysis 1 .
o
The Default parameter determines the default project settings for
the selected dataset.
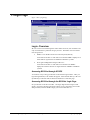
Manage>Actions menu options:
o
1
Reload defaults – Some of your data collections are designated as
“defaults”, which are set as “selected” when you begin your
See Text Box at the end of the chapter for a description of the Network Model and how it differs from the Basic Model.
18 BCA.Net Page-by-Page
BCA.Net - Highway Project Benefit-Cost Analysis System User's Manual
BCA.Net session. This action restores your default settings to be
the current ones.
o
Save current selections as defaults – This action will replace
your default selections with the ones that are current.
o
Archive dataset to local disk – When you download a dataset,
you create a BCA file on your computer that contains a replica of
all the data in your dataset. The downloaded dataset is for storage
and sharing with other users. It is not in a suitable format for
offline modification of data. After downloading your dataset, you
can delete it from the BCA.Net server database.
o
Restore archived dataset – Select this action to upload and
restore an archived dataset to the BCA.Net server.
o
Generate report – Selecting this option will generate a “Settings
Report” in Adobe Acrobat (pdf file) for the project that is currently
selected. This report summarizes all data included in the project,
scenario, and result views on the Manage page.
Select project drop down list (visible when the “Project” view is selected)
– Select the project for your analysis.
Select scenario drop down list (visible when the “Scenario” view is
selected) – Select the scenario for your analysis.
Select results set drop down list (visible when the “Results set” view is
selected) – Select the results set for your analysis.
Create project, scenario, or results set link - Invoke the page for creating
a new data object (project, scenario or results set, depending upon the
current view).
Delete project, scenario, or results link – Delete the selected data object.
Note that you cannot delete a default data collection – if the data collection
you wish to delete is the default, then select a different data object and set
that one as the default and then delete the originally selected data object.
Data object definitions data grid – After selecting a data collection with
the drop down lists above, its definitions will appear in the data grid at the
bottom of the page.
o
Click the “Edit” button the grid changes to edit mode and the
editable values will appear in text boxes .
o
Click the “Update” button when you have completed editing .
o
Click the “Cancel” button to undo edits and return to non -edit
mode. Note that if you update changes to a default data set, these
changes become part of the default data.
BCA.Net - Highway Project Benefit-Cost Analys is System User's Manual
BCA.Net Page-by-Page 19
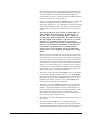
TEXT BOX – BASIC MODEL AND NETWORK MODEL
BCA.Net conducts benefit-cost analysis of improvements to specific roadways. BCA.Net’s Basic Model assumes that
the improvements to a roadway are largely restricted to the roadway itself and there is no fundamental shift in traffic
patterns as a result of the improvement. With the Basic Model, BCA.Net always compares the base and alternate cases
of an existing facility with no significant change in traffic flows on the improved segments or on adjacent roadways.
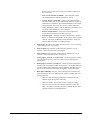
A large category of roadway improvements will, in fact, cause significant shifts in traffic patterns. For instance, a new
connector that links between two facilities would typically result in major changes in t raffic patterns. An example of
one such project is a proposed connector road in Eagle County, Colorado (see figure below) that will add a new
interchange to I-70 and build a new north-south connector road that flies over US 6 and connects to Cooley Mesa
Road, which accesses the regional airport. When the connector road is added about one -third of the trips on parts of
US 6 divert and use I-70 and the new connector road instead.
Figure 10 Example Connector Road Project
PROPOSED
CONNECTOR
ROAD
The Network Model permits the comparison of a base case roadway network having base case traffic flows with an
alternate case network with different, alternate case traffic flows. BCA.Net performs all of the required calculations on
each of the networks. Just as BCA.Net assumes that traffic analysis has been conducted on roads that are considered
for improvement, projects with connector roads would likewise have suitable traffic planning with forecast traffic on
road links in a network for the period of analysis. So the required set of inputs remains largely the same for the Basic
Model that compares a base and alternate case for the same segments with the same traffic in the base and alternate
cases.
To use the Network Model the user selects the model type on the Manage Page (Project View), selecting Network
Model, for comparing base and alternate road networks. When selecting the Network Model, the user also selects the
first year in which the alternate network is operational in the alternate case. The selected year divides the analysis into
two periods and compares the alternate case (with the base network and traffic flows in the first period and the
alternate network and traffic flows in the second period) with the base case (base network and traffic flows in both
periods).
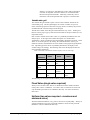
Table 1 Network Model and Effective Networks in Each Case
PERIOD 1
PERIOD 2
BASE CASE
Base Network and Traffic Flows
Base Network and Traffic Flows
ALTERNATE CASE
Base Network and Traffic Flows
Alternate Network and Traffic Flows
With the Network Model the user prepares project segments that represent the base case network and its traffic flows.
The user also specifies for the base case segments the traffic flows for the alternate network. The user then adds to the
project new segments that are present in alternate case network including their forecast traffic flows. On all project
segments the user assigns strategies of maintenance or improvements for the base and alternate case.
20 BCA.Net Page-by-Page
BCA.Net - Highway Project Benefit-Cost Analysis System User's Manual
With both model types, the user runs simulation in exactly the same way. With the Network Model, however, the
forecast traffic flows are assumed to already account for induced demand while the Basic Model calculates induced
demand and its effects on user costs and benefits.
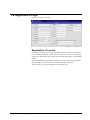
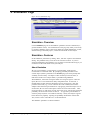
2.a to 2.d New Data Object (Dataset, Project, Scenario,
Results set) Page
Figure 11 View of Create New Project Page
New Data Object - Overview
Invoke this page from the Manage page and use it to create a new data object.
Depending on the data object, the required actions will vary (see the table below).
Note that if you invoke this page and then change your mind, you can return to the
Manage page by selecting from the Main Menu Manage>Go to Manage Page.
Table 2 Required Actions for Creating New Data Objects
Data object
Required Actions for Creating New
Object
Dataset
Select “new from sample data” or “copy a
dataset”. If you select “copy” then you must
select the dataset to copy from a dropdown list.
Provide a name for the new dataset.
Project
Select “create a new, empty project” or “copy an
existing project”. If you select “copy” then you
must select the project to copy from a dropdown
list. Provide a name for the new project.
Scenario
Select “create new scenario with default values”
or “copy an existing scenario”. If you select
“copy” then you must select the scenario to copy
from a dropdown list. Provide a name for the
new scenario.
Results Set
Provide a name for the new results set.
BCA.Net - Highway Project Benefit-Cost Analys is System User's Manual
BCA.Net Page-by-Page 21
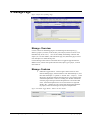
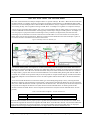
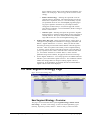
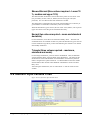
2.e Generate Multiple Reports Page
Figure 12 A section of the Generate Multiple Reports View with a Network model type
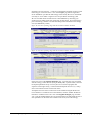
Generate Multiple Reports - Overview
Invoke this page from the Manage page and the menu selection
Mange>Actions>Generate Multiple Reports. This page allows you to generate all
BCA.Net reports or any subset of them. Select the reports you wish to generate then
click “Submit”. The reports listed will vary according to the network model type
selected for the analysis.
Note that the Results reports require running a simulation prior to report generation.
Failure to do so will cause an error notice to be displayed. Each report generated
will pop in up a new browser with the report displayed as a portable document file
(pdf). The report can be printed or saved to your local computer.
After generating your reports you can move to any other page with the navigation
menu.
22 BCA.Net Page-by-Page
BCA.Net - Highway Project Benefit-Cost Analysis System User's Manual
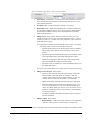
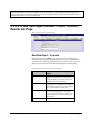
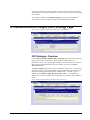
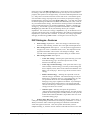
3. Segment Strategies Page
Figure 13 View of Segment Strategies Page (Identifiers and Targets View)
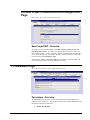
Segment Strategies - Overview
Use the Segment Strategies page to develop strategies for highway segments, which
are improvement and maintenance actions. You specify segment strategies to use in
the benefit-cost analysis when you set the base and alternate cases for the segments
of a project (at Project Segments>Views>Cases).
The Segment Strategies page has three views: 1) Identifiers and Effects, 2) Signals
and Devices, and, 3) Costs. To specify the effects of a strategy you set target values
for the facility characteristics that are the result of the strategy (either improvement
or maintenance). The following table for the Identifiers and Effects View lists the
variables targeted by the strategy and their definitions :
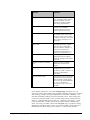
Table 3 Definitions of Strategy Target Variables in the Identifiers and Effects View
Variable
Definition
Freeflow speed
The average speed "that a driver
would like to attain in absence of
any impedance due to other vehicles
or control devices".
M aximum flow rate (veh/hr/lane)
The maximum flow rate of a
facility, a measure of its capacity, is
the flow rate ("equivalent hourly
rate at which vehicles pass over a
given point…during a given time
interval") where speed and density
are optimal (i.e., more traffic results
in greater density, lower speeds and
less flow)
Number of lanes
Number of lanes of the facility after
implementation of the strategy. For
BCA.Net - Highway Project Benefit-Cost Analys is System User's Manual
BCA.Net Page-by-Page 23
Variable
Definition
instance, if the strategy is to add
lanes, the number of lanes should
equal the total lanes (new and
existing) that would be available
after strategy implementation.
Of lanes, number reversible
Number of lanes whose direction is
reversible to accommodate
unbalanced directional flows of
traffic at different times of day.
Pavement Serviceability Index (PSI)
The AASHTO Pavement
Serviceability Index, a zero to five
rating scale, where a user considers
a roadway with rating 5 to be perfect
and a roadway with rating 0 to be
impassable.
Pavement Deterioration Rate (annual
change in PSI)
After improvement and with a
designated maintenance program,
this is the value by which PSI is
expected to decrease annually (i.e.,
if PSI is 4.2 in 2010 and the
Pavement Deterioration Rate is .1,
then in 2011 the PSI will be 4.1).
Percent Grade
The change in elevation between the
beginning and end of a segment,
divided by the length of the segment
times 100.
Crash Rate: Accidents per M illion
VM T
Number of crashes per million
vehicle-miles traveled on the
segment.
Facility Type
Use the dropdown list to select one
of eight facility types: Freeway,
expressway, arterial or collector - in
an urban or rural/suburban
environment
Change in Facility Length
If the strategy involves construction
which alters the roadway alignment,
enter the change in facility length
between the new and old alignments
(i.e., if a 5.5 mile facility is
shortened to 4.7 miles, enter here 0.8 miles).
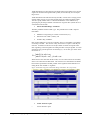
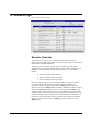
In the “Signals and Devices” view of the Strategies page (see Figure 12), you
specify any changes in the traffic signals or traffic control devices that are associated
with a strategy. In effect, this page supplements the “Identifiers and Effects” view
with data specifically pertaining to intersection traffic control. If the strategy does
not cause any change in traffic control, you must indicate this by checking the “No
changes...” check box that appears in this view. (When the “No changes…” check
box is checked traffic control in a particular year of the analysis is determined by
either: 1) the base year traffic control set in the Project page, or, 2) the last strategy
implemented that affects traffic control). If a change in traffic signals or devices is
intended as part of the strategy, the “No changes…” check box(es) should be
24 BCA.Net Page-by-Page
BCA.Net - Highway Project Benefit-Cost Analysis System User's Manual
unchecked and activated by clicking the corresponding “Go” button (see Figure 13).
Once the signals view is invoked, signals and devices for the strategy under
consideration can be entered, modified or eliminated using the appropriate buttons
(e.g., “Add New”, “Edit”). After modifying signal or device data, click the “Update”
button to save your changes. Note that the signal and device data must be
specified separately for peak, shoulder and non-peak traffic periods. Also, see
the base year “Signals and devices” discussion in the Project section of this manual
below.
Figure 14 Signals and Devices View of the Strategy Page with No Changes to Signals or
Devices
Figure 15 Signals and Devices View of the Strategy Page with Changes to Signals or Devices
BCA.Net - Highway Project Benefit-Cost Analys is System User's Manual
BCA.Net Page-by-Page 25
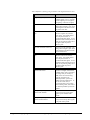
Table 4 Definitions of Strategy Target Variables in the Signals and Devices View
Variable
26 BCA.Net Page-by-Page
Definition
Length of Signal Cycle(seconds)
The total time in seconds to complete
a complete signal cycle (i.e., the time
from the beginning of a red signal to
the beginning of the next red signal).
Perc. Eff. Green Dir. Greater Use
The percent of the total signal cycle
during which the light is green in the
on the segment in the direction with
the greater traffic flow.
Perc. Flow Corr. Green Dir. Greater
Use
The correlation of traffic flow (in the
direction of greater use) with the
green signal. This variable allows
you to capture the effect of
synchronized traffic signals. A zero
correlation means that the percent of
traffic not experiencing delay due to
the signal equals the percent
effective green.
Perc. Eff. Green Dir. Lesser Use
The percent of the total signal cycle
during which the light is green in the
on the segment in the direction with
the lesser traffic flow.
Perc. Flow Corr. Green Dir. Lesser
Use
The correlation of traffic flow (in the
direction of lesser use) with the
green signal. This variable allows
you to capture the effect of
synchronized traffic signals. A zero
correlation means that the percent of
traffic not experiencing delay due to
the signal equals the percent
effective green.
Average Delay (sec) per Small
Vehicle Peak Period
This variable applies to stop signs
and other non-signal traffic devices,
including traffic circles, and reflects
the average delay in seconds per
small vehicle due to the slowing,
stopping, and return to the
uninterrupted flow speed on the
segment from the traffic device. In
the case of a traffic circle, it
represents the time to slow, merge
with circulating traffic, and return to
the uninterrupted flow speed on the
segment.
Average Delay (sec) per Small
Vehicle Peak Shoulder
This variable has the same meaning
as the previous one, except that it
applies to peak shoulder traffic
periods.
Average Delay (sec) per Small
Vehicle Off-Peak Period
This variable has the same meaning
as the previous except that it applies
to off-peak traffic periods.
BCA.Net - Highway Project Benefit-Cost Analysis System User's Manual
Note that is the “No Changes…” boxes are unchecked for a particular strategy , and if
that strategy is used in the “Cases” view of the Project page, then the signal and
device information specified for that strategy will be used by BCA.Net in the benefitcost analysis. If no traffic or signal services are specified for the strategy, then
BCA.Net assumes that all such devices have been eliminated by the strategy (as
would occur if a traffic signal were replaced by an interchange). If an interchange is
part of the strategy, then the cost of the interchange must be included in the strategy
costs (see immediately below).
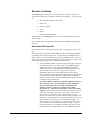
Figure 16 Costs View of Strategy Page with the Work Zone Calculator Disabled
Figure 17 Costs View of Strategy Page with the Work Zone Calculator Enabled
In the Costs view of the Segment Strategies page, you specify the costs associated
with the strategy. Select the units (total, per facility-mile, or per lane-mile) and enter
the capital expenditures for up to seven years of a construction program, with
separate costs for right-of-way, construction and anticipated user costs (i.e., delay)
due to construction activities such as work zones.
Anticipated user costs due to construction can be calculated using the Work Zone
Cost Calculator. To enable the use of the calculator, check the “Enable Work Zone
Calculator” checkbox in the Costs view of the Segment Strategies page, and click
“Go”. This will disable manual entry for work disruption costs and enable the user to
enter parameters for the work zone calculator in all seven years of the strategy.
BCA.Net - Highway Project Benefit-Cost Analys is System User's Manual
BCA.Net Page-by-Page 27
Table 5 Definitions of Work Zone Calculator Variables in the Costs View
Variable
Definition
Lanes Open in Work Zone
The total number of operational lanes
in a work zone.
M aximum Allowed Speed in Work
Zone (in miles-per-hour)
The maximum posted speed for the
operational lanes in a work zone, in
miles-per-hour.
M aximum Duration of Work Zone
(in days)
The maximum duration of a work
zone disruption, in days.
Hours per Day
The total daily number of hours during
which the work zone lane closures are
active.
Percentage of Work Zone During
Peak
The percentage of daily work zone
disruptions that take place during the
peak period.
Percentage of Work Zone During
Peak Shoulder
The percentage of daily work zone
disruptions that take place during the
peak shoulder period.
Length of Work Zone (in miles)
The total length of work zone, in
miles.
If changes to signals or traffic devices are included in the strategy, these costs must
be included as part of the strategy’s cost in this view. Note that the capital costs of a
strategy only begin in the year in which you specify the strategy to be implemented
in the Cases view of the Project page. You must also specify the annual Operating
and Maintenance (O&M) and Other Lifecycle (OLC) costs (if any) associated with
the strategy. Note that theses recurring annual costs take effect in the year following
the last year of capital expenditures. Likewise, the target effects of a strategy
(specified in the Identifiers and Effects view of the Segment Strategies page) take
effect in the year following the last year of capital expenditures. For instance, if a
strategy is implemented, say, in the alternate case in year 2010 and has three years of
capital expenditures, there will be associated capital expenditures in years 2010,
2011 and 2012. In year 2013, the strategy target effects will apply and the strategy
O&M and OLC costs begin to accrue in each year.
Segment Strategies - Features
28 BCA.Net Page-by-Page
Select strategy dropdown list – Select the strategy to edit with this drop
down list. After selecting, click the “Go” to the right of the dropdown list.
Segment Strategy>Views menu options – Use this option to toggle
between the pages’ three views: 1) Identifiers and Effects, 2) Signals and
Devices, and 3) Costs. The components on the page below the header
“Current View” will change accordingly. Each view will show a suitable
data grid control for editing its variable values.
Segment Strategy>Actions menu options:
o
Create new strategy – Selecting this option will bring you to the
New Strategy page. See the description of its use and features in
the following section.
o
Create copy of selected strategy – This option will create a copy
of the currently selected strategy. The newly created strategy will
BCA.Net - Highway Project Benefit-Cost Analysis System User's Manual
have a temporary name, which can be edited in the Identifiers and
Effects view of the page. The new copy will be set as the current
strategy.
o
Delete selected strategy – Selecting this option will cause the
selected strategy to be deleted. The selected strategy can only be
deleted if it is “orphaned”, that is, it is not referenced by any case
(as specified in the Cases view of the Project page) belonging to
any project segment in the dataset. If you attempt to delete a
strategy that is referenced by a case, then the page will show an
error message. Following a successful deletion, the first strategy in
the list is set as current.
o
Generate report – Selecting this option will generate a “Segment
Strategy Report” in Adobe Acrobat (pdf file) for the strategy that is
currently selected. This report includes all data in the identifiers,
target effects and costs views on the Segment Strategy page.
Strategy values data grid – On the page below the line “Current View” is
a data grid corresponding to the selected view of the page (“Identifiers and
Effects”, “Signals and Devices” or “Costs ”). When you click the “Edit”
button the grid changes to edit mode and the editable values will appear in
text boxes. Click the “Update” button when you have completed editing,
or, click the “Cancel” button to undo edits and return to non -edit mode. If
you try to update, but one or more of the text boxes contains invalid values
(i.e., non-numeric characters in a numeric field, or, values outside a
permissible range for the variable), the page will show an error message.
On the “Signals and Devices” view of the page, there are additional buttons
that allow you to add or delete signals or devices. Two checkboxes indicate
whether the strategy effects no changes to existing signals or devices,
respectively. If the checkboxes are checked, then the associated table of
signals or devices will not be displayed.
3.a New Segment Strategy Page
Figure 18 View of New Strategy Page
New Segment Strategy - Overview
This page is accessed from the menu option Segment Strategy>Actions>Create
new strategy. To create a new strategy: 1) select one of the eight facility types
(Freeway, expressway, arterial, collector – urban or rural), 2) select one of the
BCA.Net - Highway Project Benefit-Cost Analys is System User's Manual
BCA.Net Page-by-Page 29
strategy types (maintain, resurface, widen lanes , add lanes, reconstruct, reconstruct
and widen lanes, reconstruct and add lanes), 3) enter a name for the new strategy and
click “Submit”.
After clicking “Submit”, the Segment Strategies page will appear and the new
strategy will be set as the current strategy and can be modified as needed.
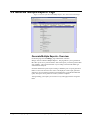
4. Intersections/Interchanges (ISIC) Strategy Page
Figure 19 View of Segment Intersection / Interchanges Page (Identifiers)
ISIC Strategies - Overview
Use the Intersections/Interchanges (ISIC) Strategies page to develop strategies for
highway intersections/interchanges . The strategies are improvement and
maintenance actions. You specify ISIC strategies to use in the benefit -cost analysis
when you set the base and alternate cases for the ISIC of a project (at Project
ISIC>Views>Cases).
The ISIC Strategies page has two views: 1) Identifiers and 2) Costs. To specify the
effects of a strategy you set the target ISIC type in the Identifiers view, which is the
result of the strategy (either improvement or maintenance). The ISIC types are
defined on the Parameters Page, ISIC Parameters View. A set of parameters
defines the travel time of vehicles traversing the ISIC as a function of the volume of
traffic.
Figure 20 Intersection/Interchanges Strategies Page (Costs View)
30 BCA.Net Page-by-Page
BCA.Net - Highway Project Benefit-Cost Analysis System User's Manual
In the Costs view of the ISIC Strategies page, you specify the costs associated with
the strategy. Enter the capital expenditures for up to seven years of a construction
program, with separate costs for right-of-way, construction and anticipated user costs
(i.e., delay) due to construction activities such as work zones. Note that the capital
costs of an ISIC strategy only begin in the year in which you specify the strategy to
be implemented in the Cases view of the Project ISIC page. You must also specify
the annual Operating and Maintenance (O&M) and Other Lifecycle (OLC) costs (if
any) associated with the strategy. Note that theses recurring annual costs take effect
in the year following the last year of capital expenditures. Likewise, the effect of a
strategy (e.g., the new ISIC type that is specified in the Identifiers view of the ISIC
Strategies page) takes effect in the year following the last year of capital
expenditures. For instance, if a strategy is implemented, say, in the alternate case in
year 2010 and has three years of capital expenditures, there will be associated capital
expenditures in years 2010, 2011 and 2012. In year 2013, the strategy target effects
will apply and the strategy O&M and OLC costs begin to accrue in each year.
ISIC Strategies - Features
Select strategy dropdown list – Select the strategy to edit with this drop
down list. After selecting, click the “Go” to the right of the dropdown list.
ISIC Strategy>Views menu options – Use this option to toggle between
the pages’ two views: 1) Identifiers and 2) Costs. The components on the
page below the header “Current View” will change accordingly. Each
view will show a suitable data grid control for editing its variable values.
ISIC Strategy>Actions menu options:
o
Create new strategy – Selecting this option will bring you to the
New ISIC Strategy page. See the description of its use and
features in the following section.
o
Create copy of selected strategy – This option will create a copy
of the currently selected strategy. The newly created strategy will
have a temporary name, which can be edited in the Identifiers and
Effects view of the page. The new copy will be set as the current
strategy.
o
Delete selected strategy – Selecting this option will cause the
selected strategy to be deleted. The selected strategy can only be
deleted if it is “orphaned”, that is, it is not referenced by any case
(as specified in the Cases view of the Project ISIC page)
belonging to any project segment in the dataset. If you attempt to
delete a strategy that is referenced by a case, then the page will
show an error message. Following a successful deletion, the first
strategy in the list is set as current.
o
Generate report – Selecting this option will generate an
“Intersection and Interchanges Strategy Report” in Adobe A crobat
(pdf file) for the strategy that is currently selected. This report will
include all data from the identifiers, target effects and costs views
on the ISIC Strategy page.
Strategy values data grid – On the page below the line “Current View” is
a data grid corresponding to the selected view of the page (“Identifiers ” or “Costs”).
When you click the “Edit” button the grid changes to edit mode and the editable
values will appear in text boxes. Click the “Update” button when you have
completed editing, or, click the “Cancel” button to undo edits and return to non -edit
BCA.Net - Highway Project Benefit-Cost Analys is System User's Manual
BCA.Net Page-by-Page 31
mode. If you try to update, but one or more of the text boxes contains invalid values
(i.e., non-numeric characters in a numeric field, or, values outside a permissible
range for the variable), the page will show an error message.
4.a New Intersection/Interchanges (ISIC)
Strategy Page
Figure 21 New Intersection/Interchange Strategy Page
New ISIC Strategy - Overview
This page is accessed from the menu option ISIC Strategy>Actions>Create new
strategy. To create a new strategy: 1) Select and Intersection/Interchange type from
the dropdown list, 2) Enter the name of the new strategy, and 3) click “Submit”.
Note the definitions of the ISIC types are found on the Parameters Page.
After clicking “Submit”, the ISIC Strategies page will appear and the new strategy
will be set as the current strategy and can be modified as needed.
32 BCA.Net Page-by-Page
BCA.Net - Highway Project Benefit-Cost Analysis System User's Manual
5. Project Segments Page
Figure 22 Project Segments Page with Base Year Facility Characteristics View
Project Segments - Overview
From the Project Segments page, you can edit the data for project segments, create
new project segments, and delete existing segments. The Project Segments page has
differing views for the Basic and Network model types. The model type is
determined in the Project View of the Manage Page. The Basic model type is used
if a Network model is not enabled for the analysis.
The Project Segments page has four views if a Basic model type is selected. These
four views apply to the selected project segment:
Base Year Facility Characteristics
The facility characteristics in the base year include the variables that are
targeted by strategies (see Section 3 above). In this section, you also
specify the Operating and Maintenance and Other Lifecycle costs that are
associated with the facility in the base year. The base year is the year that
precedes the period of analysis and the conditions specified for the base
year will prevail in subsequent years (for either the base or alternate cases,
or both) until superseded by a strategy.
Traffic Characteristics
In traffic characteristics there are two components: 1) Forecast Average
Annual Daily Traffic (AADT) for the segment in each of the three
designated forecast years: start year, last year near term and end year (set
these years on the Manage page in the scenario view). The second
component is the traffic profiles , which describe the distribution of traffic in
representative days.
BCA.Net - Highway Project Benefit-Cost Analys is System User's Manual
BCA.Net Page-by-Page 33
Base Year Signals and Devices
In this view, the analyst sets the number and characteristics of the traffic
signals and devices in the facility’s base year. In constructing the base and
alternate cases of the project (see next bullet on “Cases”), the analyst can
select strategies that add, modify, or eliminate the base year signals or
devices (see Strategies page discussion of Signals and Devices above).
Cases
For each segment in a project you specify a base and alternate case. The
base case represents the “do minimal” scenario that is needed to maintain
serviceable operation of the facility over the analysis period. The alternate
case represents a possible improvement to the roadway that typically
involves a significant investment of funds or resources relative to the “do
minimal” base case. Each case is built of one or more strategies along a
specification of the year(s) in which the strategies would be implemented.
For more information on base and alternate cases , see the glossary.
The Project Segments page has five views if a Network model type is used. These
five views apply to the selected project segment:
Base Year Facility Characteristics
The facility characteristics in the base year include the variables that are
targeted by strategies (see Section 3 above). In this section, you also
specify the Operating and Maintenance and Other Lifecycle costs that are
associated with the facility in the base year. The base year is the year that
precedes the period of analysis and the conditions specified for the base
year will prevail in subsequent years (for either the base or alternate cases,
or both) until superseded by a strategy.
Base Network Traffic Characteristics
In the base network traffic characteristics there are two components: 1)
Forecast Average Annual Daily Traffic (AADT) for the segment in each of
the three designated forecast years: start year, last year near term and end
year (set these years on the Manage page in the scenario view). The second
component is the traffic profiles , which describe the distribution of traffic in
representative days. These values only apply to the base network.
Alternate Network Traffic Characteristics
In the alternate network traffic characteristics there are two components: 1)
Forecast Average Annual Daily Traffic (AADT) for the segment in each of
the three designated forecast years: start year, last year near term and end
year (set these years on the Manage page in the scenario view). The second
component is the traffic profiles , which describe the distribution of traffic in
representative days. These values only apply to the alternate network.
Signals and Devices
In this view, the analyst sets the number and characteristics of the traffic
signals and devices in the facility’s base year. In constructing the base and
alternate cases of the project (see next bullet on “Cases”), the analyst can
select strategies that add, modify, or eliminate the base year signals or
devices (see Strategies page discussion of Signals and Devices above).
Base Case and Alternate Case
For each segment in a project you specify a base and alternate case. The
base case represents the “do minimal” scenario that is needed to maintain
34 BCA.Net Page-by-Page
BCA.Net - Highway Project Benefit-Cost Analysis System User's Manual
serviceable operation of the facility over the analysis period. The alternate
case represents a possible improvement to the roadway that typically
involves a significant investment of funds or resources relative to the “do
minimal” base case. Each case is built of one or more strategies along a
specification of the year(s) in which the strategies would be implemented.
For more information on base and alternate cases , see the glossary.
Project Segments - Features
Select segment dropdown list – Select the segment to edit with this drop
down list. After selecting, click the “Go” to the right of the dropdown list.
Note that segments can be added or deleted in the Project>Actions options
(see below).
Project Segments>Views menu options – Use this option to toggle
between the page’s multiple views:
o
For a Basic model type: 1) base year facility characteristics, 2)
traffic characteristics, 3) signals and devices, and 4) base and
alternate cases.
o
For a Network model type: 1) base year facility characteristics, 2)
base network traffic characteristics, 3) alternate network traffic
characteristics, 4) signals and devices , and 5) base case and
alternate case.
The components on the page below the header “Current View” will
change accordingly. Each view will show a suitable data grid control
for editing its variable values.
Project>Actions menu options:
o
Create new segment – Selecting this option will invoke a
submenu of eight segment types. The selection of a segment type
under this submenu will generate a new segment, populated with
default data that can be edited to reflect the specific characteristics
of the segment under consideration. These characteristics are
described below under the “Segment valued datagrid” discussion.
o
Copy selected segment – This option will create a copy of the
currently selected segment that can be modified to new
specifications. The system gives a temporary name to the newly
created segment, which you can edit in the Base Year Facility
Characteristics view of the segment.
o
Delete selected segment – Selecting this option will cause the
selected segment to be deleted. Note that it is very important that
you delete any segment that is not an intended component of a
project. Otherwise, the model will include the segment in the
benefit-cost analysis.
o
Copy base network traffic characteristics to alternate network
traffic characteristics for selected segment (Network model type
only) – Selecting this option will copy the base network traffic
characteristics to the alternate network traffic characteristics for a
selected segment.
o
Copy base network traffic characteristics to alternate network
traffic characteristics for all segments (Network model type
only) – Selecting this option will copy the base network traffic
BCA.Net - Highway Project Benefit-Cost Analys is System User's Manual
BCA.Net Page-by-Page 35
characteristics to the alternate network traffic characteristics for all
segments
o
Delete traffic profiles and set AADT to 0 in base network for
selected segment (Network model type only) – Selecting this
option will delete all traffic profiles in the Base Network Traffic
Characteristics view of the Project Segments page and set the
AADT for the selected segment to 0 in all years of the base
network analysis.
o
Delete traffic profiles and set AADT to 0 in alternate network
for selected segment (Network model type only) – Selecting this
option will delete all traffic profiles in the Alternate Network
Traffic Characteristics view of the Project Segments page and set
the AADT for the selected segment to 0 in all years of the alternate
network analysis.
o
Generate report – Selecting this option will invoke a submenu of
project reports to generate. Users can generate project reports for
each view in the Project Segments page. For a Basic model type,
these reports include “Base Year Facilities Characteristics”,
“Annual Traffic Data”, “Traffic Profiles”, “Signals”, “Devices”,
and “Segment Base and Alternate Cases”. Reports are generated as
Adobe Acrobat PDF files. For a Network model type, these reports
include “Base Year Facilities Characteristics”, “Base Network
Traffic Data”, “Alternate Network Traffic Data”, “Base Network
Traffic Profiles”, “Alternate Network Traffic Profiles”, “Signals”,
“Devices”, and “Segment Base and Alternate Cases”. Reports are
generated as Adobe Acrobat PDF files.
Segment values data grid – On the page below the line “Current View” is a data
grid corresponding to the selected view of the page (“Facility characteristics in the
base year”, “Traffic characteristics”, “Base year signals and devices ”, “Cases”).
View: Facility Characteristics in the Base Year
When you click the “Edit” button the grid changes to edit mode and the editable
values will appear in text boxes . Click the “Update” button when you have
completed editing, or, click the “Cancel” button to undo edits and return to non-edit
mode. If you try to update and one or more of the text boxes contains invalid values
(i.e., non-numeric characters in a numeric field, or, values outside a permissible
range for the variable) the page will show an error message.
Views: Traffic Characteristics, Base Network Traffic Characteristics,
and Alternate Network Traffic Characteristics
This view contains three components:
o
Annual traffic data for selected years data grid
Specify here the Average Annual Daily Traffic (AADT) for each of the
three designated forecast years (these years are part of the selected scenario
definition – set these on the Manage page with the scenario view). For each
of these tables, the “Edit”, “Update”, “Cancel” buttons work the same as
other data grid controls in BCA.Net. In “Edit” mode set the values for
AADT in the text boxes. After clicking “Update”, the data grid displays the
imputed average annual rates of growth in AADT.
o
36 BCA.Net Page-by-Page
Selected Year dropdown list
BCA.Net - Highway Project Benefit-Cost Analysis System User's Manual
Use this dropdown list to select the year (start year, last year near term, end
year) whose traffic profiles you wish to edit. After selecting, click the “Go”
button.
o
Traffic profile for the selected segment and year data grid
Figure 23 Year Selector and Traffic Profile Data Grid
The data grid contains traffic profiles for the selected year and segment. A traffic
profile is a representative traffic day on the segment in the selected year. The traffic
profile specifies:
o
Duration Periods - the duration of the periods of the day (peak,
peak shoulder and off-peak). You specify the peak and peak
shoulder durations in hours. The off-peak is calculated as the
remaining hours in the day. The peak and peak shoulder period
together cannot exceed 24. The periods should represent the sum
total of such hours during a day (e.g., morning and afternoon peak
hours should be added together).
o
Percent of Year - the percent of days in the year represented by
the traffic profile. The “Percent of Year” values for all the traffic
profiles for the segment and year must sum to 100.
o
Percent of Annual Traffic - the percent of annual traffic that
flows on the segment in the days of the year represented by the
traffic profile. The “Percent of Annual Traffic” for all the traffic
profiles for the segment and year must sum to 100.
o
Percent Vehicle Type – BCA.Net calculates user costs for three
vehicle types – auto, truck and bus. You specify the percentage of
vehicles in the traffic flow for types “truck” and “bus”. The
percentage of type auto is calculated as the remaining share.
o
Traffic Distributions by Vehicle Type – For each of the three
vehicle types you specify its traffic distribution from the dropdown
list that appears when the data grid is in edit mode. For more on
traffic distributions (how to edit them or add new ones), see the
glossary and “5. Parameters Page”
In addition to the “Edit”, “Update” and “Cancel” buttons for editing, the
traffic profiles data grid has buttons “Add New” and “Delete Checked”.
These buttons appear only when the start year is the selected year. The
“Add New” button will add a new traffic profile to the lis t. After adding a
new traffic profile you will need to edit it to reflect your data and
projections. In order to delete a traffic profile you must first edit the traffic
profiles so that those to be deleted have the value zero in the columns
“Percent of Day” and “Percent of Annual Traffic” while the remaining
traffic profiles sum to 100 in each of the two columns. You must repeat this
for each of the three years in order to delete the traffic profiles.
BCA.Net - Highway Project Benefit-Cost Analys is System User's Manual
BCA.Net Page-by-Page 37
After editing, select the start year, and check the check boxes of the traffic
profiles to delete. Click the button “Delete Checked” to complete the
deletion.
View: Signals and Devices
Figure 24 Base Year Traffic Signals and Control Devices View of the Project Page
Specify the base year facility traffic signals and devices for each project segment in
this page. For instance, if a section of arterial highway has two traffic signals in the
base year, these signals would be recorded here. The view consists of two sections.
The top section is for traffic signals. You can add signals by using the “Add New”
button, and then click the “Edit” button to modify the default data profile to provide
an appropriate description of the signal, beginning with a name (e.g., location
description) and the length of the signal’s cycle (the time in seconds between the
starts of the red signal). The data variables are identical to those described in Table 4
above in the Strategies section of this manual. Once the data has been modified and
you wish to save the changes, click the “Update” button. Please note that signal
data must be specified separately for peak, peak shoulder and off-peak traffic
periods.
If you wish to study the impact of a signal or device on the intersecting road at the
intersection, you must include a segment that reflects the data pertaining to the
signal’s impact on that segment (e.g., effective green time, etc.)
Base year signal and device information can be modified by the strategies selected
for the base and alternate cases in the Cases view of the Project page (see Strategies
section above and View: Cases below).
View: Base Case and Alternate Case
Figure 25 Cases View
38 BCA.Net Page-by-Page
BCA.Net - Highway Project Benefit-Cost Analysis System User's Manual
This view presents the base case and alternative case side-by-side. These are the two
cases that will be compared to each other during the BCA simulation . The analyst is
able, for each segment of the project, to specify the strategies and year of each
strategy’s implementation. For instance, for a project consisting of a single segment,
the analyst could specify periodic resurfacing in the base case versus a reconstruction
with less frequent resurfacing in the alternative case. The periodic resurfacing in the
base case could be specified to take place in year 0, 10, 20, and 30; whereas the
reconstruction could be specified for year 0 with one resurfacing at year 25. After
running the BCA, the analyst could then build another alternative and compare that
to the base case in a second BCA simulation.
Please note that the base case should reflect logical management of the asset. It is
not a “do nothing” case. For instance, if the “Base Year Facility Characteristics”
indicate that the Pavement Serviceability Index is 3.5 in 2005 and the pavement is
deteriorating at the rate of .1 PSI per year, then within ten years the pavement
condition would fall to 2.5. At this point, vehicles operating on the pavement would
begin to incur significant operating cost due to the rough pavement – costs that
would worsen dramatically thereafter. If the base case is specified with no strategies
to maintain basic pavement quality at a level above a 2.5 PSI, almost any alternate
case that does maintain pavement quality at serviceable levels during the analysis
period, at whatever cost, will likely compare favorably to the base case. Thus, an
expensive capacity addition could appear cost-beneficial purely on the basis of its
effect on pavement, even if the new capacity adds little time saving benefit.
However, nearly the same benefit could be achieved with a much less costly
resurfacing of the road. The point is to select judiciously the base and alternate
cases, where the base case includes “fallback” management measures (i.e.,
resurfacing to maintain pavement surface quality) that are likely to be implemented
in lieu of major investments. Likewise, the alternate case should also include all
relevant elements of sound asset management to avoid inadvertently undercutting
benefits that should rightly be associated with an improvement.
6. Project Intersections/Interchanges (ISIC) Page
BCA.Net - Highway Project Benefit-Cost Analys is System User's Manual
BCA.Net Page-by-Page 39
Figure 26 Project Intersection/Interchanges Page, Definitions View
Project ISIC - Overview
From the Project ISIC page, you can edit the data for project ISICs, create new
project ISICs, and delete existing ISICs. The Project ISICs page has three views,
which apply to the selected project ISIC:
ISIC Definitions in the base year
The definition of an ISIC, specified in this view, includes: the intersection
segments, the entry direction for each segment and the ISIC type (defined
on the Parameters Page).
In order to create an ISIC, you must have already defined the highway
segments that join at the ISIC. When editing the table in the Definitions
view, a dropdown list will include all the defined segments in the project .
For clarity, the segments should be listed in order of adjacency moving in a
clockwise direction. For instance, if your project segments correspond to
the following diagram, list the segments as shown below.
Maple St. North
Elm St. West
Elm St. East
Maple St. South
Segment 1 Maple St. North
Segment 2 Elm St. East
Segment 3 Maple St. South
40 BCA.Net Page-by-Page
BCA.Net - Highway Project Benefit-Cost Analysis System User's Manual
Segment 4 Elm St. West
(Note: Leave segments 5 and 6 as “none selected”)
The “entry direction” specifies the direction from which traffic enters the
ISIC from the segment. The two directions are 0 are or 1, where 0 is the
direction of major flow during the peak period.
In this view, you also specify the Operating and Maintenance and Other
Lifecycle costs that are associated with the facility in the base year. The
base year is the year that precedes the period of analysis and the conditions
specified for the base year will prevail in subsequent years (for either the
base or alternate cases, or both) until superseded by a strategy.
This view also allows you to enable a selected intersection in either the base
or alternate networks, or both. This parameter is only available if a network
model type is used for the analysis.
Exiting Flows
The exiting flows view contains a table in which the user specifies how
traffic flows originating from each segment are allocated to the other
segments when exiting the ISIC. The user can specify that some of the flow
from a segment exits to no segment, that is, it exits to a roadway that is not
under evaluation.
Cases
For each ISIC in a project you specify a base and alternate case. The base
case represents the “do minimal” scenario that is needed to maintain
serviceable operation of the facility over the analysis period. The alternate
case represents a possible improvement to the ISIC that typically involves a
significant investment of funds or resources relative to the “do minimal”
base case. Each case is built of one or more strategies along a specification
of the year(s) in which the strategies would be implemented. For more
information on base and alternate cases , see the glossary.
Project ISICs - Features
Select ISIC dropdown list – Select the ISIC to edit with this drop down list.
After selecting, click the “Go” to the right of the dropdown list. Note that
ISICs can be added or deleted in the Project ISICs>Actions options (see
below).
Project ISICs>Views menu options – Use this option to toggle between
the page’s three views: 1) Base year definitions , 2) exiting flows, and 3)
base and alternate cases. The components on the page below the header
“Current View” will change accordingly. Each view will show a suitable
data grid control for editing its variable values.
Project ISICs>Actions menu options:
o
Create new ISIC – Selecting this option will invoke the new ISIC
page. On this page the user specifies the name of the new ISIC,
the segments and the ISIC type.
o
Copy selected ISIC – This option will create a copy of the
currently selected ISIC that can be modified to new specifications.
The system gives a temporary name to the newly created segment,
which you can edit in the Definitions view of the ISIC.
BCA.Net - Highway Project Benefit-Cost Analys is System User's Manual
BCA.Net Page-by-Page 41
o
Delete selected ISIC – Selecting this option will cause the
selected ISIC to be deleted.
o
Generate report – Selecting this option will invoke a submenu of
Project Intersection/Interchange reports to generate in Adobe
Acrobat (pdf file). Users can generate project reports for each
view in the Project ISIC page. These reports include
“Intersections/Interchanges Base Facilities Characteristics”, “Exit
Flows”, and “Intersections /Interchanges Base and Alternate
Cases”.
ISIC values data grid – On the page below the line “Current View” is a data grid
corresponding to the selected view of the page (“Definitions ”, “Exiting flows”,
“Cases”).
Figure 27 Project Intersections/Interchanges Exiting Flows View
Figure 28Project Intersections/Interchanges Cases View
42 BCA.Net Page-by-Page
BCA.Net - Highway Project Benefit-Cost Analysis System User's Manual
6.a New Project Intersection/Interchanges (ISIC)
Page
Figure 29 New Project Intersection/Interchange Page
New Project ISIC - Overview
This page is accessed from the menu option ISIC Project>Actions>Create new
interchange/intersection. To create a new interchange/intersection: 1) Enter the
name of the new ISIC, 1) select segments to include in the ISIC from the dropdown
list, 3) select the ISIC type, and 4) click “Submit”. Note the definitions of the ISIC
types are found on the Parameters Page.
After clicking “Submit”, the Project ISIC page will display and the new ISIC will
be set as the current ISIC and can be modified as needed.
7. Parameters Page
Figure 30 View of Parameters Page –Traffic Distributions View
Parameters - Overview
The Parameters page is where you can view and modify model parameters and
other data values in BCA.Net. The page contains two views, traffic distributions and
intersection/interchange parameters.
Traffic Distributions
BCA.Net - Highway Project Benefit-Cost Analys is System User's Manual
BCA.Net Page-by-Page 43
Traffic distributions are data objects in the dataset that can be applied to any project
segment in the dataset through the traffic profile (see the Glossary and “4. Project
Page” above.
Traffic distributions describe the intensity of traffic, in terms of the average percent
of daily traffic per hour, in two of the periods of the day: Peak and peak shoulder.
You also specify whether there is a directional imbalance in the traffic flow by
specifying the percentage of traffic in the direction of greater flow (which will be a
value between 50 and 100).
Intersection/Interchange Parameters
The ISIC parameters define an ISIC type. The parameters for an ISIC comprise
three tables:
Minimum average delay per vehicle in intersection (sec),
Saturation rates in ISIC (veh/hr), and
Variable delay coefficient
Each of these tables has n rows and n columns, where n is the number of segments
connecting to an ISIC. The value for n may be less than or equal to 2 and may not
exceed 6. An element in the ith row and jth column of a table corresponds to the
flow originating in the ith segment and exiting the ISIC in the jth segment. For each
of the flows, the general expression for the delay (i.e., travel time) per vehicle in the
intersection is:
min D, for aht sat
D
2
min D A(aht sat) , for aht sat
Where minD is the value from the first table, sat is the value from the second table,
and A is the value from the third table. The value for aht is calculated in the model
based on the specification of traffic profiles of the segments and the allocation of
exiting flows from the ISIC to segments.
Figure 31 Parameter Page Intersection/Interchanges Parameters View (top section)
•
44 BCA.Net Page-by-Page
Action: Generate report
Action: Generate report
BCA.Net - Highway Project Benefit-Cost Analysis System User's Manual
Selecting this option will generate two parameters reports in Adobe Acrobat (pdf
file) for each view in the Parameters page. These reports include “Traffic
Distribution Parameters” and “Intersections/Interchanges Parameters”. This
information can be an important addition to the Results report (see Results page
discussion) as it enables decision-makers to review the specific project parameters
used in the BCA.
Using the buttons on the page, you can copy an existing traffic distribution or create
a new one, which can than be edited. You can delete a traffic distribution. Prior to
deleting a traffic distribution, you must ensure that the traffic distribution is not
referenced by any segment’s traffic profile in the dataset. Attempting to delete a
referenced traffic distribution will fail and an error message will be displayed.
BCA.Net - Highway Project Benefit-Cost Analys is System User's Manual
BCA.Net Page-by-Page 45
8. Scenario Page
Figure 32 View of Scenario Page
Scenario - Overview
The Scenario page is where you view and edit scenario data for an analysis.
Scenario data for a model input variable can be either a fixed value, or several values
that describe a probability distribution.
This page possesses a number of features that let you easily visualize data and
quickly develop probability distributions that best reflect available information and
judgments on operations, future developments and social costs . These features
include:
Ease of navigation among variables;
Instant viewing of statistics and charts
Instant validation and saving of ranges
Please note that the BCA.Net tool can store many different scenarios for analysis
(e.g., high traffic growth; high cost uncertainty; baseline assumptions, etc.).
Scenarios are initially defined and selected in the Manage page (change to the
Scenario view using the Manage>Views submenu). Modifications made to scenario
data in the Scenario page apply only to the scenario selected in the Manage page,
and will not affect other scenarios no selected. Also, remember that the data in the
selected scenario are the data that will be used by the BCA.Net model to conduct the
benefit-cost analysis on the strategies and cases defined elsewhere in the model. If
you wish to work with data from another scenario and use that data in the analysis,
that scenario must be selected from the Manage page (see section above on the
Manage page).
46 BCA.Net Page-by-Page
BCA.Net - Highway Project Benefit-Cost Analysis System User's Manual
Scenario - Features
The Scenario page is shown above. The scenario input variables in BCA.Net are
organized into data groups according to a functional classification. The data groups
are:
Travel demand and traffic composition
Social costs
Project cost factors
Prices
Policies
Non-Transportation Benefits
When you link to the Scenario page, the “Travel demand and traffic composition”
data are loaded.
The remainder of this section describes the features of the Scenario page and their
functions.
Data Group Pull Down List
Use this drop down list at the top of the page to select the data group to view and
edit.
The data groups accessible from the Scenario page offer the analyst great flexibility
in specifying the present and future travel, cost, and policy environment that will
affect a project. The content of the major groups are summarized below. Note that
each data group allows the analyst to specify a range of uncertainty around any of the
values entered for that group (see the Variable Data Grid below).
“Travel demand and traffic composition” data on this page (see Figure
21) impact other traffic data that are input on the Project page with
Traffic Characteristics view, and on the Parameters page (traffic
distributions). Inputs on the Scenario page that impact traffic levels
include: traffic level uncertainty, average vehicle occupancy,
annualization factor (that converts daily traffic flows into annual
values), minimum speed in peak period, mph (the lowest speed allowed
in the peak period before peak traffic is reallocated to the shoulder
period), and effective price elasticity of demand (the response of traffic
to changes in the cost of driving).
Note that the Effective Elasticity of Demand coefficient (located on
the second page of the “Travel demand and traffic composition”
data group is currently the only variable that influences the
potential response of road users to changes in the roadway
environment (i.e., congestion level, pavement surface and roadway
capacity)). The selection of a price elasticity factor (always a negative
value) will cause traffic to increase if a road project leads to lower
travel costs (e.g., reduced travel time). The specification of an
elasticity of -1 means that a 1 percent reduction in the generalized cost
of travel (i.e., out-of-pocket user costs plus the imputed values of travel
time and safety) would result in a 1 percent increase in traffic. An
elasticity value of -0.1 means that for a 1 percent reduction in travel
cost would lead to a one-tenth percent increase in traffic. Long run,
total trip elasticities of -1 or higher (in absolute value terms) are well
documented in the economic literature. It is recommended, however,
BCA.Net - Highway Project Benefit-Cost Analys is System User's Manual
BCA.Net Page-by-Page 47
that such elasticity values be adjusted to fractional levels based on the
ratio of project length to the average total trip length of drivers using
the project facilities. For instance, if project affects 2 miles of an
average 20-mile trip, then a -1 whole trip elasticity should be adjusted
by a factor of 2/20, or -0.1 for use in BCA.Net.
“Social costs” data are entered in this Scenario page view. Most of the
cost items (including discount rate, value of travel time, value of
statistical life and injury, etc.) are self-explanatory and are set to default
values taken from FHWA sources. The analyst can specify, of course,
alternate values for these items in accordance with his or her agency’s
policies.
Please note that BCA.Net works in terms of constant dollars (i.e.,
dollars that have the purchasing power of a specified year. In
BCA.Net, dollars are base year constant dollars). Inflation is
assumed to affect all prices equally and is not tracked in BCA.Net.
The only exception to this is that users can choose to set a real oil
price index (i.e., the change in oil prices net of general price
inflation). The change in oil prices will be reflected in the analysis
in the user costs of fuel and oil consumption. As the model uses
constant dollars, the discount rate for converting multi-year
streams to present value equivalents must be a constant dollar
discount rate (i.e., has no component for deflating future nominal
dollars).
The model uses the “depreciation rate” to calculate the residual value
(if any) of a project’s non-land assets at the end of the analysis period,
and to adjust the construction disruption costs realized in the analysis
period if an analysis period ends before the end of the useful life of an
asset. BCA.Net does not depreciate the value of the land in its residual
value calculations. Fuel prices are before taxes (taxes are added in the
“Policies” view of the Scenario page – see below). BCA.Net does not
assign default cost values to emissions. Emission costs should reflect
region-specific values developed by the regional planning agency for
each emission type (e.g., tons of carbon monoxide).
48 BCA.Net Page-by-Page
The “Project cost factors” data of the Scenario page are used to adjust
project cost data specified elsewhere in BCA.Net (i.e., the Strategies
page Costs view for individual strategies, which are in turn assembled
into projects and project costs in the Project page Cases view. In
particularly, the “Project cost factors” view of the Scenario page is
used to specify overall project cost uncertainty.
The “Prices” view in the Scenario page allows you to specify future
increases in the real price of fuels and motor oil (net of general price
inflation). This feature is helpful if you wish to study the effects of
increases in fuel prices that exceed the rate of general inflation. If the
index value for fuel on this screen is set at 100 for each year, this
means that the real cost of fuel (relative to other goods and services in
the economy) is expect to remain constant.
The “Policies” view allows the analyst to specify changes in the tax on
fuel over time.
The “Non-Transportation Benefits” view allows you to include
anticipated benefits (or costs ) of a project that are not captured in the
categories already measures by BCA.Net. Values must be input by year
and should, as with other inputs of the model, are in constant dollar
BCA.Net - Highway Project Benefit-Cost Analysis System User's Manual
amounts. For instance, a State DOT may wish to add an anticipated
economic development value that it believes is not redundant with
measured transportation benefits. Alternately, a State may wish to
include the value of land purchased for a project as a residual value.
Variable data grid
The variable data grid enables a quick overview of the variables and data in the
selected data group. The data grid displays the scenario variables, one per row.
Some of the data groups have more than one page, which is evident by the presence
of numbered links at the bottom right of the data grid.
The left most column of the data grid contains links that say “View”. Clicking this
link will cause a page to pop up with the chart and table of the input variable (s ee 6.a
Input Chart below).
Each scenario variable can be a fixed value, or a probability distribution and a risk
analysis input. To the right of the variable description is a column called
“Distribution”, which specifies the selected probability distribution (of which, “Fixed
Value” is one of the options). By clicking the “Edit Distributions” button, you
enable the selection of distributions for each variable on the page through dropdown
lists. Depending upon the choice of probability distribution, the display of the
variable changes accordingly. The following table shows the displayed values for
each probability distribution.
Table 6 Probability Distributions and their Displays on the Scenario Page
Probability
Distribution
First Data Second Data
Value
Value
Third Data
Value
Fixed Value
Fixed value
None
None
Uniform
M inimum
value
M aximum
value
None
Skewed
Normal
Lower 10%
M edian
Upper 10%
Normal
M ean
Standard
Deviation
None
Triangle
M inimum
value
M ost Likely
M aximum
value
The following are descriptions of the available probability distributions :
Fixed Value (single value required)
When you choose fixed value, there is no distribution and the variable assumes a
unitary, fixed value in a simulation. For a fixed value, no statistics are shown and
only the middle percentile box is enabled for data entry. No chart is shown for a
fixed value.
Uniform (two values required – maximum and
minimum value)
With the uniform distribution, every point on an interval is equally likely. When you
select this distribution type, the 0 percentile (minimu m value) and 100 percentile
(maximu m value) are enabled for data entry.
BCA.Net - Highway Project Benefit-Cost Analys is System User's Manual
BCA.Net Page-by-Page 49
Skewed Normal (three values required – Lower 10
%, median and upper 10%)
The skewed normal distribution is derived from three points: the 10% lower value
(10th percentile), the 50% value (or, median) and the 10% upper value (90th
percentile). For non-skewed values this distribution is normal.
This distribution is useful when the exact form of the distribution is not known yet
good estimates on the median and boundary values are available.
When this distribution type is selected, the 10% lower value, median, and 10 percent
upper value boxes in the data grid are enabled for data entry .
Normal (two values required – mean and standard
deviation)
For this distribution, enter data in the statistical summary frame. The mean and
standard deviation are available for data entry when this distribu tion type is selected.
Use this distribution type when you have data indicating the variable is non -skewed
and normally distributed.
Triangle (three values required – maximum,
minimum and mode)
For the triangle distribution, you enter data for the maximu m value, the minimum
value and the most likely value (the mode of the distribution). All values for this
distribution lie between the minimum and the maximu m and its density function
forms a triangle with its peak at the mode. Use this distribution when the variable
and data indicate firm bounds on the maximu m and minimum values and a most
likely value.
After setting the distributions , click on “Edit Values” to edit the values for each
variable.
8.a Scenario Input Variable Chart
Figure 33 View of Scenario Input Variable Chart
50 BCA.Net Page-by-Page
BCA.Net - Highway Project Benefit-Cost Analysis System User's Manual
Scenario Chart - Overview
Clicking on “View” for a variable on the Scenario page will cause the scenario input
variable chart to pop up, showing a chart and data for the variable. The page
contains a chart, a summary statistics table, a percentiles table and option buttons for
selecting alternative chart types.
For a fixed value, the chart will display the message “No Chart for Fixed Value” and
the tables will reflect the information for the single, fixed value.
There are three chart types and each shows a shaded region that represents the 80%
confidence interval. A dotted red line marks the mean value of the distribution.
The x-axis on all the charts ranges between the values whose probabilities are 0.1
and 99.9 percent, respectively. The different chart types are selected using the
option buttons below the chart (click “Go” after making a selection).
Density/Cumul/De-Cumul option buttons
The selected option determines which of the three chart formats:
Probability density
Cumulative probability
De-cumulative probability
are displayed for the selected variable (see the Glossary for definitions ).
Summary statistics table
The summary statistics frame displays the mean, mode, and standard deviation of the
distribution. See the glossary for the definitions .
Percentiles
The percentiles frame displays the percentiles of the input distribution. A percentile
indicates the probability that the value of the input variable would fall below the
given value of the x-axis. For instance, in Figure 22, the chance that the sampled
input value of time for trucks (average all types) would fall below $20/hour is 90
percent, given the distribution specified by the users.
BCA.Net - Highway Project Benefit-Cost Analys is System User's Manual
BCA.Net Page-by-Page 51
9. Simulation Page
Figure 34 View of Simulation Page
Simulation - Overview
Use the Simulation page to set the simulation parameters and run a simulation (i.e.,
generate the BCA results). You should browse to this page only when you are ready
to conduct a simulation, that is, after having made all required modifications to data,
and after having selected the project, scenario and results file for the analysis.
Simulation - Features
Set the simulation parameters by clicking “Edit”, and click “Update” when finished
editing. The parameters that you set will be saved in the results set. If you run
subsequent simulations, the parameters you set will be saved and used as long as you
continue to use the same results set for your analysis.
About Simulation
BCA.Net uses simulation, or risk analysis, to generate BCA results and the
uncertainties associated with them. By specifying probability distributions for
scenario inputs (which is performed in the Scenario page), the users quantify their
variability and uncertainty. The impact of this uncertainty on the outcomes, as
reflected in the BCA.Net analytic model, is quantified using simulation.
With simulation, rather than solving the model once using "best guess" values for
inputs, BCA.Net solves the model for many independent trials. In each trial, a
random sample is taken from the distribution of each scenario input. Each trial
produces an outcome (e.g., a set of values for the result variables) based on the
sampled values from the input distributions . By applying statistical analysis to a set
of outcomes, BCA.Net derives descriptive statistics for each result variable. Thus,
for instance, BCA.Net will tell us not only "the answer is 50", but also that "with 90%
probability the answer lies between 30 and 75". As opposed to point estimates or
sensitivity analysis (where one variable is arbitrarily varied), risk analysis supports
better decisions by explicitly reporting the probability distributions of the results.
Also, see the section “About BCA.Net “in the Introduction.
The simulation parameters are discussed below.
52 BCA.Net Page-by-Page
BCA.Net - Highway Project Benefit-Cost Analysis System User's Manual
Trials Box
Enter the number of trials for the simulation. The number of trials is the number of
times that the program will sample from the scenario input distributions, solve the
model and generate results. More trials will yield more stable res ults and will take
more time to run. While a number of factors will determine the minimum number of
trials needed to achieve stable results, 500 trials will usually be adequate. You must
use at least three trials to run a simulation.
Recommended Practice: To save time, when testing your data and assumptions, use
a small number of trials (50 or less). After you are satisfied that you will make no
more changes to the data, and then run a simulation with a large number of trials to
arrive at your result.
If you wish to learn more on this subject, a good technical reference is "Latin
Hypercube sampling (A Program Users Guide)", by R.L. Iman J.M. Davenport and
D.K. Zeigler, Technical Report SAND79-1473, Sandia Laboratories, Albuquerque
(1980).
Random Seed Box (Note: this is an expert option)
The random seed determines the sequence of pseudo-random numbers that are
generated by the simulation engine. Any positive integer value will generate a
unique sequence of pseudo-random numbers for the simulation. Two simulations
with identical data, number of trials and random seed will generate identical results.
Changing the random seed is an expert option. You may want to change the random
seed to test the effects of the randomness of the sampling on the result distributions .
Sampling Method (Note: this is an expert option)
You can select from two sampling methods for the simulation : Latin hypercube and
Monte Carlo simulation. Latin hypercube is a stratified sampling method that
ensures that a relatively small number of trials will yield results that are widely
distributed, and not clustered, in the input variable sample space. This method is the
default and, in general, unless you have a special need for a “purely random”
sampling of inputs you should use this method.
“Run Central Values Only” Check Box
Check this box to run your model using only the central values. The reported results
will be point values without probability ranges. When this box is checked, the trials
box and random seed box are disabled. Note that, if the box is checked, the term
“True” will be displayed once the page is updated. If unchecked, the term “False” is
displayed.
Reallocate Peak Traffic If Speed Falls Below Minimum
Check Box
Check this box to direct BCA.Net to automatically reallocate traffic from the peak
traffic period to the shoulder traffic period if it determines that travel speed during
the peak period would drop below the minimum speed threshold that is specified in
the “Travel demand and traffic composition” data group of the Scenario page, which
was 10 MPH. If this box is not checked, BCA.Net will assume that all traffic in the
peak period gets through, but at an average speed that may be too low to represent
practical usage of the facility- thus possibly overstating delay.
BCA.Net - Highway Project Benefit-Cost Analys is System User's Manual
BCA.Net Page-by-Page 53
Risk Sensitivity Analysis Check Box
The risk sensitivity analysis, which is executed after the simulation , runs the
BCA.Net model with all the input variables except one set to their mean values. The
exception input variable is set to its 10 percent lower value and the model is solved.
This input variable is then set to its 10 percent upper value and the model is solved
again. This process is repeated for all input variables. The results of the sensitivity
analysis are displayed in the tornado chart, which is invoked from the Results page.
By leaving this box unchecked (the term “False” will show on the page when the
data grid is not in edit mode), your results file will not contain values for the tornado
chart.
10. Results Page
Figure 35 View of Simulation Page
Results - Overview
The results of a simulation are viewed in the Results page. When you browse to the
page, it displays the first results group. Note that the model will put the simulation
results in the particular Results file selected under the Manage page
(Manage>Views>Results). You can also create new results files and delete old files
under the Manage page.
When a simulation completes, the browser automatically redirects to this page.
The purpose of this page is to navigate, view, and print results and their associated
tables and graphics.
Results - Features
The Results page contains an extensive assortment of data on the findings of the
simulation, including summary data and graphics. These data and graphs provide
important data to decision-makers.
Result Group Pull Down List
Use this drop down list at the top of the page to select the results group to view. The
groups include the benefit-cost summary and breakouts by benefits and cost category
showing the base case, alternate case and net result for each project segment.
54 BCA.Net Page-by-Page
BCA.Net - Highway Project Benefit-Cost Analysis System User's Manual
BCA.Net presents the simulation results in a highly detailed format. This
presentation format can be very useful to the analyst because it allows the ready
identification of those aspects of a project that are or are not successful, and
especially those aspects of the project that are most subject to risks from real price
increases or future traffic growth. These data can be presented in report format and
used to inform decision-makers. Note that all dollar values in the Results page are
presented in terms of thousands of dollars of present value.
The following is a description of the major benefit categories summarized in the
Benefit-Cost Summary view of the Results page:
“Travel time savings” represents the difference in the value of travel time
incurred between the base and alternate cases. If the alternative case saves
travel time relative to the base case, the time saving value shown in this
view will be positive (meaning it is a benefit of the alternate case).
BCA.Net calculates travel time saving by comparing the speed and volume
of the traffic flow of the alternate case to that of the base case, factoring in
future traffic growth, design speeds, congestion levels, vehicle occupancy,
traffic peaks, and other data specified in the Strategies, Project, Scenario,
and Parameters pages.
“Vehicle operating cost savings” consist of the non-travel time cost changes
incurred by vehicle operators when traveling at higher or lower speeds; and
due to wear and tear on vehicles associated with different pavement
conditions. Pavement condition and deterioration rates are entered in the
Strategies>Views>Identifiers and Effects view. Although it is often
expected that a road improvement (as represented by the alternate case
relative to the base case) that saves travel time will also reduce vehicle
operating costs, this will not always be the case. For instance, a capacity
improvement that enables faster travel speeds on a road may reduce travel
time costs but lead to higher vehicle operating costs due to greater fuel
consumption and maintenance costs. In other cases , the improvement may
reduce these costs while also saving travel time if it relieves severe
congestion that results in inefficient vehicle operating speeds.
Note that the value of the time saving for a capacity project on an existing congested
roadway should generally exceed the absolute change in vehicle operating cost by a
significant margin. Particularly if the vehicle operating cost savings are very large in
absolute terms, the base and alternate cases should be studied carefully. Such
investigation may reveal that either the base case or the alternate case does not
include appropriate pavement maintenance strategies, leading to very low PSI values
for one or the other cases in out years and thus unrealistically high vehicle operating
costs.
BCA.Net calculates “Safety benefits” from estimated traffic volumes and the
“Crash Rate: Accidents per Million VMT” values provided for each
strategy under the Strategies>Views>Identifiers and Effects view. The
model currently uses hard-coded lookup values by which crash rates are
categorized into property damage only; minor injury; serious injury; and
fatal injury crashes. The model assigns severities based on accident type
categorizations (fatal, injury and property damage only). You specify the
valuation for each type of crash in the “Social Costs ” dropdown view of the
Scenarios page.
BCA.Net calculates “Environmental benefits” based on traffic volumes,
emission rates, and speeds. It applies speed-based emission rates (grams of
emission per mile) to segment average speeds and traffic volumes, adjusts
the emissions for time spent at traffic signals and devices , sums these
amounts for periods and days, and then multiplies the tonnage weight of
BCA.Net - Highway Project Benefit-Cost Analys is System User's Manual
BCA.Net Page-by-Page 55
each emission type by the per ton cost value specified in th e second screen
of the “Social Costs” view of the Scenario page. Please note that the default
per ton cost values in the Scenario view are set to zero, so no value will
show up under “Environmental benefits” unless you change the zero default
values.
56 BCA.Net Page-by-Page
“Project residual value” represents the total remaining value of non-land
assets of the alternate case at the end of the analysis period. You specify
the analysis period in the Manage>Views>Scenarios page for each scenario.
You specify the rate at which non-land assets are used up each year through
the “Rate of asset depreciation” variable of the “Social Costs ” view in the
Scenario page.
“Disbenefit of traffic disruption from construction” shows the net “work
disruption costs” of all strategies assumed in the alternate case relative to
those assumed for the base case. In the case of disruption costs that are
incurred in the analysis period, but which are associated with strategies that
remain in effect (i.e., have a residual value) after the analysis period ends,
BCA.Net assigns only a partial share of these disruption cos ts to the analysis
period. This partial assignment of costs is necessary to avoid biasing the
model results based purely on changing the length of the analysis period
(due to the lump sum nature of work disruption costs caused by strategies
that are implemented near the end of analysis periods). The work disruption
costs for each strategy can be manually entered or independently calculated
by the BCA.Net models in the Strategies>Views>Costs view.
“Total benefits” is the total present value of the transportation benefits of
the alternate case that are additional to the transportation benefits of the
base case. Transportation benefits are the collective savings in travel time,
vehicle operating costs, crash costs, environmental costs, residual values,
and user disruption costs . Note that some or all of the benefits in these
categories may be negative (i.e., disbenefits), and that the “Total Benefits”
could also be negative for some projects where the alternate case is clearly
inferior to the base case.
The category called “Of this, Benefits to new users” requires some
explanation. It will have a value only if you assigned a valu e to the
“Effective Elasticity of Demand” variable in the Scenario>Views>Travel
demand and traffic composition view. The “Effective Elasticity of
Demand” variable measures the percentage increase of traffic caused by
each one percent reduction in transportation costs caused by a project. In
particular, if a project reduces net travel cos ts (e.g., by reducing travel
time), then it is likely that more drivers will use the road than would have
had it not been improved by the project. The new users receive benefits in
the form of reduced transportation costs that are additional to benefits
realized by pre-existing users of the road. “Benefits to new users” indicates
the amount of “Total Benefits” (e.g., the line above “Benefits to new users”)
that are realized by new users. It is not additional to the “Total Benefits”
but rather is a subset of the total benefits of the project.
“Total costs” is the total present value of the resource expenditures to build
and operate the alternate case that are additional to the expenditures made
for the base case.
“Net benefits” is the difference between “Total Benefits” and “Total Costs ,”
representing the net present value of the alternate case relative to the base
case (see the glossary for more information on net present value). Note that
BCA.Net - Highway Project Benefit-Cost Analysis System User's Manual
this value can be either positive or negative. A positive value indicates that
the alternate case is economically efficient relative to the base case.
The “Benefit-cost ratio” is the ratio of “Total benefits” to “Total Costs .”
Ratios that exceed one indicate that the alternate case is economically
efficient relative to the base case. See the glossary for more information on
the benefit-cost ratio.
“Rate of return” is the estimated rate of return, or discount rate, that would
equate the present value of “Total benefits” to “Total costs .” Multiple
“Rate of return” values are possible if, during the analysis period, costs
exceed benefits in more than one year. The BCA.Net model, however, will
only display one of these values. Accordingly, rate of return data should be
used with caution.
In the dropdown menu in the Results page you will note that a number of cost
categories beneath the overall category of “Benefit-Cost Summary.” The categories,
which are subsets of the Summary, include the following:
User costs: travel time
User costs: fuel consumption
User costs: oil consumption
User costs: tire wear
User costs: maintenance and repair
User costs: depreciation (i.e., vehicle mileage-based depreciation)
User costs: safety
User costs: environmental (note that this includes costs to non-users as well)
Project costs.
Each of these cost subsets provides data on that cost category for both the base case
and alternate case, and well as the net difference between the cases .
“View” Link
Clicking on the “View” link for a variable causes the results chart page to pop up.
See Results Chart section below.
Results>Action>Generate and show reports
This action will generate two reports of the simulation results in Adobe Acrobat (pdf
file).
•
The “Highway Benefit-Cost Analysis Results” report presents the
distribution and summary statistics for all cost and benefit categories in the base and
alternate cases.
•
The “Annual Benefits and Costs” reports present relevant cost and benefit
categories in the base and alternate cases for each ten-year period of the analysis.
This report can only be generated when simulating with central values only and
disabling risk sensitivity analysis. This can be done by accessing the Simulation page
and checking the “Central values only box”, and leaving the “Run risk sensitivity
analysis” box unchecked.
BCA.Net - Highway Project Benefit-Cost Analys is System User's Manual
BCA.Net Page-by-Page 57
10.a Results Chart
Figure 36 View of Results Chart
Results Chart - Overview
When you click a “View” link on the results page, the results for the selected
variable are displayed in the Results Chart that pops up.
The variable’s risk analysis statistics are shown in the tables on the page as well as a
chart of the table values. Using the option buttons you can choose to display the
summary chart as a cumulative, de-cumulative, or histogram format. If in your
simulation you selected to run a risk sensitivity analysis, then you can also view a
tornado chart, which shows a ranking of input variables that were the most
significant contributors to the variance of the result.
Results Chart - Features
The analyst is accorded a high degree of choice in the type and appearance of charts
showing the results of probability and sensitivity analyses. The options available to
the analyst are described immediately below.
Number of Bins
The “Results Chart” displays probability outcome in the default form of a histogram
chart. Each vertical bar of the histogram chart is defined by the number of trial
outcomes that fall within a given range of values, called a “bin”. The default number
of bins is 20, but you may select any number of bins between 10 and 100 for the
histogram chart. Click “Refresh” after changing the number of bins (also see the
Glossary of this document for more information about bins).
Histogram/Cumul/De-Cumul/Tornado option buttons
As noted, when the “Results Chart” page opens it displays a histogram chart of the
selected variable with its values distributed into 20 probability bins. In the “Select
58 BCA.Net Page-by-Page
BCA.Net - Highway Project Benefit-Cost Analysis System User's Manual
chart type” feature of the “Results Chart”, you have the choice of chart formats other
than the histogram. You can toggle between the following four chart formats:
Histogram
Cumulative probability
De-cumulative probability
Tornado (option available only if the risk sensitivity option on the
Simulation page was selected when the simulation was run)
Each chart is displayed for the selected result variable (see the Gloss ary for
definitions).
Histogram
When you first click the “View” link, the histogram chart is displayed. Clicking the
Histogram option will display the chart again after you have browsed to another
chart type on the page.
Cumulative Probability Chart
The cumulative probability chart is displayed when you press the "Cumulative"
option button on the form.
De-cumulative Probability Chart
Choose the “De-cumul” option button to view the de-cumulative probability chart.
This chart shows the full range of values for the selected result and the probability of
exceeding each value in its range. More information about these chart formats in
included in the Glossary.
Tornado chart
An input variable contributes to risk by means of: a) its own variance, and, b) its
structural role in the BCA.Net model. For instance, an input variable with large
variance may not be a significant contributor to the risk of a result while an input
variable with small variance may cause the result to be very uncertain and risky.
Without the analysis of risk sensitivity, it is not easy to determine which factors are
the significant contributors to the risk associated with a particular result.
The tornado chart shows the impact of each random variable input factor when all
the other input factors are set to their mean values and the single input factor is
allowed to vary within its 80% confidence interval. The tornado chart displays in
order the ten input variables that are the major contributors to the risk of a result.
This analysis of sensitivity can guide the analyst to focus on refining the estimates on
the range of input variables that truly matter and help decisions -makers plan for
mitigating risks.
Click “Refresh” after making a selection.
BCA.Net - Highway Project Benefit-Cost Analys is System User's Manual
BCA.Net Page-by-Page 59
Glossary of Terms
Base Year
The base year is the year that precedes the start year of the period of analysis
selected for the project.
Benefit-Cost Ratio
The benefit-cost ratio is a measure of economic worth. It is the present value of the
project benefits divided by the present value of the project costs. The costs in the
denominator include only the net resource expenditures required to build or maintain
the highway infrastructure or otherwise provide highway services. All other effects
(i.e., user costs, environmental costs, disruption costs of construction) are captured in
the numerator of the benefit-cost ratio. If the benefit-cost ratio exceeds 1, then the
project passes the benefit-cost test.
The benefit-cost ratio is a good measure of “bang for the buck”, that is, benefits
received for public dollar expended. However, its use to prioritize projects for
funding should be undertaken carefully. In the case of projects or alternatives that
are mutually exclusive, a project with a lower benefit-cost ratio may yield greater net
benefit (i.e., higher NPV) and may be generally preferable than a project with a
higher benefit-cost ratio. More information on this is available in the FHWA’s
Economic Analysis Primer.
Bins
(This pertains to the risk analysis features of BCA.Net.) The range for a simulation
result variable, i.e., the values bounded by its minimum and maximu m values, is
divided into equal portions called bins. The result value from each trial "falls" into
one of these bins. Charting the result value's range on the horizontal axis and the
probability of a result value falling in each of the bins yields the histogram chart.
Case (Base and Alternate)
A case is a set of assumptions regarding the decision variables of an agency affecting
the provision of highway-related services. These decision variables will, in general,
include options of whether, what, and when to build. However, a case could
consider non-build management measures, like redirection of traffic or policies of
taxing or tolling.
A benefit-cost analysis calculates the total present value of the transportation benefits
and costs of the alternate case that are additional to the transportation benefits and
BCA.Net - Highway Project Benefit-Cost Analys is System User's Manual
Glossary of Terms 61
costs of the base case. A well-specified “base case” will, in most circumstances,
represent the set of maintenance and minor improvements that would most likely be
undertaken in lieu of a major investment. The “alternate case” will typically
represent an improvement involving a significant construction component.
In BCA.Net cases, base and alternate, are developed for each project segment in the
Project page (Project>View>Base case and alternative case) by selecting a strategy
and its year of implementation. A case may have more than o ne strategy. For
instance, an alternate case for a segment may involve rehabilitating the facility in
2007 and adding lanes in 2015.
Cumulative Probability Distribution
(This pertains to the risk analysis features of BCA.Net.) A cumulative probability
distribution is constructed by adding (or cumulating) the frequency of the probability
density function. A cumulative probability distribution is an "upwardly sloping"
curve, where each point on the curve gives the probability that the variable will be
equal to or less than the value on the x-axis. The y-axis of the cumulative probability
distribution ranges between 0 and 1. The cumulative probability distribution equals
zero for a variable's minimum value and rises to 1 at a variable's maximu m value.
De-Cumulative Probability Distribution
(This pertains to the risk analysis features of BCA.Net.) A de-cumulative probability
distribution is constructed by subtracting (or de-cumulating) a variable's probability
frequency starting with a probability of 1. A de-cumulative probability distribution
is a "downward sloping" curve, where the curve gives the probability of the variable
exceeding the value along the x-axis. The de-cumulative probability is 1 for a
variable's minimum value and is 0 for its maximu m value (i.e., the y -axis ranges
between 1 and 0).
Deterministic
The term deterministic indicates that there is no uncertainty attributed to a given
value, variable or model. Models that include random variables are called
probabilistic or stochastic.
Dollar Values
Dollar values in the model are constant, base year dollars (also called “real dollars”).
Present value dollars in the model are discounted to the end of the base year.
End Year
The end year is the last year of an analysis period. This is one of three years that the
user must set in the Scenario view of the Manage page.
For example, suppose the analysis period of a benefit-cost analysis was twenty-five
years and the near-term planning horizon was five years. If the start year is 2008,
then the respective years of the analysis in this example would be:
62 Glossary of Terms
BCA.Net - Highway Project Benefit-Cost Analysis System User's Manual
Start Year
Last Year Near Term
End Year
2008
2012
2032
For each segment of a project, the user sets the forecast levels of traffic and traffic
profiles for representative days in each of the three years. The base year for this
analysis would be 2007, the year before the start year of the period of analysis.
In the benefit-cost analysis with BCA.Net the effects of improvements and their
respective costs and benefits are measured in each year from the start year to the end
year, inclusive. Benefits and costs in the analysis are discounted to the beginning of
the start year (i.e., the end of the base year). The residual value of the project –
which is the depreciated value of capital improvements at the end of the end year – is
added to the benefit-cost summary as a benefit.
Histogram
(This pertains to the risk analysis features of BCA.Net.) A histogram shows the
frequency of a discrete random variable and is used to display the frequency
distribution of Monte Carlo simulation result variables. In a histogram, the result
values are gathered in bins and the height of the bars correspond to the frequency
with which values fall in the respective bins.
Kurtosis
(This pertains to the risk analysis features of BCA.Net.) Kurtosis is a statistical
measure of a distribution's peakedness. Flatter distributions (with thin tails) are
called platykurtic and peaked distributions (with fat tails) are called leptokurtic. The
formula for kurtosis is:
(x i x)4
n(n 1)
3(n 1)2
i
s4
(n 1)(n 2)(n 3)
(n 2)(n 3)
where x is the mean of the observations , s is the standard deviation, and n is the
number of observations.
Last Year Near-Term
The last year near-term is the last year of near-term planning. This is one of three
years that the user must set in the Scenario view of the Manage page.
For example, suppose the time horizon of a benefit-cost analysis was twenty-five
years and the near-term planning horizon was five years. If the start year is 2008,
then the respective years of the analysis in this example would be:
Start Year
Last Year Near Term
End Year
2008
2012
2032
In the benefit-cost analysis with BCA.Net the effects of improvements and their
respective costs and benefits are measured in each year from the start year to the end
year, inclusive. Benefits and costs in the analysis are discounted to the beginning of
the start year (i.e., the end of the base year).
BCA.Net - Highway Project Benefit-Cost Analys is System User's Manual
Glossary of Terms 63
For each segment of a project the user sets the forecast levels of traffic and traffic
profiles for representative days in each of the three years.
Latin Hypercube
(This pertains to the risk analysis features of BCA.Net.) Latin Hypercube is an
alternative statistical sampling method to the Monte Carlo method. This is a
stratified sampling method, which means that the range for each input variable is
divided into strata and one random s ample is taken from each stratum. This method
ensures that low probability events are sampled in the simulation. It enables faster
convergence to the result distribution than with the Monte Carlo sampling method.
Lower 10% Value
(This pertains to the risk analysis features of BCA.Net.) The lower 10% value is the
10th percentile value and is the lower limit of an 80% confidence interval as input by
the user.
Mean Value
(This pertains to the risk analysis features of BCA.Net.) The mean value for a
collection of observations of a random variable is its expected value and equals the
sum of the observations divided by the number of observations. For skewed
distributions, the mean value is off the median value and is located in the direction of
the distribution's skew.
Median Value
(This pertains to the risk analysis features of BCA.Net.) The median value is the 50th
percentile: there is equal probability that the value for a random variable will lie
above or below the median.
Mode
(This pertains to the risk analysis features of BCA.Net.) The mode of a probability
distribution is the value for which the probability density function is at a maximu m.
The value has the highest probability (and is sometimes called "the most likely
value", not to be confused with the mean or expected value).
Monte Carlo
(This pertains to the risk analysis features of BCA.Net.) Monte Carlo is the method
of sampling from random variables by taking a random number on the 0-1 interval ,
call it “a”, and finding the value of the random variable whose cumulative
probability equals a. Repeated Monte Carlo sampling on a number of random
variables that are inputs to a model and repeatedly solving the model to arrive at
probability distributions for the result variables is called Monte Carlo simulation.
Net Present Value
The net present value, NPV, of a project is the present value sum of benefits less the
present value sum of costs over the period of analysis. The net present value is the
64 Glossary of Terms
BCA.Net - Highway Project Benefit-Cost Analysis System User's Manual
principal measure of economic worth of a project. When NPV>0, the project passes
the benefit-cost test.
Period of Analysis
(This is also called the time horizon or analysis period in the documentation). The
period of analysis is the period during which the benefits and costs due to the effects
of changes to the road infrastructure or traffic flowing on it are measured and
compared. The period of analysis begins with the start year and ends with the end
year. There may also be construction during the base year (the year that immediately
precedes the start year) and these costs are included in the benefit-cost summary.
Present Value
The present value is a single number that expresses a future cost or benefit stream in
terms of an equivalent value realized in the present. The formula for the present
value is given as:
n
PV
vi
i 1 (1 dr)
i
where v i is a value in the ith year of the analysis, dr is the discount rate and n is the
number of years in the period of analysis.
Probability
(This pertains to the risk analysis features of BCA.Net.) Probability is the likelihood
of the occurrence of a value or event.
Probability Density Function
This is the same as probability distribution.
Probability Distribution
(This pertains to the risk analysis features of BCA.Net.) A probability distribution or
probability density function shows a continuous random variable's frequency of
occurrence over its range.
Project
A project is a collection of one or more segments that are to be improved. The
benefit-cost results summary aggregates the results from the segments in a project.
Random seed
(This pertains to the risk analysis features of BCA.Net.) The random seed is a
number that initializes the generation of random numbers used in a Monte Carlo (or
Latin Hypercube) simulation. For the same random seed and the same n umber of
trials given no change in the model or inputs, the results of two Monte Carlo
simulations will be identical.
BCA.Net - Highway Project Benefit-Cost Analys is System User's Manual
Glossary of Terms 65
Rate of Return
The project rate of return is an indicator of economic worth. The rate of return is
equal to the discount rate that if applied to the stream of net benefits, would yield a
net present value of 0. If the rate of return exceeds the discount rate, then the project
passes the benefit-cost test. The rate of return is useful in communicating benefitcost results to laymen, because the metric somewhat resembles the return on a
financial asset.
Some care is required in interpreting the rate of return, because in cases where the
stream of net benefits changes sign more than once (e.g., goes from negative to
positive and then back to negative), multiple rates of return may exist. This can
occur, for instance, if there are multi-phased investments in the period of analysis.
Risk
(This pertains to the risk analysis features of BCA.Net.) The term refers to measured
uncertainty in a forecast outcome. Colloquially, risk is often associated with
undesirable or downside outcomes (as in "hedging against risk"). In a risk analysis,
risk is reflected in the probability distributions of result variables.
Risk Analysis
Risk analysis is a term applied to several methods for quantifying uncertainty in
forecasts. The risk analysis methods used in BCA.Net are called Monte Carlo
simulation.
Scenario
A scenario is a collection of general data for use in the benefit-cost analysis. The
scenario variables are organized into several groups: travel demand and traffic
composition; social costs; project cost factors; prices; policy variables; and, non transportation benefits. Users can assign fixed values or probabilistic ranges to each
variable from the Scenario page. Probabilistic ranges are used as risk analysis
inputs in the benefit-cost analysis. The scenario definition, which is set on the
Manage page, includes the three analysis years: start year, last year near term and
last year.
Segment
A segment is a specific highway facility that is uniform with regard to: 1) its physical
and performance characteristics, and 2) traffic flowing on it. The data for a segment
include: base year characteristics (i.e., length, number of lanes, maximu m flow,
grade, etc.); traffic profiles for each of three years (start year, last year near term, last
year); and, a base and alternate case, each of which is a collection of
improvement/maintenance strategies and their respective years of implementation.
A project may consist of one or more segments.
Simulation
(This pertains to the risk analysis features of BCA.Net.) Simulation is a numeric
method for finding solutions to analytically complex problems by "simulating"
repeated, real world occurrences.
66 Glossary of Terms
BCA.Net - Highway Project Benefit-Cost Analysis System User's Manual
Skewness
(This pertains to the risk analysis features of BCA.Net.) Skewness is a measure of
the asymmetry of a distribution. The probability density function of a skewed
distribution has a longer tail on its skewed side. A right skewed distribution has
skewness greater than 0 and a left skewed distribution has skewness less than 0. The
formula for skewness is:
n
(n 1)(n 2)
( x
i
x) 3
i
s3
where x is the mean of the observations, s is the standard deviation and n is the
number of observations.
Standard deviation
(This pertains to the risk analys is features of BCA.Net.) The standard deviation,
which is the square root of the variance, is the principal descriptive statistic after the
mean value. Knowing only a distribution's mean value and standard deviation, an
upper bound can be found on the probability of any value in a variable's range. The
standard deviation reported for the results is the sample standard deviation, given by
the formula:
n x 2 x
n(n 1)
2
where n is the number of trials.
Start Year
The start year is the first year of an analysis. This is one of three years that the user
must set in the Scenario view of the Manage page.
For example, suppose the time horizon of a benefit-cost analysis was twenty-five
years and the near-term planning horizon was five years. If the start year is 2008,
then the respective years of the analysis in this example would be:
Start Year
Last Year Near Term
End Year
2008
2012
2032
For each segment of a project the user sets the forecast levels of traffic and traffic
profiles for representative days in each of the three years.
The start year is the first year in which an analysis may register differences between
the base and the alternate cases. The start year is the year following the base year for
the analysis. In the benefit-cost analysis with BCA.Net the effects of improvements
and their respective costs and benefits are measured in each year from the start year
to the end year, inclusive. Benefits and costs in the analysis are discounted to the
beginning of the start year (which is equivalent to the end of the base year).
Strategy
A strategy is an improvement or maintenance program. Strategies are referenced in
the base and alternate cases of project segments. In BCA.Net, a strategy is
BCA.Net - Highway Project Benefit-Cost Analys is System User's Manual
Glossary of Terms 67
independent of a project and can be deployed in more than one project or project
segment.
There are three components to a strategy: effects; traffic signals and devices; and,
costs. The effects of a strategy are the target facility characteristics (i.e., maximu m
flow, number of lanes, improved pavement condition, etc.) that result from an
improvement (or, represent the presumed facility status under a specified
maintenance regime).
The costs of a strategy include a multi-year cost schedule that specifies: right-of-way
(ROW) costs; capital improvement costs; and, anticipated costs of disruption due to
construction. The multi-year cost schedule begins at Year 1 and can extend up to
Year 7. Year 1 of the multi-year schedule is the year of implementation that is
specified in the project segment case that deploys the strategy. Strategy costs also
include an annual “O&M” cost and “other lifecycle” cost.
Strategy costs (ROW, Capital, Disruption, O&M and Other Lifecycle) are in
thousands of constant base year dollars. When specifying costs, the user can specify
the cost units as one of the following: total costs for the segment, costs per facilitymile, or costs per lane-mile.
An investment strategy is one that has non-zero capital costs in at least one year.
The effects of an investment strategy are realized in the year following t he last year
of non-zero investment. From the year in which strategy effects are realized, “O&M
Costs” and “Other Lifecyle Costs” recur in each year. These costs replace the costs
from the base year facility characteristics or from strategies implemented in the case
in previous years. Care should be taken to assure that the base year facility
characteristics data are compatible with the data specified for O&M Costs and Other
Lifecycle Costs” in the strategies.
The effects associated with a non-investment strategy are immediate in the year of
implementation. “O&M Costs” and “Other Lifecycle Costs” recur in each year from
the year of implementation. These costs replace the costs from the base year facility
characteristics or from strategies implemented in previous years.
Traffic Distribution
The traffic distribution describes the intensity of traffic during three different periods
of the day: Peak, peak shoulder and off-peak. The traffic distribution specifies the
percent of daily traffic per hour in each period (the user specifies the peak and peak
shoulder while the off-peak is calculated as the remaining traffic). Additionally, the
traffic distribution includes a specification of the percent of traffic in the direction of
greater flow – a value between 50 and 100. The traffic distributions are specified in
the Parameters page of BCA.Net.
Traffic Profile
A traffic profile describes a representative day of traffic on a segment for each of the
three years – start year, last year near-term and end year. A segment may have one
or several traffic profiles, depending on whether traffic varies by time of week (e.g.,
weekday vs. weekend) or time of year (e.g., tourist season).
For each year, the traffic profile includes a percent of total days in the year an d, a
percent of annual traffic. If there is only one traffic profile for the segment, then
these values must equal 100 for that profile. If there are several traffic profiles in a
segment, then the sum of the percent of total days and the percent of annu al traffic
must each sum to 100. Traffic profiles are specified in the Project page of BCA.Net.
68 Glossary of Terms
BCA.Net - Highway Project Benefit-Cost Analysis System User's Manual
The traffic profile also specifies the duration of each of the travel periods, peak and
peak shoulder, in hours. For each of the three vehicle types (auto, truck, bus) the
user specifies the traffic distribution for each.
Note that daily traffic profiles are converted to annual traffic levels in the by means
of the “Annualization Factor”, which is specified in the “Travel demand and travel
composition” data group on the Scenario page.
Trial
(This pertains to the risk analysis features of BCA.Net.) A trial is one solution of a
model in a simulation. A simulation consists of many trials. In each trial, every
input variable is populated with a data value sampled from the variable's probability
distribution.
Upper 10% Value
(This pertains to the risk analysis features of BCA.Net.) The upper 10% value is the
90th percentile of a probability distribution and the upper limit of an 80% confidence
interval.
Variable
(This pertains to the risk analysis features of BCA.Net.) A variable is a model
element that can be assigned more than one value. A fixed-value input variable can
assume only one value. A random variable can assume a range of values according
to its probability distribution.
Variance
(This pertains to the risk analysis features of BCA.Net.) The variance is a measure of
the dispersion of values in a probability distribution, and is a measure of risk. The
variance is the average of the squared deviations about the mean. The variance gives
disproportionate weight to "outliers," values that are far away from the mean. The
variance is the square of the standard deviation.
BCA.Net - Highway Project Benefit-Cost Analys is System User's Manual
Glossary of Terms 69
distributions 2, 5, 8, 9, 10, 23, 24, 26, 27, 28, 33, 34,
35, 36, 37, 38, 43, 44, 45, 46, 47, 49, 50, 52, 53,
55, 56
Distributions 2, 8, 10, 37, 43, 44, 46, 47, 49, 50, 52, 53
Index
E
economic 1, 47, 49
elasticity 47
emissions 48, 55
F
A
AADT 33, 34, 36
AASHTO 24
alternate case 23, 28, 30, 31, 33, 34, 35, 38, 39, 41, 54,
55, 56, 57
average delay 26, 44
B
base case 9, 10, 34, 39, 41, 54, 55, 56, 57
benefit-cost 1, 2, 7, 10, 23, 27, 30, 35, 46, 54, 57
benefit-cost ratio 57
net present value 56
rate of return 57
summary 1, 50, 51, 54, 58
benefit-cost ratio 57
C
capital costs 28, 31
case
alternate case 23, 28, 30, 31, 33, 34, 35, 38, 39, 41,
54, 55, 56, 57
base case 9, 10, 34, 39, 41, 54, 55, 56, 57
chart
histogram 58, 59
tornado 54, 58, 59
crash rate 55
facility type 24, 29
FHWA 1, 2, 4, 15, 16, 48
flow rate 23
I
intersection/interchange 9, 10, 43
intersections/interchanges 30
ISIC 9, 10, 30, 31, 32, 39, 40, 41, 42, 43, 44
ISIC Strategy Page
costs 23, 27, 28, 29, 30, 31, 48, 55, 56, 57
definitions 19, 23, 32, 41, 43, 51, 59
ISIC type 9, 10, 30, 31, 32, 40, 41, 43, 44
L
lanes 9, 23, 24, 30
Latin Hypercube 53
login 15, 16
M
manage 1, 7, 17
Monte Carlo 53
N
normal 50
Normal 50
P
D
dataset 6, 9, 10, 17, 18, 19, 21, 29, 31, 44, 45
default 18, 19, 21, 35, 38, 48, 53, 56, 58
default values 21, 48, 56
demand 47, 53, 56
depreciation rate 48
device 5, 25, 26, 27, 38
direction of greater flow 44
discount rate 48, 57
discounting 2
disruption costs 48, 56
parameters 10, 30, 43, 44, 52
Pavement Deterioration Rate 24
Pavement Serviceability Index 24, 39
peak 5, 8, 9, 10, 23, 24, 26, 27, 28, 33, 34, 35, 36, 37,
38, 43, 44, 45, 46, 47, 50, 53, 55, 56
peak period 41, 47, 53
peak shoulder 5, 8, 9, 10, 23, 24, 26, 27, 28, 33, 34, 35,
36, 37, 38, 43, 44, 45, 46, 47, 53, 55, 56
peak shoulder period 37
Perc. Eff. Green 26
percent effective green 26, 28
BCA.Net - Highway Project Benefit-Cost Analys is System User's Manual
Index 71
percentile 49, 50, 51
period of analysis 33, 34, 41
base year 24, 33, 34, 36, 38, 40, 41, 42, 48
end year 9, 33, 34, 37
last year 9, 28, 31, 33, 34, 37
last year near term 33, 34, 37
start year 9, 33, 34, 37, 38
profiles 5, 8, 9, 10, 23, 24, 26, 27, 28, 33, 34, 35, 36,
37, 38, 43, 44, 45, 46, 47, 53, 55, 56
project 1, 9, 10, 17, 18, 19, 21, 23, 29, 30, 31, 33, 34,
35, 38, 39, 40, 41, 44, 47, 48, 52, 54, 55, 56
project costs 48
capital costs 28, 31
disruption costs 48, 56
Project ISICs Page
Cases 1, 3, 9, 10, 23, 30, 33, 34, 35, 38, 39, 41, 46,
55, 57
Identifiers 23, 24, 28, 29, 30, 31, 55
Project Page
cases 1, 3, 34, 35, 39, 41, 46, 55, 57
signals and devices 25, 34, 35, 36, 38, 55
traffic characteristics 33, 34, 35, 41
Project Segments Page
cases 1, 3, 9, 10, 23, 30, 33, 34, 35, 38, 39, 41, 46, 55,
57
signals and devices 25, 34, 35, 36, 38, 55
traffic characteristics 33, 34, 35
PSI 24, 39, 55
costs 1, 2, 9, 10, 27, 31, 33, 34, 37, 39, 41, 46, 47, 48,
55, 56, 57
signals and devices 25, 34, 35, 36, 38, 55
signal 25, 26, 27, 38
simulation 10, 39, 49, 52, 53, 54, 55, 58, 59
social costs 46
strategy 23, 24, 27, 28, 29, 30, 31, 32, 33, 34, 39, 41,
43, 55, 56
Strategy Page
costs 1, 2, 9, 10, 27, 31, 33, 34, 37, 39, 41, 47, 48, 55,
56, 57
signals and devices 25, 34, 35, 36, 38, 55
summary 1, 50, 51, 54, 58
T
tax 48
traffic
traffic characteristics 33, 34, 35, 41
traffic distributions 8, 10, 37, 43, 47
traffic profiles 33, 34, 37, 38, 44
traffic characteristics 33, 34, 35, 41
traffic distributions 8, 10, 37, 43, 47
traffic profiles 33, 34, 37, 38
trial 52, 58
triangle 50
Triangle 50
U
R
random seed 53
rate of return 57
registration 16
residual value 48, 49, 56
results set 10, 17, 18, 19, 21, 52
reversible 24
right-of-way 27, 31
risk analysis 2, 49, 52, 58
Latin Hypercube 53
Monte Carlo 53
simulation 10, 39, 49, 52, 53, 54, 55, 58, 59
trial 52, 58
uniform 9, 49
Uniform 9, 49
user costs 27, 31, 37, 47, 48
emissions 48, 55
safety 47, 57
travel time 30, 44, 47, 48, 55, 56, 57
vehicle operating costs 55, 56
S
safety 47, 57
scenario 9, 17, 18, 19, 21, 33, 34, 36, 41, 46, 47, 49, 51,
52, 53, 56
Scenario Page
data group 47, 49, 53
social costs 46
segment 9, 23, 24, 26, 29, 31, 33, 34, 35, 37, 38, 39, 40,
41, 42, 44, 45, 54, 55
Segment Strategy Page
72 Index
BCA.Net - Highway Project Benefit-Cost Analysis System User's Manual