1
BHP Billiton Worsley Alumina Pty Ltd
Final Internship
Report [2010]
Ricardo Batista 30494044
A report submitted to the School of Engineering and
Energy, Murdoch University in partial fulfilment of
the requirements for the degree of Bachelor of
Engineering
Abstract
Murdoch University and BHP Billiton Worsley Alumina have a long standing relationship, in
which a selection of students in their final year of engineering study have the opportunity to
complete a six month internship program at the Alumina refinery situated near Collie, Western
Australia. The internship program allows the student to partake in a number of engineering
projects, providing the student with invaluable experience, as well as the opportunity to
develop both personally and professionally.
This report details the projects in which the intern was involved during his time at BHP Billiton
Worsley Alumina, and includes the following:
•
FieldBus Training System
•
HMI Design for Condensate Polishing Plant Trains
•
Control Loop tuning through TuneWizard Software
•
Powerhouse BMS/SCADA Database Update Project
•
C200 SIIOP Control Module reprogramming and Interlock Plan
•
Uticor Display and HMI development
Additionally this report will confirm the benefits of the internship program at BHP Billiton
Worsley Alumina, which has not only been an exceptional learning experience for the intern,
but has also given him a significant base on which to build his professional engineering career.
I
Disclaimer
All of the work discussed in this report is the work of the author unless otherwise referenced.
I declare the following to be my own work, unless otherwise referenced, as defined by
Murdoch University’s policy on plagiarism.
…………………………………..
Ricardo Batista
November 2010
II
Acknowledgements
First I would like to thank BHP Billiton Worsley Alumina Pty Ltd for the opportunity to
undertake an engineering internship within their Process Control department, an opportunity
which has opened my eyes to the real world of engineering and from which I have learnt a
great deal.
I owe my deepest gratitude to my project supervisors, Syed Hussain, Ben Marler, Gerhard
Oosthuizen, George Boaden and Vishwesh Soni, whose assistance and guidance have allowed
me to progress through the challenges set forth by my projects. Furthermore, I would like to
extend my appreciation to the entire Process Control department, as they have taken the time
to assist me when required, and have also made my time at the refinery both interesting and
enjoyable.
I would like to show my admiration to Arnold Oliver, Superintendant of Process Control, as
well as Senior Process Control Engineers Angelo D’Agostino, Rob Duggan and Manoj Tupkari,
whose interest and time devoted to professional development have assisted me in developing
my report writing and presentation skills.
I would also like to acknowledge all of the staff at Murdoch University who have taught me
over the years, particularly Associate Professor Graeme Cole and Professor Parisa Bahri, whose
passion for teaching and excellence has played a significant role in my academic and
professional successes.
I would like to thank my friends and family for their encouragement and support, recognizing
that moments of relaxation and enjoyment have played an important part in my ability to
succeed.
Finally, I would like to thank my parents for a lifetime of love and support. They have taught
me the most important lessons in life, and I owe all of my achievements to them.
Ricardo Batista
November 2010
III
Table of Contents
Abstract .......................................................................................................................................... I
Disclaimer...................................................................................................................................... II
Acknowledgements...................................................................................................................... III
Table of Figures ........................................................................................................................... VII
1
Introduction .......................................................................................................................... 1
2
Bayer Process at Worsley Alumina Pty Ltd ........................................................................... 2
2.1
2.1.1
Bauxite Grinding (Facility 024) .............................................................................. 2
2.1.2
Desilication (Facility 026) ...................................................................................... 3
2.1.3
Digestion (Facility 030) .......................................................................................... 3
2.2
Area 2 ............................................................................................................................ 4
2.2.1
Flocculent mixing and storage (Facility 032)......................................................... 4
2.2.2
Clarification and Causticisation (Facility 033) ....................................................... 4
2.2.3
Bauxite Residue Filtration (Facility 034) ............................................................... 5
2.2.4
Green Liquor (Polishing) Filtration (Facility 035) .................................................. 5
2.3
Area 3 ............................................................................................................................ 7
2.3.1
Heat Interchange (Facility 041) ............................................................................. 7
2.3.2
Precipitation and Heat Interchange Flash Cooling (Facility 045) .......................... 7
2.3.3
Seed Separation, Filtration and Hydrate Classification (Facility 046) ................... 9
2.3.4
Evaporator (Facility 040) ....................................................................................... 9
2.3.5
Water Treatment and Storage Plant (Facility 180) ............................................... 9
2.4
Area 4 .......................................................................................................................... 10
2.4.1
Liquor Purification and Oxalate Removal (Facility 043) ...................................... 10
2.4.2
Alumina Hydrate Filtration, Washing and Calcination (Facility 050) .................. 11
2.4.3
Liquor Burning Plant (Facility 044) ...................................................................... 11
2.5
3
Area 1 ............................................................................................................................ 2
Powerhouse ................................................................................................................ 12
Fieldbus training system ..................................................................................................... 13
3.1
Introduction ................................................................................................................ 13
3.2
Objectives.................................................................................................................... 13
3.3
Fieldbus ....................................................................................................................... 13
3.3.1
Description .......................................................................................................... 13
3.3.2
Advantages.......................................................................................................... 15
3.3.3
Series C Fieldbus Instrument Module ................................................................. 15
IV
4
5
6
3.4
Time management ...................................................................................................... 16
3.5
Method ....................................................................................................................... 16
3.6
Problems ..................................................................................................................... 17
3.7
Summary of results ..................................................................................................... 17
3.8
Conclusion ................................................................................................................... 19
HMI Design for Condensate Polishing Plant Trains............................................................. 20
4.1
Introduction ................................................................................................................ 20
4.2
Time management ...................................................................................................... 20
4.3
Software ...................................................................................................................... 21
4.4
Operator interface guidelines ..................................................................................... 21
4.4.1
Introduction and background ............................................................................. 21
4.4.2
Structure and Types of display ............................................................................ 21
4.4.3
Display Format .................................................................................................... 27
4.4.4
Alarm Colours...................................................................................................... 30
4.5
Problems encountered ............................................................................................... 30
4.6
Summary of Results .................................................................................................... 32
Control Loop tuning through TuneWizard Software .......................................................... 33
5.1
Introduction ................................................................................................................ 33
5.2
Objective ..................................................................................................................... 33
5.3
Time management ...................................................................................................... 33
5.4
Software ...................................................................................................................... 34
5.5
Hysteresis .................................................................................................................... 34
5.6
Stiction ........................................................................................................................ 35
5.7
Step Test...................................................................................................................... 36
5.8
Tuning ......................................................................................................................... 37
5.9
Problems encountered ............................................................................................... 39
5.10
Results ......................................................................................................................... 40
5.11
Conclusion ................................................................................................................... 40
Powerhouse BMS/SCADA Database Update Project .......................................................... 41
6.1
Project background ..................................................................................................... 41
6.2
Problem ....................................................................................................................... 41
6.3
Objective ..................................................................................................................... 42
6.4
Progress....................................................................................................................... 42
6.5
Time management ...................................................................................................... 44
6.6
Progress....................................................................................................................... 44
V
7
C200 SIIOP Control Module reprogramming and Interlock Plan ........................................ 45
7.1
Introduction ................................................................................................................ 45
7.2
Programming: Array Method ...................................................................................... 45
7.3
Communication Path .................................................................................................. 46
7.4
Interlock Plan .............................................................................................................. 48
7.4.1
Testing Method ................................................................................................... 48
7.4.2
PLC Coil identification ......................................................................................... 48
7.5
Problems encountered ............................................................................................... 49
7.6
Time management ...................................................................................................... 50
7.7
Progress....................................................................................................................... 50
8
Uticor Display and HMI development ................................................................................. 51
8.1
Introduction ................................................................................................................ 51
8.2
Uticor and C300 masters............................................................................................. 51
8.3
Power Panel Software ................................................................................................. 52
8.4
Design.......................................................................................................................... 52
8.4.1
Displayed information......................................................................................... 53
8.5
Problems encountered ............................................................................................... 55
8.6
Progress....................................................................................................................... 55
9
Internship Time Management ............................................................................................ 56
10
Internship Review ........................................................................................................... 57
11
Conclusion ....................................................................................................................... 58
12
Bibliography .................................................................................................................... 59
Appendix 1 .................................................................................................................................. 60
Literature Review ........................................................................................................................ 60
Appendix 2 .................................................................................................................................. 63
Condensate Polishing Plant HMI Visual Basic Code and Graphic ........................................... 63
Appendix 3 ..................................................................................................................................... I
Appendix 3 .................................................................................................................................. 82
Industry and Academic Supervisor endorsement pro forma ................................................. 82
VI
Table of Figures
Figure 1: Facility 024 Mill Circuit ................................................................................................... 3
Figure 2: Area 2 Flow Diagram ...................................................................................................... 6
Figure 3: Heat interchange flow diagram ..................................................................................... 7
Figure 4: Mechanically agitated Agglomerators ........................................................................... 8
Figure 5: Precipitators ................................................................................................................... 8
Figure 6: Facility (050) Calcination .............................................................................................. 11
Figure 4: Fieldbus Instrument Module (FIM) .............................................................................. 15
Figure 5: Physical Wiring between C300 and Fieldbus instruments ........................................... 18
Figure 6: FTE communication between C300 controllers and FIMs ........................................... 19
Figure 7: Flat display hierarchy ................................................................................................... 22
Figure 8: A typical four level display hierarchy ........................................................................... 22
Figure 9: Typical Level 1 Display ................................................................................................. 23
Figure 10: Layout of level Displays .............................................................................................. 24
Figure 11: Typical Level 2 Display ............................................................................................... 25
Figure 12: Typical Level 3 Display ............................................................................................... 26
Figure 13: Typical Level 4 Display ............................................................................................... 27
Figure 14: Analog presentation style .......................................................................................... 28
Figure 15: Cluttered display ........................................................................................................ 28
Figure 16: Well organised display ............................................................................................... 29
Figure 17: Hysteresis tab within TuneWizard ............................................................................. 35
Figure 18: Typical stick-slip cycle ................................................................................................ 36
Figure 19: Closed loop step test data ......................................................................................... 37
Figure 20: Simulated open loop step test ................................................................................... 38
Figure 21: Recommended disturbance rejection parameters .................................................... 39
Figure 22: Operator graphic with no description ....................................................................... 41
Figure 23: Classification of state descriptors .............................................................................. 43
Figure 24: Array Method of communicating information .......................................................... 46
Figure 25: Communication path between C200 and Quantum PLC ........................................... 47
Figure 26: Forcing output coils during input coil testing ............................................................ 48
Figure 27: Uticor Power Panel displays....................................................................................... 51
Figure 28: Communication between Uticor and C300 with the use of a Prosoft device............ 52
Figure 29: Custom bitmap files ................................................................................................... 53
Figure 30: Information and layout of running mill circuits on Plantscape ................................. 54
VII
1 Introduction
The purpose of this report is to detail the reader into the activity of the intern during his
employment as a Process Control intern between August 2010 and December 2010. The
internship took place at BHP Billiton Worsley Alumina Pty Ltd, situated near Collie, Western
Australia.
The projects that will be discussed include the following:
•
FieldBus Training System
•
HMI Design for Condensate Polishing Plant Trains
•
Control Loop tuning through TuneWizard Software
•
Powerhouse BMS/SCADA Database Update Project
•
C200 SIIOP Control Module reprogramming and Interlock Plan
•
Uticor Display and HMI development
Additionally this report will discuss the general operations of the refinery, as well as the time
management strategies implemented by the intern for each project.
1
2 Bayer Process at Worsley Alumina Pty Ltd
The process used by BHP Billiton Worsley Alumina Pty Ltd to extract Alumina from Bauxite
using a hot Caustic solution is known as the Bayer Process. It is named after the German
chemist Karl Bayer who discovered its function, and can be split into 4 steps as follows:
1.
Digestion
2.
Clarification
3.
Precipitation
4.
Calcination
The discussion to follow will include a brief description into how each of these steps occurs at
BHP Billiton Worsley Alumina Pty Ltd.
2.1 Area 1
Area 1 is responsible for the process known as digestion, which is the method of dissolving
Alumina out of the Bauxite ore into a hot Caustic soda solution. The three stages within Area 1
consist of Bauxite Grinding, Desilication and lastly Digestion.
2.1.1
Bauxite Grinding (Facility 024)
Bauxite is taken from the raw materials stockpiles and transferred to the bauxite feed bins
through the use of a bucket wheel reclaimer and conveyer. There are four mill circuits, each
consisting of a rod mill, ball mill, Dutch State Mines (DSM) screens, dust collectors as well as
feed pumps. The purpose of the Bauxite grinding stage is to grind the bauxite ore from about
22 mm down to a final size of less than 1.2 mm in order to prepare the ore for the Desilication
stage (BHP Billiton Worsley Alumina Pty Ltd, 2003). The Bauxite ore is mixed with spent liquor
(Caustic solution) to create slurry consisting of an estimated 46% solids, which is then passed
through the milling circuit. Once the slurry has travelled through the necessary grinding stages
and is smaller than 1.2 mm in size, it will then be free to pass through the DSM screens and
move onto the Desilication stage (BHP Billiton Worsley Alumina Pty Ltd, 2003). A flow diagram
of this facility is shown is Figure 1 below.
2
Figure 1: Facility 024 Mill Circuit
(BHP Billiton Worsley Alumina Pty Ltd, 2003)
2.1.2
Desilication (Facility 026)
The Desilication process is necessary in order to remove the reactive Silica content within the
ground Bauxite and Caustic Soda slurry. The treatment of reactive Silica is essential as the Silica
begins to form a hard coating that not only contaminates the Alumina product, but also
restricts the flow through the tubing within the heaters. Within the Desilication facility the
slurry is heated to 98oC for six to seven hours through the use of steam at 450 kPa, and is then
passed through a line of 3 recirculating tanks and splitter boxes (BHP Billiton Worsley Alumina
Pty Ltd, 2003). The output of the final tank is pumped to the Digestion trains for the next stage
in the process.
2.1.3
Digestion (Facility 030)
The main purpose of the Digestion facility is to dissolve the ground Bauxite and Caustic liquor
in order to make an Alumina-rich solution. Once the reactive silica has been converted to
Desilicated product (DSP) it is sent to the Digester Feed tanks, where the slurry and spent
liquor are mixed in proper quantities calculated by the laboratory to ensure the correct
Alumina to Caustic ratio at the end of the Digestion process. The slurry is then pumped
through a line of slurry heaters and finally an Indirect Steam Heater (ISH) in order to increase
the slurry’s temperature and aid in dissolving the contained Alumina (BHP Billiton Worsley
Alumina Pty Ltd, 2003). This heated slurry then spends roughly 20 minutes in the Digester at
which point the slurry has the following chemical composition:
3
NaOH
+
Al(OH)3
→
Na Al (OH)4
Sodium Hydroxide
(Caustic liquor)
+
Aluminium Hydrate
(in the Bauxite)
→
Sodium Aluminate
(in solution)
Equation 1: Chemical composition of slurry after digestion
Once the slurry has left the Digester, it travels through the line of flash vessels in order to cool
the slurry to about 107oC and is referred to as Digester Blow-off (DBO).
2.2 Area 2
The principal function of Area 2 is to separate the mud from the DBO in order to produce a
clarified, Caustic soda solution which is rich in dissolved Alumina. Area 2 is also responsible for
the process of washing and recovering caustic from the settlers.
2.2.1
Flocculent mixing and storage (Facility 032)
The purpose of facility 032 is to receive, mix and store flocculent powders, a substance used as
a settling agent in the removal of Bauxite residue from the slurry. The two types of flocculants
that are used within the refinery are Liquid and Powder synthetic Flocculent and Natural
Flocculent, which is also known as starch flour (BHP Billiton Worsley Alumina Pty Ltd, 2003).
2.2.2
Clarification and Causticisation (Facility 033)
The clarification facility consists of settling tanks which are used to separate the alumina-rich
liquor from the bauxite residue with the aid of flocculants. This bauxite residue is then washed
and released to the bauxite residue disposal areas (BRDA’s). The digester blow off slurry (DBO)
is pumped to one of five settlers at about 105°C and mixed with flocculent, allowing the
Bauxite residue to settle at the bottom of the settler tanks. The overflow from the settling
tanks is the alumina-enriched liquor, which has been clarified of all except the fine particles of
Bauxite residue (BHP Billiton Worsley Alumina Pty Ltd, 2003). This overflow is then sent to
continuously agitated overflow tanks, and finally to the green liquor polishing facility for the
removal of the finer Bauxite particles.
The underflow of the settling tanks is commonly called mud, and is pumped to continuously
agitated cyclone feed tanks, followed by deep cone washers and finally through the
hydrocyclones. It is in the hydrocyclones where the course sand particles of the slurry are
4
removed and sent to facility 034. Counter Current Decantation (CCD) circuits are used for
further washing of the mud.
The wash liquor that moves counter current to the mud in the CCD circuit gains Caustic
concentration as it flows towards the first washer. Some of this Caustic is in free form and is
capable of dissolving Alumina, but some of the Caustic soda has converted to Sodium
carbonate as it has reacted with Carbon dioxide in the air. Causticisation is a process that
occurs in Area 2, which converts Sodium carbonate back to caustic soda using slaked lime (BHP
Billiton Worsley Alumina Pty Ltd, 2003). The chemical equation for this reaction is below, and
the reaction takes place at approximately 102°C.
Na2CO3
+
Ca(OH)2
→
2NaOH+CaCO3
Sodium carbonate
+
Calcium hydroxide
→
Sodium
hydroxide+Calcium
carbonate
Equation 2: Equation for the production of Sodium hydroxide and Calcium carbonate
2.2.3
Bauxite Residue Filtration (Facility 034)
Facility 034 is used to retrieve Caustic soda from the hydrocyclone underflows through the use
of multi-stage sands spiral classifiers. During the operation of these classifiers, the sand slurry
is conveyed up an incline which allows the liquor to run down the slope to an overflow
launder. In the first stage, the classifier deliquors the sand and it travels into the next stage
classifier, where it is also washed with dirty condensate supplied from Area 1. After the sand
has been washed several times, it then falls through a chute to the red mud relay tank. This
mud is eventually pumped to the suction of the Geho pumps, and then pumped to the Bauxite
Residue Disposal Area (BHP Billiton Worsley Alumina Pty Ltd, 2003).
2.2.4
Green Liquor (Polishing) Filtration (Facility 035)
The filtering or polishing that occurs in Facility 035 is the last component of Area 2, separation
of fine Bauxite residue from Alumina hydrate. This occurs through the use of polishing filters
and Tri-Calcium Aluminate, which aids in the filtration process by creating a permeable filter
cake allowing slurry to be filtered at high flow rates and for longer periods (BHP Billiton
Worsley Alumina Pty Ltd, 2003). A complete flow diagram of Area 2 is illustrated in Figure 2.
5
Figure 2: Area 2 Flow Diagram
(BHP Billiton Worsley Alumina Pty Ltd, 2003)
6
2.3 Area 3
Area 3 houses the precipitation stage of the Bayer Process, and its primary purpose is to
produce aluminium hydrate crystals. Area 3 is also used for the removal of excess water from
spent liquor, as well as the operation of the water treatment plant.
2.3.1
Heat Interchange (Facility 041)
Facility 041 is a Heat Interchange facility, with the main purpose of cooling the Clear filtrate
from approximately 103°C to around 83°C, as well as increasing the temperature of the spent
liquor from 60° to 80° C. This heat transfer is made possible through the use of plate heat
exchangers (BHP Billiton Worsley Alumina Pty Ltd, 2003).
2.3.2
Precipitation and Heat Interchange Flash Cooling (Facility 045)
Facility 045 is responsible for agglomeration and precipitation, which is the third stage of the
Bayer Process in which the Alumina is precipitated out of the green liquor. There are 2 trains in
this facility, each consisting of 5 Agglomeration Precipitators, and a third train which consists
of 3 agglomeration precipitators. The method used for agglomeration involves mixing clean
seed with the saturated green liquor, and allowing the particles to clump and group together.
This process is aided by the presence of Aluminium hydrate crystals, which draw the hydrate
out of the solution in order to attach onto the seeds and begin to form clusters of small
crystals (BHP Billiton Worsley Alumina Pty Ltd, 2003).
Figure 3: Heat interchange flow diagram
(BHP Billiton Worsley Alumina Pty Ltd, 2003)
7
Figure 4: Mechanically agitated Agglomerators
(BHP Billiton Worsley Alumina Pty Ltd, 2003)
Figure 5: Precipitators
(BHP Billiton Worsley Alumina Pty Ltd, 2003)
8
2.3.3
Seed Separation, Filtration and Hydrate Classification (Facility 046)
Hydrate classification is also housed within Facility 046, and consists of a product system and a
seed system. The product system includes product cyclones which are fed tangentially by the
aluminium hydrate crystals. The seed system includes the fine seed tank and the seed cyclone
feed tank, as well as the seed cyclones.
The three main processes which occur within Facility 046 include seed separation, filtration
and hydrate classification. Seed separation occurs within fine and course seed thickeners, and
is a method which is used to separate the Aluminium hydrate seed and the spent liquor. The
overflow of these thickeners is spent liquor, which is sent to Facility 041 for heating prior to
being sent to Area 1. The underflow of the thickeners are the fine and course seed remains,
which are pumped from the tanks to the filter building within the facility. The filter building is
separated into a section for fine seed filtering and a separate section for course seed filtering
(BHP Billiton Worsley Alumina Pty Ltd, 2003).
2.3.4
Evaporator (Facility 040)
Facility 040 is used to evaporate and remove water from the spent liquor, in order to maintain
a pre-determined Caustic concentration. Evaporation occurs through the use of two trains,
each consisting of 6 flash vessels and 2 barometric condensers in series. Vacuum pumps are
used in order to reduce the pressure in each flash vessel, whilst the temperature is controlled
with heat exchangers. As the pressure within the vessels is reduced below the vapour pressure
of the water, it is boiled off at a rate which will produce spent liquor which has a predetermined caustic concentration. The water vapour is pumped through condensers and
finally removed from the solution.
2.3.5
Water Treatment and Storage Plant (Facility 180)
Water for the fire system and drinking is treated in Facility 180. Raw water is pumped from the
fresh water lake to the storage tank within the facility. Drinking water is pumped through a
microfiltration system in which bacteria and other impurities which may be present are
removed. The fire system water originates from the raw water storage tank, and is sent
through Culligan filters in order to remove impurities, before chlorine is added in the fire water
storage tank (BHP Billiton Worsley Alumina Pty Ltd, 2003).
9
2.4 Area 4
The Calcination stage of the Bayer Process occurs in Area 4, in which the Alumina hydrate
crystals are heated in order to remove the chemically bound water from the hydrate.
Additionally, Area 4 is responsible for the removal of liquor from the hydrate slurry which is
pumped from Area 3 and is also used to wash the soluble soda from the filtered hydrate cake.
The main processing facilities within Area 4 include Liquor Purification and Oxalate Removal,
Hydrate filtration and Calcination and lastly Alumina Transport and Storage.
2.4.1
Liquor Purification and Oxalate Removal (Facility 043)
Facility 043 has three sections which are used to decontaminate spent liquor, allowing it to be
recycled within the process. The three sections include spent liquor evaporation, spent liquor
crystallisation and lastly the oxalate degradation plant. In the spent liquor evaporation section,
water is removed from the liquor through the use of a train of heaters, evaporators and finally
condensers. The crystallisation section is responsible for the removal of the oxalate crystals
from the spent liquor. This occurs by pumping the spent liquor through 3 crystalliser tanks in
series, which are maintained at specific temperatures so as to ensure the maximum amount of
oxalate crystal development. The crystal containing solution is then pumped through one of
four filters, producing an oxalate rich cake and filtrate. This filtrate is then re used in Area 3,
while the cake is sent to the oxalate degradation plant. The oxalate degradation plant uses
microorganisms to break down the sodium oxalate and other organic residue in the spent
liquor. Once the spent liquor has been through this process it is then re used in Area 2 (BHP
Billiton Worsley Alumina Pty Ltd, 2003).
10
2.4.2
Alumina Hydrate Filtration, Washing and Calcination (Facility 050)
Facility 050 can be split up into 2 separate sections which are Filtration and Calcination. The
purpose of filtration is to remove the caustic soda from the Hydrate solids before they are sent
to the Calcination section. This is done to ensure that the soda content meets customer
requirements, as well as to reduce soda lost from the process. The Calcination stage is used to
remove surface and chemically bound moisture from the hydrate crystals in order to meet the
requirement of smelters.
Figure 6: Facility (050) Calcination
(BHP Billiton Worsley Alumina Pty Ltd, 2003)
2.4.3
Liquor Burning Plant (Facility 044)
The Liquor burning plant is a very important facility, as it is used to remove all dissolved
organic material out of the spent liquor. This allows the liquor to be reused within the refinery
and therefore has substantial economic benefits to the plant as a whole. The removal of
organic materials occurs in three separate sections which are evaporation, drying and
filtration. The evaporation section is used to concentrate the feed going into the Liquor
burning plant and by removing about 60% of the water within the feed. The drying section is
used to further reduce water content, burn off carbon as well as continue the reaction
between alumina and caustic soda (BHP Billiton Worsley Alumina Pty Ltd, 2003). The filtration
section is used to remove all sulphur components which may still be remaining in the slurry.
11
The output of the filtration section is clean spent liquor which may now be reused within the
refinery.
2.5 Powerhouse
The Powerhouse at BHP Billiton Worsley Alumina Pty Ltd is responsible for the production of
electricity and steam for use within the refinery. The refinery uses a range of voltages, which
include 3.3 kV for use with large motors and 415 VAC for smaller motors use (BHP Billiton
Worsley Alumina Pty Ltd, 2003). Additionally the Powerhouse produces all of the compressed
air which is used throughout the refinery on a day to day basis. A typical day to day supply
from the Powerhouse would include the following:
•
1300 kPa Steam
•
450 KPa Steam
•
Instrument air at 800 KPa
•
Plant air at 820 KPa
•
Electrical power = 81 MW
There is no doubt that the Powerhouse is one of the most critical assets within the refinery,
and without it the refinery would cease to produce.
12
3 Fieldbus training system
3.1 Introduction
Fieldbus is a family of digital protocols which are used for communication between
instruments in the process industry. The Expansion and Growth project currently underway at
BHP Billiton Worsley Alumina Pty Ltd has led to the introduction of Fieldbus devices, and has
thus called for the need of a training session on the configuration of these devices.
3.2 Objectives
The objectives of this project are to successfully set up, wire and test the Fieldbus training
system so that it can be used by engineers and technicians during their training session.
Additionally a block diagram will be required, which shows the connections between relevant
modules and instruments. This block diagram will be used in future training sessions.
3.3 Fieldbus
3.3.1
Description
Fieldbus is a family of industrial computer network protocols which are used within
automation and process control industries. It is an approach to connecting instruments within
a process plant, and usually allows topologies such as daisy chain, star, ring, branch, tree and
chicken foot. In previous years most industries have used the 4-20 mA schemes, which require
that each instrument have its own communication point at the controller level (Fieldbus
Specific Technical Information). Fieldbus differs from this scheme as it is a digital, bidirectional, multidrop, serial-bus, communications network, which is used to link separated
field devices such as controllers, transducers, actuators and sensors (Maynard, 2005).
Fieldbus devices have low cost computing power installed within the device, enabling the
device to execute simple functions such as diagnostic, control or even maintenance functions.
Furthermore, Fieldbus devices allow bi-directional communication, as well as having the
capability to communicate with other fieldbus devices. There are a number of Fieldbuses
currently on the market, with the most common protocols indicated in Table 1.
13
Table 1: Established Fieldbus systems
ModBus
Plus
DNP3
DeviceNe
t
WorldFIP
PROFIBUS
DP
PROFIBUS
FMS
PROFIBUS
PA
AS-i
SERCOS
InterBus
ISP SP-50
FIPIO
SINEC
Omron Sysmac Bus
CAN Open
P-NET
EIB
CAN
Kingdom
FIP
LonWor
ks
IEC
870-5
CEBus
Allen-Bradley
Remote IO
FOUNDATION
Fieldbus
Smart Distributed
Systems
IEEEP1451.2
SERIPLEX
(Fieldbus Specific Technical Information)
Each Fieldbus protocol should ideally define all standards to be used within the seven layers of
the OSI model. This includes;
•
Physical Layer [1] – This layer defines what types of signals will be present, levels,
the way in which 1’s and 0’s are represented, the type of media that is
communicated etc.
•
Link Layer [2] – This layer defines the methods for establishing links between
communicating parties.
•
Network Layer [3] – The third layer describes the method of selecting the node of
interest within the network, as well as the process of routing data.
•
Transport Layer [4] – The transport layer ensures that the information that was
sent arrives at the receiver successfully, correcting any fixable problems.
•
Session Layer [5] – Not applicable to Fieldbus.
•
Presentation Layer [6] - Not applicable to Fieldbus.
•
Application Layer [7] – The application layer is responsible for defining the
meaning of the data.
(Fieldbus Specific Technical Information)
14
3.3.2
Advantages
The management of the Efficiency and Growth (E&G) project currently underway at BHP
Billiton Worsley Alumina Pty Ltd have opted to install Fieldbus devices in the expanded plant
as opposed to the previously used 4-20 mA devices. Some of the advantages of Fieldbus
include:
•
Reduction in complexity of the control system in terms of hardware outlay, PLC and
DCS hardware requirements and other hardware such as control cabinets.
•
The need for large cabling runs is eliminated.
•
Reduction in installation times and man power.
•
Efficient and easy commissioning of devices as diagnostic functions of the Fieldbus
system will identify any connection errors.
•
Superior diagnostic and fault finding procedures of Fieldbus instruments.
(Fieldbus Foundation, 2006) & (Fieldbus Specific Technical Information)
3.3.3
Series C Fieldbus Instrument Module
The Series C Fieldbus Interface Module (FIM) is a Honeywell device which allows Fieldbus
instruments to communicate with the C300 controllers and the Experion DCS. The FIM
communicates to the controller via Fault Tolerant Ethernet (FTE), and each FIM can support up
to 32 Fieldbus devices. Fieldbus devices can be configured through the Experion Control
Builder application, which permits the integration of Fieldbus function blocks with Experion
system function blocks, allowing the Fieldbus devices to be easily incorporated into a Control
Strategy (Honeywell, 2007).
Figure 7: Fieldbus Instrument Module (FIM)
(Honeywell, 2007)
15
3.4 Time management
The planned time for this project was 3 days, which included the set up of the training system
as well as the design of the connection block diagram. The three days were broken up as
indicated in the table below. This project ran on time and did not require additional resources.
Table 2: Time management for project
Day
1
Description
Connect PCs and peripherals.
Install VMware as well as install the already
built virtual machine.
Configure IP addresses on real machines as
well as virtual machines.
Testing of network.
Running Configuration Studio software to
ensure proper installation of virtual
machine.
Wire Fieldbus instruments and segment
protector.
Detailed notes on wiring.
2
3
Draw Block diagrams and connections using
Microsoft Visio.
3.5 Method
1. Connect and power PCs and peripherals.
2. Connect PC network to switch.
3. Install VMware and install the already built Virtual machine.
4. Configure IP addresses for both the real machine as well as the virtual machine.
5. Test network to ensure all IP addresses could be seen on the network.
6. Run Experion’s Configuration Studio and test for unexpected behaviour.
7. Physically wire the Fieldbus instruments using a segment protector.
8. Draw a block diagram, describing how the systems components are connected.
16
3.6 Problems
There were a few problems encountered in regards to seeing all of the machines on the FTE
network. This was corrected by ensuring that the virtual machine and real machine each had
their own specific IP addresses. Additionally there were some delays with the arrival of the
extra instrumentation, which were originally meant to be available on the morning of day 2,
but were only available after lunch on that day. This caused some time management issues as
the intern was then required to work on the block diagrams first, and then physically wire the
instruments once they were available. There were no changes in scope for this project.
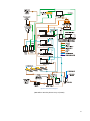
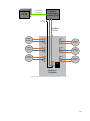
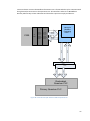
3.7 Summary of results
Overall the Foundation Fieldbus training system project was considered a success. The intern
was able to set up a system which simulated the DCS and Fieldbus instruments within the
plant, so that it could be used for training purposes. Additionally, the intern wired the Fieldbus
instruments, and created documentation that described the physical arrangement of the
training system as shown in Figure 8 and Figure 9. Upon completion of the Fieldbus training,
the intern also gained a practical knowledge in replacement, commissioning and
decommissioning of Fieldbus instruments on the Experion system. This included like for like
replacements, like for unlike replacements as well as configuration and commissioning of new
instruments. The project allowed the intern to gain valuable technical knowledge of Fieldbus
instruments and various protocols, as well as an opportunity to get hands on experience with
the physical wiring and layout of the devices.
17
Fault Tolerant
Ethernet (FTE)
C300
Fieldbus
Instrument
Module (FIM)
-
+
Not
connected
Fieldbus
Trunk
+
s
+
s
Fieldbus
Instrument
s
Fieldbus
Instrument
s
+
-
Fieldbus
Instrument
s
+
-
Fieldbus
Instrument
+
s
+
-
Fieldbus
Instrument
T
+
s
Fieldbus
Instrument
Segment
Protector
Figure 8: Physical Wiring between C300 and Fieldbus instruments
18
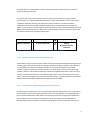
Firewall
FIM
Firewall
+
FTE
+
+
+
-
C300
FIM
+
+
+
+
-
C300
To Segment
Protector
Power Supply
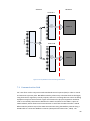
Figure 9: FTE communication between C300 controllers and FIMs
3.8 Conclusion
The Fieldbus training system project allowed the intern to get hands on experience in
commissioning and replacement procedures for Fieldbus devices. He was also given the
opportunity to physically wire the Fieldbus devices, as well as configure these devices for use
at a DCS level. Overall the project was very enjoyable and relevant to a career in engineering.
19
4 HMI Design for Condensate Polishing Plant Trains
4.1 Introduction
The Condensate Polishing Plant (CPP) forms part of the Power House at BHP Billiton Worsley
Alumina Pty Ltd and is used to treat returned water from the process so that it can be re used
in the boiler. The returned water is polished through the use of Cat-ion, An-ion and Mixed Bed
vessels. The project involved the redesign of the current ABB graphics for the CPP trains within
the Power House, and required the intern to liaise with Power House operators in order to
design a display that would be as useful as possible.
After discussions with Ben Marler (Supervising engineer) and Peter Miller (Power House
operator) it was decided that the current ABB graphics were not of much use whenever
trouble shooting was required. This was because the valve placements on the ABB graphics
were not consistent with the actual physical placements of the valves and the relevant vessels.
This issue led to the decision to design the new graphics in a manner that simulated the
physical layout of the valves and their relevant vessel.
Ben Marler had already designed a new graphics page for the CPP, but this was designed quite
similarly to the ABB graphics and were therefore of not much use. The intern was supplied
with a schematic of the Condensate Polishing Plant, which detailed each valve and their
relation to the vessels. The HMI display was then redesigned to resemble this schematic as
practicably possible and was a Level 3 Display.
4.2 Time management
The time allocated for this project was 2-3 weeks and was successfully completed in this time.
The time was allocated over a number of days and spread out in its structure. Other items
which were concurrent with this project included workplace meetings, as well as the
Foundation Fieldbus training system project and write up.
20
Table 3: Time management for HMI project
Task Objectives
Project and HMI Web Display Builder
introduction
Build HMI Displays
Troubleshoot errors
Project Report
Total
Days
1
6
3
1
11
4.3 Software
The software that was utilised in order to complete this task was HMI Web Display Builder,
which is a Honeywell product that allows the user to “click and drag” shapes in order for easy
design and manipulation of the display. This software also allows more complex displays to be
designed, and utilises the Visual Basic programming language in order to add scripts to
relevant shapes. The shapes that were used were all predetermined shapes within the Power
House shape library and follow Advanced Process Graphics (APG) guidelines. Honeywell’s
Station software was also utilised in order to view the displays once they were designed.
4.4 Operator interface guidelines
4.4.1
Introduction and background
In today’s highly technological process industry, the job of a plant operator has become more
than just opening a valve and shutting off a pump. Highly complex plants require operators to
be undertaking multiple tasks at once, all whilst maintaining vital set points and targets.
Human beings have strengths and weaknesses in the way in which we process information,
therefore the best operational displays are those which allow the operator to make the most
effective decisions in the least amount of time. These types of displays allow the operators to
recognise a developing situation before it becomes an incident, as well as reducing the amount
of incidents which may be caused by human error (BHP Billiton Worsley Alumina Pty Ltd,
2004).
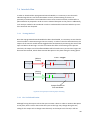
4.4.2
Structure and Types of display
The structure and organisation of operator display pages can play a very important role in the
performance of the system as a whole. Earlier display structures used a typical “flat” display
hierarchy such as that in Figure 10 , in which there may be one or two overview pages followed
by many display pages, each representing only a narrow segment of the plant. This type of
hierarchy can often make it very difficult for operators to navigate through pages, as well as
21
reducing their ability to see the plant’s “big issues”. Although this type of hierarchy may still be
manageable during routine operations, having unnecessary tasks during an upset can
potentially cause disaster.
Figure 10: Flat display hierarchy
(BHP Billiton Worsley Alumina Pty Ltd, 2004)
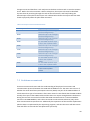
The standard adopted by BHP Billiton Worsley Alumina Pty Ltd is to utilize four different levels
of HMI display, ranging from broad overviews (Level 1) to highly detailed information pages
(Level 4). This methodology follows the industry best practice, which aims to allow operators
to see the “big picture” using higher level displays (Level 1 and 2), while being able to locate
information on specific parts of the plant with the lower levels (Level 3 and 4) (BHP Billiton
Worsley Alumina Pty Ltd, 2004). A typical four level display hierarchy is illustrated in Figure 11
below.
Figure 11: A typical four level display hierarchy
(BHP Billiton Worsley Alumina Pty Ltd, 2004)
A more detailed summary of information included in each level is discussed below.
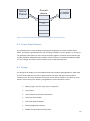
4.4.2.1 Level 1 Displays
The level 1 display is used to provide the operator with qualitative information of the plant,
which allows the operator to gain an indication of the operating state of the plant. At BHP
Billiton Worsley Alumina Pty Ltd, the level 1 displays are large screens situated on the wall in
the front of the central control room (CCR) as illustrated in Figure 13. Features that may be
included in a level 1 display include the following:
22
•
Process overview displays such as key parameters, alarms and calculated process
conditions all on one screen.
•
On the level 1 display, any alarm statuses including the number, general location as
well as the acknowledged status of alarms which have a high or emergency priority.
•
Health of high level process areas such as furnaces or reactors.
•
Trending information on critical parameters.
•
Information which aids the operator in recognizing the existence, severity and location
of a process problem.
(BHP Billiton Worsley Alumina Pty Ltd, 2004)
A typical Level 1 Display is shown in Figure 12 below.
Figure 12: Typical Level 1 Display
(BHP Billiton Worsley Alumina Pty Ltd, 2004)
23
Level 1
Display
Lower level
Displays
Figure 13: Layout of level Displays
(BHP Billiton Worsley Alumina Pty Ltd, 2004)
4.4.2.2 Level 2 Displays
Level 2 displays will usually contain more detailed information than the level 1 display and
typically contain functional and control-specific information. Due to this level 2 displays are
considered to be the primary operating display, which the operator will use to directly interact
with the system. Features which should be included on a level 2 display include the following:
•
System and Subsystem overviews, which are primary displays for every major process
area or unit which are under the operator’s control.
•
Alarms, including all emergency, high and low priority alarms for a specific area. In
complex processes, it may be beneficial to group alarms by their area in order to
recognize problems occurring in a certain area.
•
All of the primary controllers for a specific area should be included on the level 2
display.
•
Main control interface, which should have enough information and controllers for the
operators to control the process under most normal conditions.
•
Task specific displays.
(BHP Billiton Worsley Alumina Pty Ltd, 2004)
A typical Level 2 Display is shown in Figure 14 below.
24
Figure 14: Typical Level 2 Display
(BHP Billiton Worsley Alumina Pty Ltd, 2004)
4.4.2.3 Level 3 Displays
The purpose of a level 3 display is to display more detailed information that does not exist on
level 2 displays, and for this reason this level makes up the bulk of existing displays. This level
provides views of sub units, equipment, related controls and indications and is therefore used
for routine operations such as switching of pumps, opening and closing valves etc. Information
which should be included on a level 3 display includes:
•
All control loops.
•
All process alarms.
•
Controllers and indicators which are not included on the Level 2 display.
•
Control pages for pumps, transmitters and controllers.
(BHP Billiton Worsley Alumina Pty Ltd, 2004)
25
Figure 15: Typical Level 3 Display
(BHP Billiton Worsley Alumina Pty Ltd, 2004)
4.4.2.4 Level 4 Displays
Level 4 displays contain information on a specific piece of equipment or unit, and aid the
operator when troubleshooting. Information included on level 4 displays includes:
•
Procedural and Help displays which may describe operational procedures of
equipment.
•
Alarm summaries.
•
Trend matrices.
•
Diagnostic information.
•
Interlock information.
(BHP Billiton Worsley Alumina Pty Ltd, 2004)
26
Figure 16: Typical Level 4 Display
(BHP Billiton Worsley Alumina Pty Ltd, 2004)
4.4.3
Display Format
The appearance and layout of a display may have a significant impact of the speed and
accuracy in which an operator can retrieve the information they need. The three major factors
which need to be taken into account are data presentation, display page layout as well as
colour. Each of these factors has had a great amount of research, and entire reports have been
written on their specifics. For this reason only a brief description of each will be discussed,
enough to allow the reader to understand the importance of each.
4.4.3.1 Data Presentation
Rather than just presenting the operator with raw data, the Advanced Process Graphics (APG)
Guidelines recommend providing them with context information. An example of this would be
the difference in just displaying a Process Variable (PV) to an operator, without the Set Point
(SP) as in this case the operator does not know if this PV is in a good range or needs attention.
If the display not only displays the PV, but also displays other useful information about the
state of the variable, then the operator is able to decide whether to take action a lot quicker
than if he only had the PV and nothing to compare it with. Information which may assist the
operator and should be displayed includes:
•
Hi Hi alarm limit
•
Hi alarm limit
•
Process variable
•
Set Point
•
Lo Alarm limit
•
Lo Lo alarm limit
27
An issue with displaying all of this information is that is can become quite cluttered, and an
information overload of numbers can cause the operator to make the wrong decision in a
stressful situation. To resolve this issue the guidelines have suggested using an analog style of
number representation as illustrated in Figure 17 below. The analog presentation not only
takes less room to convey all of the information, but it also removes the need for operators to
do mental calculations in order to interpret the information (BHP Billiton Worsley Alumina Pty
Ltd, 2004).
Figure 17: Analog presentation style
(BHP Billiton Worsley Alumina Pty Ltd, 2004)
4.4.3.2 Display Page layout
Another issue which can often stand in the way of optimal operator interaction is clutter
within the display. In the process industry it is often necessary for the operator to view a lot of
information at one time. Therefore having a well organised display can convey more
information to the operator than a cluttered one, as it requires less complexity in the search
for information (BHP Billiton Worsley Alumina Pty Ltd, 2004). Figure 18 and Figure 19 below
represent a cluttered display and a well organised display.
Figure 18: Cluttered display
(BHP Billiton Worsley Alumina Pty Ltd, 2004)
28
Figure 19: Well organised display
(BHP Billiton Worsley Alumina Pty Ltd, 2004)
4.4.3.3 Colour
Colour is one of the most powerful visual cue’s that can be used to draw the operator’s
attention to a certain event. A common problem is that many display designers are tempted to
use colour in order to distinguish different parts of their displays such as alarms, flows, or even
just to make them look “flashy”. This may cause an issue as using colours all over the place can
often result in a colour language which the operators must learn and remember (BHP Billiton
Worsley Alumina Pty Ltd, 2004). The guidelines recommend only using colour sparingly and
when there is a clear and well-documented reason for doing so. Instead of using colour, the
guidelines recommend using a light grey background, as well as a darker shade of grey for
equipment and lines. The use of colour is to be kept for alarm states as will be discussed in the
alarms section to follow.
29
4.4.4
Alarm Colours
As previously discussed, the use of full intensity colours should be used to indicate alarm
conditions and not normal operating conditions. This is to ensure that the display is able to
grasp the operator’s attention quickly when there is an emergency. The following colours are
used to different levels of alarms:
•
Red – Emergency Alarms
•
Yellow – High Priority Alarms
•
Cyan – Low Priority Alarms
(BHP Billiton Worsley Alumina Pty Ltd, 2004)
4.5 Problems encountered
There were numerous problems encountered during this project. One of the main issues was
with design aesthetics and the limited amount of space within the display template.
Unfortunately some neatness of the design had to be sacrificed as vessels needed to be
squeezed closer together in order to place the valves in their physical positions within and
outside of the vessels.
HMI Web Display Builder also allows the user to attach scripting to an object or shape. This is
useful as it permits the user to program certain objects to display information depending on
the state of certain points and other information. This caused some problems as originally the
shapes, which included their relevant graphic and associated point details, were being copied
and pasted from the previous design by supervising engineer Ben Marler. Even though the
shape and its details would paste, not all of the associated script of the shape would be carried
over, thus leading to a complete overhaul of the new shapes and script. Even though this
increased the time spent on the project, it allowed the intern to gain experience in Visual Basic
programming, as well as gain an understanding of the way in which the shapes read certain
points and are programmed to respond. Additionally the review of the current scripting led to
the discovery of an error in the programming of the “interrupt” portion of the code, in which
an IF statement was coded to be true when a certain point was “ON”. The issue with this code
was that these points did not have ON/OFF statuses as demonstrated below.
Elseif textbox.MixedBedStatus.datavalue(“52A4869_PV”) = “ON” AND
textbox.MixedBedStatus.datavalue(“XACP0063_SCD.PV”) = “ON” THEN
textbox_MixedBedStatus.value = “INTERRUPT”
Investigation into this point found that the 2 states which the PV of this point could be were as
below;
30
Table 4: Status descriptors
Point
XACP0063_SCD.PV
State 0
NORMAL
State 1
REG_IRPT
Therefore the script for each interrupt script was changed as follows;
Elseif textbox.MixedBedStatus.datavalue(“52A4869_PV”) = “ON” AND
textbox.MixedBedStatus.datavalue(“XACP0063_SCD.PV”) = “REG_IRPT” THEN
textbox_MixedBedStatus.value = “INTERRUPT”
The Condensate Polishing Plant utilises 3 polishing trains, with the ability of the first train to
switch between Mixed Bed one, two or three. After the original had been completed, the
intern was asked to program the Train 1 graphic so that the operator can view each individual
Mixed Bed by selecting a push button. This task involved creating a script for each push button,
that would hide or reveal certain graphics depending on which push button had been
activated. Additionally this also called for a script to be created which would initialise which
bed was in use when the page was loaded, as opposed to having each mixed bed
superimposed on each other until the operator selected which mixed bed to view. The push
button of the train currently in service was also to be programmed so that it would “grey out”
when selected, further assisting the operator in identifying which mixed bed is being viewed.
Some issues that were associated with this job include run time errors, as well as syntax errors
related to the code.
The last issue that arose was a run time error which read “Type mismatch” in the
TrainStatus_datachange sub procedure within the General section of the HMI script. After a
few attempts at troubleshooting this error, it was found that the Ucase (Upper Case)
command that had been reproduced from the previous scripts was what was causing the issue
as it was attempting to take the uppercase of a string that was already in uppercases. The type
mismatch error was encountered a number of times, each for different reasons which had to
be individually uncovered, a process which was quite costly in time. Table 5 shows the most
common Type mismatch errors that were encountered as well as the solutions.
31
Table 5: Run time errors
Run time error
Type_mismatch
Type_mismatch
Type_mismatch
Discovered Problem
Ucase statement used on a
string already in upper case
Comparing string to a
number
“Call” statement was not
used when calling a bed
selection sub procedure
Rectifying Action
Removed Ucase statement
Corrected issue and
compared a string with a
string
Added Call statement to
command
4.6 Summary of Results
As a whole the graphic project for the Condensate Polishing Plant was successful, and resulted
in a HMI display which was useful to the Powerhouse operators whenever there is a need for
troubleshooting. This project allowed the intern to gain experience in the Advanced Process
Graphics standards and design methodology used in real life HMI Design to ensure optimal
operator interaction. Additionally the project ensured that the intern gained a substantial
understanding of the Visual Basic Programming language, as well as experience using the HMI
Web Display Builder software package.
32
5 Control Loop tuning through TuneWizard Software
5.1 Introduction
A poorly tuned control loop can have the same characteristics as a loop with lousy dynamics,
resulting in sluggish responses, excessive dead time or even instability. Having these problems
in a plant’s control scheme can create upsets to the process, decreasing efficiency of the plant
and consequently effecting plant yield and profit. Process conditions at BHP Billiton Worsley
Alumina Pty Ltd are forever changing, thus occasionally requiring control loops to be retuned
in order to ensure optimal performance.
5.2 Objective
The objective of this project is to use the TuneWizard software to tune a control loop within
the refinery, as well as to gain a basic understanding in using the software, which includes
stiction and hysteresis diagnostics.
5.3 Time management
The time which was allocated for this project was 3 days in total as shown in the table below,
and includes gaining an understanding of the software, tuning the loop and finally writing up
the project.
Table 6: Time management of loop tuning project
Task Objectives
Project introduction and software
introduction
Tune loop (Step test, simulation, tuning and
comparison)
Write up
Total
Days
1
1
1
3
33
5.4 Software
TuneWizard is a software package produced by Plant Automation Solutions (PAS), which allows
users to simulate and tune control loops. The software is easy to use, and allows users to
compare loop performance before and after tuning. Additionally the package allows the user
to compare various tuning parameters, in an attempt to ensure optimal parameters for the
situation.
5.5 Hysteresis
Hysteresis occurs when there is a change in direction of controller action, and is characterized
by the amount of travel required by the controller output to obtain a change in process
variable. Another way of describing hysteresis is the percentage of slackness between the
controller and the process. A valve with hysteresis will act as if there is some dead-band
between the control signal and valve position, a problem which may be caused by play in
mechanical linkages, an undersized actuator, defective positioner or even excessive friction in
the valve (Plant Automation Services Inc, 2005). Hysteresis may cause issues when tuning
loops as tuning is usually done by making small set point changes, adjusting the controller
parameters until a desired response is achieved. The problem with hysteresis is usually the
controller gain will be quite high in order to get a change in the process variable during the
small steps. This gain may be too high when larger set point changes are conducted, and as the
controller passes through the other side of the hysteresis it may overshoot the set point due to
the high gain. Figure 20 illustrates the effect of hysteresis on a valve, in which the process gain
is higher when stepping the controller output down, as when compared to a step in the
reverse direction.
TuneWizard software allows the user to conduct a hysteresis test consisting of 2 steps in
controller output in one direction, and one step in the reverse direction. The step size is
preferably 5% of the controller output, and will allow the software package to calculate the
amount of hysteresis on the valve and allow the user to tune accordingly (Plant Automation
Services Inc, 2005). Additionally TuneWizard offers a hysteresis diagnostic tab, which allows
the user to gain an understanding into the amount of hysteresis on the valve, and decide
whether this is acceptable, questionable or unacceptable. If the user decides that the amount
of hysteresis is unacceptable, they may reduce the effect by replacing the valve stem seal,
replacing actuator linkages and positioners, as well as using larger actuators (Plant Automation
Services Inc, 2005).
34
Hysteresis
evident
Figure 20: Hysteresis tab within TuneWizard
(Plant Automation Services Inc, 2005)
5.6 Stiction
Stiction occurs when more force is required to induce valve movement than is required to
sustain it. This problem may be caused by a number of problems such as an overly tight valve
stem seal, sticky valve internals, undersized actuators or even sticky positioners (Plant
Automation Services Inc, 2005). Figure 21 illustrates a typical stick slip cycle, in which a process
variable starts below its set point. The controller begins to increase its output in order to reach
the set point, but due to stiction the valve does not actually move which causes the controller
to continue increasing its output. As the controller output is increased, excessive pressure is
induced on the valves diaphragm which eventually causes the stiction to be overcome, but also
causes the process variable to overshoot its set point. TuneWizard contains a method for
conducting a stiction test, as well as a stiction diagnostics tab similar to that of the hysteresis
tab. Valves which have too much stiction should be reviewed in the same manner as those
with too much hysteresis.
35
Process
Variable
Controller
Output
Figure 21: Typical stick-slip cycle
(Plant Automation Services Inc, 2005)
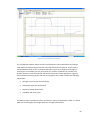
5.7 Step Test
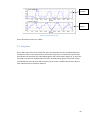
Due to the nature of the control loop, the intern was advised to use the TuneWizard process
simulator in order to tune loops and not disturb the real process. A closed loop step test had
already been conducted by the supervising engineer and is illustrated in Figure 22, in which the
top graph is the process variable and its set point, and the bottom graph is controller output.
TuneWizard then uses this data and controller type to create a model of the process, which is
then imported into the simulator software.
36
Figure 22: Closed loop step test data
5.8 Tuning
The TuneWizard software allows the following tuning options for calculating PID parameters.
•
Tuning for fast recovery after a disturbance (Disturbance rejection).
•
Tuning for fast response to setpoint change (Setpoint tracking).
•
Tune PID loop using Internal Model Control (IMC) or Lambda tuning method.
•
Surge tank control loop tuning.
The intern was advised to tune the loop for optimal performance when rejecting disturbances
and therefore the disturbance rejection option was selected.
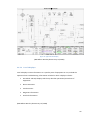
The simulated open loop step test is shown in Figure 23, in which the intern conducted a step
in one direction, followed by two steps in the opposite direction. TuneWizard then uses this
data to tune the loop according to the user defined specifications.
37
Figure 23: Simulated open loop step test
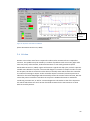
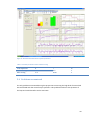
The TuneWizard software allows the user to pick between various parameters by scaling a
slider between fast disturbance rejection and robust disturbance rejection. As the slider is
moved between these 2 limits, a pictorial indication is given as to whether the changes in
process gain or time delay are very safe, good, fair, minimal, insufficient or unstable. This
enables the user to pick the controller parameters which best fit the application. Figure 24
shows the before tuning (purple) and after tuning (blue) shots, which includes the following
information:
•
Changes in process gain and time delay.
•
Disturbance rejection performance.
•
Setpoint tracking performance.
•
Variability and valve travel.
The PID controller’s parameters before and after the tuning are displayed in Table 7, in which
both the controller gain and integral time have changed substantially.
38
Figure 24: Recommended disturbance rejection parameters
Table 7: Controller parameters before and after tuning
Task Objectives
Before tuning
After tuning
P
1
0.27
I
0.5
0.08
D
0
0
5.9 Problems encountered
The only problem encountered during this project was concerning the high level of noise which
was associated with the control loop in questions. This problem was due to the dynamics of
the loop and could therefore not be overcome.
39
5.10 Results
Overall the tuning exercise was considered a success. The tuned control loop responded
quicker to disturbances and was able to return back to its setpoint without any issue.
Additionally the tuned controller was also able to respond to setpoint changes quicker, and
with fewer oscillations when compared with the original controller parameters. Variability and
valve travel was also reduced significantly, which can reduce plant costs and increase
efficiency.
5.11 Conclusion
The control loop tuning project allowed the intern not only to use his knowledge of process
dynamics and control, but also gave him an opportunity to use TuneWizard to simulate a
process and consequently tune its controller. The project gave the intern a chance to see how
Control Engineers tune loops in the “real world”, as well as gaining an insight into issues such
as valve hysteresis and stiction.
40
6 Powerhouse BMS/SCADA Database Update Project
6.1 Project background
The current data acquisition and control system in place at the BHP Billiton Worsley Alumina
Pty Ltd Powerhouse is known as the ABB system. The goal is to migrate from this system to the
Honeywell Experion system, which will allow better control and performance, as well as
incorporate the Powerhouse operators into the central control room. In order to migrate the
points from the ABB system to the Experion system, it was necessary to create an OPC
interface, which would allow Experion’s Quick Builder software to import these points into its
own database. Points and tags are terms used interchangeably, and may consist of actual hard
I/O points, as well soft points (within the programming).
6.2 Problem
The main issue in transferring the points from the ABB system to the Experion system is that
some of the state descriptions do not make sense in the Experion HMI. Below is an example of
the most common type of inaccuracy in the state description.
ItemName
ItemDescription
DescriptorState
1
DescriptorState
0
XS3112A
PA FAN RUNNING
ONE
ZERO
BMS_23002_RS
T
BMS HIGH FLOW RESET
-
-
Figure 25: Operator graphic with no description
This current state description method makes it difficult for the operator to comprehend what
the states of each point are representing, and guesses or intuition may have to come into play
in regards to certain points.
41
Figure 25 above is an example of the graphic for point XS3078Ain which there is only a
description for state 1 of this point and none for state 2. The states currently in place for this
tag are as follows:
ItemName ItemDescription
DescriptorState1 DescriptorState0
XS3078A
OUT
GUN -1- FLAME
-
Therefore when the programmed logic sends a 1 to the tag XS3078A, the graphic will read
(OUT), but when there is a zero being sent to the tag the operator will only be able to read ( - ),
which makes no sense to the operator.
6.3 Objective
The aim of the project is to identify the points which have irrelevant or confusing state
descriptors, and change these descriptors to something which will have more meaning to the
operator when viewing them on the Experion HMI.
The programs which will be used to accomplish this include the following:
•
ABB System
•
OPC platform (Allow communication between ABB and Experion)
•
Experion QuickBuilder (View points once they are within Experion system)
•
Microsoft Excel (Exporting points into Excel allows sorting, viewing and
modification of status descriptors)
•
HyperView (Allows a search of the tag names, and will also find where these
tags are situated within the logic in order to make sense of status descriptors)
•
Microsoft Word
6.4 Progress
42
It was decided that because all three boilers are exactly the same, it would be beneficial to
begin with the first boiler’s state descriptors, and then apply the changes to the remaining
boiler’s tags. The intern was required to use Honeywell’s Quickbuilder to locate the relevant
points, and export these to an Excel spreadsheet.
Once the spreadsheet had been created, the intern applied filters to the state descriptors in
order to gain an understanding into how many different state descriptors were currently in
place. For Boiler 1 there was 1061 tags, in which more than half had descriptors which had no
meaning to the operators. Figure 26 below illustrates the relevant portion of descriptors.
Descriptor classification
12%
One / Zero descriptor
43%
Other descriptor
( - ) descriptor
45%
Figure 26: Classification of state descriptors
In order to check the validity of current descriptors as well as create new descriptions for tags
with none, it was necessary for the intern to work through the PLC logic and find what the true
meaning of the tags were depending on their state. This proved to be a long winded but
necessary process, as it found was that many tags utilised reverse logic, and were therefore
off when the state was one. Working through the PLC code also allowed the intern to make
sure that the descriptors that did make sense were actually correct.
43
6.5 Time management
Due to the pure size of this project it had originally been given a low priority, and it was
agreed with the academic supervisors that this project would be a continual development.
Below is a table which demonstrates how the intern’s time was divided for the project.
Table 8: BMS project Time management
Task Objectives
Days
Project background and introduction
1
Extract points from Quickbuilder and
organise data
0.5
Work through logic and correct state
descriptors
On going
Project Report
1
6.6 Progress
This project is currently still in progress. Due to the important nature of the status descriptions
within the new system, a supervising engineer needs to check the descriptions proposed by
the intern and therefore delays are expected.
44
7 C200 SIIOP Control Module reprogramming and Interlock Plan
7.1 Introduction
The aim of this project was to rewrite a C200 Serial Interface Input Output Processor (SIIOP)
Control Module using the correct array method in order to reduce load on the system. The
Control Module to be reprogrammed contains some of the plants critical interlocks, which are
communicated from the Control Module in the C200, to the SIIOP as an array, through the
Lantronix Modbus converter and finally to the Quantum Programmable Logic Controller (PLC).
Additionally the intern was required to prepare a plan, which defined the process that is
needed to be followed in order to download the new interlock Control Module in a way which
does not upset the process. Identification of affected output coils and the risks associated with
incorrect operation during the download are vital part of this project.
7.2 Programming: Array Method
In a large process plant such as BHP Billiton Worsley Alumina Pty Ltd, the health and speed of
the control system is a very important factor as it can affect performance of the plant as a
whole. In order to reduce unnecessary load on the system, information such as interlocks are
communicated from the C200 controllers to the Quantum PLC’s by sending an array of
information, rather than individual points as illustrated in Figure 27 below. Within the Control
Module the individual interlock flags are fed into a position within a Flag Array Block. This Flag
Array Block is then sent to Serial Interface Digital Output Arrays, which allows the array to be
communicated to the SIIOPS. Figure 27 also shows that there are two array channels and two
SIIOPs, a measure which is taken to ensure redundancy in the event of a SIIOP failure.
45
Software
Hardware
Channel A
Interlocks
Serial
Interface
Digital Output
Array
SIIOP A
Flag Array
Channel B
Serial
Interface
Digital Output
Array
SIIOP B
Figure 27: Array Method of communicating information
7.3 Communication Path
PLC’s are often used in conjunction with Distributed Control Systems (DCS) in order to control
and automate a process plant. BHP Billiton Worsley Alumina Pty Ltd utilises both technologies,
using their DCS for regulatory control purposes, and PLC’s to manage discrete control including
equipment stop/start and interlocks. Figure 28 illustrates the physical equipment needed in
order to successfully communicate between the C200’s and the PLC. The SIIOP is a piece of
C200 hardware, which allows serial communication to and from the C200 controller. At BHP
Billiton Worsley Alumina Pty Ltd the SIIOP communicates using the Modbus protocol along a
RS 485 cable to a Lantronix Modbus Converter (Honeywell International Inc., 2004). The
46
Lantronix device converts the Modbus information into a format which may be communicated
along theTCP/IP connection to the Quantum PLC. All controllers and PLC’s at BHP Billiton
Worsley Alumina Pty Ltd are redundant and therefore require more physical devices.
RS 485
ModBus
TCP/IP
I/O
Cards
RS 485
ModBus
Switch
TCP/IP
Switch
TCP/IP
C200
Serial
Serial
Interface
Interface
Input
I/O
Input
Output
Cards
Output
Processor Processor
SIIOP
SIIOP
TCP/IP
Serial Communication
Lantronix
ModBus
Converter
Lantronix
SIIOP 1
ModBus
Converter
SIIOP 2
Redundant
Quantum PLC
Primary Quantum PLC
Figure 28: Communication path between C200 and Quantum PLC
47
7.4 Interlock Plan
In order to download the reprogrammed Control Module, it is necessary to test that each
individual signal that is sent from the C200 is correctly communicating to the PLC. As
previously mentioned the Control Module contains some critical interlocks, and therefore a
plan needed to be prepared in order to ensure minimal disruption to the process. Additionally,
a risk analysis needed to be conducted in order to understand the outcomes which may occur
if the interlocks are disrupted.
7.4.1
Testing Method
Once the reprogrammed Control Module has been downloaded, it is necessary to test that this
control module is communicating to the PLC correctly. In order to test the communication, the
outputs of the Control module will be toggled while simultaneously monitoring the state of the
input coil within the PLC logic. In order to minimise the effect of the testing on the process
interlocks, the output coil of the affected ladder will be forced into its pre-test state. Figure 29
illustrates this method, which allows minimal disruption to the plant during the testing phase.
Before
Testing
PLC Logic
Input Coil
Output Coil
()
C200 Signal
During
Testing
Input Coil
Output Coil
()
C200 Signal
Output Forced to
Pre-test State
Figure 29: Forcing output coils during input coil testing
7.4.2
PLC Coil identification
Although forcing the output coils to their pre-test state is done in order to minimise disruption
to the plant, there is also a chance that the inputs to the logic may change during the test,
calling for the output coil to change state. Obviously as the output coil is forced, it will not
48
change its state and therefore a risk analysis must be done on these coils in case this situation
arises. Before the risk assessment is able to take place, the output coils must be identified.
This was done by searching through the code of the relevant PLC, and firstly finding the
affected input coils and then the output coils. Table 9 below shows the output coils that were
found to physically affect the plant when activated.
Table 9: PLC output coils and associated interlocks
PLC Output Coil
2612
2613
2614
5029
1093
1112
1103
2609
5005
5009
Physical Trip
Interlock trips Train 1 Stage 1
Flash Discharge Pump
Interlock trips Train 1 Stage 1
Flash Discharge Pump
Interlock trips Train 1 Stage 1
Flash Discharge Pump
FV-131 LSHH Interlock trips
Train 1 Inter O/Flow Valves
Interlock trips Train 2 Stage 1
Flash Discharge Pump
Interlock trips Train 2 Stage 1
Flash Discharge Pump
Interlock trips Train 1 Stage 1
Flash Discharge Pump
FV-231 LSHH Interlock trips
Train 2 Inter O/Flow
Valves
FV-131 LSHH Interlock trips
Train 1 Inter O/Flow Valves
FV-231 LSHH Interlock trips
Train 2 Inter O/Flow
Valves
Risk?
7.5 Problems encountered
There were some initial issues with the understanding of the physical connections and
communication protocols between the C200 and the Modicon PLC. The intern was unsure of
whether the Serial Interface Input Output Processor (SIIOP) was part of the C200 module or if
it had some other type of connections. After some research it was found that the SIIOP module
actually forms part of the C200 module and thus does not require wiring between the devices.
During this research it was also found that the SIIOP communicates to a Lantronix Modbus
Converter via RS485 Modbus, and is then converted to Fault Tolerant Ethernet (FTE), which
then communicates to Quantum PLC. Additionally the importance of the interlock replacement
plan has been re emphasized by the supervising engineer, and thus the intern will direct more
time and effort to this task than was planned for previously.
49
7.6 Time management
The intern has split his time worked on this project in the following way:
Table 10: Interlock Plan Time management
Task Objectives
Days
Project background and introduction
1
Research signal flow and create Visio
drawing
1
Work through logic and locate interlocks
7
Research and develop interlock plan
2
Project Report
1
Total
12
7.7 Progress
This project is currently still in progress. The intern has completed about 70% of the project
but is awaiting the supervising engineer so that a risk assessment may be completed on the
interlocks in question. Once a risk assessment has been completed, then the intern and the
supervising engineer will be able to organise a time for the actual download to take place.
50
8 Uticor Display and HMI development
8.1 Introduction
The aim of this project was to design a Uticor Human Machine Interface (HMI), for the fifth rod
and ball mill circuit required for the Efficiency and Growth (E&G) project occurring at BHP
Billiton Worsley Alumina Pty Ltd. This display will be a read only display, and will be used by
the field operators in order to monitor critical variables of the circuit. The intern was required
to conduct an investigation into what data was necessary for the display, and liaise with the
operators to ensure a useful display was designed.
8.2 Uticor and C300 masters
The Uticor Tough Power Panel is a programmable HMI display, which allows the operator to
modify PLC addresses by interacting with the display. The Uticor display contains items such as
Analog meters, PID Faceplate, Bar Graphs, Trend Graphs, Alarms, Recipe, Radio Buttons,
Thumbwheel, a variety of switches, and a rich library of bitmaps (Uticor Pty Ltd).
Figure 30: Uticor Power Panel displays
(Uticor Pty Ltd)
Despite being a master device, the Uticor will only be used to monitor variables, as the control
of the mill circuit will be taken care of by the DCS and C300. In order to accommodate for this
master to master communication along the Modbus protocol, a Prosoft device will be used as
an interface, in which the C300 will write to registers within the Prosoft, and the Uticor will
read from these registers. The digital inputs addresses begin at 3201 and analog inputs start at
2401.
51
Uticor
Panel
Prosoft
device
Mo
db
C300
s
bu
us
d
Mo
2 Byte word or
bits
Figure 31: Communication between Uticor and C300 with the use of a Prosoft device
8.3 Power Panel Software
The software which is used to design and program the graphics is known as Power Panel
editor, and allows a Windows based “click and drag” method for screen design. It is an easy to
use application that allows the user to drop and place graphics, and then attach relevant tags
and PLC addresses. Additionally the software contains a library of hundreds of bitmap images
for use in design, and allows custom bitmaps to be created and imported.
8.4 Design
The design of the display is to follow Advanced Process Graphics (APG) guidelines, which aims
to ensure that operators are able to quickly respond to faults and detect events when a
situation arises. The early detection of an event means that an accident is less likely to occur,
which is vital in the process industry. The guidelines cover information such as;
•
Display (Types, content, style, layout, navigation)
•
Use of colour
•
Use of symbols and process connections
•
Use of text and numbers
•
Interaction with the display
•
Alarm configuration schemes
•
Audible and Visual alarm annunciation
52
•
Design training programs for new displays
•
On-line guidance systems
•
Human factors design methodology
•
Management of change
(Abnormal Situation Management Consortium)
The Power Panel software does not contain the standard BHP Billiton Worsley Alumina Pty Ltd
graphics, and therefore the intern was required to design these graphics and import these as
bitmap file. Figure 32 illustrates some of the bitmaps that were created, which would change
depending on the state of the pump.
Figure 32: Custom bitmap files
8.4.1
Displayed information
In order to design an effective display, an investigation was conducted into the type of
information that was displayed for the mill circuits that were already in use. The information
that was found to be necessary in the control of the mill circuits is tabulated in Table 11. The
intern was then able to decide what information to put on the new display using this table, as
well as through examination of the current mill circuit’s HMI.
53
Table 11: Information on mill circuits already in use
Details currently on Mill Circuit Displays
MILL CIRCUIT 1
Bauxite Bin Level
Tonnage today
Tonnage yesterday
Mill moisture ratio
Master (Liquor feed)
Trommel screen liquor flow rate
Screen Overs Liquor
Rod Mill kW
Ball Mill kW
Mill Discharge Tank
Classifier Feed Pump 1
Classifier Feed Pump 2
Bauxite Feedrate Wet
Bauxite Feedrate Dry
Rod mill Liquor Feedrate
Classifier Feed Flow
Spout Seal Water RM
Mill discharge tank level
Mill discharge tank V/V open
Spout Seal Water BM
Figure 33: Information and layout of running mill circuits on Plantscape
54
8.5 Problems encountered
1. EnetProto.dll errors occurred with the first version of software that the intern was
supplied with. The Dynamic Link Library (dll) is a file which contains a collection of
commands and/or data which can be shared by different programs on the same
platform. There was an error with the first version installed, in which this version
could not find the relevant dll file that it needed. After doing some research into
the .dll error and the causes, the intern searched the Power Panel directory and
found that the .dll file did not exist within the folder. This issue was then resolved
by downloading and installing an updated version of the software from the
manufacturer’s website.
2. Lack of APG graphics: The desired design is use Advanced Process Graphics (APG),
which unfortunately is not included in the Power Panel bitmap library. Due to the
software being installed on a virtual machine, there was also no way to easily
import the graphics needed from the shape library. Therefore the intern needed to
take screen shots of the relevant graphics, size them and then convert them to
bitmap format in order for them to be imported into the Power Panel library.
8.6 Progress
This project is still in progress as the intern is waiting on the Area 1 operator to arrive back
from leave so as to review the current layout of the graphics.
55
9 Internship Time Management
Time management is a vital component in successfully completing tasks on time and to a high
standard. The intern demonstrated time management skills in the following ways:
•
Creation of a time management plan at the beginning of the internship.
•
A Gantt chart, which was used by the intern to plan the time to be spent on each task,
as well as to gauge the progression of each project.
•
A work journal was kept by the intern, which helped the intern remember what had
been done on each day, as well as to measure his progress.
•
A task list was kept by the intern, which also included the priority of each task. This
enabled the intern to stay on top of his work and cross off tasks as they were
completed.
•
A daily and weekly plan were created by the intern which he would define the tasks
that he wanted to complete that specific day or week. At the end of the day the plan
was revisited so that he could gauge his performance as well as plan the tasks for the
next day.
•
Microsoft Outlook Calendar was utilised in order to remember meetings and other
scheduled events such as training.
•
Breaking projects into smaller sections allowed the intern to gain a scope of the
project, as well as being able to allocate time and resources sufficiently.
•
Creating realistic deadlines ensured that the intern did not set himself up for failure.
Throughout his time at the refinery, the intern has learnt the importance of smart and
effective time allocation in order to achieve his goals. The internship projects have created a
situation in which the intern needed to manage him time appropriately, and has therefore
assisted in developing his time management skills.
56
10 Internship Review
The internship program at BHP Billiton Worsley Alumina Pty Ltd has been a remarkably
beneficial experience for the intern, giving him an extensive amount of exposure to the field of
Process Control engineering. The projects assigned have been related to real engineering
tasks, and have allowed the intern to develop his professional, personal and engineering skills.
In addition, the intern feels that a special mention should be made about the extensive and
admirable safety culture at BHP Billiton Worsley Alumina Pty Ltd. Never has he experienced a
workplace with such a high level of safety, where the wellbeing of personnel and the
environment are put before profits and promotes a truly sustainable way of business.
During his time at the refinery the intern has been exposed to state of the art control system
technology such as Honeywell’s Experion DCS system and also ProfitSuite, a comprehensive
collection of advanced process control and optimisation products. BHP Billiton Worsley
Alumina Pty Ltd is at the forefront of Process Control technology, and the intern is grateful that
he has had the opportunity to view and interact with this impressive technology.
The intern was supplied with accommodation in Bunbury and had the chance to live in a share
house with two other students. He found this experience to be very enjoyable, and embraced
the way of life in the south west. As a whole the internship program was an exceptionally
valuable experience and has given the intern a strong base on which to build his professional
engineering career.
57
11 Conclusion
As a whole, the internship program completed at BHP Billiton Worsley Alumina Pty Ltd has
been a success, and has allowed the intern to gain important experience in the Process Control
engineering discipline. The operations at the refinery are safe, efficient and state of the art,
and have exposed the intern to the mineral processing and mining sector.
The projects undertaken have been strongly related to the Process Control discipline, and have
also given the intern an opportunity to see the day to day responsibilities of a Process Control
Engineer. In addition, the intern has been exposed to the administrative and realistic scenarios
of the work force, which include meetings, time management, time changes, scope changes as
well as unplanned engineering tasks or issues.
The internship program at BHP Billiton Worsley Alumina Pty Ltd has been excellent work
experience, and has allowed the intern to develop both personally and professionally.
58
12 Bibliography
Abnormal Situation Management Consortium. (n.d.). ASM Handout Display. Retrieved October
2010, from http://www.asmconsortium.net/Documents/ASM_Handout_Display.pdf
BHP Billiton Worsley Alumina Pty Ltd. (2003). Introductory Bayer Process Training Manual.
BHP Billiton Worsley Alumina Pty Ltd. (2004). Operator Interface Style Guide, version 1.4.
Fieldbus Foundation. (2006). Fieldbus Foundation. Retrieved September 1, 2010, from
Foundation System Technology:
http://www.fieldbus.org/index.php?option=com_content&task=view&id=45&Itemid=195
Fieldbus Specific Technical Information. (n.d.). Retrieved September 2, 2010, from fieldbus
specialists: http://www.fieldbus.com.au/techinfo.htm
Honeywell. (2007). Honeywell Experion Knowledge Builder, Version 4.5.
Honeywell International Inc. (2004). Experion PKS Serial Interface Module Implementation
Guide. .
Maynard, C. (2005, January 17). Curtin University. Retrieved September 1, 2010, from What is
Fieldbus: http://kernow.curtin.edu.au/www/Fieldbus/intro.htm
Plant Automation Services Inc. (2005, June). TuneWizard User's Guide version 3.1. Texas, USA.
Uticor Pty Ltd. (n.d.). Uticor Power Panels. Retrieved August 2010, from
http://www.uticor.com/products/operator-interface-terminals/powerpanel.html
59
Appendix 1
Literature Review
BHP Billiton Worsley Alumina Pty Ltd. (2009, September 19). Bauxite Grinding Rod and Ball
X024531,541 Piping and Instrument Diagram.
The P&ID of the mill circuit was the starting point for gaining an understanding of the
operation of the mills and its interconnections. Additionally it illustrates the
instrumentation and control systems that will be in place on the new mill circuits. This
document was not only helpful, but vital in designing the Uticor display to be used by the
field operators.
BHP Billiton Worsley Alumina Pty Ltd. (2004, June 1). Operator Training Manual OTMFAC311_001. Perth, Western Australia, Australia.
This document is the official Worsley Alumina Pty Ltd training manual that the control
room operators of Grinding Facility 024 are required to work. The document includes
information such as commonly used terminology, a process control overview, and a
Honeywell GUS overview. Additionally this manual has information on the PLC system
architecture of the plant, Alarm Management System and information about the area’s
chemistry and control philosophy. This information was exceptionally useful to the intern,
and allowed a complete understanding of even the more complex details of the grinding
facility.
Foundation, F. (2006). Fieldbus Foundation. Retrieved August 21, 2010, from Fieldbus
Foundation: http://www.fieldbus.org/
The website was used for background information on the fieldbus protocol, the foundation
fieldbus organisation as well as contributing members of the organisation. The website
also offers education and certified training courses on the protocol. This source was
helpful in a basic understanding of fieldbus, but more information on the specific details of
the protocol would have been useful.
Honeywell International Inc. (2007). Configuration Studio QuickBuilder.
QuickBuilder is a Honeywell software package that is used to configure SCADA points
within Honeywell's Configuration Studio. It is by engineers to configure points,
communication links to controllers/RTUs, stations and printers. It uses an intuitive
Windows style interface which makes it easier to use.
Honeywell International Inc. (2007). Congifuration Studio Control Builder.
60
This is the central control building environment within Honeywell's Experion package,
and provides and execution and scheduling environment where users may configure
control strategies.
Honeywell International Inc. (2004). Experion PKS Serial Interface Module Implementation
Guide.
This document is the official implementation guide released by Honeywell and therefore
has extensive information ranging from an overview about the SIM and its general
implementation considerations, as well as installation information for Modbus FTA and
Allen-Bradley FTA installation. The intern’s main use of this document were the functional
block diagrams and wiring diagrams, which were used in order to gain an understanding of
the signal flow that occurs right from the function block within the control module, all the
way to the output of the FTA device.
Honeywell International Inc. (2009). HMI Web Display Builder.
The HMI Web Display Builder is a software package developed by Honeywell that
allows easy design of HMI operator displays. It uses a "click and drag" method, and
automatically develops the HTML code for the page. Additionally the software allows
the user to attach scripts to graphics using the Visual Basic programming language.
This is very helpful if the graphic needs to change state or some other parameter
depending on the status of the point in which it details.
I&E Systems Pty Ltd. (2006). Advanced Process Management: Graphic Implementation
Guidelines.
This document was used by the intern in order to inform himself of the Advanced Process
Management guidelines in regards to Graphic implementation at BHP Billiton Worsley
Alumina Pty Ltd. The guidelines cover topics such as installation requirements, graphics
building, scripting, graphics tools, troubleshooting as well as shape naming conventions
and other standards. The document was found to be very helpful to the intern, especially
in the Powerhouse graphic proving and Uticor development projects.
Simply Modbus. (2009). Simply Modbus. Retrieved September 10, 2010, from Simply Modbus
faq: http://www.simplymodbus.ca/faq.htm
This website was used by the intern in order go gain an understanding of the Modbus and
Modbus Plus communication protocols. Some of the content included in this resource
includes Modbus basics, such as what it is and how it works. Additionally it deals with the
data storage, transfer and byte and word ordering utilized within the protocol. It gives a
very sound fundamental description of the protocol, and also contains some more
advanced terms and examples for interested users. The intern found that this was an
61
exceptionally helpful resource, which catered for a basic understanding of the protocol but
was also capable of answering more advanced queries about Modbus.
Uticor. (2005). Power Panel Software User Manual.
The Power Panel Software User manual was utilised as a starting point for using the
software, and understanding the full features that were offered in order to create a useful
HMI. The manual also offered a few examples which the intern found were very useful in
gaining experience with the software.
Visual Basic Tutor. (2008). Visual Basic Tutorial. Retrieved from
http://www.vbtutor.net/vbtutor.html
The intern utilized this resource in order to gain a grounded understanding of the
Visual Basic programming language. This programming language was needed in order
to script certain graphics in the Condensate Polishing Plant HMI project. Information
included in this resource consisted on an introduction to the language, building
applications and writing of code, working with variables within VB, program flow
controls such as If… then… Else, Select Case…End Select as well as looping and other
built in functions. This reference was found to be very useful while programming in
Visual Basic, and allowed the intern to expand his knowledge of programming
languages
62
Appendix 2
Condensate Polishing Plant HMI Visual Basic Code and Graphic
Option Explicit
'*****************************************************************************
**********************************
'This code exists to scale the SCADA value by ten in order to display correctly on CATION
PRESET & TIMER etc.
Public Sub DivideByTen(Tag, shape)
shape.value = shape.datavalue(Tag)/10
End Sub
'*****************************************************************************
**********************************
'*****************************************************************************
**********************************
'This code is used in order to enable toggling between mixed beds. All three bed's graphics are
superimposed and
'code is used to hide and reveal graphics when the relevant MB push buttons are activated.
Additionally the
'selected MB Button will be greyed out.
‘The InitBed Sub Procedure is used to decide which mixed bed to display initially, and
‘depending on the state of the points will decide which bed to reveal.
'Ricky Batista 2010
'*****************************************************************************
**********************************
Public Sub InitBed()
If textbox_MixedBed1Status.datavalue("52A4869_05.PV") = "ON" Then
Call Bed1Active()
elseIf textbox_MixedBed2Status.datavalue("52A4869_06.PV") = "ON" Then
63
Call Bed2Active()
elseIf textbox_MixedBed3Status.datavalue("52A4869_07.PV") = "ON" Then
Call Bed3Active()
End if
End Sub
Public Sub HideBed1()
MOVPH_ZS97159.style.visibility = "hidden"
MOVPH_ZS97173.style.visibility = "hidden"
MOVPH_ZS97174.style.visibility = "hidden"
MOVPH_ZS97172.style.visibility = "hidden"
MOVPH_ZS97167.style.visibility = "hidden"
MOVPH_ZS97168.style.visibility = "hidden"
MOVPH_ZS97163.style.visibility = "hidden"
MOVPH_ZS97166.style.visibility = "hidden"
MOVPH_ZS97161.style.visibility = "hidden"
MOVPH_ZS97158.style.visibility = "hidden"
MOVPH_ZS97165.style.visibility = "hidden"
MOVPH_ZS97160.style.visibility = "hidden"
MOVPH_ZS97162.style.visibility = "hidden"
MOVPH_ZS97164.style.visibility = "hidden"
MOVPH_ZS97155.style.visibility = "hidden"
MOVPH_ZS97156.style.visibility = "hidden"
MOVPH_ZS97175.style.visibility = "hidden"
MOVPH_ZS97157.style.visibility = "hidden"
MOVPH_ZS97159.style.visibility = "hidden"
64
MeterV_CI97153.style.visibility = "hidden"
textbox_MixedBed1Status.style.visibility = "hidden"
Fence_MIXEDSTS.style.visibility = "hidden"
status_XACP0021_SCD.style.visibility = "hidden"
status_XACP0036_SCD.style.visibility = "hidden"
end Sub
Public Sub HideBed2()
MOVPH_ZS97259.style.visibility = "hidden"
MOVPH_ZS97273.style.visibility = "hidden"
MOVPH_ZS97274.style.visibility = "hidden"
MOVPH_ZS97272.style.visibility = "hidden"
MOVPH_ZS97267.style.visibility = "hidden"
MOVPH_ZS97268.style.visibility = "hidden"
MOVPH_ZS97263.style.visibility = "hidden"
MOVPH_ZS97266.style.visibility = "hidden"
MOVPH_ZS97261.style.visibility = "hidden"
MOVPH_ZS97258.style.visibility = "hidden"
MOVPH_ZS97265.style.visibility = "hidden"
MOVPH_ZS97260.style.visibility = "hidden"
MOVPH_ZS97262.style.visibility = "hidden"
MOVPH_ZS97264.style.visibility = "hidden"
MOVPH_ZS97255.style.visibility = "hidden"
MOVPH_ZS97256.style.visibility = "hidden"
MOVPH_ZS97275.style.visibility = "hidden"
MOVPH_ZS97257.style.visibility = "hidden"
MOVPH_ZS97259.style.visibility = "hidden"
65
MeterV_CI001.style.visibility = "hidden"
textbox_MixedBed2Status.style.visibility = "hidden"
Fence_MIXEDSTS001.style.visibility = "hidden"
status_XACP0021_SCD001.style.visibility = "hidden"
status_XACP0036_SCD001.style.visibility = "hidden"
shape009.style.visibility = "hidden"
end Sub
Public Sub HideBed3()
MOVPH_ZS97359.style.visibility = "hidden"
MOVPH_ZS97357.style.visibility = "hidden"
MOVPH_ZS97375.style.visibility = "hidden"
MOVPH_ZS97356.style.visibility = "hidden"
MOVPH_ZS97355.style.visibility = "hidden"
MOVPH_ZS97364.style.visibility = "hidden"
MOVPH_ZS97360.style.visibility = "hidden"
MOVPH_ZS97365.style.visibility = "hidden"
MOVPH_ZS97358.style.visibility = "hidden"
MOVPH_ZS97365.style.visibility = "hidden"
MOVPH_ZS97361.style.visibility = "hidden"
MOVPH_ZS97366.style.visibility = "hidden"
MOVPH_ZS97362.style.visibility = "hidden"
MOVPH_ZS97363.style.visibility = "hidden"
MOVPH_ZS97358.style.visibility = "hidden"
MOVPH_ZS97373.style.visibility = "hidden"
MOVPH_ZS97374.style.visibility = "hidden"
MOVPH_ZS97368.style.visibility = "hidden"
66
MOVPH_ZS97367.style.visibility = "hidden"
MOVPH_ZS97372.style.visibility = "hidden"
MeterV_CI002.style.visibility = "hidden"
textbox_MixedBed3Status.style.visibility = "hidden"
Fence_MIXEDSTS002.style.visibility = "hidden"
status_XACP0021_SCD002.style.visibility = "hidden"
status_XACP0036_SCD002.style.visibility = "hidden"
shape011.style.visibility = "hidden"
end sub
Public Sub ShowBed1()
MOVPH_ZS97159.style.visibility = "visible"
MOVPH_ZS97173.style.visibility = "visible"
MOVPH_ZS97174.style.visibility = "visible"
MOVPH_ZS97172.style.visibility = "visible"
MOVPH_ZS97167.style.visibility = "visible"
MOVPH_ZS97168.style.visibility = "visible"
MOVPH_ZS97163.style.visibility = "visible"
MOVPH_ZS97166.style.visibility = "visible"
MOVPH_ZS97161.style.visibility = "visible"
MOVPH_ZS97158.style.visibility = "visible"
MOVPH_ZS97165.style.visibility = "visible"
MOVPH_ZS97160.style.visibility = "visible"
MOVPH_ZS97162.style.visibility = "visible"
MOVPH_ZS97164.style.visibility = "visible"
MOVPH_ZS97155.style.visibility = "visible"
67
MOVPH_ZS97156.style.visibility = "visible"
MOVPH_ZS97175.style.visibility = "visible"
MOVPH_ZS97157.style.visibility = "visible"
MOVPH_ZS97159.style.visibility = "visible"
MeterV_CI97153.style.visibility = "visible"
textbox_MixedBed1Status.style.visibility = "visible"
Fence_MIXEDSTS.style.visibility = "visible"
status_XACP0021_SCD.style.visibility = "visible"
status_XACP0036_SCD.style.visibility = "visible"
end Sub
Public Sub ShowBed2()
MOVPH_ZS97259.style.visibility = "visible"
MOVPH_ZS97273.style.visibility = "visible"
MOVPH_ZS97274.style.visibility = "visible"
MOVPH_ZS97272.style.visibility = "visible"
MOVPH_ZS97267.style.visibility = "visible"
MOVPH_ZS97268.style.visibility = "visible"
MOVPH_ZS97263.style.visibility = "visible"
MOVPH_ZS97266.style.visibility = "visible"
MOVPH_ZS97261.style.visibility = "visible"
MOVPH_ZS97258.style.visibility = "visible"
MOVPH_ZS97265.style.visibility = "visible"
MOVPH_ZS97260.style.visibility = "visible"
MOVPH_ZS97262.style.visibility = "visible"
MOVPH_ZS97264.style.visibility = "visible"
68
MOVPH_ZS97255.style.visibility = "visible"
MOVPH_ZS97256.style.visibility = "visible"
MOVPH_ZS97275.style.visibility = "visible"
MOVPH_ZS97257.style.visibility = "visible"
MOVPH_ZS97259.style.visibility = "visible"
MeterV_CI001.style.visibility = "visible"
textbox_MixedBed2Status.style.visibility = "visible"
Fence_MIXEDSTS001.style.visibility = "visible"
status_XACP0021_SCD001.style.visibility = "visible"
status_XACP0036_SCD001.style.visibility = "visible"
shape009.style.visibility = "visible"
end Sub
Public Sub ShowBed3()
MOVPH_ZS97359.style.visibility = "visible"
MOVPH_ZS97357.style.visibility = "visible"
MOVPH_ZS97375.style.visibility = "visible"
MOVPH_ZS97356.style.visibility = "visible"
MOVPH_ZS97355.style.visibility = "visible"
MOVPH_ZS97364.style.visibility = "visible"
MOVPH_ZS97360.style.visibility = "visible"
MOVPH_ZS97365.style.visibility = "visible"
MOVPH_ZS97358.style.visibility = "visible"
MOVPH_ZS97365.style.visibility = "visible"
MOVPH_ZS97361.style.visibility = "visible"
MOVPH_ZS97366.style.visibility = "visible"
69
MOVPH_ZS97362.style.visibility = "visible"
MOVPH_ZS97363.style.visibility = "visible"
MOVPH_ZS97358.style.visibility = "visible"
MOVPH_ZS97373.style.visibility = "visible"
MOVPH_ZS97374.style.visibility = "visible"
MOVPH_ZS97368.style.visibility = "visible"
MOVPH_ZS97367.style.visibility = "visible"
MOVPH_ZS97372.style.visibility = "visible"
MeterV_CI002.style.visibility = "visible"
textbox_MixedBed3Status.style.visibility = "visible"
Fence_MIXEDSTS002.style.visibility = "visible"
status_XACP0021_SCD002.style.visibility = "visible"
status_XACP0036_SCD002.style.visibility = "visible"
shape011.style.visibility = "visible"
end Sub
Public Sub Bed1Active()
Call ShowBed1()
Call HideBed2()
Call HideBed3()
pushbutton001.style.color = "silver"
pushbutton002.style.color = "gray"
pushbutton003.style.color = "gray"
End Sub
Public Sub Bed2Active()
Call ShowBed2()
70
Call HideBed1()
Call HideBed3()
pushbutton002.style.color = "silver"
pushbutton001.style.color = "gray"
pushbutton003.style.color = "gray"
End Sub
Public Sub Bed3Active()
Call ShowBed3()
Call HideBed1()
Call HideBed2()
pushbutton003.style.color = "silver"
pushbutton001.style.color = "gray"
pushbutton002.style.color = "gray"
End Sub
Public Sub MixedBed1Status_datachange()
'Original GUS Script listed below
'
On error goto Err_Lbl
'
'
me.textcolor = tdc_cyan
'
'
'
'
'
If param1 = true Then
me.text = "LOCKED OUT"
Else If param2 = true Then
me.text = "SERVICE"
'
Else If param3 = true Then
'
me.text = "PAUSE"
71
'
Else If param4 = true And param6 = true Then
'
me.text = "INTERUPT"
'
Exit Sub
'
Else If param4 = true Then
'
me.text = "REGEN"
'
Else If param5 = true Then
'
'
me.text = "START RECYC"
Else If param7 = true Then
'
'
me.text = "PRECYCLE"
Else
'
me.text="UNKNOWN"
'**************************** Migrated code is below
*********************************************
If textbox_MixedBed1Status.datavalue("52A4869_11.PV") = "ON" Then
textbox_MixedBed1Status.value = "LOCKED OUT"
elseIf textbox_MixedBed1Status.datavalue("52A4869_05.PV") = "ON" Then
textbox_MixedBed1Status.value = "SERVICE"
elseIf textbox_MixedBed1Status.datavalue("52A4869_14.PV") = "ON" Then
textbox_MixedBed1Status.value = "PAUSE"
elseIf (textbox_MixedBed1Status.datavalue("52A4869_08.PV") = "ON" AND
textbox_MixedBed1Status.datavalue("XACP0063_SCD.PV") = "REG_IRPT") Then
textbox_MixedBed1Status.value = "INTERRUPT"
Exit Sub
elseIf textbox_MixedBed1Status.datavalue("52A4869_08.PV") = "ON" Then
textbox_MixedBed1Status.value = "REGEN"
elseIf textbox_MixedBed1Status.datavalue("52A4870_01.PV") = "ON" Then
textbox_MixedBed1Status.value = "START RECYC"
elseIf textbox_MixedBed1Status.datavalue("52A4869_02.PV") = "ON" Then
72
textbox_MixedBed1Status.value = "PRECYCLE"
else
textbox_MixedBed1Status.value = "UNKNOWN"
End If
End sub
Public Sub MixedBed2Status_datachange()
'Original GUS Script listed below
'
On error goto Err_Lbl
'
'
me.textcolor = tdc_cyan
'
'
If param1 = true Then
'
'
me.text = "LOCKED OUT"
Else If param2 = true Then
'
me.text = "SERVICE"
'
Else If param3 = true Then
'
me.text = "PAUSE"
'
Else If param4 = true And param6 = true Then
'
me.text = "INTERUPT"
'
Exit Sub
'
Else If param4 = true Then
'
me.text = "REGEN"
'
Else If param5 = true Then
'
'
me.text = "START RECYC"
Else If param7 = true Then
'
'
me.text = "PRECYCLE"
Else
73
'
me.text="UNKNOWN"
'**************************** Migrated code is below
*********************************************
If textbox_MixedBed2Status.datavalue("52A4869_12.PV") = "ON" Then
textbox_MixedBed2Status.value = "LOCKED OUT"
elseIf textbox_MixedBed2Status.datavalue("52A4869_06.PV") = "ON" Then
textbox_MixedBed2Status.value = "SERVICE"
elseIf textbox_MixedBed2Status.datavalue("52A4869_15.PV") = "ON" Then
textbox_MixedBed2Status.value = "PAUSE"
elseIf (textbox_MixedBed2Status.datavalue("52A4869_09.PV") = "ON" AND
textbox_MixedBed2Status.datavalue("XACP0063_SCD.PV") = "REG_IRPT") Then
textbox_MixedBed2Status.value = "INTERRUPT"
Exit Sub
elseIf textbox_MixedBed2Status.datavalue("52A4869_09.PV") = "ON" Then
textbox_MixedBed2Status.value = "REGEN"
elseIf textbox_MixedBed2Status.datavalue("52A4870_02.PV") = "ON" Then
textbox_MixedBed2Status.value = "START RECYC"
elseIf textbox_MixedBed2Status.datavalue("52A4869_03.PV") = "ON" Then
textbox_MixedBed2Status.value = "PRECYCLE"
else textbox_MixedBed2Status.value = "UNKNOWN"
End If
End sub
Public Sub MixedBed3Status_datachange()
'Original GUS Script listed below
'
On error goto Err_Lbl
'
'
me.textcolor = tdc_cyan
74
'
'
If param1 = true Then
'
'
me.text = "LOCKED OUT"
Else If param2 = true Then
'
me.text = "SERVICE"
'
Else If param3 = true Then
'
me.text = "PAUSE"
'
Else If param4 = true And param6 = true Then
'
me.text = "INTERUPT"
'
Exit Sub
'
Else If param4 = true Then
'
me.text = "REGEN"
'
Else If param5 = true Then
'
'
me.text = "START RECYC"
Else If param7 = true Then
'
'
'
me.text = "PRECYCLE"
Else
me.text="UNKNOWN"
'**************************** Migrated code is below
*********************************************
If textbox_MixedBed3Status.datavalue("52A4869_13.PV") = "ON" Then
textbox_MixedBed3Status.value = "LOCKED OUT"
elseIf textbox_MixedBed3Status.datavalue("52A4869_07.PV") = "ON" Then
textbox_MixedBed3Status.value = "SERVICE"
elseIf textbox_MixedBed3Status.datavalue("52A4869_16.PV") = "ON" Then
textbox_MixedBed3Status.value = "PAUSE"
elseIf (textbox_MixedBed3Status.datavalue("52A4869_10.PV") = "ON" AND
textbox_MixedBed3Status.datavalue("XACP0063_SCD.PV") = "REG_IRPT") Then
75
textbox_MixedBed3Status.value = "INTERRUPT"
Exit Sub
elseIf textbox_MixedBed3Status.datavalue("52A4869_10.PV") = "ON" Then
textbox_MixedBed3Status.value = "REGEN"
elseIf textbox_MixedBed3Status.datavalue("52A4870_03.PV") = "ON" Then
textbox_MixedBed3Status.value = "START RECYC"
elseIf textbox_MixedBed3Status.datavalue("52A4869_04.PV") = "ON" Then
textbox_MixedBed3Status.value = "PRECYCLE"
else textbox_MixedBed3Status.value = "UNKNOWN"
End If
End sub
Public Sub TrainStatus_datachange()
'Original GUS Script listed below
'
On Error GoTo Err_Lbl
'
me.textcolor = tdc_cyan
'
If param1=true Then
'
me.text="LOCKED OUT"
'
Else
'
If param2=true Then
'
me.text="SERVICE"
'
Else
'
If param3=true Then
'
me.text="PAUSE"
'
Else
'
If param4=true And irupt=true Then
'
me.text="INTERUPT"
76
'
Exit Sub
'
Else
'
If param4=true Then
'
me.text="REGEN"
'
Else
'
If param5=true Then
'
me.text="START RECYC"
'
Else
'
If param6=true Then
'
me.text="TRANSFER"
'
Else
'
If param7=true Then
'
me.text="PRECYCLE"
'
Else
'
If param8=true Then
'
'
'
me.text="RESIN TRAIN"
Else
me.text="UNKNOWN"
'
'
End If, End If etc...
'**************************** Migrated code is below
*********************************************
If textbox_TrainStatus.datavalue("52A4866_01.PV") = "ON" Then
textbox_TrainStatus.value = "LOCKED OUT"
elseIf textbox_TrainStatus.datavalue("52A4866_10.PV") = "ON" Then
textbox_TrainStatus.value = "SERVICE"
elseIf textbox_TrainStatus.datavalue("52A4866_04.PV") = "ON" Then
77
textbox_TrainStatus.value = "PAUSE"
elseIf (textbox_TrainStatus.datavalue("52A4866_16.PV") = "ON" AND
textbox_TrainStatus.datavalue("XACP0062_SCD.PV") = "REG_IRPT") Then
textbox_TrainStatus.value = "INTERRUPT"
Exit Sub
elseIf textbox_TrainStatus.datavalue("52A4866_16.PV") = "ON" Then
textbox_TrainStatus.value = "REGEN"
elseIf textbox_TrainStatus.datavalue("52A4866_07.PV") = "ON" Then
textbox_TrainStatus.value = "START RECYC"
elseIf textbox_TrainStatus.datavalue("52A4866_13.PV") = "ON" Then
textbox_TrainStatus.value = "TRANSFER"
elseIf textbox_TrainStatus.datavalue("52A4867_03.PV") = "ON" Then
textbox_TrainStatus.value = "PRECYCLE"
elseIf textbox_TrainStatus.datavalue("52A4868_03.PV") = "ON" Then
textbox_TrainStatus.value = "RESIN TRAIN"
else
textbox_TrainStatus.value = "UNKNOWN"
End If
End Sub
*****************************************************************************
***********************
'Code used to select which description to be used within Anion and Cation Valve Selections
Sub textbox_ADESC_ondatachange
Select Case textbox_ADESC.DataValue("52A2101_017.PV")
78
Case 0
textbox_ADESC.value = "1A Not in Regen"
textbox_AVALVES.value = "None"
Case 1
textbox_ADESC.value = "Surface Wash"
textbox_AVALVES.value = "34,37"
Case 2
textbox_ADESC.value = "Drain"
textbox_AVALVES.value = "33,34,39"
Case 3
textbox_ADESC.value = "Air Scour Prep"
textbox_AVALVES.value = "31,33,34 (Dil Stn 73)"
Case 4
textbox_ADESC.value = "Air Scour"
textbox_AVALVES.value = "33,34,40 (Air Man 44,45)"
Case 5
textbox_ADESC.value = "Back Wash"
textbox_AVALVES.value = "34,43"
Case 6
textbox_ADESC.value = "Fill Up"
textbox_AVALVES.value = "33,34,43"
Case 7
textbox_ADESC.value = "Settling"
textbox_AVALVES.value = "None"
Case 8
textbox_ADESC.value = "Compression"
textbox_AVALVES.value = "35,36 (Dil Stn 79)"
Case 9
textbox_ADESC.value = "Blowing Out"
textbox_AVALVES.value = "35,36,45 (Dil Stn 79)"
Case 10
textbox_ADESC.value = "caustic Injection"
textbox_AVALVES.value = "36,38,39,41 (Dil Stn
71,73,74,76,79)"
Case 11
textbox_ADESC.value = "Displacement"
textbox_AVALVES.value = "36,39,41 (Dil Stn 73,79)"
Case 12
textbox_ADESC.value = "Rince Fast"
textbox_AVALVES.value = "35,36,45 (Dil Stn 79)"
Case 13
textbox_ADESC.value = "Wait"
textbox_AVALVES.value = "None"
79
Case 14
textbox_ADESC.value = "Recycling Rinse"
textbox_AVALVES.value = "47"
Case 15
textbox_ADESC.value = ""
textbox_AVALVES.value = ""
Case 16
textbox_ADESC.value = ""
textbox_AVALVES.value = ""
Case 17
textbox_ADESC.value = ""
textbox_AVALVES.value = ""
Case 18
textbox_ADESC.value = ""
textbox_AVALVES.value = ""
Case 19
textbox_ADESC.value = ""
textbox_AVALVES.value = ""
Case 20
textbox_ADESC.value = ""
textbox_AVALVES.value = ""
Case Else
textbox_ADESC.value = "Error"
textbox_AVALVES.value = ""
End Select
End Sub
80
81
CPP Train HMI
Appendix 3
Industry and Academic Supervisor endorsement pro forma
This is to be signed by both the industry and academic supervisor and attached to the final
report submitted for the internship.
We are satisfied with the progress of this internship project and that the attached report is an
accurate reflection of the work undertaken.
Signed:
Industry Supervisor
Signed:
Academic Supervisor
82