1
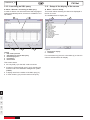
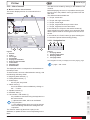
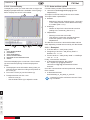
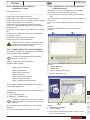
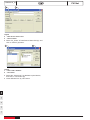
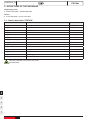
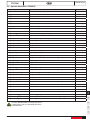
CVI Net EN CVI Net Collector / CVI Net Viewer Release 2.0 User’s Manual Original instructions. FR © Copyright 2012, Desoutter HP2 7BW UK Part no 6159932120_03 Date01/2012 Page 1 / 32 JA DE ES All rights reserved. Any unauthorized use or copying of the contents or part thereof is prohibited. This applies in particular to trademarks, model denominations, part numbers and drawings. Use only authorized parts. Any damage or malfunction caused by the use of unauthorised parts is not covered by Warranty or Product Liability. www.desouttertools.com CVI Net 6159932120_03 TABLE OF CONTENTS 1 - GENERAL INSTRUCTIONS...................... 3 1.1 - Introduction.................................................... 3 1.2 - Conditions of use........................................... 3 1.3 - Protection of the software.............................. 3 1.3.1 - Evaluation version............................................ 3 1.3.2 - Registered version........................................... 3 2 - CVI Net Collector Module............. 4 2.1 - Initiating the program..................................... 4 2.2 - Main screen.................................................... 4 2.3 - Selecting a Language.................................... 4 2.4 - General parameters....................................... 5 2.4.1 - Alias of the database........................................ 5 2.4.2 - Date format...................................................... 5 2.4.3 - Updating period for connections display.......... 5 2.4.4 - Station Synchronisation................................... 5 2.4.5 - Switch between local and shared database..... 5 2.4.6 - Database backup............................................. 5 2.5 - Events & Logs................................................ 6 2.5.1 - How to use it.................................................... 6 2.6 - Collect data.................................................... 6 2.7 - Privilege management................................... 6 2.8 - User account.................................................. 7 2.9 - Station list....................................................... 7 2.10 - Display setup................................................ 8 2.11 - Display in real time of the results.................. 8 3 - CVI Net Viewer Module..................... 9 3.1 - Initiating the program..................................... 9 3.2 - Main screen.................................................... 9 3.3 - Selecting a language...................................... 9 3.4 - General Parameters....................................... 9 3.4.1 - Alias of the database...................................... 10 3.4.2 - Date format.................................................... 10 3.4.3 - Switch between local and shared database... 10 3.5 - Events & Logs.............................................. 10 3.6 - User account................................................ 10 3.7 - Setup of the display of the results................ 11 3.8 - Display of the results.................................... 11 3.12.1 - Navigation bar.............................................. 19 3.12.2 - Curves display.............................................. 20 3.13 - Auto-archive option.................................... 20 3.13.1 - Example 1.................................................... 20 3.13.2 - Example of trace written by '-autoArchive' option............................................................. 21 3.14 - Install database for User Privileges............ 21 3.14.1 - Specific case : User privilege database on MS Access file...................................................... 21 4 - Programming the tightening controller for CVI Net................. 23 4.1 - Visualisation of CVI Net function.................. 23 5 - Structure of the database........ 24 5.1 - Station data table: STATION........................ 24 5.2 - Spindle data table: SPINDLE....................... 25 5.3 - Curve data table: CURVE............................ 27 5.4 - Table points of curve: CURVE_POINT_BLOB................................ 28 5.5 - Table of current indexes (results and curves) : MAX_ID..................... 28 5.6 - Table of the possible code kinds for the results: RESULT_TYPE............................... 28 5.7 - Table of the possible code kinds for the monitoring: MONITORING_TYPE................ 28 5.8 - Table of the error codes: ERROR_CODE............................................ 29 5.9 - Geographical filter table............................... 29 5.9.1 - WORKSHOP table......................................... 29 5.9.2 - LINE table...................................................... 29 5.9.3 - TJ_STATION_LINE table............................... 29 5.10 - Temporal filter table.................................... 29 5.10.1 - SHIFT table.................................................. 29 5.10.2 - BREAK table................................................ 29 5.11 - Table of the list of stations: STATION_NAME.......................................... 29 5.12 - Adding index on this database................... 30 5.13 - Creation scripts.......................................... 30 3.8.1 - Navigation bar................................................ 12 3.8.2 - Advanced filter............................................... 12 3.8.3 - Export to Access database............................. 14 3.8.4 - Statistics......................................................... 15 3.9 - Assembly report........................................... 17 3.10 - Launching an SQL query............................ 18 3.11 - Setup of the display of the curves.............. 18 JA DE ES FR EN 3.5.1 - How to use it.................................................. 10 3.12 - List of curves.............................................. 19 2 / 32 01/2012 CVI Net 6159932120_03 1 - GENERAL INSTRUCTIONS 1.3 - Protection of the software Only the module "CVI Net Collector" is protected by a registration code. 1.1 - Introduction This manual explains how the software which composes CVI Net: ●● CVI Net Collector ●● CVI Net Viewer The aim of this product is giving the client flexible means for collecting results through the Ethernet network, as well as an accessible and open format to store in a database acknowledged by the market. The main functions of this software are divided into modules as follows: As long as the code is not entered, the software works in evaluation mode. The module "CVI Net Viewer" can be installed and used without any limitation as it is not protected. 1.3.1 - Evaluation version CVI Net Collector ●● Collecting of results and of curves in real time through the Ethernet network in order to keep records. ●● Storage in a SQL type database with a documented format. ●● Checking of connections to the tightening controllers and display of alarms when necessary. ●● Display in real time of the collected results. CVI Net Viewer ●● Display of the results per: -- Station. -- Spindle. -- Date. -- VIN number. -- Minimum and maximum torque. -- Minimum and maximum angle -- Spindle report (all/OK/NOK). -- Minimum and maximum final torque. ●● Display of the curves. 1.2 - Conditions of use The CVI Net (Collector and Viewer) software work under Windows NT, 2000, XP, Vista, 7. These software cannot be installed under Windows 95/98, as these environments do not include the necessary elements to insure communication between modules. In evaluation mode CVI Net Collector can be run only for 90 days. After these 90 evaluation days, if you want to carry on using the software, you must ask for your registration code. To do so, you can use a standard registration form which is available as you launch the software, or through the menu "Services /Registration code". ●● Copy the registration form, fill it in and send it to CP by email ([email protected]) or by fax (+33 (0)240 802 077). ●● Each time the software is run, a message that indicates the number of remaining days before the evaluation is displayed. When the period has elapsed, a warning message is displayed: "You are not allowed to run this software". An evaluation version corresponds to the option "Kit for 10 tightening controllers". 1.3.2 - Registered version Once the "CVI Net Collector" software has been registered, the code you enter allows to determine the number of stations that can be connected. Depending on the option you have chosen, the number of stations that you can declare (see Station list) is as follows: ●● Kit for 1 tightening controller ●● Kit for 10 tightening controllers ●● Kit for 25 tightening controllers ●● Kit for 50 tightening controllers ●● Kit for 200 tightening controllers JA DE ES FR EN ●● Personal computer and tightening controllers connected through the Ethernet network. ●● The SQL compliant on line database is available from the personal computers on which the CVI Net Collector and CVI Net Viewer modules have been installed. ●● CVI Net Collector: a single instance application at a time. ●● CVI Net Viewer : several instances of the application can be launched at the same time, either on one or on several personal computers. 01/2012 3 / 32 CVI Net 6159932120_03 2 - CVI Net Collector Module Menus (2) available on the main screen: 2.1 - Initiating the program ●● ●● ●● ●● Click on menu "Start" in the Windows task bar. Move the arrow of your mouse on "Programs". Select "CVI Net" in the program's list. Click on "CVI Net Collector" to start. 2.2 - Main screen 1 Submenu Exit Station Station list (See §2.9, page 7) Results Configuration (See §2.10, page 8) Display in real time (See §2.11, page 8) ●● You can access the menus/buttons directly from the keyboard (without using the mouse) by using the [Alt] key and the keyboard shortcut (underlined letter of the menu or button). ●● The [Tab] key allows you to scroll forward through the menus/windows. ●● Pressing simultaneously the [Shift] + [Tab] keys allows you to scroll backward. 2 Menu File 8 4 6 3 7 5 9 Services Language of the software General parameters (See §2.4, page 5) Collect the data (See §2.6, page 6) Manage privileges (See §2.7, page 6) Manage your login (See §2.8, page 7) Registration code (See §1.3.2, page 3) ? About... The main screen of CVI Net Collector displays the list of stations to "listen to" (1) (controller number + IP address) as well as the status of the connection with every station. The updating of the display of the connections depends on the frequency which has been entered in the general parameters. An "Update" button" (3) does however allow you to update the display on request. To visualise the processing of the results and curves, there are 2 diodes (6, 7) on the main screen. The symbol (4) opposite is on the main screen. It shows if the module "CVI Net Collector" is waiting for results and curves, or if it doesn't process the results/ curves sent by the CVI (in this case, the symbol is crossed). See also the paragraph (See §2.6, page 6). To choose the stations to monitor, See §2.9, page 7. Legend 1 List of stations to "listen to" 2Menu 3 Update button 4Status: waiting for results and curves 5 Close button 6 Curves indicator 7 Result indicator 8 Version information 9 Database version 2.3 - Selecting a Language JA DE ES FR EN ►► Menu = Services / Language of the software You can change the language used for the menus and dialog boxes by selecting it in the list. To do this, go to the menu "Services" then "Language of the software". 6 languages are currently available: ●● English ●● French ●● German ●● Spanish ●● Chinese ●● Japanese Select your language and validate. 4 / 32 01/2012 CVI Net 6159932120_03 2.4 - General parameters 2.4.4 - Station Synchronisation Option "Send computer date and time to stations" (box to check) (8). if this option is checked, the date and time of the personal computer are sent to stations. You can enter the sending period in the data entry field "Send period" (9) (in minutes – 1 to 999). ►► Menu = Services / General parameters 1 3 2 10 5 By default: ●● Synchronisation is not selected. ●● Updating period = 60 minutes. 4 If this option is checked, make sure the equivalent option in CVIPC2000 is not checked too! 6 "Coef for FLOAT values" (10) should only be changed in case of Oracle database – or data exported from Oracle database. In fact, this is a way to avoid loss of decimal part for "float" values : ●● Each value is multiplied by coef before storage into Oracle ●● Each value is divided by coef after having been read, and before to be displayed or printed. For example, coefficient 1000 will guarantee that we keep 3 decimals for float values. This screen displays and allows to modify the following parameters: 2.4.1 - Alias of the database Corresponds to the chain of characters which was defined when installing the ODBC driver, and his alias in the utilitary "BDE Administrator". By default = "Alias_CVI_Net" "Check Alias" button (2) allows to check if the alias entered is valid and if the connection to the base is possible. 2.4.2 - Date format Selection of the display/capture format for dates. Available formats: ●● DD/MM/YYYY (by default) ●● MM/DD/YYYY ●● YYYY/MM/DD 2.4.3 - Updating period for connections display 2.4.6 - Database backup ●● Enable this option to delete the tightening results and curves from the current database and store them into an Access backup database. Older than: the tightening results and curves older than xx days will be stored into an Access database. Run every (Day): the backup will be executed every xx day. merger.exe: this is the directory where CVINet merger is installed. 01/2012 JA ●● From 1 up to 999 seconds (60 seconds by default). EN Legend 1Shared database parameters 2 Local database parameters 3 Check alias button 4 User log 5 Internal log (debug) 6 Date format 7 Updating period for connections display 8Send computer date and time to stations 9Send period 10 "Coef for FLOAT values" parameter 11 Database backup It is possible to choose between 2 ways to address data: -- Shared database (1) = access on network using DBMS (Oracle, SQL Server, MySQL,…). -- Local database (2) = MS Access file on local harddisk. ●● When "Shared database" (1) is checked, we must give alias name for database (ODBC source name), and the type of the database (MS Access, Oracle, SQL Server or MySQL). ●● When "Local database" (2) is checked, we must give full pathname for the MS Access file. This file can be done by using ‘Export to MS Access’ from shared data. ●● "Check alias" button (3) is available for both modes. It is used to check that the link to the database works. FR 11 2.4.5 - Switch between local and shared database ES 9 DE 7 8 5 / 32 CVI Net 6159932120_03 2.5 - Events & Logs 2.7 - Privilege management ●● CVI Net gives 2 levels of event Log : -- User log -- Internal log (for Debug) ●● 4 Log files are available : -- Spy_Collector.txt & Spy_Viewer.txt for "Internal Logs". -- Log_Collector.txt & Log_Viewer.txt for "User Logs". ●● Events stored in User Logs: -- "Start application". -- "Close application". -- "Connect user", with login + privilege. -- "Connect database :", with type of database / access mode / alias or pathname for local file. -- "Disconnect database". -- "Add authorization for :", with IP address of controller that has been added. -- "Remove authorization for :", with IP address of controller that has been removed. ●● Events stored in Internal Logs -- Contains information useful to analyze behavior of CVI Net (for debug only). ►► Menu = Services / Manage privileges It is preferable to implement access privilege management to protect the data from handling errors. 2 3 4 1 2.5.1 - How to use it 2 tabs are available: -- "User log" (4). -- "Internal log" (5). ●● Only administrators can modify parameters in these tabs (members and Guests can only view Log parameters) . ●● To enable Log, check "Enable" and fill in "Location" field with a valid directory. ●● It is also possible to change max size of file or the number of lines to delete each time max size is achieved. Legend 1 User privilege area 2 Add button 3 Modify button 4 Delete button The privilege management menu has an Add button (2), used to add a user to the list (1). ●● Click the Add button (2) to open the following window: 2.6 - Collect data 1 ►► Menu = Services / Collect data 1 2 The menu (2) allows to stop the option of monitoring the network. In this case, the results and curves transmited by the CVI are not processed; the connection symbol is crossed. (2). If you click again on this menu, you reactivate the monitoring of the network. The symbol of connection is then as it was at the beginning (1). Legend 1 Add an user Login ●● User name. A prompt for this user name will appear every time the software is launched. JA DE ES FR EN Legend 1 Network monitoring enabled 2 Network monitoring disabled 6 / 32 01/2012 CVI Net To skip the login window on program launch: ●● Right-click the program shortcut. ●● Click the "Properties" option. ●● Click the "Shortcut" tab. ●● In the "Target" window, add the text " -usrpsw:user_name@password" to the end of the command line. 6159932120_03 2.9 - Station list ►► Menu = Station / Station list This screen displays the list of the IP addresses of the stations to monitor: those who are allowed to communicate. 1 Name ●● User name. Privilege ●● Lets you choose the types of privilege to be assigned to the user. -- Administrator -- Member -- Guest Password ●● Lets you enter a password for the user account. A prompt will appear for this password every time the software is launched. Password confirmation ●● The password must be entered a second time to guard against typing errors. Application ●● Software for which the user account is accessible. -- CVI Net Collector -- CVI Net Viewer 2.8 - User account ►► Menu = Services / Manage your login The User Account menu is used to display information concerning the active user. 2 4 Legend 1 List of IP addresses of machines to be monitored 2 New address input area 3 Add button 4 Delete button It is possible to add a station to monitor, through entering the controller IP address (2), and then clicking on the button "Add" (3). Then there is a control to check that the number of stations to monitor is not higher than the number allowed by the chosen option (1, 10, 25, 50 or 200 stations, depending on the option), and that the controller IP address is not already on the list. In case of a mistake, a message informs the user that this adding is not possible; otherwise the list is updated with the new entry. As you exit this screen, the main window is updated depending on the addings and cancelations which have been made. JA DE ES FR EN The user account password can be modified via this menu. 3 01/2012 7 / 32 CVI Net 6159932120_03 2.10 - Display setup 2.11 - Display in real time of the results ►► Menu = Results / Setup This screen allows you to select the data which must be displayed for a follow up in real time The available data on display are: ►► Menu = Results / Display in real time 1 2 3 1 2 4 5 6 Legend 1Results 2Print button 3Exit button 4Filters 5 "Station name" Filter 6Erase button Legend 1Elements to display 2Checkbox This screen allows visualising results (1) step by step, as they are received by CVI Net Collector. The new results are shown on top of the list: in the following way, the most recent results are visualised first, however you have the possibility of consulting older results by checking the list. All the data to be displayed for a line of results is determined by the display setup screen. Filters available (4), for the "spindle" reports: ●● All. ●● OK only. ●● NOK only. Filter on station name (5): ●● If "Station name" is empty, then results for ALL controllers will be displayed. ●● If "Station name" is not empty, then only results produced by the controller will be displayed. For each element there is a checkbox (2), to check in order to select/unselect for display. EN The value entered in Station name field must match exactly a controller name. If the value doesn’t match any station name, any result won’t be displayed. JA DE ES FR The results displayed on this screen can be printed by clicking on the "Print" button from the toolbar. 8 / 32 01/2012 CVI Net 6159932120_03 3 - CVI Net Viewer Module 3.3 - Selecting a language 3.1 - Initiating the program ●● ●● ●● ●● Click on the menu "Start" from the Windows task bar. Move the arrow or your mouse up to "Programs". Select "CVI Net" in the program list. Click on "CVI Net Viewer" to start. 3.2 - Main screen 2 1 3 ►► Menu = Services / Language of the software You can change the language used for the menus and dialog boxes by selecting it in the list. To do this, go to the menu "Services" then "Language of the software". 6 languages are currently available: ●● English ●● French ●● German ●● Spanish ●● Chinese ●● Japanese Select your language and validate. 3.4 - General Parameters ►► Menu = Services / General parameters 1 3 2 7 Legend 1 CVI Net Viewer menu 2 Result display button 3 List of curves button Menus available on the main screen: Menu Submenu File Exit Results Setup (See §3.7, page 11) Display of the results (See §3.8, page 11) Assembly report (See §3.9, page 17) Curves Launch a SQL query (See §3.10, page 18) Setup (See §3.11, page 18) Curves list (See §3.12, page 19) Services Language of the software General parameters (See §3.4, page 9) Manage your login (See §3.6, page 10) About... 6 4 Legend 1Shared database parameters 2 Local database parameters 3 Check alias button 4 Date format 5 User log 6 Internal log (debug) 7 "Coef for FLOAT values" parameter JA DE ES FR EN ? 5 01/2012 9 / 32 CVI Net 6159932120_03 This screen displays and allows to modify the following parameters: 3.4.1 - Alias of the database Corresponds to the chain of characters which was defined when installing the ODBC driver, and his alias in the utilitary " BDE Administrator". By default: "Alias_CVI_Net" "Check Alias" button (2) allows to check if the alias entered is valid and if the connection to the base is possible. 3.4.2 - Date format Selection of the display/capture format for dates. Available formats: ●● DD/MM/YYYY ●● MM/DD/YYYY ●● YYYY/MM/DD By default: DD/MM/YYYY 3.4.3 - Switch between local and shared database "Coef for FLOAT values" (7) should only be changed in case of Oracle database – or data exported from Oracle database. In fact, this is a way to avoid loss of decimal part for "float" values : ●● Each value is multiplied by coef before storage into Oracle ●● Each value is divided by coef after having been read, and before to be displayed or printed. For example, coefficient 1000 will guarantee that we keep 3 decimals for float values. ●● CVI Net gives 2 levels of event Log : -- User log -- Internal log (for Debug) ●● 4 Log files are available : -- Spy_Collector.txt & Spy_Viewer.txt for "Internal Logs". -- Log_Collector.txt & Log_Viewer.txt for "User Logs". ●● Events stored in User Logs: -- "Start application". -- "Close application". -- "Connect user", with login + privilege. -- "Connect database :", with type of database / access mode / alias or pathname for local file. -- "Disconnect database". -- "Add authorization for :", with IP address of controller that has been added. -- "Remove authorization for :", with IP address of controller that has been removed. ●● Events stored in Internal Logs -- Contains information useful to analyze behavior of CVI Net (for debug only). 3.5.1 - How to use it 2 tabs are available: -- "User log" (4). -- "Internal log" (5). ●● Only administrators can modify parameters in these tabs (members and Guests can only view Log parameters) . ●● To enable Log, check "Enable" and fill in "Location" field with a valid directory. ●● It is also possible to change max size of file or the number of lines to delete each time max size is achieved. 3.6 - User account ►► Menu = Services / Manage your login It is preferable to set up a user account to protect the data from handling errors. The CVI Net Viewer user account is accessible only if created in the CVI Net Collector (See §2.7, page 6.) To skip the login window on program launch: ●● Right-click the program shortcut. ●● Click the "Properties" option. ●● Click the "Shortcut" tab. ●● In the "Target" window, add the text " -usrpsw:user_name@password" to the end of the command line. The User Account menu is used to display information concerning the active user. The user account password can be modified via this menu. JA DE ES FR EN It’s possible to choose between 2 ways to address data: -- Shared database (1) = access on network using DBMS (Oracle, SQL Server, MySQL,…). -- Local database (2) = MS Access file on local harddisk. ●● When "Shared database" (1) is checked, we must give alias name for database (ODBC source name), and the type of the database (MS Access, Oracle, SQL Server or MySQL). ●● When "Local database" (2) is checked, we must give full pathname for the MS Access file. This file can be done by using ‘Export to MS Access’ from shared data. ●● "Check alias" button (3) is available for both modes. It is used to check that the link to the database works. 3.5 - Events & Logs 10 / 32 01/2012 CVI Net 6159932120_03 3.7 - Setup of the display of the results 3.8 - Display of the results ►► Menu = Results / Setup This screen allows to choose the data to display for the tightening results. The available data on display are: ►► Menu = Results / Display of the results 1 1 2 7 11 Legend 1 Elements to display 2Checkbox For each element there is a checkbox (2) to check in order to select/unselect for display. 13 4 14 5 6 8 9 3 12 2 10 Legend 1Results 2Filters 3 Curve type 4Print button 5 Display curves button 6 Export to text file button 7 Export to MSAccess file button 8Statistics button 9 Close button 10 Navigation bar 11Search button 12 Advanced filters button 13 Curve information available 14Tightening NOK information The columns shown here depend on the setup selected on the previous screen. FR ES DE JA To select results, we have a filter/selection area (2), with the following data entry fields: ●● Beginning date and time (**) ●● Ending date and time (**) ●● Filter on the spindle report -- All, only OK, Only NOK. ●● Station name (*) -- List of the station names available by clicking on the "…" button. ●● Spindle comment (*) ●● ISAGRAF field (*) ●● Part number / VIN number (*) -- It is possible to enter data using the keyboard or a bar code scanner. EN ●● The pictogram (13) indicates that a curve is available for the result. ●● The pictogram (14) indicates a tightening NOK report. 01/2012 11 / 32 CVI Net 6159932120_03 (*) Alphanumeric data, which can be filtered using the joker*. (**) The starting/ending time can only be entered when the starting date and the ending date are equivalent. The "Search" button (11) launches a query in the database, to update the list of results depending on the filters. The data can be sorted by clicking on the headers of the columns. It is possible to select one or several results [Clic]+ [Ctrl], to launch the display of the curves associated, clicking on the button (5) in the tool bar. Before the display of the curve, it is possible to choose the kind of curve in the pulldown menu (3). The different kinds available are: ●● Torque versus time. ●● Torque and angle versus time. ●● Torque versus angle. ●● Torque, angle and final torque versus time. ●● Torque, angle and current versus time. In the tool bar, the "Export to the text file" button (6) opens a dialog box which allows you to enter the name and the path of a file for receiving the list of the results as text. In the tool bar, the "Print" button (4) opens a dialog box to choose the printer before starting printing. 3.8.1 - Navigation bar 1 2 3 4 Legend 1 First page button 2Previous page button 3 Next page button 4 Last page button The navigation bar lets you display the results page by page. The advanced filter lets you monitor productivity by work session. 1 FR ES DE JA 2 5 4 3 6 8 9 10 7 11 Legend 1Site window 2Edit sites button 3Selected teams window 4Team window 5Edit teams button 6 Display team report button 7SQL code window display button 8 "Date and time" search 9 "Day of the week" search 10 "Part number" search 11 "Search" button Advanced filters screen allows to fuse several types of filters : ●● Search results using date & time (8). ●● Search using Teams : Drag & Drop one or more teams (4) into "Selected teams" (3). -- "Teams" are an easy way to define interval time to search results. -- A "Team" can have up to 6 breaks : in that case, results returned by a "Team search" are the ones between Start and End, but excluding those done during the break(s). See "To create / manage teams", page 14. ●● Search using day of the week (9). "Day of week" criteria is not available with MS Access database. In that case, all check boxes are disabled. EN 1 page = 100 results. 3.8.2 - Advanced filter ●● Search using "Area selection" : Drag&Drop line(s) or workshop(s) into selection list (3). ●● Search using Part number (10): -- Interval : search part number between "Start" and "End". -- Regular expression: search part number using special characters "*" and "?". Once conditions have been set, search is launched by clicking on "Search" button (11). 12 / 32 01/2012 CVI Net 6159932120_03 To manage site/ workshops / lines ●● Click the "Edit" button (2). ●● The following window is displayed: Results are displayed on "Basic search" screen (12). 12 13 14 15 16 18 Then we can print, export, or launch statistics on this set of results. In case of search using advanced filters, "Basic" filters are not taken into account. Shift Report ●● Click the "Display team report" button (6). This screen allows to create / rename workshops and lines. ●● To add a Workshop to a Site: -- Right-click the Site (13). -- Click the command "Add a workshop". ●● To add a line to a workshop: -- Right-click the workshop (14). -- Click the command "Add a line". ●● To delete a station from a line: -- Right-click the station to be deleted (16). -- Click the command "Delete". ●● To add a station to a line: -- Select a station from the list (18). -- Drag/Drop the station to the required line. ●● To allocate stations to lines: -- Click on "Search in database" button (17) to refresh the list of available stations (This list will give non-assigned stations). -- Drag&drop station, to assign to a line. JA DE ES FR ●● Available information : -- Start and end [Date & time] : search time interval. -- Daytime : selected days for this search. -- For each selected team, number of OK results, number of NOK results, ratio for NOK results. Legend 13 List of sites 14 List of workshops 15 List of lines 16 List of stations 17Search in database button 18 Available tightening units window EN Legend 12 "Basic search" screen 17 01/2012 13 / 32 CVI Net 6159932120_03 3.8.3 - Export to Access database To create / manage teams ●● Click the "Edit" button (5). ●● The following window is displayed: This function allows to store in an Access file, all results that have been selected. Then, this Access file will be used as local database (see Switch in database). 19 20 7 Legend 7 Export to MSAccess file button After having launched a request containing at least one result, click on "Access" button (7) in the toolbar. 21 Legend 19 List of teams 20Editing area 21 Delete button 23 ●● To add a new Team, fill in : -- Name for the new team. -- Time interval (Start & End). -- Optional : start and end for breaks (up to 6 breaks). ●● To Modify an existing Team : -- Select the cell to change. -- Modify current value. -- Click on "OK" button. ●● To delete an existing Team : -- Select team name cell. -- Press "DEL" key on keyboard. -- Click on "OK" button, to confirm. To display a team report: ●● Click the "Display team report" button (6). ●● The following window is displayed: 24 Legend 23 Name for the MSAccess file 24 "Save" button ●● Enter folder and name for the MSAccess file (23) (.mdb) ●● Click on "Save" button (24) to export MSAccess file. ●● The file is now ready to be read as local database. Legend 22Print button ●● Click the "Print" button (22) to print the report. JA DE ES FR EN 22 14 / 32 01/2012 CVI Net 6159932120_03 3.8.4 - Statistics ●● Click on "Values" tab (26) to check list of results that will be taken into account. This function allows to calculate statistics. The maximum number of results that can be taken into account : up to 100 000. 28 Function "Statistics" is not available from advanced filters search. 8 Legend 8Statistics button Once having launched a search and got at least 1 result, click on "Statistics" button (8) in toolbar. 25 26 27 Legend 28 list of results ●● Click on "Statistics" tab (27) to display main statistical results. Legend 25 "General" tab 26 "Values" tab 27 "Statistic" tab Legend 29 "Graphical display" button 30 "Control chart" button 31 "Histogram" button JA DE From that screen it’s possible to access to following graphs : -- Scatter chart (graphical display) (29). -- Control chart (30). -- Histogram (distribution) (31). EN 31 FR 30 ES 29 01/2012 15 / 32 CVI Net 6159932120_03 Graphical display ●● Click on "Graphical display" button (29) to display the following graphic: 32 33 Legend 32 Navigation bar 33 "Print" button ●● Use the navigation bar (32) to move the scale. ●● Use "Print" button (33) to print the graphic. ●● Use "Range" button (36) to display the "Range" screen : 38 Legend 38 "Range" curve display ●● Use "Standard deviation" button (37) to display the "Standard deviation" screen : 39 Control chart ●● Click on "Control chart" button (30) to display the following graphic: Legend 39 "Standard deviation" curve display 35 36 37 Legend 34 Navigation bar 35 "Print" button 36 "Range" button 37 "Standard deviation" button ●● Use the navigation bar (34) to move the scale. ●● Use "Print" button (35) to print the graphic. JA DE ES FR EN 34 16 / 32 01/2012 CVI Net 6159932120_03 Histogram ●● Click on "Histogram" button (31) to display the following graphic: 42 40 3.9 - Assembly report ►► Menu = Results / Assembly report 1 41 Legend 40 "Tolerance" button 41 "Print" button 42Tolerance line This screen is similar to the result display screen (See §3.8, page 11), but with a few differences: ●● the filter area has two data entry fields for "Part number / VIN number". -- It is possible to enter data using the keyboard or using a bar code scanner. ●● The filter area does not include "Apply" button and the search for the tightening results is launched as soon as the VIN number is entered. ●● The option "Automatic printing" allows to start printing a report as soon as you get display on screen; consequently, you do not have to click on the toolbar button. ●● The option "Print the number of results" allows adding at the end of the edition the number of OK results, the number of NOK results and the total number of results. ●● 2 data entry fields allow adding 2 lines of comments when editing the assembly report. ●● The option "Export to the text file" allows to save a report as soon as you get display on screen; consequently, you do not have to click on the toolbar button. Select the location of the record of the report. JA DE ES FR EN ●● Use "Print" button (41) to print the graphic. ●● Use the "Tolerance" button (40) to display the "Tolerance" line (42). Legend 1 Assembly report 01/2012 17 / 32 CVI Net 6159932120_03 3.10 - Launching an SQL query 3.11 - Setup of the display of the curves ►► Menu = Results / Launching an SQL query In order to allow a user who knows the SQL language to make personalised queries, a screen is available in CVI Net Viewer. ►► Menu = Curves / Setup This screen allows selecting the data to be displayed in the list of curves. The available data on display are: 2 1 4 3 2 5 1 Legend 1 Elements to display 2Checkbox Legend 1SQL code input area 2Start button to execute SQL query 3 Result display area 4Print button 5Erase button For each element (1) there is a checkbox (2) to check in order to select/unselect for display. JA DE ES FR EN This screen shows: ●● An entry field (1) for the SQL code to execute. ●● A button to "Execute SQL query" (2) for sending the entered code to the database management system (DBMS). ●● A display area for the results of the SQL query (3). ●● A "Print" button (4) to print the result of the query. 18 / 32 01/2012 CVI Net 6159932120_03 3.12 - List of curves The data can be sorted by clicking on the headers of the columns. Before displaying the curve, it is possible choosing the kind of curve in the pulldown menu (3) located over the filter area. The different kinds available are: ●● Torque versus time. ●● Torque and angle versus time. ●● Torque versus angle. ●● Torque, angle and final torque versus time. ●● Torque, angle and current versus time. In the tool bar, the "Export to the text file" button (6) opens a dialog box which allows you to enter the name and the path of a file for receiving the list of the curves as text. In the tool bar, the "Print" button (4) opens a dialog box to choose the printer before starting printing. ►► Menu = Curves / List of curves This screen displays the list of curves stored in the database. 1 8 4 5 6 7 3.12.1 - Navigation bar 1 3 Legend 1 First page button 2Previous page button 3 Next page button 4 Last page button Legend 1Results 2Filters 3 Curve type 4Print button 5 Display curves button 6 Export to text file button 7 Close button 8 Navigation bar 9Search button The navigation bar lets you display the curves page by page. 1 page = 100 curves. The displayed column corresponds to checked data on the setup screen. To select results, we have a filter/selection area (2), with the following data entry fields: ●● Beginning date and time (**) ●● Ending date and time (**) ●● Global report -- All, Only OK, Only NOK. ●● Station name (*) -- List of the station names available by clicking on the "…" button. ●● Spindle comment (*) ●● ISAGRAF field (*) ●● Part number / VIN number (*) -- It is possible to enter data using the keyboard or a bar code scanner. DE ES (*) alphanumeric data, which can be filtered using the joker * (**) the starting/ending time can only be entered when the starting date and the ending date are equivalent. JA The "Search" button (9) launches a query in the database, to update the list of curves depending on the filters. 01/2012 4 EN 9 3 FR 2 2 19 / 32 CVI Net 6159932120_03 3.12.2 - Curves display To display the curves, you must select the curve(s) to be displayed (multiple selection is available: click on [Ctrl]) + button "Display the curves" in the toolbar. 6 1 3.13 - Auto-archive option CVI Net Viewer provides a new command line : ●● -autoArchive:firstDate@nbOfDays@"[archive fullpathname]" This option is used to easily archive a set of results. This option takes 3 parameters : ●● firstDate: -- Beginning of interval, (beginning time = 00:00:00) => nb of days between current date and first day to consider (See 3.13.1). ●● nbOfDays: -- Number of days for the time interval to archive (ending time = 23:59:59) (See 3.13.1). ●● fullpathname: -- Directory to store the archive-file. -- This directory must exists, and the parameter must have quotes in case of blank in the fullpathname. 5 4 3 2 Legend 1 Curve display window 2Print button 3 Curve slide buttons 4 Cursor control buttons 5 Displayed curves information area 6Cursor 3.13.1 - Example 1 ●● If current date is = "27th january 2008"; ●● If beginning of archive = "8th january 2008" => firstDate = 27 - 8 = 19 ●● If end of archive = "20th january 2008" => nbOfDays = 20 - 8 + 1 = 13 Finally, command-line would be : ●● C:\Desoutter\CVI Net\CVI_Net_Viewer. exe -usrpsw:myLogin@myPassword -autoArchive:19@13@"C:\Desoutter\CVI Net\ Archives" Once this command-line has been performed, following file is created : ●● C:\Desoutter\CVI Net\ Archives\2008_01_08_2008_01_20.mdb '-autoArchive' option would trace events if "User log" is enabled. JA DE ES FR EN The screen displaying the curves has a "Print" button" (2) which launches printing of what is displayed on screen. ●● The displayed curves information area (5) lets you view the current values according to the position of the cursor (6). ●● To move the cursor (6), use the buttons (4). ●● To adjust the time axis of a curve: -- Select a curve (5). -- Use the slide buttons (3) to adjust the scale. The filename for archive is built with first date and last date, depending on date format used by CVI Net Viewer. 20 / 32 01/2012 CVI Net 6159932120_03 3.13.2 - Example of trace written by '-autoArchive' option 3.14.1 - Specific case : User privilege database on MS Access file 2008/11/28 15:05:00 -----------------------------------------------------------------------2008/11/28 15:05:00 Start application 2008/11/28 15:05:00 Connect user sbu (Admin) 2008/11/28 15:05:00 Connect database: [Type = Oracle] [Mode = Shared] [Alias =cvi oracle XE] 2008/11/28 15:05:00 Application started with option -autoArchive:3251@13@D:\Appli\Prj\CVI_Net\archives\ test export auto 2008/11/28 15:05:00 Export successfully done to Access file : D:\Appli\Prj\CVI_Net\archives\test export auto\2000-0104_2000-01-16.mdb 2008/11/28 15:05:00 Disconnect database 2008/11/28 15:05:00 Close application We provide a ready-to-use MS Access file, available after Viewer or Collector has been installed : ●● File = [Viewer or Collector directory]\Schema\Users. mdb This file should be copied into a folder that is readable by every users. Finally, "CVI_Users" ODBC link must be create on each PC. Example : Control Panel\Administrative Tools\ Data Sources (ODBC) : 1 2 '-autoArchive' option will close application after having processed, whatever the result of the exportation (succeeded or failed). 3.14 - Install database for User Privileges To be able to manage user privileges, we must install a dedicated MS ACCESS database. This MS ACCESS database is automatically installed with CVI NET. Script to create user privilege database: CREATE TABLE USERS ( USER_Login varchar(50), USER_Application int, USER_Name varchar(50), USER_Privilege int USER_Password varchar(32), USER_Creation timestamp USER_LastPwdChange timestamp ) ALTER TABLE USERS ADD PRIMARY KEY (USER_ Login,USER_Application); Legend 1 "System DNS" tab 2 "Add" button ●● Click on “System DSN” tab (1). ●● Click on “Add” button (2). This login + password is "hard-coded’ in CVI Net Viewer and Collector, to access to user privilege database. 01/2012 4 Legend 3 Microsoft Access driver 4 "Finish" button DE 3 ●● Select “Driver do Microsoft Access (*.mdb)” (3) and click “Finish” (4) button. JA We must also create an ODBC link on user privilege database. The name for this ODBC link must be ‘CVI_Users’. ES FR EN Following user must be authorized to read records into the database : ●● Login:“USERDB_Login” ●● Password: “USERDB_Pwd” 21 / 32 CVI Net 6159932120_03 6 5 Legend 5 "Data Source Name" field 6 "Select" button ●● Write “CVI_Users” in Data Source Name field (5), and click on “Select" (6) button. 7 8 Legend 7 "Users.mdb" database 8 "OK" button JA DE ES FR EN ●● Select the “Users.mdb” (7) database copied before, and click on “OK” button (8). ●● Close different form by “OK” button. 22 / 32 01/2012 CVI Net 6159932120_03 4 - Programming the tightening controller for CVI Net 4.1 - Visualisation of CVI Net function Key [F1] on previous screen allows the operator to access a maintenance screen on which certain data can be displayed in real time (updated filling rate of storage memory of results, connection of CVI, locking on of CVI…). CVI includes a new programming screen dedicated to communicate with CVI Net (provided that the CVI is equipped with an Ethernet card). That screen is available through: ►► Parameters / Peripherals / Network Data Collector This screen allows to program the following options: sending results: ●● Yes / No sending curves OK: ●● Yes / No (not available for multi-CVI). sending curves NOK: ●● Yes / No (not available for multi-CVI). Alarm threshold : XXX% ●● This variable allows to specify the filling rate of the memory which launches the updating of a variable which is available through ISAGRAF. ●● This threshold is programmed as %. ●● As soon as the filling rate of the FIFO goes over this threshold, an alarm can be operated through a specific ISAGRAF application. ●● This alarm warns the operator that the data collection is not working properly any longer. The operator has time enough to take action but does not always have to stop production. Time synchronisation: ●● The time of each controller can slightly vary with time. ●● This is why it might be advisable synchronising the hour of all the controllers. ●● However, this functionality can also be fulfilled by the CVIPC2000 software. This software programs data and collects results. Another PLC could do the same. FR The sending of curves is not available for the multi-CVI. JA DE ES ●● as curves share the same storage space as tightening results, if the sending options of the curves are checked, time of disconnection before saturation of storage memory shall decrease considerably. ●● Curves are send in standard format: composed of 500 points maximum. 01/2012 EN Locking on when FIFO is full : Yes / No ●● Allows to specify the action to take when the storage memory of results is full: -- When locking on = yes, then launching a new cycle is blocked. "Ready" of the controller becomes "0", and controls "Start Cycle Tightening" are rejected. An error message is displayed on the control screen. -- When locking on = no, you can launch a cycle but the new tightening will not be saved. 23 / 32 CVI Net 6159932120_03 5 - Structure of the database Tightening results: ●● Station data table + Spindle data table. Curves : ●● Curve data table + Curve point table. 5.1 - Station data table: STATION Field Description Type STA_ResultID Result identifier (self-incremental) *INTEGER STA_ResultNumber Result number = 0 to 65535 INTEGER STA_StationNumber Station number = 1 or 2 SMALLINT STA_Report "OK" / "NOK" VARCHAR(3) STA_VIN Vehicle identification number VARCHAR(30) STA_CycleNumber Cycle number = 1 to 250 SMALLINT STA_CycleOKProgrammed Number of OK cycles programmed- 1 to 999 SMALLINT STA_CycleOKCount Count of number of cycles OK -0 to 999 SMALLINT STA_TorqueUnit Torque unit: Nm=0/ FtLb=1 / InLb=2 / Kgm=3 / Kgcm=4 SMALLINT STA_StationName Station name VARCHAR(12) STA_StationComment Station comments VARCHAR(26) STA_SpindleCount Number of spindles = 1 to 32 SMALLINT STA_DateTime Tightening(s) date and time TIMESTAMP STA_CycleComment Cycle comments VARCHAR(40) JA DE ES FR EN Field STA_ResultID is the primary key of the STATION table. 24 / 32 01/2012 CVI Net 6159932120_03 Description Type SPI_ResultID Result identifier (foreign key) *INTEGER SPI_SpindleNumber Spindle number = 1 to 32 *oSMALLINT SPI_PhaseNumber Phase number = 0 to 20 SMALLINT SPI_SpindleSerialNumber Spindle serial number VARCHAR(10) SPI_SpindleComment Spindle comment VARCHAR(15) SPI_BoltNumber Bolt number = 3 characters VARCHAR(3) SPI_Isagraf Field for Isagraf VARCHAR(40) SPI_ErrorCode Allows to codify errors (3) SMALLINT SPI_ServoDriveError Error code for servo drive fault SMALLINT SPI_ResultType Allows to decode type of result (1) SMALLINT SPI_SpindleReport Report per spindle = "" / "OK" / "NOK" VARCHAR(3) SPI_TorqueAccuracy Accuracy for torque values (number of decimals) SMALLINT SPI_TorqueTarget Torque target NUMERIC(9,3) SPI_TorqueMinTolerance Torque minimum tolerance NUMERIC(9,3) SPI_TorqueMaxTolerance Torque maximum tolerance NUMERIC(9,3) SPI_FinalTorque Final torque = torque result NUMERIC(9,3) SPI_InfTorque Inferior prevailing torque measured NUMERIC(9,3) SPI_SupTorque Superior prevailing torque measured NUMERIC(9,3) SPI_AngleThreshold Torque launching angular count (of the last phase) NUMERIC(9,3) SPI_TorqueTrend Torque trend = No result=0 /weak=1 / strong=2 / good=3 SMALLINT SPI_AngleTarget Angle target NUMERIC(9,3) SPI_AngleMinTolerance Angle minimum tolerance NUMERIC(9,3) SPI_AngleMaxTolerance Angle maximum tolerance NUMERIC(9,3) SPI_FinalAngle Final angle = angle result NUMERIC(9,3) SPI_AngleTrend Angle trend = No result=0 /weak=1 / strong=2 / good=3 SMALLINT SPI_TorqueRateTarget Torque rate target in % (integer between 1 and 100) NUMERIC(9,3) SPI_TorqueRateMinTolerance Torque rate minimum tolerance NUMERIC(9,3) SPI_TorqueRateMaxTolerance Torque rate maximum tolerance NUMERIC(9,3) SPI_FinalTorqueRate Final torque rate = torque rate result NUMERIC(9,3) SPI_TorqueRateTrend Torque trend = No result=0 /weak=1 / strong=2 / good=3 SMALLINT SPI_MinCurrent Minimum current measured NUMERIC(9,3) SPI_MaxCurrent Maximum current measured NUMERIC(9,3) SPI_FinalCurrent Final current = current result NUMERIC(9,3) SPI_CurrentTrend Current trend = No result=0 /weak=1 / strong=2 / good=3 SMALLINT SPI_MonitoringType Monitoring type (2) SMALLINT SPI_Monitoring1Trend Monitoring trend 1 → none=0 /weak=1 / strong=2 / good=3 SMALLINT SPI_Monitoring2Trend Monitoring trend 2 → none=0 /weak=1 / strong=2 / good=3 SMALLINT JA DE ES The SPI_ResultID field is a foreign key and it corresponds to the STA_ResultID field of the STATION table. FR Field EN 5.2 - Spindle data table: SPINDLE 01/2012 25 / 32 CVI Net 6159932120_03 (1) Type of results/see also the RESULT_TYPE table: 1Search sequence 2 RunDown speed 3 Default phase 4Prevailing torque phase 20Torque-controlled tightening 21Torque-controlled tightening + angle 22Torque-controlled tightening + angle + tension 23 Torque-controlled tightening + angle + final torque 24 Angle-controlled final speed phase 25 Angle-controlled final speed phase + tension 26Tension-controlled tightening + torque + angle 27Yield point-controlled tightening 28Tension-controlled tightening + yield point 29 Clamping tightening 30 Angle-controlled final speed phase + final torque 40Torque-controlled loosening 41Torque-controlled loosening + angle 42 Angle-controlled run reverse + torque (2) Monitoring types/see also the MONITORING_ TYPE table: 0None 1 Current (monitoring 1 = A) 2Tension 3Toque (Monitoring 1=+/-%) 4Torque & Angle (Monitoring 1=+/-%, Monitoring 2=+/-°) (3) Error codes/see also the ERROR_CODE table: JA DE ES FR EN 0x0001 Reject for grouped spindle 0x0002 Down start cycle 0x0004 Maximum time reached 0x0008Torque or maximum spindle current reached 0x0010 Cycle non finished 0x0020 Default of synchronisaton between controllers 0x0040External stop detected 0x0080 Internal stop 26 / 32 01/2012 CVI Net 6159932120_03 5.3 - Curve data table: CURVE Field Description Type CRV_CurveID Curve Identifier - + 1 self-incremental *INTEGER CRV_ResultNumber Result number = 0 to 65535 INTEGER CRV_StationNumber Station number = 1 or 2 SMALLINT CRV_SpindleNumber Spindle number = 1 to 32 SMALLINT CRV_CycleNumber Cycle number = 1 to 250 SMALLINT CRV_Report Global report= "OK" / "NOK" VARCHAR(3) CRV_TorqueUnit Torque unit: Nm=0/ FtLb=1 / InLb=2 / Kgm=3 / Kgcm=4 SMALLINT CRV_TorqueAccuracy Accuracy for torque values (number of decimals) SMALLINT CRV_Datetime Date and time of registration of the curve TIMESTAMP CRV_TorqueThreshold Torque threshold of the curve NUMERIC(9,3) CRV_PointDuration Duration for 1 point of the curve, in micro-seconds SMALLINT CRV_VIN Vehicle identification number VARCHAR(30) CRV_StationName Station name VARCHAR(12) CRV_StationComment Station comments VARCHAR(26) CRV_SpindleComment Spindle comments VARCHAR(15) CRV_SpindleSerialNumber Spindle serial number VARCHAR(10) CRV_BoltNumber Bolt number VARCHAR(3) CRV_Isagraf Field for Isagraf VARCHAR(40) CRV_CurveType Measurements type registered SMALLINT CRV_PointCount Count of points in the curve SMALLINT Field CRV_CurveID is the primary key of table CURVE. JA DE ES FR This relation can be written in SQL-language: SELECT CRV_CurveID FROM CURVE, STATION, SPINDLE WHERE (STA_ResultID = :ResultID) AND (SPI_SpindleNumber = :SpindleNumber) AND (SPI_ResultID = STA_ResultID) AND (CRV_SpindleNumber = SPI_SpindleNumber) AND (CRV_ResultNumber = STA_ResultNumber) AND (CRV_StationName = STA_StationName) AND (CRV_DateTime = STA_DateTime); EN a curve is linked to a result by this composed relation: STA_ResultNumber <-> CRV_ResultNumber STA_StationName <-> CRV_StationName SPI_SpindleNumber <-> CRV_SpindleNumber STA_DateTime <-> CRV_DateTime 01/2012 27 / 32 CVI Net 6159932120_03 5.4 - Table points of curve: CURVE_POINT_BLOB Field Description Type CRVPT_CurveID Curve identifier (foreign key) INTEGER CRVPT_BlobFormat Format code for Blob field SMALLINT CRVPT_Points Blob containing points data BLOB Data for each point, in CRVPT_Points filed, for the type 1 (CRVPT_BlobFormat) . Data Type Size in bytes Index for point (index = 1, for first point) Short 2 Torque value Double 8 Angle value Double 8 Torque rate value Double 8 Current value Double 8 Marker value (1) Short 2 (1) 0x0001 = Start of prevailing torque. 0x0002 = Motor stop. 0x0004 = Angle threshold. 5.5 - Table of current indexes (results and curves) : MAX_ID Field Description Type MAXID_TableName Name of table VARCHAR(50) MAXID_CurrentMaxId Current ID value INTEGER 5.6 - Table of the possible code kinds for the results: RESULT_TYPE Field Description Type RSLT_ResultTypeID Result type ID INTEGER RSLT_ResultTypeLabel Result type label VARCHAR(100) This table is fully completed during installation with script. Field Description Type MNTG_MonitoringTypeID Monitoring type ID INTEGER MNTG_MonitoringTypeLabel Monitoring type label VARCHAR(100) This table is fully completed during installation with script. JA DE ES FR EN 5.7 - Table of the possible code kinds for the monitoring: MONITORING_TYPE 28 / 32 01/2012 CVI Net 6159932120_03 5.8 - Table of the error codes: ERROR_CODE Field Description Type ERRCD_ErrorID Error ID INTEGER ERRCD_ErrorLabel Error label VARCHAR(100) This table is fully completed during installation with script. 5.9 - Geographical filter table 5.9.1 - WORKSHOP table Field Description Type WKS_Id Internal workshop ID * INTEGER WKS_Label Workshop name VARCHAR(50) Field Description Type LIN_Id Internal line id * INTEGER LIN_Label Line name VARCHAR(50) WKS_Id ID of the workshop owning the line INTEGER 5.9.2 - LINE table 5.9.3 - TJ_STATION_LINE table Field Description Type TJS_Id Internal join ID * INTEGER STA_StationName Station name VARCHAR(50) LIN_Id ID of the line owning the station INTEGER Champ Description Type SH_Id Internal shift ID * INTEGER SH_Label Shift name VARCHAR(50) SH_StartTime Start time of the shift TIMESTAMP SH_EndTime End time of the shift TIMESTAMP Field Description Type BR_Id Internal break ID * INTEGER BR_Start Break start time TIMESTAMP BR_End Break end time TIMESTAMP SH_Id ID of shift containing the break INTEGER 5.10 - Temporal filter table 5.10.1 - SHIFT table Description Type STANAME_Name Station name VARCHAR(12) FR JA Field DE ES 5.11 - Table of the list of stations: STATION_NAME EN 5.10.2 - BREAK table 01/2012 29 / 32 CVI Net 6159932120_03 5.12 - Adding index on this database To improve query performances in CVI Net Viewer, we recommend to add following index : STATION table CREATE INDEX STA_STATIONNAME_IDX ON STATION (STA_StationName); CREATE INDEX STA_DATE_RSLTNB_NAME_IDX ON STATION (STA_DateTime, STA_ResultNumber, STA_ StationName); SPINDLE table CREATE INDEX SPI_SPINDLE_ID_IDX ON SPINDLE (SPI_ResultID, SPI_SpindleNumber); 5.13 - Creation scripts JA DE ES FR EN The basic creation scripts can be found on the CDRom supplied by Desoutter. 30 / 32 01/2012 More Than Productivity www.desouttertools.com © Copyright 2011