1
FUJITSU SEMICONDUCTOR
CONTROLLER MANUAL
CM25-00324-5E
2
F MC-8L/8FX FAMILY
SOFTUNETM Workbench
USER'S MANUAL
F2MC-8L/8FX FAMILY
SOFTUNETM Workbench
USER'S MANUAL
FUJITSU SEMICODUCTOR LIMITED
PREFACE
■ What is the SOFTUNE Workbench?
SOFTUNE Workbench is support software for developing programs for the F2MC-8L/8FX family of
microprocessors / microcontrollers.
It is a combination of a development manager, simulator debugger, emulator debugger, monitor debugger,
and an integrated development environment for efficient development.
Note: F2MC stands for FUJITSU Flexible Microcontroller.
■ Purpose of this manual and target readers
This manual explains functions of SOFTUNE Workbench.
This manual is intended for engineers designing several kinds of products using SOFTUNE Workbench.
■ Trademarks
SOFTUNE is a trademark of Fujitsu Semiconductor Limited, Japan.
Windows is registered trademarks of Microsoft Corporation in the U.S. and other countries.
Other company names and products names are trademarks or registered trademarks of their respective
companies.
■ Organization of Manual
This manual consists of 2 chapters.
CHAPTER 1 BASIC FUNCTIONS
This chapter describes the basic functions on the SOFTUNE Workbench.
CHAPTER 2 DEPENDENCE FUNCTIONS
This chapter describes the functions dependent on F2MC-8L/8FX family MCU.
i
•
•
•
•
•
•
•
The contents of this document are subject to change without notice.
Customers are advised to consult with sales representatives before ordering.
The information, such as descriptions of function and application circuit examples, in this document are presented solely for the
purpose of reference to show examples of operations and uses of FUJITSU SEMICONDUCTOR device; FUJITSU
SEMICONDUCTOR does not warrant proper operation of the device with respect to use based on such information. When you
develop equipment incorporating the device based on such information, you must assume any responsibility arising out of such
use of the information. FUJITSU SEMICONDUCTOR assumes no liability for any damages whatsoever arising out of the use of
the information.
Any information in this document, including descriptions of function and schematic diagrams, shall not be construed as license
of the use or exercise of any intellectual property right, such as patent right or copyright, or any other right of FUJITSU
SEMICONDUCTOR or any third party or does FUJITSU SEMICONDUCTOR warrant non-infringement of any third-party's
intellectual property right or other right by using such information. FUJITSU SEMICONDUCTOR assumes no liability for any
infringement of the intellectual property rights or other rights of third parties which would result from the use of information
contained herein.
The products described in this document are designed, developed and manufactured as contemplated for general use, including
without limitation, ordinary industrial use, general office use, personal use, and household use, but are not designed, developed
and manufactured as contemplated (1) for use accompanying fatal risks or dangers that, unless extremely high safety is secured,
could have a serious effect to the public, and could lead directly to death, personal injury, severe physical damage or other loss
(i.e., nuclear reaction control in nuclear facility, aircraft flight control, air traffic control, mass transport control, medical life
support system, missile launch control in weapon system), or (2) for use requiring extremely high reliability (i.e., submersible
repeater and artificial satellite).
Please note that FUJITSU SEMICONDUCTOR will not be liable against you and/or any third party for any claims or damages
arising in connection with above-mentioned uses of the products.
Any semiconductor devices have an inherent chance of failure. You must protect against injury, damage or loss from such
failures by incorporating safety design measures into your facility and equipment such as redundancy, fire protection, and
prevention of over-current levels and other abnormal operating conditions.
Exportation/release of any products described in this document may require necessary procedures in accordance with the
regulations of the Foreign Exchange and Foreign Trade Control Law of Japan and/or US export control laws.
The company names and brand names herein are the trademarks or registered trademarks of their respective owners.
Copyright© 2004-2011 FUJITSU SEMICONDUCTOR LIMITED All rights reserved.
ii
CONTENTS
CHAPTER 1
BASIC FUNCTIONS ..................................................................................... 1
1.1
Workspace Management Function ..................................................................................................... 2
1.2
Project Management Function ............................................................................................................ 3
1.3
Project Dependence ........................................................................................................................... 5
1.4
Make/Build Function ........................................................................................................................... 6
1.4.1
Customize Build Function .............................................................................................................. 7
1.5
Include Dependencies Analysis Function ........................................................................................... 9
1.6
Functions of Setting Tool Options ..................................................................................................... 10
1.7
Error Jump Function ......................................................................................................................... 11
1.8
Editor Functions ................................................................................................................................ 13
1.9
Storing External Editors .................................................................................................................... 14
1.10 Storing External Tools ...................................................................................................................... 16
1.11 Macro Descriptions Usable in Manager ............................................................................................ 17
1.12 Setting Operating Environment ......................................................................................................... 23
1.13 Debugger Types ............................................................................................................................... 24
1.14 Memory Operation Functions ........................................................................................................... 25
1.15 Register Operations .......................................................................................................................... 26
1.16 Line Assembly and Disassembly ...................................................................................................... 27
1.17 Symbolic Debugging ......................................................................................................................... 28
1.17.1 Referring to Local Symbols ......................................................................................................... 30
1.17.2 Referring to Variables of C Language ......................................................................................... 31
CHAPTER 2
DEPENDENCE FUNCTIONS ..................................................................... 33
2.1
Simulator Debugger ..........................................................................................................................
2.1.1
Instruction Simulation ..................................................................................................................
2.1.2
Memory Simulation ......................................................................................................................
2.1.3
I/O Port Simulation ......................................................................................................................
2.1.4
Interrupt Simulation .....................................................................................................................
2.1.5
Reset Simulation .........................................................................................................................
2.1.6
Low-Power Consumption Mode Simulation .................................................................................
2.1.7
STUB Function ............................................................................................................................
2.1.8
Break ...........................................................................................................................................
2.1.8.1 Code Break ...............................................................................................................................
2.1.8.2 Data Break ................................................................................................................................
2.1.8.3 Guarded Access Break .............................................................................................................
2.1.8.4 Trace Buffer-full Break ..............................................................................................................
2.1.8.5 Forced Break ............................................................................................................................
2.1.9
Measuring the Number of Execution Cycles ...............................................................................
2.1.10 To Refer to a Program Execution History, Use [TRACE] ............................................................
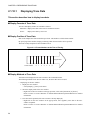
2.1.10.1 Displaying Trace Data ..............................................................................................................
2.1.10.2 Saving Traced Data ..................................................................................................................
2.1.10.3 Searching Traced Data .............................................................................................................
2.1.10.4 To Terminate Trace Obtention .................................................................................................
iii
34
35
36
37
38
39
40
41
42
43
44
45
46
47
48
49
50
52
53
54
2.1.11 Confirming the Debugger's State ................................................................................................. 55
2.2
Emulator Debugger (MB2141) .......................................................................................................... 57
2.2.1
Setting Operating Environment ................................................................................................... 58
2.2.1.1 MCU Operation Mode ............................................................................................................... 59
2.2.1.2 Memory Area Types ................................................................................................................. 60
2.2.1.3 Memory Mapping ...................................................................................................................... 61
2.2.1.4 Timer Minimum Measurement Unit .......................................................................................... 63
2.2.2
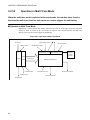
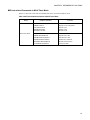
On-the-fly Executable Commands ............................................................................................... 64
2.2.3
On-the-fly Memory Access .......................................................................................................... 65
2.2.4
Break ........................................................................................................................................... 67
2.2.4.1 Code Break ............................................................................................................................... 68
2.2.4.2 Data Break ................................................................................................................................ 70
2.2.4.3 Sequential Break ...................................................................................................................... 71
2.2.4.4 Guarded Access Break ............................................................................................................. 72
2.2.4.5 Trace Buffer-full Break .............................................................................................................. 73
2.2.4.6 Performance Buffer-full Break .................................................................................................. 74
2.2.4.7 Forced Break ............................................................................................................................ 75
2.2.5
Events .......................................................................................................................................... 76
2.2.5.1 Operation in Normal Mode ....................................................................................................... 78
2.2.5.2 Operation in Multi Trace Mode ................................................................................................. 80
2.2.5.3 Operation in Performance Mode .............................................................................................. 82
2.2.6
Control by Sequencer .................................................................................................................. 84
2.2.6.1 Setting Sequencer .................................................................................................................... 86
2.2.6.2 Break by Sequencer ................................................................................................................. 88
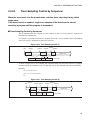
2.2.6.3 Trace Sampling Control by Sequencer ..................................................................................... 89
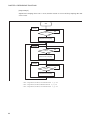
2.2.6.4 Time Measurement by Sequencer ........................................................................................... 91
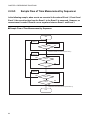
2.2.6.5 Sample Flow of Time Measurement by Sequencer .................................................................. 92
2.2.7
To Refer to a Program Execution History, Use [TRACE] ............................................................ 94
2.2.7.1 Single Trace ............................................................................................................................. 95
2.2.7.2 Setting Single Trace ................................................................................................................. 97
2.2.7.3 Multi Trace ................................................................................................................................ 99
2.2.7.4 Setting Multi Trace .................................................................................................................. 101
2.2.7.5 Displaying Trace Data Storage Status ................................................................................... 102
2.2.7.6 Specify Displaying Trace Data Position .................................................................................. 103
2.2.7.7 Display Format of Trace Data ................................................................................................. 104
2.2.7.8 Reading Trace Data On-the-fly ............................................................................................... 106
2.2.7.9 Saving Trace Data .................................................................................................................. 108
2.2.7.10 Searching of Trace Data ......................................................................................................... 109
2.2.8
Measuring Performance ............................................................................................................ 110
2.2.8.1 Performance Measurement Procedures ................................................................................. 111
2.2.8.2 Display Performance Measurement Data ............................................................................... 113
2.2.9
Measuring Coverage ................................................................................................................. 115
2.2.9.1 Coverage Measurement Procedures ...................................................................................... 116
2.2.10 Execution Time Measurement ................................................................................................... 119
2.2.11 Sampling by External Probe ...................................................................................................... 121
2.2.12 Confirming the Debugger's State ............................................................................................... 123
2.3
Emulator Debugger (MB2146-09/09A/09B) .................................................................................... 125
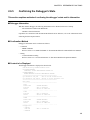
iv
2.3.1
Setting Operating Environment .................................................................................................
2.3.1.1 Clock-up Mode .......................................................................................................................
2.3.1.2 Main Clock Oscillation ............................................................................................................
2.3.2
Programming to FLASH Memory ..............................................................................................
2.3.3
Break .........................................................................................................................................
2.3.3.1 Code Break .............................................................................................................................
2.3.3.2 Data Break ..............................................................................................................................
2.3.3.3 Monitoring Data Break ............................................................................................................
2.3.3.4 Sequential Break ....................................................................................................................
2.3.3.5 Forced Break ..........................................................................................................................
2.3.4
Real-time Trace .........................................................................................................................
2.3.4.1 Displaying Trace Data ............................................................................................................
2.3.4.2 Saving Trace Data ..................................................................................................................
2.3.4.3 Searching Trace Data .............................................................................................................
2.3.5
Notes on Executing Program .....................................................................................................
2.3.6
RAM Monitoring .........................................................................................................................
2.3.7
Measuring the Number of Execution Cycles .............................................................................
2.3.8
Confirming the Debugger's State ...............................................................................................
2.4
Emulator Debugger (MB2146-08) ...................................................................................................
2.4.1
Setting Operating Environment .................................................................................................
2.4.1.1 Main Clock Oscillation Frequency ..........................................................................................
2.4.2
Erasing/Programming FLASH Memory .....................................................................................
2.4.3
Erasing/Programming FRAM Area ............................................................................................
2.4.4
Notes on Executing Program .....................................................................................................
2.4.5
FLASH Security .........................................................................................................................
2.4.6
Notes on Starting/Stopping Debugger .......................................................................................
2.4.7
Break .........................................................................................................................................
2.4.7.1 Code Break .............................................................................................................................
2.4.7.2 Forced Break ..........................................................................................................................
2.4.8
Confirming the Debugger's State ...............................................................................................
2.5
Emulator Debugger (MB2146-07) ...................................................................................................
2.5.1
Setting Operating Environment .................................................................................................
2.5.1.1 Optimization of Response Speed ...........................................................................................
2.5.1.2 Oscillation Frequency .............................................................................................................
2.5.1.3 Power Supply to BGM Adapter ...............................................................................................
2.5.1.4 Synchronization of FLASH memory at Startup of Debugger ..................................................
2.5.1.5 For this setting, use the setup wizard. ....................................................................................
2.5.2
Writing to or Erasing FLASH Memory .......................................................................................
2.5.3
Writing to or Erasing FRAM Area ..............................................................................................
2.5.4
Precautions on Program Execution ...........................................................................................
2.5.5
Flash Security Detection Function .............................................................................................
2.5.6
Precautions on Starting and Ending the Debugger ...................................................................
2.5.7
Break .........................................................................................................................................
2.5.7.1 Code Break .............................................................................................................................
2.5.7.2 Forced Break ..........................................................................................................................
2.5.8
RAM Monitoring .........................................................................................................................
2.5.9
Confirming the Debugger's State ...............................................................................................
v
128
129
130
131
133
134
135
136
137
138
139
141
142
143
144
145
147
149
151
152
153
154
156
157
158
159
161
162
163
164
166
167
168
169
170
171
172
173
175
176
177
178
180
181
182
183
186
2.6
Monitor Debugger ...........................................................................................................................
2.6.1
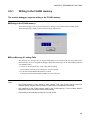
Writing to the FLASH memory ...................................................................................................
2.6.2
Fast downloading ......................................................................................................................
2.6.3
Points to Note when Executing Programs .................................................................................
2.6.4
Break .........................................................................................................................................
2.6.4.1 Code Break .............................................................................................................................
2.6.4.2 Forced Break ..........................................................................................................................
2.6.5
Confirming the Debugger's State ...............................................................................................
188
189
190
191
192
193
194
195
INDEX................................................................................................................................... 197
vi
CHAPTER 1
BASIC FUNCTIONS
This chapter describes the basic functions on the
SOFTUNE Workbench.
1.1 Workspace Management Function
1.2 Project Management Function
1.3 Project Dependence
1.4 Make/Build Function
1.5 Include Dependencies Analysis Function
1.6 Functions of Setting Tool Options
1.7 Error Jump Function
1.8 Editor Functions
1.9 Storing External Editors
1.10 Storing External Tools
1.11 Macro Descriptions Usable in Manager
1.12 Setting Operating Environment
1.13 Debugger Types
1.14 Memory Operation Functions
1.15 Register Operations
1.16 Line Assembly and Disassembly
1.17 Symbolic Debugging
1
CHAPTER 1 BASIC FUNCTIONS
1.1
Workspace Management Function
This section explains the workspace management function of SOFTUNE Workbench.
■ Workspace
SOFTUNE Workbench uses workspace as a container to manage two or more projects including
subprojects.
For example, a project that creates a library and a project that creates a target file using the project can be
stored in one workspace.
■ Workspace Management Function
To manage two or more projects, workspace manages the following information:
- Project
- Active project
- Subproject
■ Project
The operation performed in SOFTUNE Workbench is based on the project. The project is a set of files and
procedures necessary for creation of a target file. The project file contains all data managed by the project.
■ Active Project
The active project is basic to workspace and undergoes [Make], [Build], [Compile/Assemble], [Start
Debug], and [Update Dependence] in the menu. [Make], [Build], [Compile/Assemble], and [Update
Dependence] affect the subprojects within the active project.
If workspace contains some project, it always has one active project.
■ Subproject
The subproject is a project on which other projects depend. The target file in the subproject is linked with
the parent project of the subproject in creating a target file in the parent project.
This dependence consists of sharing target files output by the subproject, so a subproject is first made and
built. If making and building of the subproject is unsuccessful, the parent project of the subproject will not
be made and built.
The target file in the subproject is however not linked with the parent project when:
- An absolute format (ABS)-type project is specified as a subproject.
- A library (LIB)-type project is specified as a subproject.
■ Restrictions on Storage of Two or More Projects
Only one REALOS-type project can be stored in one workspace.
2
CHAPTER 1 BASIC FUNCTIONS
1.2
Project Management Function
This section explains the project management function of SOFTUNE Workbench.
■ Project Management Function
The project manages all information necessary for development of a microcontroller system.
- Project configuration
- Active project configuration
- Information on source files, include files, other object files, library files
- Information on tools executed before and after executing language tools (customize build function)
■ Project format
The project file supports two formats: a "workspace project format", and an "old project format".
The differences between the two formats are as follows:
● Workspace project format
- Supports management of two or more project configurations
- Supports use of all macros usable in manager
- Does not support early Workbench versions*
● Old project format
- Supports management of just one project configuration
- Limited number of macros usable in manager
For details, see Section "1.11 Macro Descriptions Usable in Manager".
- Supports early Workbench versions*
When a new project is made, the workspace project format is used.
When using an existing project, the corresponding project format is used.
If a project made by an early Workbench version* is used, a dialog asking whether to convert the file to the
workspace project format is displayed. For details, refer to Section "2.13 Reading SOFTUNE Project Files
of Old Versions" of "SOFTUNE Workbench Operation Manual".
To open a project file in the workspace project format with an early Workbench version*, it is necessary to
convert the file to the old project format. For saving the file in other project formats, refer to Section "4.2.7
Save As" of "SOFTUNE Workbench Operation Manual".
*: V30L26 or earlier
3
CHAPTER 1 BASIC FUNCTIONS
■ Project Configuration
The project configuration is a series of settings for specifying the characteristics of a target file, and
making, building, compiling and assembling is performed in project configurations.
Two or more project configurations can be created in a project. The default project configuration name is
Debug. A new project configuration is created on the setting of the selected existing project configuration.
In the new project configuration, the same files as those in the original project configuration are always
used.
By using the project configuration, the settings of programs of different versions, such as the optimization
level of a compiler and MCU setting, can be created within one project.
In the project configuration, the following information is managed:
- Name and directory of target file
- Information on options of language tools to create target file by compiling, assembling and linking
source files
- Information on whether to build file or not
- Information on setting of debugger to debug target file
■ Active Project Configuration
The active project configuration at default undergoes [Make], [Build], [Compile/Assemble], [Start Debug],
and [Update Dependence].
The setting of the active project configuration is used for the file state displayed in the SRC tab of project
window and includes files detected in the Dependencies folder.
Note:
If a macro function newly added is used in old project format, the macro description is expanded at
the time of saving in old project format. For the macro description newly added, refer to Section "1.11
Macro Descriptions Usable in Manager".
4
CHAPTER 1 BASIC FUNCTIONS
1.3
Project Dependence
This section explains the project dependence of SOFTUNE Workbench.
■ Project Dependence
If target files output by other projects must be linked, a subproject is defined in the project required in
[Project Dependence] in the [Project] menu. The subproject is a project on which other projects depend.
By defining project dependence, a subproject can be made and built to link its target file before making and
building the parent project.
The use of project dependence enables simultaneous making and building of two or more projects
developed in one workspace.
A project configuration in making and building a subproject in [Project Configuration]-[Build
Configuration] in the [Project] menu can be specified.
5
CHAPTER 1 BASIC FUNCTIONS
1.4
Make/Build Function
This section explains the make/build function of SOFTUNE Workbench.
■ Make Function
Make function generates a target file by compiling/assembling only updated source files from all source
files registered in a project, and then joining all required object files.
This function allows compiling/assembling only the minimum of required files. The time required for
generating a target file can be sharply reduced, especially, when debugging.
For this function to work fully, the dependence between source files and include files should be accurately
grasped. To do this, SOFTUNE Workbench has a function for analyzing include dependence. For details,
see Section "1.5 Include Dependencies Analysis Function".
■ Build Function
Build function generates a target file by compiling/assembling all source files registered with a project,
regardless of whether they have been updated or not, and then by joining all required object files. Using
this function causes all files to be compiled/assembled, resulting in the time required for generating the
target file longer. Although the correct target file can be generated from the current source files.
The execution of Build function is recommended after completing debugging at the final stage of program
development.
Note:
When executing the Make function using a source file restored from backup, the integrity between an
object file and a source file may be lost. If this happens, executing the Build function again.
6
CHAPTER 1 BASIC FUNCTIONS
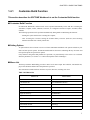
1.4.1
Customize Build Function
This section describes the SOFTUNE Workbench to set the Customize Build function.
■ Customize Build Function
In SOFTUNE Workbench, different tools can be operated automatically before and after executing the
Assembler, Compiler, Linker, Librarian, Converter, or Configurator started at Compile, Assemble, Make,
or Build.
The following operations can be performed automatically during Make or Build using this function:
- Starting the syntax check before executing the Compiler,
- After executing the Converter, starting the S-format binary Converter (m2bs.exe) and converting
Motorola S-format files to binary format files.
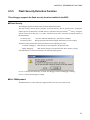
■ Setting Options
An option follows the tool name to start a tool from SOFTUNE Workbench. The options include any file
name and tool-specific options. SOFTUNE Workbench has the macros indicating that any file name and
tool-specific options are specified as options.
If any character string other than parameters is specified, it is passed directly to the tool as it is. For details
about the parameters, see Section "1.11 Macro Descriptions Usable in Manager".
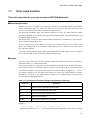
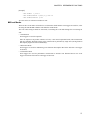
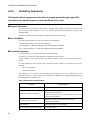
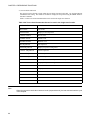
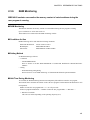
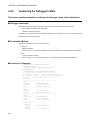
■ Macro List
The Setup Customize Build dialog provides a macro list for macro input. The build file, load module file,
project file submenus indicate their sub-parameters specified.
The environment variable brackets must have any item; otherwise, resulting in an error.
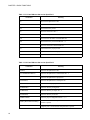
Table 1.4-1 Macro List
Macro List
Macro Name
Build file
%(FILE)
Load module file
%(LOADMODULEFILE)
Project file
%(PRJFILE)
Workspace file
%(WSPFILE)
Project directory
%(PRJPATH)
Target file directory
%(ABSPATH)
Object file directory
%(OBJPATH)
List file directory
%(LSTPATH)
Project construction name
%(PRJCONFIG)
Environment variable
%(ENV[])
Temporary file
%(TEMPFILE)
7
CHAPTER 1 BASIC FUNCTIONS
Note:
When checking [Use the Output window], note the following:
• Once a tool is activated, Make/Build is suspended until the tool is terminated.
• The Output window must not be used with a tool using a wait state for user input while the tool is
executing. The user can not perform input while the Output window is in use, so the tool cannot
be terminated. To forcibly terminate the tool, select the tool on the Task bar and input Control - C,
or Control - Z.
8
CHAPTER 1 BASIC FUNCTIONS
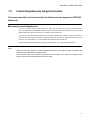
1.5
Include Dependencies Analysis Function
This section describes the function of the Include Dependencies Analysis of SOFTUNE
Workbench.
■ Analyzing Include Dependencies
A source file usually includes some include files. When only an include file has been modified leaving a
source file unchanged, SOFTUNE Workbench cannot execute the Make function unless it has accurate and
updated information about which source file includes which include files.
For this reason, SOFTUNE Workbench has built-in Include Dependencies Analysis function. This function
can be activated by selecting the [Project] -[Include Dependencies] menu. By using this function, users can
know the exact dependencies, even if an include file includes another include file.
SOFTUNE Workbench automatically updates the dependencies of the compiled/assembled files.
Note:
When executing the [Project] - [Include Dependencies] menu, the Output window is redrawn and
replaced by the dependencies analysis result.
If the contents of the current screen are important (error message, etc.), save the contents to a file
and then execute the Include Dependencies command.
9
CHAPTER 1 BASIC FUNCTIONS
1.6
Functions of Setting Tool Options
This section describes the functions to set options for the language tools activated
from SOFTUNE Workbench.
■ Function of Setting Tool Options
To create a desired target file, it is necessary to specify options for the language tools such as a compiler,
assembler, and linker. SOFTUNE Workbench stores and manages the options specified for each tool in
project configurations.
Tool options include the options effective for all source files (common options) and the options effective
for specific source files (individual options). For details about the option setting, refer to Section "4.5.5
Setup Project" of "SOFTUNE Workbench Operation Manual".
• Common options
These options are effective for all source files (excluding those for which individual options are
specified) stored in the project.
• Individual options
These options are compile/assemble options effective for specific source files. The common options
specified for source files for which individual options are specified become invalid.
■ Tool Options
In SOFTUNE Workbench, the macros indicating that any file name and directory name are specified as
options.
If any character string other than parameters is specified, it is passed directly to the tool. For details about
the parameters, see Section "1.11 Macro Descriptions Usable in Manager". For details about the tool
options for each tool, refer to the manual of each tool.
10
CHAPTER 1 BASIC FUNCTIONS
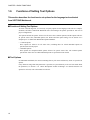
1.7
Error Jump Function
This section describes the error jump function in SOFTUNE Workbench.
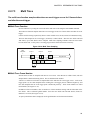
■ Error Jump Function
When an error, such as a compile error occurs, double-clicking the error message displayed in the Output
window, automatically opens the source file where the error occurred, and moves the cursor to the
error line. This function permits efficient removal of compile errors, etc.
The SOFTUNE Workbench Error Jump function analyzes the source file names and line number
information embedded in the error message displayed in the Output window, opens the matching file, and
jumps automatically to the line.
The location where a source file name and line number information are embedded in an error message,
varies with the tool outputting the error.
An error message format can be added to an existing one or modified into an new one. However, the
modify error message formats for pre-installed Fujitsu language tools are defined as part of the system,
these can not be modified.
A new error message format should be added when working the Error Jump function with user registered
tool. To set Error Jump, execute the [Setup] - [Setup Error Jump] menu.
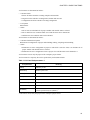
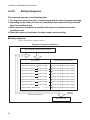
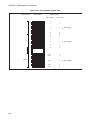
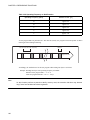
■ Syntax
An error message format can be described in Syntax. SOFTUNE Workbench uses macro descriptions as
shown in the Table 1.7-1 to define such formats.
To analyze up to where %f, %h, and %* continue, SOFTUNE Workbench uses the character immediately
after the above characters as a delimiter. Therefore, in Syntax, the description until a character that is used
as a delimiter re-appears, is interpreted as a file name or a keyword for help, or is skipped over. To use %
as a delimiter, describe as %%. The %[char] macro skips over as long as the specified character continues
in parentheses. To specify "]" as a skipped character, describe it as "\]". Blank characters in succession can
be specified with a single blank character.
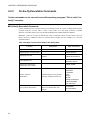
Table 1.7-1 List of Special Characters String for Analyzing Error Message
Parameter
Semantics
%f
Interpret as source file name and inform editor.
%l
Interpret as line number and inform editor.
%h
Become keyword when searching help file.
%*
Skip any desired character.
%[char]
Skip as long as characters in [ ] continues.
[Example]
***
%f(%l)
%h: or, %[*]
%f(%l)
%h:
The first four characters are "*** ", followed by the file name and parenthesized line number, and then
11
CHAPTER 1 BASIC FUNCTIONS
the keyword for help continues after one blank character.
This represents the following message:
***C:\Sample\sample.c(100) E4062C: Syntax Error: near /int.
12
CHAPTER 1 BASIC FUNCTIONS
1.8
Editor Functions
This section describes the functions of the SOFTUNE Workbench built-in standard
editor.
■ Standard Editor
SOFTUNE Workbench has built-in editor called the standard editor. The standard editor is activated as the
Edit window in SOFTUNE Workbench. As many Edit windows as are required can be opened at one time.
The standard editor has the following functions in addition to regular editing functions.
• Keyword marking function in C/assembler source file
Displays reserved words, such as if and for, in different color
• Error line marking function
The error line can be viewed in a different color, when executing Error Jump.
• Bookmark setup function
A bookmark can be set on any line, and instantaneously jumps to the line. Once a bookmark is set, the
line is displayed in a different color.
• Ruler, line number display function
The Ruler is a measure to find the position on a line; it is displayed at the top of the Edit window. A line
number is displayed at the left side of the Edit window.
• Automatic indent function
When a line is inserted using the Enter key, the same indent (indentation) as the preceding line is set
automatically at the inserted line. If the space or tab key is used on the preceding line, the same use is set
at the inserted line as well.
• Function to display, Blank, Line Feed code, and Tab code
When a file includes a Blank, Line Feed code, and Tab code, these codes are displayed with special
symbols.
• Undo function
This function cancels the preceding editing action to restore the previous state. When more than one
character or line is edited, the whole portion is restored.
• Tab size setup function
Tab stops can be specified by defining how many digits to skip when Tab codes are inserted. The default
is 8.
• Font changing function
The font size for character string displayed in the Edit window can be selected.
13
CHAPTER 1 BASIC FUNCTIONS
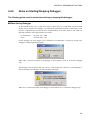
1.9
Storing External Editors
This section describes the function to set an external editor to SOFTUNE Workbench.
■ External Editor
SOFTUNE Workbench has built-in standard editor, and use of this standard editor is recommended.
However, another accustomed editor can be used, with setting it, instead of an edit window. Use the [Setup]
- [Setup Editor] menu to set an external editor.
■ Precautions
There is no particular limit on which editor can be set, but some precautions (below) may be necessary.
• Error jump function
The Error Jump cannot move the cursor to an error line if the external editor does not have a function to
specify the cursor location when activated the external editor.
• File save at compiling/assembling
SOFTUNE Workbench cannot control an external editor. Always save the file you are editing before
compiling/assembling.
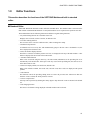
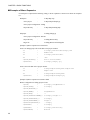
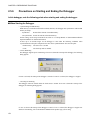
■ Setting Options
When activating an external editor from SOFTUNE Workbench, options must be added immediately after
the editor name. The names of file to be opened by the editor and the initial location of the cursor (the line
number) can be specified. SOFTUNE Workbench has a set of special parameters for specifying any file
name and line number, as shown in the Table 1.9-1 . If any other character string are described by these
parameters, such characters string are passed as it is to the editor.
%f (File name) is determined as follows:
1. If the focus is on the SRC tab of project window, and if a valid file name is selected, the selected file
name becomes the file name.
2. When a valid file name cannot be acquired by the above procedure, the file name with a focus in built-in
editor becomes the file name.
%x (project path) is determined as follows:
1. If a focus is on the SRC tab of project window and a valid file name is selected, the project path is a
path to the project in which the file is stored.
2. If no path is obtained, the project path is a path to the active project.
Also file name cannot be given double-quotes in the expansion of %f macros.
Therefore, it is necessary for you to provide double-quotes for %f. Depending on the editor, there are line
numbers to which there will be no correct jump if the entire option is not given double-quotes.
14
CHAPTER 1 BASIC FUNCTIONS
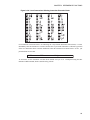
Table 1.9-1 List of Special Characters for Analyzing Error Message
Parameter
Semantics
%%
Means specifying % itself
%f
Means specifying file name
%l
Means specifying line number
%x
Means specifying project path
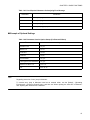
■ Example of Optional Settings
Table 1.9-2 Parameters Used in Option Setups (For External Editors)
Editor name
Argument
WZ Editor V4.0
%f /j%l
MIFES V1.0
%f+%l
UltraEdit32
%f/%l/1
TextPad32
%f(%l)
PowerEDITOR
%f -g%l
Codewright32 (PowerEDITOR)
%f -g%l
Hidemaru for Win3.1/95
/j%l:1 %f
ViVi
/line=%l %f
Note:
Regarding execution of error jump in Hidemaru:
To execute error jump in Hidemaru used as an external editor, use the [Others] - [Operating
Environment] - [Exclusive Control] menu, and then set "When opening the same file in Hidemaru"
and "Opening two identical files is inhibited".
15
CHAPTER 1 BASIC FUNCTIONS
1.10
Storing External Tools
This section describes the function to set an external tool to SOFTUNE Workbench.
■ External Tools
A non-standard tool not attached to SOFTUNE Workbench can be used by setting it as an external tool and
by calling it from SOFTUNE Workbench. Use this function to coordinate with a source file version
management tool.
If a tool set as an external tool is designed to output the execution result to the standard output and the
standard error output through the console application, the result can be specified to output the SOFTUNE
Workbench Output window. In addition, the allow description of additional parameters each time the tool is
activated.
To set an external tool, use the [Setup] - [Setup Tool] menu.
To select the title of a set tool, use the [Setup] - [Tool execution] menu.
■ Setting Options
When activating an external tool from SOFTUNE Workbench, options must be added immediately after the
external tool name. Specify the file names and unique options, etc.
SOFTUNE Workbench has a set of special parameters for specifying any file name and unique tool
options.
If any characters string described other than these parameters, such characters string are passed as it is to
the external tool.
For details about the parameters, see Section "1.11 Macro Descriptions Usable in Manager".
Note:
When checking [Use the Output window], note the following:
• Once a tool is activated, neither other tools nor the compiler/assembler can be activated until the
tool is terminated.
• The Output window must not be used with a tool using a wait state for user input while the tool is
executing. The user cannot perform input while the Output window is in use, so the tool cannot be
terminated. To forcibly terminate the tool, select the tool on the Task bar and input Control - C, or
Control - Z.
16
CHAPTER 1 BASIC FUNCTIONS
1.11
Macro Descriptions Usable in Manager
This section explains the macro descriptions that can be used in the manager of
SOFTUNE Workbench.
■ Macros
SOFTUNE Workbench has special parameters indicating that any file name and tool-specific options are
specified as options.
The use of these parameters as tool options eliminates the need for options specified each time each tool is
started.
The type of macro that can be specified and macro expansion slightly vary depending on where to describe
macros. The macros usable for each function are detailed below. For the macros that can be specified for
"Error Jump" and "External Editors" see Sections "1.7 Error Jump Function" and "1.9 Storing External
Editors".
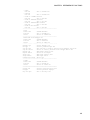
■ Macro List
The following is a list of macros that can be specified in SOFTUNE Workbench.
The macros usable for each function are listed below.
- External tools:
Table 1.11-1 and Table 1.11-2
- Customize build: Table 1.11-1 and Table 1.11-2
- Tool options:
Table 1.11-2
The directory symbol \ is added to the option directories in Table 1.11-1 but not to the macro directories in
Table 1.11-2 .
The sub-parameters in Table 1.11-3 can be specified in %(FILE), %(LOADMODULEFILE), %(PRJFILE),
and %(WSPFILE).
The sub-parameter is specified in the form of %(PRJFILE[PATH]).
If the current directory is on the same drive, the relative path is used. The current directory is the workspace
directory for %(PRJFILE) and %(WSPFILE), and the project directory for other than them.
17
CHAPTER 1 BASIC FUNCTIONS
Table 1.11-1 List of Macros that can be Specified 1
Parameter
Meaning
%f
Passed as full-path name of file. *1
%F
Passed as main file name of file. *1
%d
Passed as directory of file. *1
%e
Passed as extension of file. *1
%a
Passed as full-path name of load module file.
%A
Passed as main file name of load module file. *2
%D
Passed as directory of load module file. *2
%E
Passed as extension of load module file. *2
%x
Passed as directory of project file. *2
%X
Passed as main file name of project file. *2
%%
Passed as %.
Table 1.11-2 List of Macros that can be Specified 2
Parameter
18
Meaning
%(FILE)
Passed as full-path name of file. *1
%(LOADMODULEFILE)
Passed as full-path name of load module file. *2
%(PRJFILE)
Passed as full-path name of project file. *2
%(WSPFILE)
Passed as full-path name of workspace file. *3
%(PRJPATH)
Passed as directory of project file. *2
%(ABSPATH)
Passed as directory of target file. *2
%(OBJPATH)
Passed as directory of object file. *2
%(LSTPATH)
Passed as directory of list file. *2
%(PRJCONFIG)
Passed as project configuration name. *2, *3
%(ENV [Environment variable])
Environment variable value specified in environment variable
brackets is passed.
%(TEMPFILE)
Temporary file is created and its full-path name is passed. *4
CHAPTER 1 BASIC FUNCTIONS
*1:The macros are determined as follows:
• Customize build
1. Source file before and after executing compiler and assembler
2. Target file before and after executing linker, librarian and converter
3. Configuration file before and after executing configuration
• Tool options
Null character
• Others
1. File as focus is on the SRC tab of project window and valid file name is selected
2. File on which focus is in internal editor as no valid file name can be obtained in 1
3. Null character if no valid file name can be obtained
*2:The macros are determined as follows:
• Customize build and tool options
Information on configuration of project under building, making, compiling and assembling
• Others
1. Information on active configuration of project in which file is stored as focus is on the SRC tab of
project window and valid file name is selected
2. Information on active configuration of active project if no valid file name can be obtained in 1
*3:The macros can use only the project of the workspace project format.
*4:The content of a temporary file can be specified only with customize build.
Table 1.11-3 List of Sub parameters 1
Sub parameter
Meaning
[PATH]
Directory of file
[RELPATH]
Relative path of file
[NAME]
Main file name of file
[EXT]
Extension of file
[SHORTFULLNAME]
Full path name of short file
[SHORTPATH]
Directory of short file
[SHORTNAME]
Main file name of short file
[FOLDER]
Name of folder in which files are stored in the SRC tab of project window
(Can be specified only in %(FILE).) *
*: The macros can use only the project of the workspace project format.
19
CHAPTER 1 BASIC FUNCTIONS
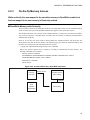
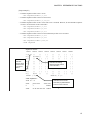
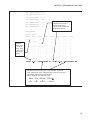
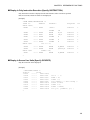
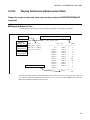
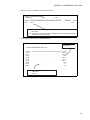
■ Examples of Macro Expansion
If a workspace is opened in the following setting, a macro expansion is carried out as shown in examples 1
to 3.
Workspace
Active project
:
C:\Wsp\Wsp.wsp
:
C:\Wsp\Sample\Sample.prj
Active project configuration - Debug
Object directory
Subproject
:
C:\Wsp\Sample\Debug\Obj\
:
C:\Subprj\Subprj.prj
Active project configuration - Release
Object directory
:
C:\Subprj\Release\Obj\
Target file
:
C:\Subprj\Release\Abs\Subprj.abs
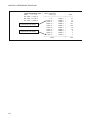
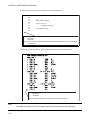
[Example 1] Macro expansion in external tools
Focus is on Subprj project file in the SRC tab of project window.
%a
:
C:\Subprj\Release\Abs\Subprj.abs
%A
:
SUBPRJ.abs
%D
:
C:\Subprj\Release\Abs\
%E
:
.abs
%(FILE[FOLDER]) :
Source Files\Common
%(PRJFILE)
C:\Subprj\Subprj.prj
:
Focus is not in the SRC tab of project window.
%a
:
C:\Wsp\Sample\Debug\Abs\Sample.abs
%A
:
Sample.abs
%D
:
C:\Wsp\Sample\Debug\Abs\
%(PRJFILE)
:
C:\Wsp\Sample\Sample.prj
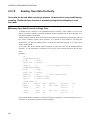
[Example 2] Macro expansion in customize build
Release configuration of Subprj project is built.
%(FILE)
:
C:\Subprj\LongNameFile.c
%(FILE[PATH])
:
C:\Subprj
%(FILE[RELPATH]):
.
%(FILE[NAME])
:
LongNameFile
%(FILE[EXT])
:
.c
%(FILE[SHORTFULLNAME]): C:\Subprj\LongFi~1.c
20
%(FILE[SHORTPATH]):
C:\Subprj
%(FILE[SHORTNAME]):
LongFi~1
%(PRJFILE[RELPATH]):
..\Subprj
%(PRJPATH)
:
C:\Subprj
%(OBJPATH)
:
C:\Subprj\Release\Obj
%(PRJCONFIG)
:
Release
CHAPTER 1 BASIC FUNCTIONS
%(ENV[FETOOL])
:
C:\SOFTUNE
%(TEMPFILE)
:
C:\Subprj\Release\Opt\_fs1056.TMP
21
CHAPTER 1 BASIC FUNCTIONS
[Example 3] Macro expansion in tool options
Release configuration of Subprj project is built.
%(FILE)
22
:
%(PRJFILE[RELPATH]):
..\Subprj
%(PRJPATH)
:
C:\Subprj
%(OBJPATH)
:
C:\Subprj\Release\Obj
%(PRJCONFIG)
:
Release
%(ENV[FETOOL])
:
C:\SOFTUNE
CHAPTER 1 BASIC FUNCTIONS
1.12
Setting Operating Environment
This section describes the functions for setting the SOFTUNE Workbench operating
environment.
■ Operating Environment
Set the environment variables for SOFTUNE Workbench and some basic setting for the workspace.
To set the operating environment, use the [Setup]-[Setup Development Environment] menu.
● Environment Variables
Environment variables are variables that are referenced to mainly using the language tools activated from
SOFTUNE Workbench. The semantics of an environment variable are displayed in the lower part of the
Setup dialog. However, the semantics are not displayed for environment variables used by tools added later
to SOFTUNE Workbench.
When SOFTUNE Workbench and the language tools are installed in a same directory, it is not especially
necessary to change the environment variable setups.
● Basic setups for workspace
The following setups are possible.
• Open the previously workspace at start up
When starting SOFTUNE Workbench, it automatically opens the last opened workspace.
• Display options while compiling/assembling
Compile options or assemble options can be viewed in the Output window.
• Save dialog before closing workspace
Before closing the workspace, a dialog asking for confirmation of whether or not to save the workspace
to the file is displayed. If this setting is not made, SOFTUNE Workbench automatically saves the
workspace without any confirmation message.
• Save dialog at compiling/assembling
Before compiling/assembling, a dialog asking for confirmation of whether or not to save a source file that
has not been saved is displayed. If this setting is not made, the file is saved automatically at compile/
assemble/make/build.
• Termination message is highlighted at Make/Build
At Compile, Assemble, Make, or Build, the display color of termination messages (Abort, No Error,
Warning, Error, Fatal error, or Failing During start) can be changed freely by the user.
■ Reference Section
Development Environment
Note:
Because the environment variables set here are language tools for the SOFTUNE Workbench, the
environment variables set on previous versions of SOFTUNE cannot be used. In particular, add the
set values of [User Include Directory] and [Library Search Directory] to [Project Settings].
23
CHAPTER 1 BASIC FUNCTIONS
1.13
Debugger Types
This section describes the types of SOFTUNE Workbench debuggers.
■ Type of Debugger
SOFTUNE Workbench integrates three types of debugger: a simulator debugger, emulator debugger and
monitor debugger.
Any one can be selected depending on the requirement.
■ Simulator Debugger
The simulator debugger simulates the MCU operations (executing instructions, memory space, I/O ports,
interrupts, reset, etc.) with software to evaluate a program.
It is used for evaluating an uncompleted system and operation of individual units, etc.
■ Emulator Debugger
The emulator debugger is software to evaluate a program by controlling the emulator from a host computer
through a communications line (RS-232C, LAN, USB).
Before using this debugger, the emulator must be initialized.
■ Monitor Debugger
The monitor debugger evaluates a program by putting it into an evaluation system and communicating with
a host.
An RS-232C interface and an area for the debug program are required within the evaluation system.
24
CHAPTER 1 BASIC FUNCTIONS
1.14
Memory Operation Functions
This section describes the memory operation functions.
■ Functions for Memory Operations
• Display/Modify memory data
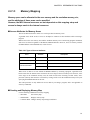
Memory data can be display in the Memory window and modified.
• Fill
The specified memory area can be filled with the specified data.
• Copy
The data in the specified memory area can be copied to another area.
• Compare
The data in the specified source area can be compared with data in the destination area.
• Search
Data in the specified memory area can be searched.
For further details of the above functions, refer to "3.11 Memory Window" in "SOFTUNE Workbench Operation
Manual".
• Display/Modify C variables
The names of variables in a C source file can be displayed in the Watch window and modified.
• Setting Watch point
By setting a watch point at a specific address, its data can be displayed in the Watch window.
For further details of the above functions, refer to "3.13 Watch Window" in "SOFTUNE Workbench Operation
Manual".
25
CHAPTER 1 BASIC FUNCTIONS
1.15
Register Operations
This section describes the register operations.
■ Register Operations
The Register window is opened when the [View] - [Register] menu is executed. The register and flag
values can be displayed in the Register window.
For further details about modifying the register value and the flag value, refer to "4.4.4 Register" in
"SOFTUNE Workbench Operation Manual".
The name of the register and flag displayed in the Register window varies depending on each MCU in use.
For the list of register names and flag names for the MCU in use, refer to "Appendix A Register Name
List" of "SOFTUNE Workbench Operational Manual".
26
CHAPTER 1 BASIC FUNCTIONS
1.16
Line Assembly and Disassembly
This section describes line assembly and disassembly.
■ Line Assembly
To perform line-by-line assembly (line assembly), right-click anywhere in the Disassembly window to
display the short-cut menu, and select [Inline Assembly]. For further details about assembly operation, refer
to "4.4.3 Assembly" in "SOFTUNE Workbench Operation Manual".
■ Disassembly
To display disassembly, use the [View]-[Assembly] menu. By default, disassembly can be viewed starting
from the address pointed by the current program counter (PC). However, the address can be changed to any
desired address at start-up.
Disassembly for an address outside the memory map range cannot be displayed. If this is attempted, "???"
is displayed as the mnemonic.
27
CHAPTER 1 BASIC FUNCTIONS
1.17
Symbolic Debugging
The symbols defined in a source program can be used for command parameters
(address). There are three types of symbols as follows:
• Global Symbol
• Static Symbol within Module (Local Symbol within Module)
• Local Symbol within Function
■ Types of Symbols
A symbol means the symbol defined while a program is created, and it usually has a type. Symbols become
usable by loading the debug information file.
Furthermore, for symbol of C language, it recognizes the type and executes the command.
There are three types of symbols as follows:
• Global symbol
A global symbol can be referenced to from anywhere within a program. In C language, variables and
functions defined outside a function without a static declaration are in this category. In assembler,
symbols with a PUBLIC declaration are in this category.
• Static symbol within module (Local symbol within module)
A static symbol within module can be referenced to only within the module where the symbol is defined.
In C language, variables and functions defined outside a function with a static declaration are in this
category. In assembler, symbols without a PUBLIC declaration are in this category.
• Local symbol within function
A local symbol within a function exists only in C language. A static symbol within a function and an
automatic variable are in this category.
- Static symbol within function
Out of the variables defined in function, those with static declaration.
- Automatic variable
Out of the variables defined in function, those without static declaration and parameters for the
function.
■ Setting Symbol Information
Symbol information in the file is set with the symbol information table by loading a debug information file.
This symbol information is created for each module.
The module is constructed for each source file to be compiled in C language, in assembler for each source
file to be assembled.
The debugger automatically selects the symbol information for the module to which the PC belongs to at
abortion of execution (Called "the current module"). A program in C language also has information about
which function the PC belongs to.
28
CHAPTER 1 BASIC FUNCTIONS
■ Line Number Information
Line number information is set with the line number information table in SOFTUNE Workbench when a
debug information file is loaded. Once registered, such information can be used at anytime thereafter. Line
number is defined as follows:
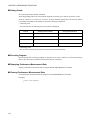
[Source File Name]
$Line Number
29
CHAPTER 1 BASIC FUNCTIONS
1.17.1
Referring to Local Symbols
This section describes referring to local symbols and Scope.
■ Scope
When a local symbol is referenced to, Scope is used to indicate the module and function to which the local
symbol to be referenced belongs.
SOFTUNE Workbench automatically scopes the current module and function to refer to local symbols in
the current module with preference. This is called the Auto-scope function, and the module and function
currently being scoped are called the Current Scope.
When specifying a local variable outside the Current Scope, the variable name should be preceded by the
module and function to which the variable belongs. This method of specifying a variable is called a symbol
path name or a Search Scope.
■ Moving Scope
As explained earlier, there are two ways to specify the reference to a variable: by adding a Search Scope
when specifying the variable name, and by moving the Current Scope to the function with the symbol to be
referenced to. The Current Scope can be changed by displaying the Call Stack dialog and selecting the
parent function. For further details of this operation, refer to "4.6.7 Stack" in "SOFTUNE Workbench
Operation Manual". Changing the Current Scope as described above does not affect the value of the PC.
By moving the current scope in this way, you can search a local symbol in parent function with precedence.
■ Specifying Symbol and Search Procedure
A symbol is specified as follows:
[[Module Name] [\Function Name] \] Symbol Name
When a symbol is specified using the module and function names, the symbol is searched. However, when
only the symbol name is specified, the search is made as follows:
1. Local symbols within function in Current Scope
2. Static symbols within module in Current Scope
3. Global symbols
If a global symbol has the same name as a local symbol in the Current Scope, specify "\" or "::" at the start
of global symbol. By doing so, you can explicitly show that is a global symbol.
An automatic variable can be referenced to only when the variable is in memory. Otherwise, specifying an
automatic variable causes an error.
30
CHAPTER 1 BASIC FUNCTIONS
1.17.2
Referring to Variables of C Language
Variables of C language can be specified using the same descriptions as in the source
program written in C language.
■ Specifying Variables of C Language
Variables of C language can be specified using the same descriptions as in the source program. The address
of variables of C language should be preceded by the ampersand symbol "&". Some examples are shown in
the Table 1.17-1 .
Table 1.17-1 Examples of Specifying Variables
Example of Variables
Example of Specifying
Variables
Semantics
Regular Variable
int data;
data
Value of data
Pointer
char *p;
*p
Value pointed to by p
Array
char a[5];
a[1]
Value of second element of a
Structure
struct stag {
char c;
int i;
};
struct stag st;
struct stag *stp;
st.c
stp- >c
Value of member c of st
Value of member c of the
structure to which stp points
Union
union utag {
char c;
int i;
} uni;
uni.i
Value of member i of uni
Address of variable
int data;
&data
Address of data
Reference type
int i;
int &ri = i;
ri
Same as i
■ Notes on Symbols of C Language
The C compiler outputs symbol information with "_" prefixed to global symbols. For example, the symbol
main outputs symbol information _main. However, SOFTUNE Workbench permits access using the
symbol name described in the source to make program debugging described in C easier.
Consequently, a symbol name described in C language and a symbol name described in assembler, which
should both be unique, may be identical.
In such a case, the symbol name in the Current Scope normally is preferred. To refer to a symbol name
outside the Current Scope, specify the symbol with the module name.
If there are duplicated symbols outside the Current Scope, the symbol name searched first becomes valid.
To refer to another one, specify the symbol with the module name.
31
CHAPTER 1 BASIC FUNCTIONS
32
CHAPTER 2
DEPENDENCE FUNCTIONS
This chapter describes the functions dependent on
F2MC-8L/8FX family MCU.
2.1 Simulator Debugger
2.2 Emulator Debugger (MB2141)
2.3 Emulator Debugger (MB2146-09/09A/09B)
2.4 Emulator Debugger (MB2146-08)
2.5 Emulator Debugger (MB2146-07)
2.6 Monitor Debugger
33
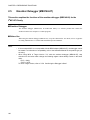
CHAPTER 2 DEPENDENCE FUNCTIONS
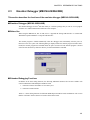
2.1
Simulator Debugger
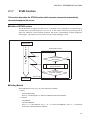
This section describes the functions of the simulator debugger.
■ Simulator Debugger
The simulator debugger simulates the MCU operations with software to evaluate a program.
It is used to evaluate an uncompleted system, the operation of single units, etc.
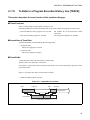
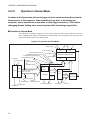
■ Simulation Range
The simulator debugger simulates the MCU operations (instruction operations, memory space, interrupts,
reset, power-save consumption mode, etc.) with software. Peripheral I/Os, such as a timer, DMAC and
serial I/O, other than the CPU core of the actual chip are not supported as peripheral resources. I/O space to
which peripheral I/Os are connected is treated as memory space. There is a method for simulating interrupts
like timer interrupts, and data input to memory like I/O ports. For details, see the sections concerning I/O
port simulation and interrupt simulation.
• Instruction simulation
• Memory simulation
• I/O port simulation (Input port)
• I/O port simulation (Output port)
• Interrupt simulation
• Reset simulation
• Power-save mode simulation
Note:
• Of the low-power consumption modes, the following modes are excluded from the simulation
target.
- Clock mode
- Time-base timer mode
34
CHAPTER 2 DEPENDENCE FUNCTIONS
2.1.1
Instruction Simulation
This section describes the instruction simulation executed.
■ Instruction Simulation
This simulates the operations of all instructions supported by the F2MC-8L/8FX. It also simulates the
changes in memory and register values due to such instructions.
35
CHAPTER 2 DEPENDENCE FUNCTIONS
2.1.2
Memory Simulation
This section describes the memory simulation executed.
■ Memory Simulation
The simulator debugger must first secure memory space to simulate instructions because it simulates the
memory space secured in the host machine memory.
One of the following operations is required.
• To secure the memory area, either use the [Setup] - [Memory Map] menu, or the SET MAP command in
the Command window.
• Load the file output by the Linkage Editor (Load Module File) using either the [Debug] - [Load target
file] menu, or the LOAD/OBJECT command in the Command window.
■ Simulation Memory Space
Memory space access attributes can be specified byte-by-byte using the [Setup] - [Memory Map] menu.
The access attribute of unspecified memory space is undefined.
The access attributes of the memory space, which was not specified by using the [Setup] - [Memory Map]
menu, remain undefined.
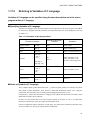
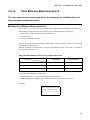
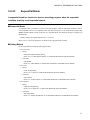
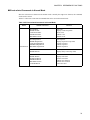
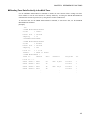
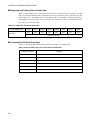
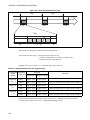
■ Memory Area Access Attributes
Access attributes for memory area can be specified as shown in Table 2.1-1. A guarded access break occurs
if access is attempted against such access attribute while executing a program. When access is made by a
program command, such access is allowed regardless of the attribute, CODE, READ or WRITE. However,
access to memory in an undefined area causes an error.
Table 2.1-1 Types of Access Attributes
Attribute
36
Semantics
CODE
Instruction operation enabled
READ
Data read enabled
WRITE
Data write enabled
undefined
Attribute undefined (access prohibited)
CHAPTER 2 DEPENDENCE FUNCTIONS
2.1.3
I/O Port Simulation
This section explains I/O port simulation executed.
■ I/O Port Simulation
The MCU operation against input port and output port is simulated.
• Input port
The following input port simulation methods are available.
- Whenever a program writes data to the specified port, writing is executed to the specified data output
destination.
- Whenever instruction execution cycle count exceeds the specified cycle count, data is input to the
port.
• Output port
The following output port simulation methods are available.
- Whenever a program calls the specified port, data is input from the specified data input source.
Up to 4096 port addresses can be set.
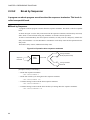
■ Input Source or Output Destination
Input source at the input port, or output destination at the output port, can be specified to the following.
• File
- A text file that can be created using an ordinary editor.
Set the input data's delimiter to "," (comma). After reading the last data from the file, the data is read
again from the beginning of the file.
- Binary file containing direct code
• Terminal
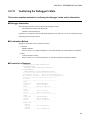
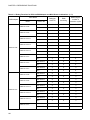
■ I/O Port Settings
I/O port settings can be configured using the following.
• Dialog
- I/O port configuration dialog
Refer to "4.7.2.1 I/O Port" in "SOFTUNE Workbench Operation Manual".
• Command
- SET INPORT or SET OUTPORT
Refer to "1.20 SET INPORT" or "1.23 SET OUTPORT" in "SOFTUNE Workbench Command
Reference Manual".
37
CHAPTER 2 DEPENDENCE FUNCTIONS
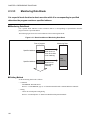
2.1.4
Interrupt Simulation
This section explains interrupt simulation.
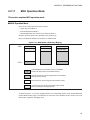
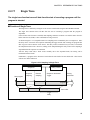
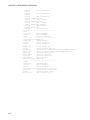
■ Interrupt Simulation
The MCU operation in response to an interrupt request is simulated.
Interrupts can be generated as follows:
• While the program is being executed with a specified cycle count, interrupts are generated per specified
interrupt number, and overrides the interrupt generating conditions.
• Interrupts are generated every time when the command execution cycle count exceeds the specified
cycle count.
If interrupts are masked by the interrupt enable flag when the interrupt-generating conditions are
established, the interrupts are suspended.
■ Control Methods of Interrupts
Interrupts are configured using the following methods.
• Dialog
- Interrupt dialog
Refer to section "4.7.2.2 Interrupts" of "SOFTUNE Workbench Operation Manual".
• Command
- SET INTERRUPT
Refer to section "1.26 SET INTERRUPT" of "SOFTUNE Workbench Command Reference Manual".
38
CHAPTER 2 DEPENDENCE FUNCTIONS
2.1.5
Reset Simulation
This section explains reset simulation.
■ Reset Simulation
The operation of when MCU receives a reset signal is simulated.
At the moment, register is initialized.
The reset execution function by operation of MCU instructions, such as writing to RST bit in the standby
control register, is also supported.
■ Reset Control
Reset control can be achieved as follows.
• Menu
- [Debug] - [Reset MCU] menu
Refer to section "4.6.3 Reset of MCU" of "SOFTUNE Workbench Operation Manual".
• Command
- RESET
Refer to section "1.3 RESET" of "SOFTUNE Workbench Command Reference Manual."
39
CHAPTER 2 DEPENDENCE FUNCTIONS
2.1.6
Low-Power Consumption Mode Simulation
This section describes the low-power consumption mode simulation.
■ Low-Power Consumption Mode Simulation
This simulator debugger can simulate the low-power consumption mode.
Shifting to the low-power consumption mode can be done by writing to the standby control register.
• When SLEEP bit is written
Sleep mode is enabled, and [sleep] appears in the status bar.
• When STOP bit is written
Stop mode is enabled, and [stop] appears in the status bar.
Upon execution of the program, interrupt request is generated, or it goes into a loop until the program
execution is terminated. Each cycle loop increments the cycle count by 1.
During this period, I/O port processing can also be operated.
40
CHAPTER 2 DEPENDENCE FUNCTIONS
2.1.7
STUB Function
This section describes the STUB function which executes commands automatically
when the breakpoint hit occurs.
■ Outline of STUB Function
The STUB function is supported so that a series of commands in the command list can automatically be
executed when a specified breakpoint is hit. The use of this function enables spot processing, such as
simple I/O simulation, external interrupt generation, and memory reprogramming, without changing the
main program. This function is effective only when the simulator debugger is used.
Program execution
execution starts
Break (STUB) processing
Breakpoint is hit
Is there a breakpoint
command list?
NO
YES
Execution restarts
Process a breakpoint command list
(execute commands).
YES
Execution stops
Re-execute
(is no-break specified)?
NO
execution ends
■ Setting Method
The STUB function can be set by any of the following commands.
• Dialog
- Break Setting Dialog
Refer to "4.6.4 Breakpoint" of "SOFTUNE Workbench Operation Manual".
• Command
- SET BREAK
- SET DATABREAK
Refer to "3.1 SET BREAK (type 1)" or "3.10 SET DATABREAK (type 2)" of "SOFTUNE
Workbench Command Reference Manual".
41
CHAPTER 2 DEPENDENCE FUNCTIONS
2.1.8
Break
This Debugger provides five types of break functions. When by each break function
aborts program execution, the address where a break occurred and the break factor are
displayed.
■ Break Functions
This Debugger provides the following five types of break functions;
- Code break
- Data break
- Guarded access break
- Trace buffer-full break
- Forced break
42
CHAPTER 2 DEPENDENCE FUNCTIONS
2.1.8.1
Code Break
It is a function that the simulator debugger aborts the program execution when the code
access specified while executing the program is done.
■ Flow of Code Break
When the program reaches the breakpoint (Immediately before an instruction memory positional is
executed), the simulator debugger does the following processing.
1. The execution of the program is aborted (Before executing the instruction).
2. When the attainment frequency is checked, and it doesn't reach the attainment frequency of the specified
breakpoint, the program execution is restarted. It moves to 3 when it reaches the attainment frequency.
3. The memory position in which execution was aborted is displayed in the status bar.
The breakpoint can be set up to 65535 points or less.
When the code break occurs, the following message appears at the status bar.
Break at address by breakpoint
■ Setting Method
Set code break as follows.
• Command
- SET BREAK
Refer to "3.1 SET BREAK (type 1)" of "SOFTUNE Workbench Command Reference Manual".
• Dialog
- "Code" tab in breakpoint setting dialog
Refer to "4.6.4 Breakpoint" of "SOFTUNE Workbench Operation Manual".
• Window
- Source window/disassemble window
Refer to "3.7 Source Window" or "3.9 Disassemble Window" of "SOFTUNE Workbench Operation
Manual".
43
CHAPTER 2 DEPENDENCE FUNCTIONS
2.1.8.2
Data Break
It is a function that the simulator debugger aborts the program execution when the data
access (read and write) specified while executing the program is done.
■ Flow of Data Break
The simulator debugger does the following processing when the program performs read/write in the
breakpoint.
1. After the execution of the instruction is completed, the execution of the program is aborted.
2. It moves to 3 when the program execution is restarted when the access frequency is checked, and it
doesn't reach the access frequency of the specified data break, and it reaches the access frequency.
3. When it reaches the access frequency and the program execution is aborted, the following information is
displayed in the status bar:
• The memory position of the data breakpoint
• The memory position of the instruction in which it is writing (Or, reading)
4. Next, the executed memory position is displayed.
Up to 65535 data break points can be set.
When the data break occurs, the following message appears at the status bar.
Break at address by databreak at access address
■ Setting Method
Set the data break as follows.
• Command
- SET DATABREAK
Refer to "3.10 SET DATABREAK(type 2)" of "SOFTUNE Workbench Command Reference
Manual".
• Dialog
- "Data" tab in breakpoint setting dialog
Refer to "4.6.4 Breakpoint" of "SOFTUNE Workbench Operation Manual".
44
CHAPTER 2 DEPENDENCE FUNCTIONS
2.1.8.3
Guarded Access Break
It is a function to abort the program execution when the violation to the access
attribute, doing the access, and guarded (An undefined area cannot be accessed) area
are accessed.
■ Guarded Access Breaks
It is a function to abort the program execution when the violation to the access attribute, doing the access,
and guarded (An undefined area cannot be accessed) area are accessed.
Guarded access break occurs in the following cases:
• Code Guarded
An instruction has been executed for an area having no code attribute.
• Read Guarded
A read has been attempted from the area having no read attribute.
• Write Guarded
A write has been attempted to an area having no write attribute.
When a break occurs due to a guarded break, the following message is displayed on the Status Bar.
Break at Address by guarded access {code/read/write} at Access Address
■ Setting Method
Set the access attribute as follows.
• Command
- SET MAP
Refer to "1.13 SET MAP (type 1)" of "SOFTUNE Workbench Command Reference Manual".
• Dialog
- MAP Setting Dialog
Refer to "4.7.3 Memory Map" of "SOFTUNE Workbench Operation Manual".
45
CHAPTER 2 DEPENDENCE FUNCTIONS
2.1.8.4
Trace Buffer-full Break
This function aborts the program execution when the trace buffer becomes buffer-full.
■ Trace Buffer-full Break
This function aborts the program execution when the trace buffer becomes buffer-full.
When the trace buffer-full break occurs, the following message appears at the status bar.
Break at address by trace buffer full
■ Setting Method
Set the trace buffer-full break as follows.
• Command
- SET TRACE/BREAK
Refer to "4.21 SET TRACE" of "SOFTUNE Workbench Command Reference Manual".
• Dialog
- Trace setting dialog
Refer to "4.4.8 Trace" of "SOFTUNE Workbench Operation Manual".
46
CHAPTER 2 DEPENDENCE FUNCTIONS
2.1.8.5
Forced Break
This function forcibly aborts the program execution to generate a break.
■ Forced Break
This function forcibly aborts the program execution to generate a break.
When the forced break occurred, the following message appears at the status bar.
Break at address by command abort request
■ Generation Method
The methods of generating forced breaks are as follows.
• Menu
- [Debug]-[Abort] menu
Refer to "4.6.2 Abort" of "SOFTUNE Workbench Operation Manual".
• Command
- ABORT
Refer to "2.2 ABORT" of "SOFTUNE Workbench Command Reference Manual".
47
CHAPTER 2 DEPENDENCE FUNCTIONS
2.1.9
Measuring the Number of Execution Cycles
This function measures the number of program execution cycles.
■ Items to be Measured
Program execution cycle count and step count are measured.
1. Execution cycle count
Basic cycle count of each instruction, as stated in the programming manual, is calculated.
The maximum measurement value is 232 -1, i.e., 4,294,967,295 cycles.
2. Execution step count
Program execution step count is measured.
Up to 232 -1, i.e., 4,294,967,295 steps, can be measured.
Measurement is done for each program execution, and the results indicate the following.
• The previously recorded program execution step count
• The sum of execution step count after the recent clearance.
■ Displaying of Measurement Result
The measurement result can be displayed using the following method.
• Dialog
- Time measurement dialog
Refer to section "4.6.8 Time Measurement" of "SOFTUNE Workbench Operation Manual".
• Command
- SHOW TIMER
Refer to "4.19 SHOW TIMER" of "SOFTUNE Workbench Command Reference Manual".
■ Clearing of Measurement Result
The measurement result can be cleared using the following method.
• Dialog
- Time measurement dialog
Refer to section "4.6.8 Time Measurement" of "SOFTUNE Workbench Operation Manual".
• Command
- CLEAR TIMER
Refer to "4.20 CLEAR TIMER" of "SOFTUNE Workbench Command Reference Manual".
48
CHAPTER 2 DEPENDENCE FUNCTIONS
2.1.10
To Refer to a Program Execution History, Use [TRACE]
This section describes the trace function of this simulator debugger.
■ Trace Functions
Trace is a function that records program execution record.
Trace data includes the following information that can be used to analyze the program execution record.
• Record of addresses where programs were executed:
this includes the record before/after branch
instructions
• Data accessed while programs are executed:
only the specified attributes are included
■ Acquisition of Trace Data
Trace data acquisition is started/ended at the following timing.
• Acquisition starts
- When a user program is executed
• Acquisition ends
- When a user program is stopped
■ Trace Buffer
A single data unit stored in the trace buffer is called a frame.
The trace buffer can contain up to 1001 frames.
Trace buffer is a ring buffer; when it becomes buffer-full, the new record automatically replaces the oldest
record in the buffer.
Figure 2.1-1 describes how data is stored in the trace buffer.
• When break halts program execution
Figure 2.1-1 Acquisition of trace data
Start
Suspend
Start
Suspend
Program flow
Trace buffer
|------------- 1001 frames maximum -------------|
49
CHAPTER 2 DEPENDENCE FUNCTIONS
2.1.10.1
Displaying Trace Data
This section describes how to display trace data.
■ Display Formats of Trace Data
Two trace data diplay formats are available as follows.
Instruction : displays trace data in the order of command execution
Source :
displays trace data by source row
■ Display Position of Trace Data
Each of the sampled trace data is numbered per frame. This number is called a frame number.
By specifying a frame number, display positioning within the trace buffer can be specified.
The most recently sampled trace data is numbered as 0.
Figure 2.1-2 Frame Numbers at the Time of Tracing
Program flow
Frame number
0
1
2
3
4
5
6
■ Display Methods of Trace Data
Trace data can be displayed in the trace window or the command window.
The following methods can be used. In either case, the same data can be accessed.
• Displaying via the trace window
1. Display the trace window.
- Select [Display] - [Trace] in the menu.
2. Select the display mode of the trace window.
- Right-click on the trace window. In the pop-up menu, select either [Instruction] or [Source].
Refer to section "3.14 Trace Window" of "SOFTUNE Workbench Operation Manual" for detailed
information.
3. Trace data can be updated (if the trace window is already displayed).
- Right-click on the trace window. In the pop-up menu, select [Update]. Trace data in the trace
window is updated.
Refer to section "3.14 Trace Window" of "SOFTUNE Workbench Operation Manual" for detailed
information.
50
CHAPTER 2 DEPENDENCE FUNCTIONS
• Displaying via the command window
1. Display the trace data per display mode.
For instruction: SHOW TRACE
For source:
SHOW TRACE
Refer to section "4.15 SHOW TRACE (type2)" of "SOFTUNE Workbench Command Reference
Manual" for detailed information.
51
CHAPTER 2 DEPENDENCE FUNCTIONS
2.1.10.2
Saving Traced Data
This section explains the methods to save trace data.
■ To Save Trace Data
Trace data can be saved into a specified file.
Both GUI (via window or dialog) and command-only methods can be used. These methods give the same
results.
• Saving via GUI
1. Display the trace window.
- Select [Display] - [Trace] in the menu.
2. Specify a file name to which the trace data will be saved.
- Right-click on the trace window, and select [save] in the pop-up menu. "Save As..." dialog is
displayed.
Here, specify the file name and directory to where you wish to store the file. Refer to section
"4.4.8 Trace" of "SOFTUNE Workbench Operation Manual" for detailed information.
• Saving via command
Save the trace data.
- Execute SHOW TRACE/FILE command.
Refer to section "4.16 SHOW TRACE (type 1)" of "SOFTUNE Workbench Command Reference
Manual" for detailed information.
To append and save data to an existing file, execute SHOW TRACE/FILE/APPEND command.
52
CHAPTER 2 DEPENDENCE FUNCTIONS
2.1.10.3
Searching Traced Data
This section explains the methods to search trace data.
■ Searching of Trace Data
This function searches for trace data with a specified address or frame number.
Both GUI (via window or dialog) and command-only methods can be used. These methods give the same
results.
• Searching via GUI
1. Display the trace window.
- Select [Display] - [Trace] in the menu.
2. Specify the address or the frame number that you wish to search.
- Right-click on the trace window, and select [search] in the pop-up menu. Trace search dialog is
displayed.
Here, specify the address or the frame number that you wish to be displayed. Refer to section
"4.4.8 Trace" of "SOFTUNE Workbench Operation Manual" for detailed information.
• Searching via command
Search the trace data.
- Execute SEARCH TRACE command.
Refer to section "4.23 SEARCH TRACE" of "SOFTUNE Workbench Command Reference
Manual" for detailed information.
53
CHAPTER 2 DEPENDENCE FUNCTIONS
2.1.10.4
To Terminate Trace Obtention
This section describes the buffer full break which terminates trace obtention when the
trace buffer becomes full.
■ Buffer-full Break
When the trace buffer becomes full, trace obtention can be terminated. This function is called trace bufferfull break.
■ Configuration
Controlling of trace buffer-full break can be done using the following methods.
• Setting via GUI
1. Display the trace window.
- Select [Display] - [Trace] in the menu.
2. Trace configuration dialog is displayed.
- Right-click on the trace window, and select [Setup] in the short-cut menu. In the trace setup dialog
displayed, select [Enabled] under [Buffer-full break].
Refer to section "4.4.8 Trace" of "SOFTUNE Workbench Operation Manual" for detailed
information.
• Setting via command
Configure trace buffer-full break.
- Execute SET TRACE /BREAK command.
Refer to section "4.21 SET TRACE" of "SOFTUNE Workbench Command Reference Manual"
for detailed information.
54
CHAPTER 2 DEPENDENCE FUNCTIONS
2.1.11
Confirming the Debugger's State
This section explains various methods of confirming the debugger's state and its
information.
■ Debugger Information
The following information can be obtained at the debugger's startup.
• File information of SOFTUNE Workbench
If problems are encountered with SOFTUNE Workbench and its behavior, refer to the information before
contacting the Sales Representatives.
■ Confirmation Method
Debugger's information can be confirmed as follows.
• Command
- SHOW SYSTEM
Refer to section "1.12 SHOW SYSTEM" of "SOFTUNE Workbench Command Reference Manual".
• Dialog
- Version information dialog
Refer to section "4.9.3 Version Information" of "SOFTUNE Workbench Operation Manual".
■ Content to be Displayed
F2MC-8L/8FX Family SOFTUNE Workbench VxxLxx
ALL RIGHTS RESERVED,
COPYRIGHT(C) FUJITSU SEMICONDUCTOR LIMITED 1997
LICENCED MATERIAL PROGRAM PROPERTY OF FUJITSU SEMICONDUCTOR LIMITED
=======================================================
Cpu information file path
: Path to the CPU information file
Cpu information file version : Version of the CPU information file
=======================================================
Add in DLLs
------------------------------------------------------SiCmn
Product name
: SOFTUNE Workbench
File Path
: Path to SiC896.dll
Version
: Version of SiC896.dll
- - - - - - - - - - - - - - - - - - - - - - - - - - - SiiEd
File Path
: Path to SiiEd3.ocx
Version
: Version of SiiEd3.ocx
------------------------------------------------------SiM896
Product name
: SOFTUNE Workbench
File Path
: Path to SiM896.dll
Version
: Version of SiM896.dll
- - - - - - - - - - - - - - - - - - - - - - - - - - - Language Tools
- Compiler
File Path
: Path to fcc896s.exe
- Assembler
File Path
: Path to fasm896s.exe
- Linker
File Path
: Path to flnk896s.exe
- Librarian
File Path
: Path to flib896s.exe
- FJ-OMF to S-FORMAT Converter
55
CHAPTER 2 DEPENDENCE FUNCTIONS
File Path
: Path to f2ms.exe
- FJ-OMF to INTEL-HEX Converter
File Path
: Path to f2is.exe
- FJ-OMF to INTEL-EXT-HEX Converter
File Path
: Path to f2es.exe
- FJ-OMF to HEX Converter
File Path
: Path to f2hs.exe
------------------------------------------------------SiOsM
Product name
: SOFTUNE Workbench
File Path
: Path to SiOsM896.dll
Version
: Version of SiOsM896.dll
------------------------------------------------------F2MC-8L/8FX Series Debugger DLL
Product name
: SOFTUNE Workbench
File Path
: Path to SiD896.dll
Version
: Version of SiD896.dll
- - - - - - - - - - - - - - - - - - - - - - - - - - - Debugger type
: Current debugger type
MCU type
: Currently selected target MCU
VCpu dll name
: Path and name of currently selected virtual debugger section DLL
VCpu dll version : Version of currently selected virtual debugger section DLL
------------------------------------------------------SiIODef
Product name
: SOFTUNE Workbench
File Path
: Path to SiIODef.dll
Version
: Version of SiIODef.dll
=======================================================
Current path
: Currently specified project path
Language
: Currently selected language
Help file path
: Path to the help files
56
CHAPTER 2 DEPENDENCE FUNCTIONS
2.2
Emulator Debugger (MB2141)
This section explains the functions of the emulator debugger (MB2141).
■ Emulator Debugger
The emulator debugger is a software to evaluate a program by controlling an emulator from a host
computer via a communications line (RS-232C, LAN).
■ Before Use
When using MB2141, first initialize the emulator by referring to "Appendix B Downloading Monitor
Program" and "Appendix C Setting LAN Interface"of "SOFTUNE Workbench Operation Manual".
57
CHAPTER 2 DEPENDENCE FUNCTIONS
2.2.1
Setting Operating Environment
This section explains the operating environment setup.
■ Operating Environment
For the emulator debugger for the MB2141, it is necessary to set the following items according the
operating environment. Predefined default settings for all these setup items are enabled at startup.
Therefore, it is not required to change the settings when using the default settings. Adjusted settings can be
used as new default settings from the next time.
- MCU operation mode
- Memory Mapping
- Timer Minimum Measurement Unit
58
CHAPTER 2 DEPENDENCE FUNCTIONS
2.2.1.1
MCU Operation Mode
This section explains MCU operation mode.
■ MCU Operation Mode
There are three MCU operation modes as follows:
• Single chip mode (Mode 0)
• External ROM mode (Mode 1)
• Internal ROM mode with external access function (Mode 2)
The MCU operation mode varies depending on the product type.
Refer to the Hardware Manual for each MCU for further details.
Figure 2.2-1 MCU Modes and Memory Mapping
0000H
FFFFH
Internal I/O Area
Internal I/O Area
Internal I/O Area
Internal RAM
Internal RAM
Internal RAM
Internal ROM
Mode 0
Internal
ROM
Internal ROM
Mode 1
Mode 2
Internal ROM Area: The emulation memory is substituted
for this area. Always map to the emulation memory.
External Access Area: Can be mapped freely to the emulation
memory and user memory.
Non-Access Area: Can be mapped to the emulation memory.
Internal Access Area: Access is performed to MCU internal
memory regardless of the mapping setup.
As shown in Figure 2.2-1, memory mapping operation varies depending on MCU mode. Internal RAM area
(internal RAM, internal register, and internal I/O) cannot map to the emulation memory because it accesses
internal MCU regardless of mapping setup.
59
CHAPTER 2 DEPENDENCE FUNCTIONS
2.2.1.2
Memory Area Types
This section explains memory area.
■ Memory Area Types
A unit to allocate memory is called an area. Up to 20 areas can be set in 1-byte units. There is no limit on
the size of an area. An access attribute can be set for each area.
There are three different area types as follows:
• User Memory Area
Memory space in the user system is called the user memory area and this memory is called the user
memory.
To set the user memory area, use the SET MAP command.
• Emulation Memory Area
Memory space substituted for emulator memory is called the emulation memory area, and this memory is
called emulation memory.
The user system bus master (DMAC, etc.) cannot access emulation memory.
To set the emulation memory area, use the SET MAP command.
• Undefined Area
A memory area that does not belong to any of the areas described above is part of the user memory area.
This area is specifically called the undefined area.
The undefined area can be set to either NOGUARD area, which can be accessed freely, or GUARD area,
which cannot be accessed. Select either setup for the whole undefined area. If the area attribute is set to
GUARD, a guarded access error occurs if access to this area is attempted.
60
CHAPTER 2 DEPENDENCE FUNCTIONS
2.2.1.3
Memory Mapping
Memory space can be allocated to the user memory and the emulation memory, etc.,
and the attributes of these areas can be specified.
However, the MCU internal resources are not dependent on this mapping setup and
access is always made to the internal resources.
■ Access Attributes for Memory Areas
The access attributes shown in Table 2.2-1 can be specified for memory areas.
A guarded access break occurs if access is attempted in violation of these attributes while executing a
program.
When access to the user memory area and the emulation memory area is made using program commands,
such access is allowed regardless of the READ, WRITE attributes. However, access to memory with the
GUARD attribute in the undefined area, causes an error.
Table 2.2-1 Types of Access Attributes
Area
Attribute
Description
User Memory
Read
Data Read and Instruction Execution Enabled
Emulation Memory
Write
Data Write Enabled
GUARD
Access Disabled
NOGUARD
No check of access attribute
Undefined GUARD
When access is made to an area without the WRITE attribute by executing a program, a guarded access
break occurs after the data has been rewritten if the access target is the user memory area. However, if the
access target is the emulation memory area, the break occurs before rewriting. In other words, writeprotection (memory data cannot be overwritten by writing) can be set for the emulation memory area by not
specifying the WRITE attribute for the area.
This write-protection is only enabled for access made by executing a program, and is not applicable to
access by commands.
■ Creating and Displaying Memory Map
Use the following commands for memory mapping.
• SET MAP:
Sets memory map
• SHOW MAP:
Displays memory map
• CANCEL MAP: Changes memory map setting to undefined
61
CHAPTER 2 DEPENDENCE FUNCTIONS
[Example]
>SET MAP /USER H'0..H'1FFF
>SET MAP /READ/EMULATION H'FF00..H'FFFF
>SET MAP/GUARD
>SHOW MAP
address
attribute
type
0000 .. 1FFF
code read write
user
FF00 .. FFFF
code read
emulation
--------------------------------------------------------------undefined area : guard
setup possibility : user = 19
emulation=19
62
CHAPTER 2 DEPENDENCE FUNCTIONS
2.2.1.4
Timer Minimum Measurement Unit
The timer minimum measurement unit affects the sequencer, the emulation timer and
the performance measurement timer.
■ Setting Timer Minimum Measurement Unit
Choose either 1 s or 100 ns as the timer minimum measurement unit for the emulator of measuring time.
The minimum measurement unit for the following timers is changed depending on this setup.
• Timer values of sequencer (timer conditions at each level)
• Emulation timer
• Performance measurement timer
Table 2.2-2 shows the minimum measurement time length of each timer when 1 s or 100 ns is selected as
the minimum measurement unit.
When the minimum measurement unit is changed, the measurement values of each timer are cleared as
well. The default setting is 1 s.
Table 2.2-2 Minimum Measurement Time Length of Each Timer
1 s selected
100 ns selected
Sequencer timer
About 16 s
About 1.6 s
Emulation timer
About 70 min
About 7 min
Performance measurement timer
About 70 min
About 7 min
Use the following commands to control timers.
• SET TIMERSCALE :
Sets minimum measurement unit for timers
• SHOW TIMERSCALE: Displays status of minimum measurement unit setting for timers
[Example]
>SET TIMERSCALE/100N
>SHOW TIMERSCALE
Timer scale : 100ns
>
63
CHAPTER 2 DEPENDENCE FUNCTIONS
2.2.2
On-the-fly Executable Commands
Certain commands can be executed even while executing a program. This is called "onthe-fly" execution.
■ On-the-fly Executable Commands
Certain commands can be executed on-the-fly. If an attempt is made to execute a command that cannot be
executed on-the-fly, an error "MCU is busy" occurs. Table 2.2-3 lists major on-the-fly executable
functions. For further details, refer to the SOFTUNE Workbench Command Reference Manual.
Meanwhile, on-the-fly execution is enabled only when executing the MCU from the menu or the tool
button. On-the-fly commands cannot be executed when executing the GO command, etc., from the
command window.
Table 2.2-3 Major Functions Executable in On-the-fly Mode
Function
Major Commands
MCU reset
-
RESET
Displaying MCU execution status
-
SHOW STATUS
Displaying trace data
64
Restrictions
Enabled only when trace function
disabled
SHOW TRACE
SHOW MULTITRACE
Enable/Disable trace
-
ENABLE TRACE
DISABLE TRACE
Displaying execution time
measurement value (Timer)
-
SHOW TIMER
Memory operation
(Read/Write)
Emulation memory only operable
Read only enabled in mirror area
ENTER
EXAMINE
COMPARE
FILL
MOVE
DUMP
SEARCH MEMORY
SHOW MEMORY
SET MEMORY
Line assembly, Disassembly
Emulation memory only enabled
Mirror area, Disassembly only
enabled
ASSEMBLE
DISASSEMBLE
CHAPTER 2 DEPENDENCE FUNCTIONS
2.2.3
On-the-fly Memory Access
While on-the-fly, the area mapped to the emulation memory is Read/Write enabled, but
the area mapped to the user memory is Read-only enabled.
■ Read/Write Memory while On-the-fly
The user memory cannot be accessed while on-the-fly (executing MCU). However, the emulation memory
can be accessed. (The cycle-steal algorithm eliminates any negative effect on the MCU speed.)
This emulator allows the user to use part of the emulation memory as a mirror area. The mirror area holds a
copy of the user memory. Using this mirror area makes the user memory to Read-only enabled function
available while on-the-fly.
However, at least one time access must be allowed before the emulation memory with the mirror area
setting has the same data as the user memory. The following copy types allow the emulation memory with
the mirror area setting to have the same data as the user memory.
• Copying only required portion using memory access commands
Data in the specified portion can be copied by executing a command that accesses memory. The
following commands access memory.
- Memory operation commands
SET MEMORY, SHOW MEMORY, EXAMINE, ENTER, COMPARE, FILL, MOVE,
SEARCH MEMORY, DUMP, COPY, VERIFY
- Data load/save commands
LOAD, SAVE
Figure 2.2-2 Access to Mirror Area while MCU Suspended
Memory access
Executing
command
Emulation memory
(Mirror setting)
Reflected
MCU
operation
(Suspended)
User memory
65
CHAPTER 2 DEPENDENCE FUNCTIONS
Figure 2.2-3 On-the-fly Access to Mirror Area
Memory read
Executing
command
Emulation memory
(Mirror setting)
Reflected
MCU
operation
(Operating)
Memory access
User memory
Note:
Memory access by a bus master other than the MCU is not reflected in the mirror area.
66
CHAPTER 2 DEPENDENCE FUNCTIONS
2.2.4
Break
This Debugger provides seven types of break functions. When by each break function
aborts program execution, the address where a break occurred and the break factor are
displayed.
■ Break Functions
This Debugger provides the following seven types of break functions;
- Code break
- Data break
- Sequential break
- Guarded access break
- Trace buffer-full break
- Performance buffer-full break
- Forced break
67
CHAPTER 2 DEPENDENCE FUNCTIONS
2.2.4.1
Code Break
This function aborts the program execution by monitoring a specified address by
software. A break occurs before executing an instruction at the specified address.
■ Code Break
This function aborts the program execution by monitoring a specified address by software. A break occurs
before executing an instruction at the specified address.
Up to 65535 addresses can be set for this debugger.
When the code break occurs, the following message appears at the status bar.
Break at address by breakpoint
■ Setting Method
Set code break as follows.
• Command
- SET BREAK
Refer to "3.1 SET BREAK (type 1)" of "SOFTUNE Workbench Command Reference Manual".
• Dialog
- "Code" tab in breakpoint setting dialog
Refer to "4.6.4 Breakpoint" of "SOFTUNE Workbench Operation Manual".
• Window
- Source window/disassemble window
Refer to "3.7 Source Window" or "3.9 Disassemble Window" of "SOFTUNE Workbench Operation
Manual".
■ Notes on Instruction Execution Break
If a break point is set after the instruction shown in Figure 2.2-4, a break occurs before the instruction is
executed. As the debugger is designed to perform step execution internally and cause a break after the
execution, only the last one instruction cannot be executed in real time.
68
CHAPTER 2 DEPENDENCE FUNCTIONS
Figure 2.2-4 List of Instructions Affecting Instruction Execution Break
If an instruction execution break is set following the 1-byte branch instruction shown below, it occurs
immediately after the instruction is executed, because the 1-byte branch instruction is affected by prefetch
of the next instruction when executed. Instructions when the instruction execution break is set are just
prefetched but not executed.
RET
RETI
JMP @A
CALLV #vct
To avoid this, set the instruction execution break shifted one byte or set a breakpoint using the SET
EVENT/CODE command, which is unaffected by prefetch.
69
CHAPTER 2 DEPENDENCE FUNCTIONS
2.2.4.2
Data Break
It is a function to abort the program execution when the data access (read or write) is
done to a specified address.
■ Data Break
This function aborts the program execution when a data access (read/write) is made to a specified address.
Up to 65535 data break points can be set for this debugger.
When the data break occurs, the following message appears at the status bar.
Break at address by databreak at access address
■ Setting Method
Set the data break as follows.
• Command
- SET DATABREAK
Refer to "3.10 SET DATABREAK(type 2)" of "SOFTUNE Workbench Command Reference
Manual".
• Dialog
- "Data" tab in breakpoint setting dialog
Refer to "4.6.4 Breakpoint" of "SOFTUNE Workbench Operation Manual".
70
CHAPTER 2 DEPENDENCE FUNCTIONS
2.2.4.3
Sequential Break
A sequential break is a function to abort an executing program, when the sequential
condition is met by event sequential control.
■ Sequential Break
A sequential break is a function to abort an executing program, when the sequential condition is met by
event sequential control. Use a sequential break when the event mode is set to normal mode using the SET
MODE command. When a break occurs due to a sequential break, the following message is displayed on
the Status Bar.
Break at Address by sequential break (level = Level No.)
Refer to "2.2.6 Control by Sequencer" for details of the sequential break function.
■ Setting Method
Set the sequential break using the following procedure:
1. Set event mode.
• Dialog
- Debug Environment Setting Dialog
Refer to "4.7.2.3 Debug Environment" of "SOFTUNE Workbench Operation Manual".
• Command
- SET MODE
Refer to "1.4 SET MODE" of "SOFTUNE Workbench Command Reference Manual".
2. Set events
• Dialog
- Event Setting Dialog
Refer to "4.6.5 Event" of "SOFTUNE Workbench Operation Manual".
• Command
- SET EVENT
Refer to "3.15 SET EVENT" of "SOFTUNE Workbench Command Reference Manual".
3. Set sequencer
• Dialog
- Sequence Setting Dialog
Refer to "4.6.6 Sequence" of "SOFTUNE Workbench Operation Manual".
• Command
- SET SEQUENCE
Refer to "3.20 SET SEQUENCE" of "SOFTUNE Workbench Command Reference Manual".
71
CHAPTER 2 DEPENDENCE FUNCTIONS
2.2.4.4
Guarded Access Break
A guarded access break aborts an executing program when accessing in violation of
the access attribute and accessing a guarded area (undefined area in undefined area).
■ Guarded Access Breaks
A guarded access break aborts an executing program when accessing in violation of the access attribute,
and accessing a guarded area (undefined area in undefined area).
A guarded access break occurs in the following cases:
1. Code Guarded
An instruction has been executed for an area having no code attribute.
2. Read Guarded
A read has been attempted from the area having no read attribute.
3. Write Guarded
A write has been attempted to an area having no write attribute.
If a guarded access occurs, the following message is displayed on the Status Bar.
Break at Address by guarded access {code/read/write} at Access Address
■ Setting Method
Set the access attribute as follows.
• Command
- SET MAP
Refer to "1.13 SET MAP (type 1)" of "SOFTUNE Workbench Command Reference Manual".
• Dialog
- MAP Setting Dialog
Refer to "4.7.3 Memory Map" of "SOFTUNE Workbench Operation Manual".
72
CHAPTER 2 DEPENDENCE FUNCTIONS
2.2.4.5
Trace Buffer-full Break
This function aborts the program execution when the trace buffer becomes buffer-full.
■ Trace Buffer-full Break
This function aborts the program execution when the trace buffer becomes buffer-full.
When the trace buffer-full break occurs, the following message appears at the status bar.
Break at address by trace buffer full
■ Setting Method
Set the trace buffer-full break as follows.
• Command
- SET TRACE/BREAK
Refer to "4.21 SET TRACE" of "SOFTUNE Workbench Command Reference Manual".
• Dialog
- Trace setting dialog
Refer to "4.4.8 Trace" of "SOFTUNE Workbench Operation Manual".
73
CHAPTER 2 DEPENDENCE FUNCTIONS
2.2.4.6
Performance Buffer-full Break
It is a function to abort the program execution when the buffer for the performance
measurement data storage becomes buffer-full.
■ Performance Buffer-full Break
It is a function to abort the program execution when the buffer for the performance measurement data
storage becomes buffer-full.
When the performance buffer-full break occurs, the following message appears at the status bar.
Break at address by performance buffer full
■ Setting Method
Set the performance buffer-full break as follows.
• Command
- SET PERFORMANCE/BREAK
Refer to "4.7 SET PERFORMANCE" of "SOFTUNE Workbench Command Reference Manual".
• Dialog
- Performance setting dialog
Refer to "4.4.13 Performance" of "SOFTUNE Workbench Operation Manual".
74
CHAPTER 2 DEPENDENCE FUNCTIONS
2.2.4.7
Forced Break
This function forcibly aborts the program execution to generate a break.
■ Forced Break
This function forcibly aborts the program execution to generate a break.
When the forced break occurred, the following message appears at the status bar.
Break at address by command abort request
■ Generation Method
The methods of generating forced breaks are as follows.
• Menu
- [Debug]-[Abort] menu
Refer to "4.6.2 Abort" of "SOFTUNE Workbench Operation Manual".
• Command
- ABORT
Refer to "2.2 ABORT" of "SOFTUNE Workbench Command Reference Manual".
Note:
The forced break cannot be generated when the MCU in the low power consumption mode or in the
hold state. If the MCU is in the low power consumption mode or in the hold state when the strong
break is requested by the [Debug]-[Abort] menu during the program execution, the [Debug] - [Abort]
menu is ignored. To generate a break forcibly, use the [Debug] - [Abort] menu to remove a factor by
the user system or use the [Debug]-[Reset of MCU] menu to remove it. If the MCU enters the low
power consumption mode or the hold state during the program execution, the condition is displayed
at the status bar.
75
CHAPTER 2 DEPENDENCE FUNCTIONS
2.2.5
Events
The emulator can monitor the MCU bus operation, and generate a trigger at a specified
condition called an event.
In this emulator, event triggers are used in order to determine which function event
triggers are used accounting to event modes for the following functions;
• Sequencer
• Sampling condition for multi-trace
• Measuring point in performance measurement
■ Setting Events
Up to eight events can be set.
Table 2.2-4 shows the conditions that can be set for events.
Table 2.2-4 Conditions for Setting Events
Condition
Description
Address
Memory location (Address bit masking enabled)
Data
8-bit data (data bit masking enable)
NOT specified enable
Status
Select from among data read, data write, instruction execution and data modify.
External probe
8-bit data (bit masking enable)
Notes:
• In instruction execution, an event trigger is generated only when an instruction is executed. This
status cannot be specified concurrently with other status.
• The data modify is a function to generate the event trigger when the data of specified address is
rewritten. When the data modify is specified in the status, the specified data is ignored. This
status cannot be specified concurrently with other status.
Use the following commands to set an event.
76
SET EVENT:
Sets event
SHOW EVENT:
Display event setup status
CANCEL EVENT:
Deletes event
ENABLE EVENT:
Enable event
DISABLE EVENT:
Disable event
CHAPTER 2 DEPENDENCE FUNCTIONS
[Example]
>SET EVENT
1,func1
>SET EVENT/WRITE 2,data[2],!d=h'10
>SET EVENT/MODIFY 3,102
An event can be set in the Event window as well.
■ Event Modes
There are three event modes as listed below. To determine which function event triggers are used for, select
one using the SET MODE command. The default is normal mode.
The event value setting are made for each mode, so switching the event mode changes the event settings as
well.
• Normal Mode
Event triggers are used for sequencer.
Since the sequencer can perform control at 8 levels, it can control sequential breaks, time measurement
and trace sampling. Real-time tracing in the normal mode is performed by single trace (tracing function
that samples program execution continuously).
• Multi Trace Mode
Event triggers are used for multitracing (trace function that samples data before and after event trigger
occurrence).
• Performance Mode
Event triggers are used for performance measurement to measure time duration between two event
trigger occurrences and count of event trigger occurrences.
77
CHAPTER 2 DEPENDENCE FUNCTIONS
2.2.5.1
Operation in Normal Mode
As shown in the figure below, the event trigger set in the normal mode performs input to
the sequencer. In the sequencer, either branching to any level, or terminating the
sequencer, can be specified as an operation at event trigger occurrence. This enables
debugging (breaks, limiting trace, measuring time) while monitoring program flow.
■ Operation in Normal Mode
The termination of sequencer triggers the delay counter. When the delay counter reaches the specified
count, sampling for the single trace terminates. A break normally occurs at this point, but if necessary, the
program can be allowed to run on without a break.
Figure 2.2-5 Operation in Normal Mode
DISABLE TRACE
SHOW TRACE/STATUS
SET TRACE
ENABLE TRACE
Enable/Disable
control
SHOW TRACE/DATA
SET SEQUENCE/NO TRACE
SET SEQUENCE/ENABLE TRACE
CLEAR TRACE
SET SEQUENCE/DISABLE TRACE
SET EVENT
CANCEL EVENT
Enable
Disable
Enable/Disable
control
Measurement ends
CANCEL
SEQUENCE/TIMER
SET
SEQUENCE/TIMER
Events
Single trace measurement
SEARCH TRACE
SHOW SEQUENCE level
Buffer-full break
control
Select event number causing
trigger at each level, set
pass count value.
When each condition at each level met
Timer setup
for each
condition
When count ends
When condition met
Delay
counter
Sequencer
When count ends
SET
SEQUENCE/EVENT
DISABLE EVENT
Timer latch
CANCEL
SEQUENCE/EVENT
SHOW SEQUENCE/ALL
ENABLE EVENT
SHOW EVENT
78
Instructing MCU to
suspend operation
SHOW DELAY
SET DELAY
CHAPTER 2 DEPENDENCE FUNCTIONS
■ Event-related Commands in Normal Mode
Since the real-time trace function in the normal mode is actually the single trace function, the commands
can be used to control.
Table 2.2-5 shows the event-related commands that can be used in the normal mode.
Table 2.2-5 Event-related Commands in Normal Mode
Mode
Normal Mode
Usable Command
Function
SET EVENT
SHOW EVENT
CANCEL EVENT
ENABLE EVENT
DISABLE EVENT
Sets event
Displays event setup status
Delete event
Enables event
Disables event
SET SEQUENCE
SHOW SEQUENCE
CANCEL SEQUENCE
ENABLE SEQUENCE
DISABLE SEQUENCE
Sets sequencer
Displays sequencer setup status
Cancels sequencer
Enables sequencer
Disables sequencer
SET DELAY
SHOW DELAY
Sets delay count
Displays delay count setup status
SET TRACE
SHOW TRACE
SEARCH TRACE
ENABLE TRACE
DISABLE TRACE
CLEAR TRACE
Sets trace buffer-full break
Displays trace data
Searches trace data
Enables trace function
Disables trace function
Clears trace data
79
CHAPTER 2 DEPENDENCE FUNCTIONS
2.2.5.2
Operation in Multi Trace Mode
When the multi trace mode is selected as the event mode, the real-time trace function
becomes the multi trace function, and events are used as triggers for multitracing.
■ Operation in Multi Trace Mode
Multitracing is a trace function that samples data before and after an event trigger occurrence. When the
multi trace mode is selected as the event mode, the real-time trace function becomes the multi trace
function, and events are used as triggers for multitracing.
Figure 2.2-6 Operation in Multi Trace Mode
SHOW MULTITRACE/STATUS
SET EVENT
ENABLE MULTITRACE
SET MULTITRACE
CANCEL EVENT
DISABLE MULTITRACE
Enable/Disable control
Enable
Events
Disable
All enabled events
generate trigger
DISABLE EVENT
Buffer full break control
Multitrace measurement
CLEAR MULTITRACE
ENABLE EVENT
SHOW MULTITRACE
SHOW EVENT
80
Instructing
MCU to
suspend
operation
SEARCH MULTITRACE
CHAPTER 2 DEPENDENCE FUNCTIONS
■ Event-related Commands in Multi Trace Mode
Table 2.2-6 shows the event-related commands that can be used in the multitrace mode.
Table 2.2-6 Event-related Commands in Multi Trace Mode
Mode
Multi Trace Mode
Usable Command
Function
SET EVENT
SHOW EVENT
CANCEL EVENT
ENABLE EVENT
DISABLE EVENT
Sets event
Displays event setup status
Deletes event
Enables event
Disables event
SET MULTITRACE
SHOW MULTITRACE
SEARCH MULTITRACE
ENABLE MULTITRACE
DISABLE MULTITRACE
CLEAR MULTITRACE
Sets trace buffer-full break
Displays trace data
Searches trace data
Enables trace function
Disables trace function
Clears trace data
81
CHAPTER 2 DEPENDENCE FUNCTIONS
2.2.5.3
Operation in Performance Mode
Event triggers set in the performance mode are used to measure performance. The time
duration between two event occurrences can be measured and the event occurrences
can be counted.
■ Operation in Performance Mode
The event triggers that are set in the performance mode are used to measure performance. The time
duration between two event occurrences can be measured and the event occurrences can be counted.
Figure 2.2-7 Operation in Performance Mode
SHOW PERFORMANCE/STATUS
SET EVENT
SET PERFORMANCE
CANCEL EVENT
Buffer full break control
Enable
Events
Disable
Limited to following
combinations:
1,2 3,4 5,6 7,8
DISABLE EVENT
Performance measurement
CLEAR PERFORMANCE
ENABLE EVENT
SHOW PERFORMANCE
SHOW EVENT
82
Instructing
MCU to
suspend
operation
CHAPTER 2 DEPENDENCE FUNCTIONS
■ Event-related Commands in Performance Mode
Table 2.2-7 shows the event-related commands that can be used in the performance mode.
Table 2.2-7 Event-related Commands in Performance Mode
Mode
Performance Mode
Usable Command
Function
SET EVENT
SHOW EVENT
CANCEL EVENT
ENABLE EVENT
DISABLE EVENT
Sets event
Displays event setup status
Deletes event
Enables event
Disables event
SET PERFORMANCE
SHOW PERFORMANCE
CLEAR PERFORMANCE
Sets performance
Displays performance setup status
Clears performance measurement data
83
CHAPTER 2 DEPENDENCE FUNCTIONS
2.2.6
Control by Sequencer
This function aborts program execution when a program passes through a specified
event based on a specific sequence under conditions of the event.
■ Sequence Function
This function aborts program execution when a program passes through a specified event based on a
specific sequence under conditions of the event. A break generated by this function is referred to as a
sequential break.
This function enables time measurement or sampling control as well as a break.
■ Use Conditions
To use the sequence function, set the event mode to the normal mode.
For details about setting, refer to one of the following.
"1.4 SET MODE" of "SOFTUNE Workbench Command Reference Manual"
"4.7.2.3 Debug Preferences" of "SOFTUNE Workbench Operation Manual"
■ Control by Sequencer
As shown in Table 2.2-8, controls can be made at 8 different levels.
At each level, 8 events and 1 timer condition (9 conditions in total) can be set.
A timer condition is met when the timer count starts at entering a given level and the specified time is
reached.
For each condition, the next operation can be specified when the condition is met. Select any one of the
following.
- Move to required level.
- Terminate sequencer.
The conditions set for each level are determined by OR. Therefore, if any one condition is met, the
sequencer either moves to the required level, or terminates. In addition, trace sampling suspend/resume can
be controlled when a condition is met.
Table 2.2-8 Sequencer Specifications
Function
84
Specifications
Level count
8 levels
Conditions settable for each level
8 event conditions (1 to 16777216 times pass count can be
specified for each condition.)
1 timer condition (Up to 16 s. in 1s unit or up to 1.6 s. in 100
ns units can be specified.*)
Operation when condition met
Branches to required level or terminates sequencer.
Controls trace sampling.
Other function
Timer latch enable at level branching
Operation when sequencer terminates
Starts delay counter.
CHAPTER 2 DEPENDENCE FUNCTIONS
*: The minimum measurement unit for Timer value can be set to either 1 s or 100 ns using the SET
TIMERSCALE command.
85
CHAPTER 2 DEPENDENCE FUNCTIONS
2.2.6.1
Setting Sequencer
The sequencer operates in the following order:
1. The sequencer starts from level 1 simultaneously with the start of program executing.
2. Depending on the setting at each level, branching to the required level is performed
when the condition is met.
3. When sequencer termination is specified, the sequencer terminates when the
condition is met.
4. When the sequencer terminates, the delay counter starts counting.
■ Setting Sequencer
Figure 2.2-8 shows the sequencer operation.
Figure 2.2-8 Operation of Sequencer
Start executing program. (Start sequencer.)
Set Conditions
Operation when Condition Met
[Use event number 1?]
[Pass counter]
[Trace control] / [Branch level number]
[Use event number 2?]
[Pass counter]
[Trace control] / [Branch level number]
[Use event number 3?]
[Pass counter]
[Trace control] / [Branch level number]
[Use event number 4?]
[Pass counter]
[Trace control] / [Branch level number]
[Use event number 5?]
[Pass counter]
[Trace control] / [Branch level number]
[Use event number 6?]
[Pass counter]
[Trace control] / [Branch level number]
[Use event number 7?]
[Pass counter]
[Trace control] / [Branch level number]
[Use event number 8?]
[Pass counter]
[Trace control] / [Branch level number]
Timer condition [Waiting time]
[Trace control] / [Branch level number]
Terminate
sequencer
Branch to specified level.
Start delay count
86
CHAPTER 2 DEPENDENCE FUNCTIONS
[Setup Examples]
• Terminate sequencer when event 1 occurs.
>SET SEQUENCE/EVENT 1,1,J=0
• Terminate sequencer when event 2 occurs 16 times.
>SET SEQUENCE/EVENT 1,2,16,J=0
• Terminate sequencer when event 2 occurs after event 1 occurred. However, do not terminate sequencer
if event 3 occurs between event 1 and event 2.
>SET SEQUENCE/EVENT 1,1,J=2
>SET SEQUENCE/EVENT 2,2,J=0
>SET SEQUENCE/EVENT 2,3,J=1
• Terminate sequencer when event 2 occurs less than 300 s after event 1 occurred.
>SET SEQUENCE/EVENT 1,1,J=2
>SET SEQUENCE/EVENT 2,2,J=0
>SET SEQUENCE/TIMER 2,300,J=1
>SHOW SEQUENCE
Sequencer Enable
level1
Indicates
move to level
2 when event
1 occurs at
level 1
level2
level3
level4
level5
level6
level7
level8
1 |1|->2
| |
| |
| |
| |
| |
| |
| |
2 | |
|2|->end | |
| |
| |
| |
| |
| |
3 | |
| |
| |
| |
| |
| |
| |
| |
4 | |
| |
| |
| |
| |
| |
| |
| |
5 | |
| |
| |
| |
6 | |
| |
| |
| |
7 | |
| |
| |
| |
| |
| |
| |
| |
8 | |
| |
| |
| |
| |
| |
| |
| |
T | |
|T|->1
| |
| |
| |
| |
| |
| |
Indicates terminating
| |
| |event 2 | |
sequencer
when
occurs
| |at level|2.|
| |
Latch 1 ( -> ) =
| |
| |
Latch 2 ( -> ) =
>SHOW SEQUENCE 2
level no. = 2
Indicates move to level 1
when 300
μs passed before
jmp-level1
event 2 occurs at level 2
event
pass-count
2
1
enable
end
timer
00:00:000:300:000
enable
1
trace-cnt1
87
CHAPTER 2 DEPENDENCE FUNCTIONS
2.2.6.2
Break by Sequencer
A program can aborts program execution when the sequencer terminates. This break is
called a sequential break.
■ Break by Sequencer
A program can aborts program execution when the sequencer terminates. This break is called a sequential
break.
As shown in Figure 2.2-9, the delay count starts when the sequencer terminates, and after delay count ends,
either "break" or "not break but tracing only terminates" is selected as the next operation.
To make a break immediately after the sequencer terminates, set delay count to 0 and specify "Break after
delay count terminates". Use the SET DELAY command to set the delay count and the operation after the
delay count.
The default is delay count 0, and Break after delay count.
Figure 2.2-9 Operation when sequencer terminates
Tracing terminates
Break (Sequential break)
Sequencer
terminates
Delay
counter
Count ends
Tracing terminates
Not break
[Examples of Delay Count Setups]
• Break when sequencer terminates.
>SET DELAY/BREAK 0
• Break when 100-bus-cycle tracing done after sequencer terminates.
>SET DELAY/BREAK 100
• Terminate tracing, but do not break when sequencer terminates.
>SET DELAY/NOBREAK 0
• Terminate tracing, but do not break when 100-bus-cycle tracing done after sequencer terminates.
>SET DELAY/NOBREAK 100
88
CHAPTER 2 DEPENDENCE FUNCTIONS
2.2.6.3
Trace Sampling Control by Sequencer
When the event mode is in the normal mode, real-time trace executing tracing called
single trace.
If the trace function is enabled, single trace samples all the data from the start of
executing a program until the program is suspended.
■ Trace Sampling Control by Sequencer
Sets up suspend/resume trace sampling for each condition at each level of the sequencer. Figure 2.2-10
shows the trace sampling flow.
For example, it is possible to suspend trace sampling when event 1 occurs, and then resume trace sampling
when event 2 occurs. Sampling trace data can be restricted.
Figure 2.2-10 Trace Sampling Control (1)
Start
Suspend
Resume
Suspend
Resume
Suspend
Program flow
Trace buffer
As shown in Figure 2.2-11, trace sampling can be disabled during the period from the start of a program
execution until the first condition occurs. For this setup, use the GO command or the SET GO command.
[Example]
>GO/DISABLETRACE
>SET GO/DISABLETRACE
>GO
Figure 2.2-11 Trace Sampling Control (2)
Resume
Start
Suspend Resume
Suspend
Resume
Suspend
Program flow
Trace buffer
89
CHAPTER 2 DEPENDENCE FUNCTIONS
[Setup Example]
Suspend trace sampling when event 1 occurs, and then resume at event 2 and keep sampling data until
event 3 occurs.
Start
Level 1
Event 1
NO
YES
Suspend trace sampling.
Level 2
Event 2
NO
YES
Resume trace sampling.
Level 3
Event 3
NO
YES
Suspend trace sampling.
>SET SEQUENCE/EVENT/DISABLETRACE 1,1,J=2
>SET SEQUENCE/EVENT/ENABLETRACE 2,2,J=3
>SET SEQUENCE/EVENT/DISABLETRACE 3,3,J=2
90
CHAPTER 2 DEPENDENCE FUNCTIONS
2.2.6.4
Time Measurement by Sequencer
Time can be measured using the sequencer. A time measurement timer called the
emulation timer is used for this purpose. When branching is made from a specified
level to another specified level, a timer value is fetched. Up to two emulation timer
values can be fetched. This function is called the timer latch function.
■ Time Measurement by Sequencer
The time duration between two given points in a complex program flow can be measured using the timer
latch function.
The timing for the timer latch can be set using the SET SEQUENCE command; the latched timer values
can be displayed using the SHOW SEQUENCE command.
When a program starts execution, the emulation timer is initialized and then starts counting. Select either
1s or 100 ns as the minimum measurement unit for the emulation timer. Set the measurement unit using
the SET TIMERSCALE command.
When 1 s is selected, the maximum measured time is about 70 minutes; when 100 ns is selected, the
maximum measured time is about 7 minutes. If the timer overflows during measurement, a warning
message is displayed when the timer value is displayed using the SHOW SEQUENCE command.
91
CHAPTER 2 DEPENDENCE FUNCTIONS
2.2.6.5
Sample Flow of Time Measurement by Sequencer
In the following sample, when events are executed in the order of Event 1, Event 2 and
Event 3, the execution time from the Event 1 to the Event 3 is measured. However, no
measurement is made if Event 4 occurs anywhere between Event 1 and Event 3.
■ Sample Flow of Time Measurement by Sequencer
Start
Level 1
NO
Event 1
YES
Branch from level 1 to level 2 (Timer latch 1)
Level 2
YES
Event 4
NO
Event 2
YES
Level 3
YES
Event 4
NO
Event 3
YES
Sequencer terminates at level 3 (Timer latch 2)
End
92
CHAPTER 2 DEPENDENCE FUNCTIONS
>SET SEQUENCE/EVENT
1,1,J=2
>SET SEQUENCE/EVENT
2,4,J=1
>SET SEQUENCE/EVENT
2,2,J=3
>SET SEQUENCE/EVENT
3,4,J=1
>SET SEQUENCE/EVENT
3,2,J=0
>SET SEQUENCE/LATCH
1,1,2
>SET SEQUENCE/LATCH
2,3,0
Indicates that, if event 3
occurs at level 3, the
sequencer terminates and
let the timer latched.
>SHOW SEQUENCE
Sequencer Enable
Indicates
that, if event
1 occurs at
level 1, move
to level 2 and
let the timer
latched.
level1
level2
level3
level4
level5
level6
level7
level8
1 |1|#>2
| |
| |
| |
| |
| |
| |
| |
2 | |
|2|->3
| |
| |
| |
| |
| |
| |
3 | |
| |
|3|#end
| |
| |
| |
| |
| |
4 | |
|4|->1
|4|->1
| |
| |
| |
| |
| |
5 | |
| |
| |
| |
| |
| |
| |
| |
6 | |
| |
| |
| |
| |
| |
| |
| |
7 | |
| |
| |
| |
| |
| |
| |
| |
8 | |
| |
| |
| |
| |
| |
| |
| |
T | |
|T|->1
| |
| |
| |
| |
| |
| |
Indicate time values of timer latch 1 and timer latch 2. The time
value, deducting the value of the timer latch 1 from the value of the
timer latch 2, represents the execution time.
Time is displayed in the following format.
00 m
00 s 000 ms
minutes
seconds
milliseconds
000.0
microseconds
93
CHAPTER 2 DEPENDENCE FUNCTIONS
2.2.7
To Refer to a Program Execution History, Use [TRACE]
This section describes the real-time trace function of this emulator debugger.
■ Real-time Trace Function
Trace is a function that records program execution record.
Trace data includes the following information that can be used to analyze the program execution record.
• The record of programs executed (address)
• Data accessed while executing programs (specified attributes only)
• Status information
Access status: read / write / internal access
Device status: Instruction execution / reset / hold
• External probe data
• Sequencer execution level
■ Trace Mode
There are two trace methods prepared.
• Single trace: traces from the beginning to the end of program execution
• Multi trace: traces when events occur
■ Trace Buffer
Trace buffer is a location where recorded data is stored.
A single data unit stored in the trace buffer is called a frame.
The trace buffer can contain up to 32,768 (32K) frames.
Trace buffer is a ring buffer; when it becomes buffer-full, the new record automatically replaces the oldest
record in the buffer.
94
CHAPTER 2 DEPENDENCE FUNCTIONS
2.2.7.1
Single Trace
The single trace function traces all data from the start of executing a program until the
program is aborted.
■ Function of Single Trace
The single trace is enabled by setting the event mode to normal mode using the SET MODE command.
The single trace function traces all data from the start of executing a program until the program is
suspended.
If the real-time trace function is enabled, data sampling continues execution to record the data in the trace
buffer while the GO, STEP, CALL commands are being executed.
As shown in Figure 2.2-12, suspend/resume trace sampling can be controlled by the event sequencer. Since
the delay can be set between the sequencer terminating the trigger and the end of tracing, the program flow
after an given event occurrence can be traced. The delay count is counted in bus cycle units, so it matches
the sampled trace data count. However, nothing can be sampled during the delay count if trace sampling is
suspended when the sequencer is terminated.
After the delay count ends, a break occurs normally due to the sequential break, but tracing can be
terminated without a break.
Furthermore, a program can be allowed to break when the trace buffer becomes buffer-full. This break is
called a trace-buffer-full break.
Figure 2.2-12 Sampling in Single Trace
Delay counter
Sequencer
Suspend
sampling
Resume
sampling
Sequencer terminates
Trigger
Tracing
terminates
Start program
Program flow
Trace buffer
Delay
95
CHAPTER 2 DEPENDENCE FUNCTIONS
■ Frame Number and Step Number in Single Trace
The sampled trace data is numbered in frame units. This number is called the frame number.
When displaying trace data, the starting location in the trace buffer can be specified using the frame
number. The trace data at the point where the sequencer termination trigger occurs is numbered 0; trace
data sampled before reaching the trigger point is numbered negatively, and the data sampled after the
trigger point is numbered positively (See Figure 2.2-13).
If there is no sequencer termination trigger point available, the trace data sampled last is numbered 0.
Figure 2.2-13 Frame Number in Single Trace
.
.
.
-3
-2
-1
0 (Trigger point)
+1
+2
+3
.
.
.
96
Delayed frames
CHAPTER 2 DEPENDENCE FUNCTIONS
2.2.7.2
Setting Single Trace
The following settings 1 to 4 are required before executing single trace. Once these
settings have been made, trace data is sampled when a program is executed.
1. Set event mode to normal mode.
2. Enable trace function.
3. Set events, sequencer, and delay count.
4. Set trace-buffer-full break.
■ Setting Single Trace
The following settings are required before executing single trace. Once these settings have been made,
trace data is sampled when a program is executed.
1. Set event mode to normal mode.
Use SET MODE command to make this setting.
2. Enable trace function.
Use the ENABLE TRACE command. To disable the function, use the DISABLE TRACE command.
The default is Enable.
3. Set events, sequencer, and delay count.
Trace sampling can be controlled by setting the sequencer for events. If this function is not needed, there
is no need of this setting.
To set events, use the SET EVENT command.
command.
To set the sequencer, use the SET SEQUENCE
Furthermore, set the delay count between sequencer termination and trace ending, and the break
operation (Break or Not Break) when the delay count ends. If the data after event occurrence is not
required, there is no need of this setting.
If Not Break is set, the trace terminates but no break occurs. To check trace data in on-the-fly, use this
setup by executing the SET DELAY command.
97
CHAPTER 2 DEPENDENCE FUNCTIONS
4. Set trace-buffer-full break.
The program can be allowed to break when the trace buffer becomes buffer-full. Use the SET TRACE
command for this setting. The default is Not Break. Display the setup status using the SHOW TRACE/
STATUS command.
Table 2.2-9 lists trace-related commands that can be used in the single trace function.
Table 2.2-9 Trace-related Commands that can be used in the single trace function
Usable Command
Function
SET EVENT
Sets events
SHOW EVENT
Displays event setup status
CANCEL EVENT
Deletes event
ENABLE EVENT
Enables event
DISABLE EVENT
Disables event
SET SEQUENCE
Sets sequencer
SHOW SEQUENCE
Displays sequencer setting status
CANCEL SEQUENCE
Cancels sequencer
ENABLE SEQUENCE
Enables sequencer
DISABLE SEQUENCE
Disables sequencer
SET DELAY
Sets delay count value and operation after delay
SHOW DELAY
Displays delay count setting status
SET TRACE
Sets traces-buffer-full break
SHOW TRACE
Displays trace data
SEARCH TRACE
Searches trace data
ENABLE TRACE
Enables trace function
DISABLE TRACE
Disables trace function
CLEAR TRACE
Clears trace data
Note:
When the sequencer termination causes a break (sequential break), the last executed machine cycle
is not sampled.
98
CHAPTER 2 DEPENDENCE FUNCTIONS
2.2.7.3
Multi Trace
The multi trace function samples data where an event trigger occurs for 8 frames before
and after the event trigger.
■ Multi Trace Function
Execute multi trace by setting the event mode to the multi trace mode using the SET MODE command.
The multi trace function samples data where an event trigger occurs for 8 frames before and after the event
trigger.
It can be used for tracing required only when a certain variable access occurs, instead of continuous tracing.
The trace data sampled at one event trigger (16 frames) is called a block. Since the trace buffer can hold
32K frames, up to 2048 blocks can be sampled. Multi trace sampling terminates when the trace buffer
becomes buffer-full. At this point, a executing program can be allowed to break if necessary.
Figure 2.2-14 Multi Trace Sampling
Start
execution
Event 1
Event 2
Event 3
↓
↓
↓
↓
Program flow
Trace buffer
Block
■ Multi Trace Frame Number
Sixteen frames of data are sampled each time an event occurs. This data unit is called a block, and each
sampled block is numbered starting from 0. This is called the block number.
A block is a collection of 8 frames of sampled data before and after the event trigger occurs. At the event
trigger point is 0, trace data sampled before reaching the event trigger point is numbered negatively, and
trace data sampled after the event trigger point is numbered positively. These frame numbers are called
local numbers (See Figure 2.2-15).
In addition to this local number, there is another set of frame numbers starting with the oldest data in the
trace buffer. This is called the global number. Since the trace buffer can hold 32K frames, frames are
numbered 1 to 32768 (See Figure 2.2-15).
To specify which frame data is displayed, use the global number or block and local numbers.
99
CHAPTER 2 DEPENDENCE FUNCTIONS
Figure 2.2-15 Frame Number in Multi Trace
Block number
Trace buffer
Frame number
Global number
1
2
2048
100
Local number
1
2
:
:
8
:
:
15
16
17
18
:
:
24
:
:
31
32
–7
–6
:
:
0
:
:
+7
+8
–7
–6
:
:
0
:
:
+7
+8
32752
32753
:
:
32759
:
:
32767
32768
–7
–6
:
:
0
:
:
+7
+8
Event trigger
Event trigger
Event trigger
CHAPTER 2 DEPENDENCE FUNCTIONS
2.2.7.4
Setting Multi Trace
Before executing the multi trace function, the following settings must be made. After
these settings, trace data is sampled when a program is executed.
1. Set event mode to multi trace mode.
2. Enable trace function.
3. Set event.
4. Set trace-buffer-full break.
■ Setting Multi Trace
Before executing the multi trace function, the following settings must be made. After these settings, trace
data is sampled when a program is executed.
1. Set event mode to multi trace mode.
Use the SET MODE command for this setting.
2. Enable trace function.
Use the ENABLE MULTITRACE command. To disable the function, use the DISABLE MULTITRACE
command.
3. Set event.
Set an event that sampling. Use the SET EVENT command for this setting.
4. Set trace-buffer-full break.
To break when the trace buffer becomes buffer-full, set the trace-buffer-full break. Use the SET
MULTITRACE command for this setting.
Table 2.2-10 shows the list of trace-related commands that can be used in multi trace mode.
Table 2.2-10 Trace-related Commands that can be used in multi trace mode
Usable Command
Function
SET EVENT
Sets events
SHOW EVENT
Displays event setup status
CANCEL EVENT
Deletes event
ENABLE EVENT
Enables event
DISABLE EVENT
Disables event
SET MULTITRACE
Sets trace-buffer-full break
SHOW MULTITRACE
Displays trace data
SEARCH MULTITRACE
Searches trace data
ENABLE MULTITRACE
Enables multi trace
DISABLE MULTITRACE
Disables multi trace
CLEAR MULTITRACE
Clears trace data
101
CHAPTER 2 DEPENDENCE FUNCTIONS
2.2.7.5
Displaying Trace Data Storage Status
It is possible to display how much trace data is stored in the trace buffer. This status
data can be read by specifying /STATUS to the SHOW TRACE command in the single
trace mode and to the SHOW MULTITRACE command in the multi trace mode.
■ Displaying Trace Data Storage Status
It is possible to display how much trace data is stored in the trace buffer. This status data can be read by
specifying /STATUS to the SHOW TRACE command in the single trace mode and to the SHOW MULTITRACE
command in the multi trace mode.
Frame numbers displayed in the multi trace mode is the global number.
[Example]
• In Single Trace
>SHOW TRACE/STATUS
en/dis
= enable
:Trace function enabled
buffer full = nobreak
:Buffer full break function disabled
sampling
:Trace sampling terminates
= end
frame no. = -00120 to 00050 :Frame -120 to 50 store data
step no.
= -00091 to 00022 :Step -91 to 22 store data
>
• In Multi Trace
>SHOW MULTITRACE/STATUS
en/dis
= enable
:Multi trace function enabled
buffer full = nobreak
:Buffer full break function disabled
sampling
:Trace sampling terminates
= end
block no. = 1 to 5
:Block 1 to 5 store data
frame no. = 00001 to 00159
:Frame 1 to 159 store data
(Global number)
102
CHAPTER 2 DEPENDENCE FUNCTIONS
2.2.7.6
Specify Displaying Trace Data Position
It is possible to specify from which data in the trace buffer to display. To do so, specify
a frame number with the SHOW TRACE command in the single trace mode, or specify
either a global number or a block number and local number with the SHOW MULTITRACE
command in the multi trace mode. A range can also be specified.
■ Specify Displaying Trace Data Position
It is possible to specify from which data in the trace buffer to displays. To do this, specify a step or frame
number with the SHOW TRACE command in the single trace, and specify either a global number or a
block number and local number with the SHOW MULTITRACE command in the multi trace mode. A
range can also be specified.
[Example]
• In Single Trace Mode
>SHOW TRACE -6
Start displaying from frame -6
>SHOW TRACE -6..10
Display from frame -6 to frame 10
• In Multi Trace
>SHOW MULTITRACE/GLOBAL 500
>SHOW MULTITRACE/LOCAL 2
>SHOW MULTITRACE/LOCAL 2,-5..5
Start displaying from frame 500
(Global number)
Displaying block number 2
Display from frame -5 to frame 5
of block number 2
103
CHAPTER 2 DEPENDENCE FUNCTIONS
2.2.7.7
Display Format of Trace Data
A display format can be chosen by specifying a command identifier with the SHOW
TRACE command in the single trace, and with the SHOW MULTITRACE command in the
multi trace. The source line is also displayed if "Add source line" is selected using the
SET SOURCE command.
There are three formats to display trace data:
• Display in all bus cycles (Specify /CYCLE.)
• Display in only instruction execution (Specify /INSTRUCTION.)
• Display in source line units (Specify /SOURCE.)
■ Display All Bus Cycles (Specify /CYCLE.)
In this mode, data can be displayed in the following format.
Disassembly display
Address
Frame number
(local number)
Signed decimal
For single trace, "....." is
displayed.
Frame number
(global number)
Signed decimal
Hexadecimal
Displays the disassembly
in the first frame for
instructions.
** HOLD **
Sequencer's level
Displays the level of the
sequencer executed at trace
sampling. When the sequencer
is not used, 1 is displayed.
Data
External probe data
Hexadecimal
Binary
>SHOW TRACE -5
step no.
address data
95
- 00005 ----- :E191
- 00004 ----- :E192
95
- 00003 ----- :09ED
92
- 00002 ----- :09EC
E1
demo3.c$89 {
- 00001 ----- :E195
41
00000
00001
00002
00003
00004
>
---------------------
:E19
:09EB
:09EA
:E196
:E197
F1
00
20
F1
E2
mnemonic
[write]
[write]
main:
PUSHW IX
[write]
[write]
** HOLD **
Access status
[internal write]
: Write access to internal memory
[internal read]
: Read access to internal memory
[Write]
: Write access to memory other than internal area
[xx]
: Access status other than the above
When a read access is made to memory other than internal area,
nothing will be displayed because data access and code fetch are not
distinguished from eath other.
ext-probe lvl
11111111 1
11111111 1
11111111 1
11111111 1
11111111 1
11111111
11111111
11111111
11111111
11111111
1
1
1
1
1
Device status
Displays status of the MCU.
** HOLD **
For multi trace, "Block number = XXXXXX" is displayed at the beginning of a block.
104
CHAPTER 2 DEPENDENCE FUNCTIONS
■ Display in Only Instruction Execution (Specify /INSTRUCTION.)
Only instruction execution is displayed in the same format as when /CYCLE is specified.
Data, access status, and device status are not displayed.
[Example]
>SHOW TRACE/INSTRUCTION -5
frame no.
address
mnemonic
ext-probe
lvl
\main:
11111111
1
demo3.c$89 {
-00001
----- :E195
PUSHW
IX
00003
----- :E196
MOVW
A,SP
11111111
1
00005
----- :E197
MOVW
IX,A
11111111
1
00007
----- :E198
PUSHW
A
11111111
1
00011
----- :E199
PUSHW
A
11111111
1
00015
----- :E19A
PUSHW
A
11111111
1
demo3.c$91
int cc = 1;
00019
----- :E19B
MOVW
A,#0001
11111111
1
00022
----- :E19E
MOVW
@IX-02,A
11111111
1
A,#000A
11111111
1
demo3.c$93
00027
numdt = 10;
----- :E1A0
MOVW
>
■ Display in Source Line Units (Specify /SOURCE.)
Only the source line can be displayed.
[Example]
>SHOW TRACE/SOURCE -5
frame no.
source
-00001:
----- :
demo3.c$89{
00019:
----- :
demo3.c$91
00027:
----- :
demo3.c$93
00035:
----- :
demo3.c$94
00041:
----- :
demo3.c$96
00054:
----- ;
demo3.c$147
00071:
----- :
demo3.c$152
00082:
----- :
demo3.c$153
00086:
----- :
demo3.c$154
int cc = 1;
numdt = 10;
ackdat = 0;
sort (&datpl); /* data sorting */
struct st *dat;
ackdat += 5;
nckdat = ackdat;
for (j=0 ; j<numdt-1; j++) {
>
105
CHAPTER 2 DEPENDENCE FUNCTIONS
2.2.7.8
Reading Trace Data On-the-fly
Trace data can be read while executing a program. However, this is not possible during
sampling. Disable the trace function or terminate tracing before attempting to read
trace data.
■ Reading Trace Data On-the-fly in Single Trace
To disable the trace function, use the DISABLE TRACE command. Check whether or not the trace
function is currently enabled by executing the SHOW TRACE command with /STATUS specified, or by
using built-in variable, %TRCSTAT.
Tracing terminates when the delay count ends after the sequencer has terminated. If Not Break is specified
here, tracing terminates without a break operation. It is possible to check whether or not tracing has
terminated by executing the SHOW TRACE command with /STATUS specified, or by using built-in
variable, %TRCSAMP.
To read trace data, use the SHOW TRACE command; to search trace data, use the SEARCH TRACE
command. Use the SET DELAY command to set the delay count and break operation after the delay
count.
[Example]
>GO
>>SHOW TRACE/STATUS
en/dis
= enable
buffer full
= nobreak
sampling
= on
<- Trace sampling continues.
>>SHOW TRACE/STATUS
en/dis
= enable
buffer full
= nobreak
sampling
= end
<- Trace sampling ends.
frame no.
= -00805 to 00000
step no.
= -00262 to 00000
>>SHOW TRACE -10
frame no.
address
data
mnemonic
-00010_ _ _ _: F000
04
MOV
-00009_ _ _ _: F001
55
-00008_ _ _ _: F002
45
-00007_ _ _ _: F003
60
.
.
.
MOV
A,#55
60,A
ext-probe
lvl
11111111
1
11111111
1
11111111
1
11111111
1
If the CLEAR TRACE command is executed with the trace ending state, trace data sampling can be reexecuted by re-executing the sequencer from the beginning.
106
CHAPTER 2 DEPENDENCE FUNCTIONS
■ Reading Trace Data On-the-fly in the Multi Trace
Use the DISABLE MULTITRACE command to disable the trace function before reading trace data.
Check whether or not the trace function is currently enabled by executing the SHOW MULTITRACE
command with /STATUS specified, or by using built-in variable %TRCSTAT.
To read trace data, use the SHOW MULTITRACE command; to search trace data, use the SEARCH
MULTITRACE command.
[Example]
>GO
>>SHOW MULTITRACE/STATUS
en/dis
= enable
buffer full
= nobreak
sampling
= on
>>DISABLE MULTITRACE
>>SHOW MULTITRACE/STATUS
en/dis
= disable
buffer full
= nobreak
sampling
= end
block no.
= 1 to 20
frameno.
= 00001 to 00639
>>SHOW MULTITRACE
frame no.
1
address
data
mnemonic
00001 -00007 : F000
04
MOV
00002 -00006 : F001
55
00003 -00005 : F002
45
00004 -00004 : F003
60
ext-probe
lvl
block no. = 1
MOV
A,#55
60,A
11111111
1
11111111
1
11111111
1
11111111
1
.
.
.
.
.
.
107
CHAPTER 2 DEPENDENCE FUNCTIONS
2.2.7.9
Saving Trace Data
This section explains the methods to save trace data.
■ Saving Trace Data
Trace data can be saved into a specified file.
Both GUI (via window or dialog) and command-only methods can be used. These methods produce the
same results.
• Saving via GUI
1. Display the trace window.
- Select [Display] - [Trace] in the menu.
2. Specify a file name to which the trace data will be saved.
- Right-click on the trace window, and select [save] in the pop-up menu. "Save As..." dialog is
displayed.
Here, specify the file name and directory to where you wish to store the file.
Refer to section "4.4.8 Trace" of "SOFTUNE Workbench Operation Manual" for detailed
information.
• Saving via command
Save the trace data.
- Execute SHOW TRACE/FILE command.
Refer to section "4.22 SHOW TRACE (type 1)" of "SOFTUNE Workbench Command Reference
Manual" for detailed information.
To append and save data to an existing file, execute SHOW TRACE/FILE/APPEND command.
108
CHAPTER 2 DEPENDENCE FUNCTIONS
2.2.7.10
Searching of Trace Data
This section explains the methods to search trace data.
■ Searching of Trace Data
This function searches for trace data with a specified address or frame number.
Both GUI (via window or dialog) and command-only methods can be used. These methods give the same
results.
• Searching via GUI
1. Display the trace window.
- Select [Display] -[Trace] in the menu.
2. Specify the address or the frame number that you wish to search.
- Right-click on the trace window, and select [search] in the pop-up menu. Trace search dialog is
displayed.
Here, specify the address or the frame number that you wish to be displayed. Refer to section
"4.4.8 Trace" of "SOFTUNE Workbench Operation Manual" for detailed information.
• Searching via command
Search the trace data.
- Execute SEARCH TRACE command.
Refer to section "4.23 SEARCH TRACE" of "SOFTUNE Workbench Command Reference
Manual" for detailed information.
109
CHAPTER 2 DEPENDENCE FUNCTIONS
2.2.8
Measuring Performance
It is possible to measure the time and pass count between two events. Repetitive
measurement can be performed while executing a program in real-time, and when done,
the data can be totaled and displayed.
Using this function enables the performance of a program to be measured. To measure
performance, set the event mode to the performance mode using the SET MODE
command.
■ Performance Measurement Function
The performance measurement function allows the time between two event occurrences to be measured and
the number of event occurrences to be counted. Up to 32767 event occurrences can be measured.
• Measuring Time
Measures time interval between two events.
Events can be set at 8 points (1 to 8). However, in the performance measurement mode, the intervals,
starting event number and ending event number are combined as follows. Four intervals have the
following fixed event number combination:
Interval
Starting Event Number
Ending Event Number
1
1
2
2
3
4
3
5
6
4
7
8
• Measuring Count
The specified events become performance measurement points automatically, and occurrences of that
particular event are counted.
110
CHAPTER 2 DEPENDENCE FUNCTIONS
2.2.8.1
Performance Measurement Procedures
Performance can be measured by the following procedure:
• Setting event mode.
• Setting minimum measurement unit for timer.
• Specify performance-buffer-full break.
• Setting events.
• Execute program.
• Display measurement result.
• Clear measurement result.
■ Setting Event Mode
Set the event mode to the performance mode using the SET MODE command.
performance measurement function.
This enables the
[Example]
>SET MODE/PERFORMANCE
>
■ Setting Minimum Measurement Unit for Timer
Using the SET TIMERSCALE command, choose either 1 s or 100 ns as the minimum measurement unit
for the timer used to measure performance. The default is 1 s.
When the minimum measurement unit is changed, the performance measurement values are cleared.
[Example]
>SET TIMERSCALE/1U
<- Set 1 ms as minimum unit.
>
■ Specify Performance-Buffer-Full Break
When the buffer for storing performance measurement data becomes buffer-full, a executing program can
be broken. This function is called the performance-buffer-full break. The performance buffer becomes
buffer-full when an event occurs 32767 times.
If the performance-buffer-full break is not specified, the performance measurement ends, but the program
does not break.
[Example]
>SET PERFORMANCE/NOBREAK
<- Specifying Not Break
>
111
CHAPTER 2 DEPENDENCE FUNCTIONS
■ Setting Events
Set events using the SET EVENT command.
The starting/ending point of time measurement and points to measure pass count are specified by events.
Events at 8 points (1 to 8) can be set. However, in the performance measurement, the intervals, starting
event number and ending event number are fixed in the following combination.
• Measuring Time
Four intervals have the following fixed event number combination.
Interval
Starting Event Number
Ending Event Number
1
1
2
2
3
4
3
5
6
4
7
8
• Measuring Count
The specified events become performance measurement points automatically.
■ Executing Program
Start measuring when executing a program by using the GO or CALL command. If a break occurs during
interval time measurement, the data for this specific interval is discarded.
■ Displaying Performance Measurement Data
Display performance measurement data by using the SHOW PERFORMANCE command.
■ Clearing Performance Measurement Data
Clear performance measurement data by using the CLEAR PERFORMANCE command.
[Example]
>CLEAR PERFORMANCE
>
112
CHAPTER 2 DEPENDENCE FUNCTIONS
2.2.8.2
Display Performance Measurement Data
Display the measured time and measuring count by using the SHOW PERFORMANCE
command.
■ Displaying Measured Time
To display the time measured, specify the starting event number or the ending event number.
Event number
Count of measuring within given time interval
>SHOW PERFORMANCE/TIME 1, 9000, 18999, 1000
Minimum
execution time
Maximum
execution time
event
= 1 -> 2
min time
= 11637.0
max time
= 17745.0
0.0 -
8999.0
|
avr time
= 14538.0
9000.0 -
9999.0
|
0
10000.0 -
10999.0
|
0
11000.0 -
11999.0
|
2
12000.0 -
12999.0
|
19
13000.0 -
13999.0
|
52
14000.0 -
14999.0
|
283
15000.0 -
15999.0
|
92
16000.0 -
16999.0
|
3
17000.0 -
17999.0
|
1
18000.0 -
18999.0
|
0
|
0
Average
execution time
Total measuring count
time (µs)
|
count
-----------------------------+---------
19000.0 -
0
-----------------------------+--------total
|
452
The lower time limit, upper time limit and display interval can be specified. The specified time value is in
1s, when the minimum measurement unit of timer is set to 1 s by the SET TIMERSCALE command,
and in 100 ns when the minimum is set to 100 ns.
113
CHAPTER 2 DEPENDENCE FUNCTIONS
>SHOW PERFORMANCE/TIME
event
= 1 -> 2
min time = 11637.0
max time = 17745.0
avr time = 14538.0
Lower time limit for display
Upper time limit for display
114
1,13000,16999,500
|
count
time (μs)
-----------------------------+--------0.0 12999.0
|
21
13000.0 13499.0
|
13
13500.0 13999.0
|
39
14000.0 14499.0
|
121
14500.0 14999.0
|
162
15000.0 15499.0
|
76
15500.0 15999.0
|
16
16000.0 16499.0
|
2
16500.0 16999.0
|
1
17000.0 17499.0
|
1
-----------------------------+--------total
|
452
CHAPTER 2 DEPENDENCE FUNCTIONS
2.2.9
Measuring Coverage
This emulator has the C0 coverage measurement function. Use this function to find
now many percentage of an entire program has been executed.
■ Coverage Measurement Function
When testing a program, the program is executed with various test data input and the results are checked
for correctness. When the test is finished, every part of the entire program should have been executed. If
any part has not been executed, there is a possibility that the test is insufficient.
This emulator coverage function is used to find now many percentage of the whole program has been
executed. In addition, details such as which addresses were not accessed can be checked.
This enables the measurement coverage range to be set and the access attributes to be measured.
To execute the C0 coverage, set a range within the code area and set the attribute to Code attribute. In
addition, specifying the Read/Write attribute and setting a range in the data area, permits checking the
access status of variables such as finding unused variables, etc.
■ Coverage Measurement Procedures
The procedure for coverage measurement is as follows:
- Set range for coverage measurement:
SET COVERAGE
- Measuring coverage:
GO, STEP, CALL
- Displaying measurement result:
SHOW COVERAGE
■ Coverage Measurement Operation
The following operation can be made in coverage measurement:
- Load/Save of coverage data:
LOAD/COVERAGE, SAVE/COVERAGE
- Abortion and resume of coverage measurement:ENABLE COVERAGE, DISABLE COVERAGE
- Clearing coverage data:
CLEAR COVERAGE
- Canceling coverage measurement range:
CANCEL COVERAGE
115
CHAPTER 2 DEPENDENCE FUNCTIONS
2.2.9.1
Coverage Measurement Procedures
The procedure for coverage measurement is as follows:
• Set range for coverage measurement: SET COVERAGE
• Measure coverage: GO, STEP, CALL
• Display measurement result: SHOW COVERAGE
■ Setting Range for Coverage Measurement
Use the SET COVERAGE command to set the measurement range. Up to 32 ranges can be specified.
By specifying /AUTOMATIC for the command qualifier, the code area for the loaded module is set
automatically. However, the library code area is not set when the C compiler library is linked.
[Example]
>SET COVERAGE FF00..FFFF
■ Measuring Coverage
When preparing for coverage measurement, execute the program.
Measurement starts when the program is executed by using the GO, STEP, or CALL command.
■ Displaying Coverage Measurement Result
To display the measurement result, use the SHOW COVERAGE command. The following can be
displayed:
- Coverage ratio of total measurement area
- Displaying coverage ratio of load module
- Summary of 16 addresses as one block
- Details indicating access status of each address
- Displaying coverage measurement result per source line
- Displaying coverage measurement result per machine instruction
• Coverage Ratio of Total Measurement Area (Specify /TOTAL for command qualifier.)
>SHOW COVERAGE/TOTAL
total coverage : 82.3%
• Displaying coverage ratio of load module (specify /MODULE for the command qualifier)
>SHOW COVERAGE/MODULE
sample.abs . . . . . . . . . . . . . . . . . . . . . . . . . . .. . . (84.03%)
+- startup.asm . . . . . . . . . . . . . . . . . . . . . . . . . . .. (90.43%)
+- sample.c . . . . . . . . . . . . . . . . . . . . . . . . . . . . (95.17%)
+- samp.c . . . . . . . . . . . . . . . . . . . . . . . . . . . . . (100.00%)
Displays the load modules and the coverage ratio of each module.
116
CHAPTER 2 DEPENDENCE FUNCTIONS
• Summary (Specify /GENERAL for command qualifier.)
>SHOW COVERAGE/GENERAL
(HEX) 0X0
+1X0
+2X0
+-------------------------+-------------------------+---------address 0123456789ABCDEF0123456789ABCDEF0123456
FF00
**3*F*.......
----------... ABCDEF
C0(%)
32.0
Display the access status of every 16 addresses
.
: No access
1 to F : Display the number accessed in 16 addresses by the hexadecimal number.
*
: Access all of the 16 addresses.
• Details (Specify /DETAIL for command qualifier.)
Display one line of a
coverage rate
>SHOW COVERAGE/DETAIL FF00
address
FF00
FF10
FF20
FF30
FF40
FF50
FF60
FF70
FF80
+0 +1 +2 +3 +4 +5 +6 +7 +8 +9 +A +B +C +D +E +F C0(%)
- - - - - - - - - - - - - - - - 100.0
- - - - - - - - - - - - - - - - 100.0
. . . .
- - - . . . . . . . . .
18.6
- - - - - - - - - - - - - - - - 100.0
- . - - - - - - - - - - - - - 93.7
- - - - - - - - - - - - - - - - 100.0
. . . . . . . . . . . . . . . .
0.0
. . . . . . . . . . . . . . . .
0.0
. . . . . . . . . . . . . . . .
0.0
Display the access status of every 1 address
. : No access
- : Access
117
CHAPTER 2 DEPENDENCE FUNCTIONS
• Displays per source line (specify /SOURCE for the command qualifier)
>SHOW COVERAGE/SOURCE main
*
70: {
71:
int
i;
72:
struct table *value[16];
73:
*
74:
for (i=0; i<16; i++)
*
75:
value[i] = &target[i];
76:
*
77:
sort_val(value, 16L);
.
78: }
Displays access status of each source line.
.
: No Access
*
: Accessed
Blank : Line which the code had not been generated or is outside the s cope of the coverage
measurement
• Displays per machine instruction (specify /INSTRUCTION for the command qualifier)
Displays access status of each source line .
.
: No Access
*
: Accessed
Blank : Instruction outside the scope of the coverage measurement
Note:
With MB2141 emulator, the code coverage is affected by a prefetch. Note when analyzing.
118
CHAPTER 2 DEPENDENCE FUNCTIONS
2.2.10
Execution Time Measurement
This section describes the execution time measurement function.
■ Item to be Measured
The program execution time is measured.
This is done every time when a program is executed, and two values are displayed as measurement results,
as follows.
- Execution time of the program just completed.
- Sum of execution duration since the last clearance
The maximum value can vary depending on the measurement unit specified.
The minimum measurement value can either be set as 1s or 100ns. The default selection is 1s.
When 1s is selected:
70 minutes is the maximum
When 100ns is specified: 7 minutes is the maximum
■ Setting the Measurement Unit
The minimum measurement unit can be set as follows.
• Dialog
- Debug environment setting dialog [emulation] tab
Refer to section "4.7.2.3 Debug Environment" of "SOFTUNE Workbench Operation Manual".
• Command
- SET TIMERSCALE
Refer to section "1.6 SET TIMERSCALE" of "SOFTUNE Workbench Command Reference
Manual".
■ Displaying of Measurement Result
The measurement results can be displayed using the following methods.
• Dialog
- Time measurement dialog
Refer to section "4.6.8 Time Measurement" of "SOFTUNE Workbench Operation Manual".
• Command
- SHOW TIMER
Refer to "4.19 SHOW TIMER" of "SOFTUNE Workbench Command Reference Manual".
119
CHAPTER 2 DEPENDENCE FUNCTIONS
■ Clearing of Measurement Results
The measurement results can be cleared using the following methods.
• Dialog
- Time measurement dialog
Refer to section "4.6.8 Time Measurement" of "SOFTUNE Workbench Operation Manual".
• Command
- CLEAR TIMER
Refer to "4.20 CLEAR TIMER" of "SOFTUNE Workbench Command Reference Manual".
120
CHAPTER 2 DEPENDENCE FUNCTIONS
2.2.11
Sampling by External Probe
An external probe can be used to sample (input) data. There are two sampling types:
sampling the trace buffer as trace data, and sampling using the SHOW SAMPLING
command.
■ Sampling by External Probe
There are two sampling types to sample data using an external probe: sampling the trace buffer as trace
data, and sampling using the SHOW SAMPLING command.
When data is sampled as trace data, such data can be displayed by using the SHOW TRACE command or
SHOW MULTITRACE command, just as with other trace data. Sampling using the SHOW SAMPLING
command, samples data and displays its state.
In addition, by specifying external probe data as events, such events can be used for aborting a program,
and as multi trace and performance trigger points.
Events can be set by using the SET EVENT command.
■ External Probe Sampling Timing
Choose one of the following for the sampling timing while executing a program.
- At rising edge of internal clock (clock supplied by emulator)
- At rising edge of external clock (clock input from target)
- At falling edge of external clock (clock input from target)
Use the SET SAMPLING command to set up; to display the setup status use the SHOW SAMPLING
command.
When sampling data using the SHOW SAMPLING command, sampling is performed when the command
is executed and has nothing to do with the above settings.
[Example]
>>SET SAMPLING/INTERNAL
>>SHOW SAMPLING
sampling timing : internal
channel
7 6 5 4 3 2 1 0
1 1 1 1 0 1 1 1
121
CHAPTER 2 DEPENDENCE FUNCTIONS
■ Displaying and Setting External Probe Data
When a command that can use external probe data is executed, external probe data is displayed in 8-digit
binary or 2-digit hexadecimal format. The displayed bit order is in the order of the IC clip cable color code
order (Table 2.2-11). The MSB is at bit7 (Violet), and the LSB is at bit0 (Black). The bit represented by 1
means HIGH, while the bit represented by 0 means LOW. When data is input as command parameters,
these values are also used for input.
Table 2.2-11 Bit Order of External Probe Data
IC Clip Cable Color
Violet
Blue
Green
Yellow
Orange
Red
Brown
Black
bit7
bit6
bit5
bit4
bit3
bit2
bit1
bit0
Bit Order
External probe data
■ Commands for External Probe Data
Table 2.2-12 shows the commands that can be used to set or display external probe data.
Table 2.2-12 Commands that can be used External Probe Data
Usable Command
122
Function
SET SAMPLING
Sets sampling timing for external probe
SHOW SAMPLING
Samples external probe data
SET EVENT
Enables to specify external probe data as condition for event 1
SHOW EVENT
Displays event setup status
SHOW TRACE
Displays external probe trace-sampled (single trace)
SHOW MULTITRACE
Displays external probe trace-sampled (multi-trace)
CHAPTER 2 DEPENDENCE FUNCTIONS
2.2.12
Confirming the Debugger's State
This section explains methods of confirming the debugger's state and its information.
■ Debugger Information
The following information can be obtained at the debugger's startup.
- File information of SOFTUNE Workbench
- Hardware-related information
If problems are encountered with SOFTUNE Workbench and its behavior, refer to the information before
contacting the Sales Representatives.
■ Confirmation Method
Debugger's information can be confirmed as follows.
• Command
- SHOW SYSTEM
Refer to section "1.12 SHOW SYSTEM" of "SOFTUNE Workbench Command Reference Manual".
• Dialog
- Version information dialog
Refer to section "4.9.3 Version Information" of "SOFTUNE Workbench Operation Manual".
■ Content to be Displayed
F2MC-8L/8FX Family SOFTUNE Workbench VxxLxx
ALL RIGHTS RESERVED,
COPYRIGHT(C) FUJITSU SEMICONDUCTOR LIMITED 1997
LICENCED MATERIAL PROGRAM PROPERTY OF FUJITSU SEMICONDUCTOR LIMITED
=======================================================
Cpu information file path
: Path to the CPU information file
Cpu information file version : Version of the CPU information file
=======================================================
Add in DLLs
------------------------------------------------------SiCmn
Product name
: SOFTUNE Workbench
File Path
: Path to SiC896.dll
Version
: Version of SiC896.dll
- - - - - - - - - - - - - - - - - - - - - - - - - - - SiiEd
File Path
: Path to SiiEd3.ocx
Version
: Version of SiiEd3.ocx
------------------------------------------------------SiM896
Product name
: SOFTUNE Workbench
File Path
: Path to SiM896.dll
Version
: Version of SiM896.dll
- - - - - - - - - - - - - - - - - - - - - - - - - - - Language Tools
- Compiler
File Path
: Path to fcc896s.exe
- Assembler
File Path
: Path to fasm896s.exe
123
CHAPTER 2 DEPENDENCE FUNCTIONS
- Linker
File Path
: Path to flnk896s.exe
- Librarian
File Path
: Path to flib896s.exe
- FJ-OMF to S-FORMAT Converter
File Path
: Path to f2ms.exe
- FJ-OMF to INTEL-HEX Converter
File Path
: Path to f2is.exe
- FJ-OMF to INTEL-EXT-HEX Converter
File Path
: Path to f2es.exe
- FJ-OMF to HEX Converter
File Path
: Path to f2hs.exe
------------------------------------------------------SiOsM
Product name
: SOFTUNE Workbench
File Path
: Path to SiOsM896.dll
Version
: Version of SiOsM896.dll
------------------------------------------------------F2MC-8L/8FX Series Debugger DLL
Product name
: SOFTUNE Workbench
File Path
: Path to SiD896.dll
Version
: Version of SiD896.dll
- - - - - - - - - - - - - - - - - - - - - - - - - - - Debugger type
: Current debugger type
MCU type
: Currently selected target MCU
VCpu dll name
: Path and name of currently selected virtual debugger section DLL
VCpu dll version
: Version of currently selected virtual debugger section DLL
Monitor version
: Monitor (dependent) version
MCU frequency
: Operation frequency
Communication device : Device type
Host name
: LAN host name
------------------------------------------------------SiIODef
Product name
: SOFTUNE Workbench
File Path
: Path to SiIODef.dll
Version
: Version of SiIODef.dll
=======================================================
Current path
: Currently specified project path
Language
: Currently selected language
Help file path
: Path to the help files
124
CHAPTER 2 DEPENDENCE FUNCTIONS
2.3
Emulator Debugger (MB2146-09/09A/09B)
This section describes the functions of the emulator debugger (MB2146-09/09A/09B).
■ Emulator Debugger (MB2146-09/09A/09B)
The emulator debugger for the F2MC-8FX family is a software package that you can use to test program
execution via a USB communication link from a host computer.
■ Before Use
When using the MB2146-09, 09A or 09B, refer to "Appendix D Setting USB Interface" in "SOFTUNE
Workbench Operation Manual" to setup the USB interface.
The monitor program is loaded automatically when the debugger starts immediately after the power is
turned on to the user system. The following dialog is displayed while the monitor program is loaded. Once
loaded, the monitor program isn't reloaded unless the power is turned off. The monitor program is located
in the Lib\896 sub-directory under the directory in which Workbench is installed.
■ Extended Debugging Functions
In addition to the basic debug functions, the following additional functions also become available with
certain combinations of BGM adapter and MCU board.
1. Function to measure the number of execution cycles
2. Function to monitor RAM
Table 2.3-1 shows debug functions for different BGM adapter and MCU board combinations. The version
number of the MCU board is shown on a sticker affixed to the board.
125
CHAPTER 2 DEPENDENCE FUNCTIONS
Table 2.3-1 Debug Functions for Different BGM Adapter and MCU Board Combinations (1 / 2)
Debugger
launched
RAM
monitoring
Measuring the
number of
execution cycles
02B and later
❍
❍
❍
01A
❍
❍
❍
02B and later
❍
❍
❍
01A
❍
❍
❍
02B and later
❍
✕
❍
01A
❍
✕
❍
02B and later
❍
✕
❍
01A
❍
✕
❍
02B and later
❍
✕
❍
01A
❍
✕
❍
02B and later
❍
✕
❍
01A
❍
✕
✕
02B and later
❍
✕
❍
01A
❍
✕
✕
02B and later
❍
✕
❍
01A
❍
✕
✕
02B and later
✕
-
❍
01A
❍
✕
❍
02B and later
✕
-
❍
01A
❍
✕
❍
02B and later
✕
-
❍
01A
❍
✕
❍
02B and later
✕
-
❍
01A
❍
✕
❍
02B and later
✕
-
❍
01A
❍
✕
❍
02B and later
❍
✕
❍
01A
❍
✕
✕
MCU Board
BGM adapter
Model
Version No.
MB2146-303B
MB2146-301B
MB2146-303A-E
MB2146-302A-E
MB2146-09B
MB2146-301A-E
MB2146-303A
MB2146-302A
MB2146-301A
MB2146-303B
MB2146-301B
MB2146-303A-E
MB2146-09A
MB2146-302A-E
MB2146-301A-E
MB2146-303A
126
CHAPTER 2 DEPENDENCE FUNCTIONS
Table 2.3-1 Debug Functions for Different BGM Adapter and MCU Board Combinations (2 / 2)
MCU Board
Debugger
launched
RAM
monitoring
Measuring the
number of
execution cycles
02B and later
❍
✕
❍
01A
❍
✕
✕
02B and later
❍
✕
❍
01A
❍
✕
✕
-
-
-
-
BGM adapter
Model
Version No.
MB2146-302A
MB2146-09A
MB2146-301A
✕
MB2146-303B
02B and later
✕
-
-
01A
✕
-
-
02B and later
✕
-
-
01A
✕
-
-
02B and later
✕
-
-
01A
✕
-
-
02B and later
✕
-
-
01A
✕
-
-
02B and later
❍
✕
✕
01A
❍
✕
✕
02B and later
❍
✕
✕
01A
❍
✕
✕
02B and later
❍
✕
✕
01A
❍
✕
✕
MB2146-301B
MB2146-303A-E
MB2146-302A-E
MB2146-09
MB2146-301A-E
MB2146-303A
MB2146-302A
MB2146-301A
❍ : available
✕ : not available
Note:
If the combination of the BGM adaptor and the MCU board is not one of the combinations in Table
2.3-1, an error message appears at the startup of the debugger and the debugger cannot be started.
Refer to "Appendix B Debugger Related Error Messages" in the "SOFTUNE Workbench Command
Reference Manual".
127
CHAPTER 2 DEPENDENCE FUNCTIONS
2.3.1
Setting Operating Environment
This section explains the operating environment setup.
■ Setting Operating Environment
For the emulator debugger for the MB2146-09, it is necessary to set the following items according the
operating environment. Predefined default settings for all these setup items are enabled at startup.
Therefore, it is not required to change the settings when using the default settings. Adjusted settings can be
used as new default settings from the next time.
- Clock-up mode
- Main Clock Oscillation
128
CHAPTER 2 DEPENDENCE FUNCTIONS
2.3.1.1
Clock-up Mode
This section explains the clock-up mode.
■ Clock-up Mode
The MB2146-09 and communication speed of user system change by the operating frequency of the target
MCU. When the operating frequency is reduced, especially in the sub clock mode, communication speed is
also reduced. In this case, optimize the communication speed, the function increasing the operating
frequency automatically is called clock-up mode. The default is enabled.
■ Setting Method
Set the clock-up mode as follows.
• Dialog
- Setup Wizard
Refer to "4.7.2.4 Setup Wizard" of "SOFTUNE Workbench Operation Manual".
• Dialog
- [Response Speed] tab in the debug environment setting dialog
Refer to "4.7.2.3 Debug Environment" of "SOFTUNE Workbench Operation Manual".
Notes:
• When the clock-up mode is used, the operating frequency is changed automatically at breaking.
If the failure is caused by changing the operating frequency, disables the clock-up modes.
• If a break occurs immediately after changing the system clock mode by the user program, no
clock up is performed during oscillations stabilization wait state. Clock up will be performed when
oscillations are stabilized.
129
CHAPTER 2 DEPENDENCE FUNCTIONS
2.3.1.2
Main Clock Oscillation
This section explains the main clock oscillation frequency.
■ Main Clock Oscillation
The MB2146-09 and communication speed of user system change by the operation frequency of the target
MCU. The setting of the main clock oscillation (FCH) is required to calculate the operating speed of the
target MCU. The default is the maximum frequency that specified MCU operates in the main clock.
■ Setting Method
Set the clock oscillation frequency as follows.
• Dialog
- Setup wizard
Refer to "4.7.2.4 Setup Wizard" of "SOFTUNE Workbench Operation Manual".
130
CHAPTER 2 DEPENDENCE FUNCTIONS
2.3.2
Programming to FLASH Memory
This emulator supports programming to the FLASH memory.
■ Erasing/Programming FLASH Memory
Writing to FLASH memory/code break (software break) functions are supported. The content of FLASH
memory is secured in the buffer within the debugger, and the content of the buffer is referenced at reading/
writing.
Writing FLASH memory is carried out automatically in the following cases.
• Before program execution processing
• Before reset processing
• Before end of debugging
When necessary, it can be carried out manually instead of via the above-mentioned processing.
The following dialog is displayed at writing to FLASH memory.
There are the following three functions for the operation of FLASH memory:
1. Updating FLASH memory
([Environment] - [FLASH area control] - [Download FLASH memory] menu).
Updates Flash memory. FLASH memory is usually updated automatically prior to executive operation or
reset processing. Use this menu when updating Flash memory before this automatic updating.
This menu is enabled when data in the FLASH memory area is changed, requiring the writing to of
FLASH memory.
2. Uploading FLASH memory
([Environment] - [FLASH area control] - [Upload FLASH memory] menu).
Reads the contents of FLASH memory, and synchronizes with a buffer in the debugger. Be sure to
perform this synchronization when FLASH memory is rewritten (updated) by the user program, or the
program would not operate properly.
131
CHAPTER 2 DEPENDENCE FUNCTIONS
3. Erasing FLASH memory
([Environment] - [FLASH area control] - [Erase FLASH memory] menu).
Erase all data in FLASH memory. Note that this operation will erase all code break (software break)
settings.
132
CHAPTER 2 DEPENDENCE FUNCTIONS
2.3.3
Break
This Debugger provides five types of break functions.
■ Break Functions
This Debugger provides the following five types of break functions;
- Code break
- Data break
- Monitoring Data Break
- Sequential break
- Forced break
133
CHAPTER 2 DEPENDENCE FUNCTIONS
2.3.3.1
Code Break
This function aborts the program execution by monitoring a specified address by
software. A break occurs before executing an instruction at the specified address.
■ Code Break
This function aborts the program execution by monitoring a specified address by software. A break occurs
before executing an instruction at the specified address.
Up to 256 addresses can be set for this debugger.
When the code break occurs, the following message appears at the status bar.
Break at address by breakpoint
■ Setting Method
Set code break as follows.
• Command
- SET BREAK
Refer to "3.1 SET BREAK (type 1)" of "SOFTUNE Workbench Command Reference Manual".
• Dialog
- "Code" tab in breakpoint setting dialog
Refer to "4.6.4 Breakpoint" of "SOFTUNE Workbench Operation Manual".
• Window
- Source window/disassemble window
Refer to "3.7 Source Window" or "3.9 Disassemble Window" of "SOFTUNE Workbench Operation
Manual".
134
CHAPTER 2 DEPENDENCE FUNCTIONS
2.3.3.2
Data Break
It is a function to abort the program execution when the data access (read or write) is
done to a specified address.
■ Data Break
This function aborts the program execution when a data access (read/write) is made to a specified address.
Up to 2 data break points can be set for this debugger.
When the data break occurs, the following message appears at the status bar.
Break at address by databreak at access address
■ Setting Method
Set the data break as follows.
• Command
- SET DATABREAK
Refer to "3.9 SET DATABREAK (type 1)" of "SOFTUNE Workbench Command Reference
Manual".
• Dialog
- "Data" tab in breakpoint setting dialog
Refer to "4.6.4 Breakpoint" of "SOFTUNE Workbench Operation Manual".
Note:
When set as the monitoring data break, a break does not occur as the data break.
135
CHAPTER 2 DEPENDENCE FUNCTIONS
2.3.3.3
Monitoring Data Break
It is a special break function to abort execution while it is corresponding to specified
data when the program reaches a specified address.
■ Monitoring Data Break
It is a special break function to abort execution while it is corresponding to specified data when the
program reaches a specified address.
The following figure shows the break conditions of the monitoring data break.
Figure 2.3-1 Break Conditions of Monitoring Data Break
Monitoring Data
Flow of program
Specified address
Specified address
Break does not
occur when data
is not matching.
Data
matching
Break occurs
when data is
matching.
■ Setting Method
Set the monitoring data break as follows.
• Command
- SET BREAK /DATAWATCH
Refer to "3.2 SET BREAK (type 2)" of "SOFTUNE Workbench Command Reference Manual".
• Dialog
- "Data" tab in breakpoint setting dialog
Refer to "4.6.4 Breakpoint" of "SOFTUNE Workbench Operation Manual".
136
CHAPTER 2 DEPENDENCE FUNCTIONS
2.3.3.4
Sequential Break
A sequential break is a function to abort an executing program, when it is executed in
the order of level 1 and then level 2 at two specified addresses.
■ Sequential Break
A sequential break is a function to abort an executing program, when it is executed in the order of level 1
and then level 2 at two specified addresses. One break can be set for this debugger.
When the Sequential break occurs, the following message appears at the status bar.
Break at address by hardware breakpoint
■ Setting Method
Set the Sequential break as follows.
• Command
- SET BREAK /SEQUENCE
Refer to "3.3 SET BREAK (type 3)" of "SOFTUNE Workbench Command Reference Manual".
• Dialog
- "Sequential" tab in breakpoint setting dialog
Refer to "4.6.4 Breakpoint" of "SOFTUNE Workbench Operation Manual".
137
CHAPTER 2 DEPENDENCE FUNCTIONS
2.3.3.5
Forced Break
This function forcibly aborts the program execution to generate a break.
■ Forced Break
This function forcibly aborts the program execution to generate a break.
When the forced break occurred, the following message appears at the status bar.
Break at address by command abort request
■ Generation Method
The methods of generating forced breaks are as follows.
• Menu
- [Debug]-[Abort] menu
Refer to "4.6.2 Abort" of "SOFTUNE Workbench Operation Manual".
• Command
- ABORT
Refer to "2.2 ABORT" of "SOFTUNE Workbench Command Reference Manual".
138
CHAPTER 2 DEPENDENCE FUNCTIONS
2.3.4
Real-time Trace
While execution a program, the executed address information is sampled and stored in
the trace buffer. This function is called "trace".
■ Trace
The program execution history can be analyzed from the data stored by the trace buffer.
Since the trace buffer has a ring structure, when it becomes buffer-full, it automatically returns to the start
to overwrite existing data.
■ Trace Data
The stored data sampled by the trace is called trace data.
For the emulator debugger of the MB2146-09, 16 divergences immediately before the execution
interruption can be sampled.
Note:
When 4096 or more branch instructions are not executed, only 4096 instructions from the branch
destination address is displayed.
■ Sampling Trace Data
When the trace function is enabled, the data is sampled during command execution, and it is stored in the
trace buffer.
When the program execution is stopped by the break cause such as break point, the trace sampling is ended.
139
CHAPTER 2 DEPENDENCE FUNCTIONS
■ Frame number
A number is assigned to each frame of sampled trace data. This number is called a frame number.
The frame number is used to specify the display start position of the trace buffer. The value 0 is assigned to
trace data at the position for current program counter (PC). Negative values are assigned to previous trace
data.
Figure 2.3-2 Frame Number in Trace
.
.
.
-3
-2
-1
0 (Trigger point)
+1
+2
+3
.
.
.
140
Delayed frames
CHAPTER 2 DEPENDENCE FUNCTIONS
2.3.4.1
Displaying Trace Data
The data stored in the trace buffer is displayed.
■ Displaying Trace Data Storage Information
Trace window is displayed how much trace data is stored in the trace buffer. Also, the command displays
by SHOW TRACE/STATUS.
■ Display Format of Trace Data
There are two types of display format for the trace buffer.
• Display instruction execution only (Display instruction)
Display the instruction execution in disassembly unit.
• Display in source line units (Display source)
Display the source line only.
■ Clearing Trace Data
When the trace data is cleared, execute [Clear] within the shortcut menu in the trace window. Also, the
command executes the CLEAR TRACE command.
Note:
When the emulator debugger for the MB2146-09 is used, the address information is outputted at the
branch instruction fetch, the trace is implemented.
At that time, notes the following points related to display trace data.
The disassembly display is performed after reading from the memory. In this case, when the
instruction is completed to write after the code fetch, it does not display correctly.
141
CHAPTER 2 DEPENDENCE FUNCTIONS
2.3.4.2
Saving Trace Data
This section explains the methods to save trace data.
■ Saving Trace Data
Trace data can be saved into a specified file.
Both GUI (via window or dialog) and command-only methods can be used. These methods give the same
results.
• Saving via GUI
1. Display the trace window.
- Select [Display] - [Trace] in the menu.
2. Specify a file name to which the trace data will be saved.
- Right-click on the trace window, and select [save] in the pop-up menu. "Save As..." dialog is
displayed.
Here, specify the file name and directory to where you wish to store the file.
Refer to section "4.4.8 Trace" of "SOFTUNE Workbench Operation Manual" for detailed
information.
• Saving via command
Save the trace data.
- Execute SHOW TRACE/FILE command.
Refer to section "4.22 SHOW TRACE (type 1)" of "SOFTUNE Workbench Command Reference
Manual" for detailed information.
To append and save data to an existing file, execute SHOW TRACE/FILE/APPEND command.
142
CHAPTER 2 DEPENDENCE FUNCTIONS
2.3.4.3
Searching Trace Data
This section explains the methods to search trace data.
■ Searching Trace Data
This function searches for trace data at a specified address or in a specified frame.
Both GUI (via window or dialog) and command-only methods can be used. These methods give the same
results.
• Searching via GUI
1. Display the trace window.
- Select [Display] - [Trace] in the menu.
2. Specify the address or the frame number that you wish to search.
- Right-click on the trace window, and select [search] in the pop-up menu. Trace search dialog is
displayed.
Here, specify the address or the frame number that you wish to be displayed. Refer to section
"4.4.8 Trace" of "SOFTUNE Workbench Operation Manual" for detailed information.
• Searching via command
Search the trace data.
- Execute SEARCH TRACE command.
Refer to section "4.23 SEARCH TRACE" of "SOFTUNE Workbench Command Reference
Manual" for detailed information.
143
CHAPTER 2 DEPENDENCE FUNCTIONS
2.3.5
Notes on Executing Program
This emulator notes the following points.
■ Break at Standby Mode
When the abort operation is executed in the standby mode, the debugger cancels the standby mode and
aborts the execution. Therefore, it is aborted in next address of instruction to be transmitted to the standby
mode.
144
CHAPTER 2 DEPENDENCE FUNCTIONS
2.3.6
RAM Monitoring
MB2146-09 emulator can monitor the memory content of certain address during the
user program is running.
■ RAM Monitoring
This function monitors the memory content of certain address during the user program is running.
Up to 32 addresses in 16 bit units can be set.
Those addresses are monitored in the RAM monitoring window.
■ Conditions for Use
RAM monitoring can be used under the following conditions.
SOFTUNE Workbench:
Version V30L32 or later
BGM adapter:
Model MB2146-09B-E
MCU board:
Model MB2146-301B-E/303B-E
■ Setting Method
Set RAM monitoring as follows.
• Command
- SET RAMMONITOR
Refer to Section "4.28 SET RAM MONITOR" of "SOFTUNE Workbench Command Reference
Manual".
• Dialog
- RAM monitoring setting dialog
Refer to Section "4.4.15 RAM monitoring" of "SOFTUNE Workbench Operation Manual".
■ Halt Time During Monitoring
To read data, the RAM monitoring function must temporarily halt and then restart the user program.
The formulas below calculate the number of times the user program is halted and the halt duration for each
read operation.
Number of times the user program halts = 2 <no. of bytes read>
Total user program halt duration = <Number of times the user program halts> <Halt time> *
* : Duration of each halt
This varies as follows depending on the operating frequency (Fch).
145
CHAPTER 2 DEPENDENCE FUNCTIONS
Table 2.3-2 Operating Frequency vs. Halt Duration
Operating Frequency [MHz]
Duration of Halt [s]
16
approx. 22
10
approx. 35
8
approx. 44
4
approx. 88
2
approx. 175
As user program halts are performed at 1.5ms intervals (fixed), user program execution operates as shown
in the figure below during monitoring.
Execution time after break:1ms (fixed)
Halt time
Program execution
Accordingly, the total halt time for the user program when reading four bytes is as follows.
Example: Reading four bytes at an operating frequency of 16MHz.
Number of user program halts = 2 4 = 8
Total user program halt time = 22 8 = 176 s
Note:
As this function performs a pseudo-on-the-fly memory read, the execution halt time may become
long if not a few variables have been registered.
146
CHAPTER 2 DEPENDENCE FUNCTIONS
2.3.7
Measuring the Number of Execution Cycles
MB2146-09B emulator can measure the number of program execution cycles.
■ Measuring the Number of Execution Cycles
This function measures the number of program execution cycles.
Measuring is performed whenever the program is executed, the following two values are displayed.
- Number of execution cycles for the previous program execution
- Total number of execution cycles up to that time after the debugger has started
The default maximum value for the measurement result is 65535 cycles.
■ Conditions for Use
Measuring the number of execution cycles can be used under the following conditions.
SOFTUNE Workbench: Version V30L30 or later
BGM adapter:
Model MB2146-09
MCU board:
Model MB2146-301A/302A/303A (Version 02B or later)
When this function is used, the following internal resource is used by the debugger.
Note that this means the resource cannot be used by the user program.
16-bit reload timer ch.1
■ How to Extend the Measurement Range
The default maximum value for the measurement result is 65535 cycles, but this can be extended to a
maximum of 4294967295 cycles.
Extending the measurement range requires that you link the relative-format load module file from the
following directory into the user program.
<SOFTUNE installation directory>\Lib\896\EXETMR.REL
If using this library, the following resources are also used.
Interrupt vector:
IRQ17
Interrupt handler:
User ROM (16 bytes)
Overflow counter:
User RAM (2 bytes: 0x0F7E to 0x0F7F)
Reserved symbol name:
__EXETMROVRHDR
__EXTTMROVRHDRVER
■ Displaying the Measurement Result
The following methods can be used to display the results.
1. Time measurement dialog
[Debug] - [Time Measurement] menu
2. SHOW TIMER command
147
CHAPTER 2 DEPENDENCE FUNCTIONS
■ Clearing the Measurement Result
The following methods can be used to clear the results.
• Command
- CLEAR TIMER
Refer to "4.20 CLEAR TIMER" of "SOFTUNE Workbench Command Reference Manual".
• Dialog
- Time measurement dialog
Refer to "4.6.8 Time Measurement" of "SOFTUNE Workbench Operation Manual".
■ Error
The measurement result for the number of execution cycles has an error of around zero to ten or so cycles.
The following additional error also occurs if the measurement range is extended.
Error = Overflow counter (upper 16 bits) N*
*: 0 to 10 or so cycles (approx.)
Notes:
• To minimize the error when measuring the number of execution cycles, use continuous instruction
execution as far as possible.
• It is possible that 16-bit counter overflow events may be missed if interrupts are disabled for a
long period of time. In this case, the measurement result will not be correct.
• The following reserverd symbols can be referenced, but do not define them.
__EXETMROVRHDR
__EXTTMROVRHDRVER
148
CHAPTER 2 DEPENDENCE FUNCTIONS
2.3.8
Confirming the Debugger's State
This section explains various methods of confirming the debugger's state and its
information.
■ Debugger Information
With this emulator debugger, the following information can be obtained at the time of startup.
- File information of SOFTUNE Workbench
- Hardware-related information
If problems are encountered with SOFTUNE Workbench and its behavior, refer to the information before
contacting the Sales Representatives.
■ Confirmation Method
Debugger's information can be confirmed as follows.
• Command
- SHOW SYSTEM
Refer to section "1.12 SHOW SYSTEM" of "SOFTUNE Workbench Command Reference Manual".
• Dialog
- Version information dialog
Refer to section "4.9.3 Version Information" of "SOFTUNE Workbench Operation Manual".
■ Content to be Displayed
F2MC-8L/8FX Family SOFTUNE Workbench VxxLxx
ALL RIGHTS RESERVED,
COPYRIGHT(C) FUJITSU SEMICONDUCTOR LIMITED 1997
LICENCED MATERIAL PROGRAM PROPERTY OF FUJITSU SEMICONDUCTOR LIMITED
=======================================================
Cpu information file path
: Path to the CPU information file
Cpu information file version : Version of the CPU information file
=======================================================
Add in DLLs
------------------------------------------------------SiCmn
Product name
: SOFTUNE Workbench
File Path
: Path to SiC896.dll
Version
: Version of SiC896.dll
- - - - - - - - - - - - - - - - - - - - - - - - - - - SiiEd
File Path
: Path to SiiEd3.ocx
Version
: Version of SiiEd3.ocx
------------------------------------------------------SiM896
Product name
: SOFTUNE Workbench
File Path
: Path to SiM896.dll
Version
: Version of SiM896.dll
- - - - - - - - - - - - - - - - - - - - - - - - - - - Language Tools
- Compiler
File Path
: Path to fcc896s.exe
- Assembler
149
CHAPTER 2 DEPENDENCE FUNCTIONS
File Path
: Path to fasm896s.exe
- Linker
File Path
: Path to flnk896s.exe
- Librarian
File Path
: Path to flib896s.exe
- FJ-OMF to S-FORMAT Converter
File Path
: Path to f2ms.exe
- FJ-OMF to INTEL-HEX Converter
File Path
: Path to f2is.exe
- FJ-OMF to INTEL-EXT-HEX Converter
File Path
: Path to f2es.exe
- FJ-OMF to HEX Converter
File Path
: Path to f2hs.exe
------------------------------------------------------SiOsM
Product name
: SOFTUNE Workbench
File Path
: Path to SiOsM896.dll
Version
: Version of SiOsM896.dll
------------------------------------------------------F2MC-8L/8FX Series Debugger DLL
Product name
: SOFTUNE Workbench
File Path
: Path to SiD896.dll
Version
: Version of SiD896.dll
- - - - - - - - - - - - - - - - - - - - - - - - - - - Debugger type
: Current debugger type
MCU type
: Currently selected target MCU
VCpu dll name
: Path and name of currently selected virtual debugger section DLL
VCpu dll version
: Version of currently selected virtual debugger section DLL
Adapter type
: BGM adapter currently used
Adapter version
: Version of the adapter
Target type
: BGM target currently used
Target version
: BGM target version
Communication device : Device type
------------------------------------------------------SiIODef
Product name
: SOFTUNE Workbench
File Path
: Path to SiIODef.dll
Version
: Version of SiIODef.dll
=======================================================
Current path
: Currently specified project path
Language
: Currently selected language
Help file path
: Path to the help files
150
CHAPTER 2 DEPENDENCE FUNCTIONS
2.4
Emulator Debugger (MB2146-08)
This section explains the functions of the emulator debugger (MB2146-08) for the
F2MC-8FX Family.
■ Emulator Debugger
The emulator debugger (MB2146-08) for the F2MC-8FX Family is software that controls an emulator from
a host computer via a communications line (USB) to evaluate programs.
■ Before Use
Before using the MB2146-08, confirm the following.
• Combination of BGM adapter and MCU board
Your hardware manual or data sheet
• Setup of USB interface
"Appendix DUSB Interface Settings" of "SOFTUNE Workbench Operation Manual"
Note:
If the combination of the BGM adaptor and the MCU is incorrect, an error message appears at the
startup of the debugger and the debugger cannot be started.
For details, refer to "Appendix B Debugger Related Error Messages" of "SOFTUNE Workbench
Command Reference Manual".
151
CHAPTER 2 DEPENDENCE FUNCTIONS
2.4.1
Setting Operating Environment
This section explains the operating environment setup.
■ Setting Operating Environment
For this debugger, it is necessary to set the following operating environment. Predefined default settings for
all these setup items are enabled at startup. Therefore, setup is not required when using the default settings.
Adjusted settings can be used as new default settings from the next time.
• Main clock oscillation frequency
152
CHAPTER 2 DEPENDENCE FUNCTIONS
2.4.1.1
Main Clock Oscillation Frequency
This section explains the main clock oscillation frequency.
■ Setting Main Clock Oscillation Frequency
The communication speed of MB2146-08 and the user system changes depending on the operating
frequency of the target MCU. The setting of the main clock oscillation (FCH) is required to calculate the
operating speed of the target MCU. The default setting is the maximum frequency at which the specified
MCU operates in the main clock.
■ Setting Method
Set the clock oscillation frequency as follows.
• Dialog
- Setup wizard
Refer to "4.7.2.4 Setup Wizard" of "SOFTUNE Workbench Operation Manual".
Note:
Use the default setting when only the internal main CR clock is used.
153
CHAPTER 2 DEPENDENCE FUNCTIONS
2.4.2
Erasing/Programming FLASH Memory
This debugger supports programming to the FLASH memory.
■ Erasing/Programming FLASH Memory
Writing to FLASH memory/code break (software break) functions are supported. The content of FLASH
memory is secured in the buffer within the debugger, and the content of the buffer is referenced at reading/
writing.
Writing FLASH memory is carried out automatically in the following cases.
• Before program execution processing
• Before reset processing
• Before end of debugging
When necessary, it can be carried out manually instead of via the above-mentioned processing.
The following dialog is displayed at writing to FLASH memory.
There are the following three functions for the operation of FLASH memory:
1. Updating FLASH memory
([Environment] - [FLASH area control] - [Download FLASH memory] menu).
Updates Flash memory. Normally, Flash memory is updated automatically before performing execution
or reset processing and before stopping the debugger. Use this menu when updating Flash memory
before this automatic updating.
This menu is enabled when data in the FLASH memory is changed, requiring the writing to FLASH
memory.
2. Synchronizing FLASH memory
([Environment] - [FLASH area control] - [Synchronize FLASH memory] menu).
Reads the contents of FLASH memory, and synchronizes with a buffer in the debugger. Be sure to
perform this synchronization when FLASH memory is rewritten by the user program, or the content of
the memory may not be referenced properly.
Furthermore, synchronization is made automatically before starting the debugger.
154
CHAPTER 2 DEPENDENCE FUNCTIONS
3. Erasing FLASH memory
([Environment] - [FLASH area control] - [Erase FLASH memory] menu).
Erases all data in FLASH memory. Note that this operation will also erase all code break (software
break) settings.
Note:
Chip erasing is automatically executed for 1-sector device.
155
CHAPTER 2 DEPENDENCE FUNCTIONS
2.4.3
Erasing/Programming FRAM Area
This debugger supports erasing/programming FRAM area.
■ Erasing/Programming FRAM
This debugger supports erasing/programming FRAM area.
Both erasing and programming can be performed in the same way as to the RAM area.
To erase the UseFRAM area completely, perform the following operations.
[Environment] - [Flash area control] - [Erase Flash memory] menu
Note:
• The following menus are disabled FRAM is used.
- [Flash area control] - [Update Flash memory] menu
- [Flash area control] - [Synchronize FLASH memory] menu
156
CHAPTER 2 DEPENDENCE FUNCTIONS
2.4.4
Notes on Executing Program
The following points must be noted when executing a program using this debugger.
■ Break at Standby Mode
When the abort operation is executed in the standby mode, the debugger cancels the standby mode and
aborts the execution. Therefore, it is aborted in next address of instruction to be transmitted to the standby
mode.
157
CHAPTER 2 DEPENDENCE FUNCTIONS
2.4.5
FLASH Security
This debugger performs a support for the FLASH security function installed in the MCU.
■ FLASH Security
This debugger performs a support for the FLASH security function installed in the MCU. The FLASH
security function manipulates the value of the security byte (1-byte area in the FLASH memory defined for
each MCU) to place the FLASH memory in protected state (in which no debug operation other than erasing
the FLASH memory is accepted) so that programs and other content in the FLASH memory are
undisclosed to third parties. There are the following two types of detection timing to detect the protected
state using the FLASH security function.
At startup of debugging:
When the FLASH memory is already in the protected state.
During debugging:
When the memory moves to the protected state by an operation such as
writing to the memory.
When it is determined that the FLASH memory is already in the protected state, the following dialog
appears.
If "Yes" is selected, the debugger starts or debugging continues once the FLASH memory is erased. If "No"
is selected, the debugger stops.
■ FRAM Device
The FRAM memory security function is supported as well as the flash security.
158
CHAPTER 2 DEPENDENCE FUNCTIONS
2.4.6
Notes on Starting/Stopping Debugger
The following points must be noted when starting or stopping this debugger.
■ When Starting Debugger
As the FLASH memory uses a buffer-style control, it must always be synchronized with the FLASH
memory first. At startup of the debugger, it is automatically synchronized with the FLASH memory. This
may take a significant time because the entire FLASH memory of the MCU must be read. Under the
following conditions, it takes approximately 20 seconds.
FLASH memory:
the sector size = 16KB
Clock:
Clock-up mode = ON
For this debugger, the power supply can be monitored. If an abnormality is detected at startup of the
debugger, the following dialog will appear.
When "OK" is selected, the startup of the debugger is retried. When "Cancel" is selected, the debugger
stops.
This debugger cannot be started, unless the clock is in the normal state. Therefore, if an abnormality is
detected at startup of the debugger, the following dialog will appear.
When "Yes" is selected, the startup of the debugger is retried. When "No" is selected, the debugger stops.
159
CHAPTER 2 DEPENDENCE FUNCTIONS
■ Debug the End
The software break which is set in the FLASH memory during debugging must be erased before the
debugging ends, considering that the MCU may be used standalone after the debugger stops. Therefore, the
FLASH memory should be updated for each sector to which the software break is set. The time required
depends on the setup conditions of the software break.
Note:
When a software break is set, standalone operation cannot be guaranteed under the following
conditions.
• Operation is aborted while the FLASH memory is being updated upon completion of debugging
• Workbench ends abnormally during debugging
• Hardware connection is disconnected during debugging
160
CHAPTER 2 DEPENDENCE FUNCTIONS
2.4.7
Break
This Debugger provides two types of break functions. When by each break function
aborts program execution, the address where a break occurred and the break factor are
displayed.
■ Break Functions
This Debugger provides the following two types of break functions;
- Code break
- Forced break
161
CHAPTER 2 DEPENDENCE FUNCTIONS
2.4.7.1
Code Break
This function aborts the program execution by monitoring a specified address. A break
occurs before executing an instruction at the specified address.
■ Code Break
This function aborts the program execution by monitoring a specified address by means of software or
hardware. A break occurs before executing an instruction at the specified address.
The maximum points to be set are as follows.
Hardware: 3 points
Software: 256 points
When the code break occurs, the following message appears in the status bar.
- Hardware
Break at address by hardware breakpoint
- Software
Break at address by breakpoint
■ Setting Method
Code break can be controlled as follows.
• Command
- SET BREAK
Refer to "3.1 SET BREAK (type 1)" of "SOFTUNE Workbench Command Reference Manual".
• Dialog
- Break point setting dialog [code] tab
Refer to "4.6.4 Break Point" of "SOFTUNE Workbench Operation Manual".
• Window
- Source window/disassemble window
Refer to "3.7 Source Window" or "3.9 Disassemble Window" of "SOFTUNE Workbench Operation
Manual".
162
CHAPTER 2 DEPENDENCE FUNCTIONS
2.4.7.2
Forced Break
This function forcibly aborts the program execution to generate a break.
■ Forced Break
This function forcibly aborts the program execution to generate a break.
When the forced break occurred, the following message appears at the status bar.
Break at address by command abort request
163
CHAPTER 2 DEPENDENCE FUNCTIONS
2.4.8
Confirming the Debugger's State
This section explains methods of confirming the debugger's state and its information.
■ Debugger Information
With this emulator debugger, the following information can be obtained at the time of startup.
- File information of SOFTUNE Workbench
- Hardware-related information
If problems are encountered with SOFTUNE Workbench and its behavior, refer to the information before
contacting the Sales Representatives.
■ Confirmation Method
Debugger's information can be confirmed as follows.
• Command
- SHOW SYSTEM
Refer to section "1.12 SHOW SYSTEM" of "SOFTUNE Workbench Command Reference Manual".
• Dialog
- Version information dialog
Refer to section "4.9.3 Version Information" of "SOFTUNE Workbench Operation Manual".
■ Content to be Displayed
F2MC-8L/8FX Family SOFTUNE Workbench VxxLxx
ALL RIGHTS RESERVED,
COPYRIGHT(C) FUJITSU SEMICONDUCTOR LIMITED 1997
LICENCED MATERIAL PROGRAM PROPERTY OF FUJITSU SEMICONDUCTOR LIMITED
=======================================================
Cpu information file path
: Path to the CPU information file
Cpu information file version : Version of the CPU information file
=======================================================
Add in DLLs
------------------------------------------------------SiCmn
Product name
: SOFTUNE Workbench
File Path
: Path to SiC896.dll
Version
: Version of SiC896.dll
- - - - - - - - - - - - - - - - - - - - - - - - - - - SiiEd
File Path
: Path to SiiEd3.ocx
Version
: Version of SiiEd3.ocx
------------------------------------------------------SiM896
Product name
: SOFTUNE Workbench
File Path
: Path to SiM896.dll
Version
: Version of SiM896.dll
- - - - - - - - - - - - - - - - - - - - - - - - - - - Language Tools
- Compiler
File Path
: Path to fcc896s.exe
- Assembler
File Path
: Path to fasm896s.exe
164
CHAPTER 2 DEPENDENCE FUNCTIONS
- Linker
File Path
: Path to flnk896s.exe
- Librarian
File Path
: Path to flib896s.exe
- FJ-OMF to S-FORMAT Converter
File Path
: Path to f2ms.exe
- FJ-OMF to INTEL-HEX Converter
File Path
: Path to f2is.exe
- FJ-OMF to INTEL-EXT-HEX Converter
File Path
: Path to f2es.exe
- FJ-OMF to HEX Converter
File Path
: Path to f2hs.exe
------------------------------------------------------SiOsM
Product name
: SOFTUNE Workbench
File Path
: Path to SiOsM896.dll
Version
: Version of SiOsM896.dll
------------------------------------------------------F2MC-8L/8FX Series Debugger DLL
Product name
: SOFTUNE Workbench
File Path
: Path to SiD896.dll
Version
: Version of SiD896.dll
- - - - - - - - - - - - - - - - - - - - - - - - - - - Debugger type
: Current debugger type
MCU type
: Currently selected target MCU
VCpu dll name
: Path and name of currently selected virtual debugger section DLL
VCpu dll version
: Version of currently selected virtual debugger section DLL
Adapter type
: BGM adapter currently used
Adapter version
: Version of the adapter
Target type
: BGM target currently used
Target version
: BGM target version
Communication device : Device type
------------------------------------------------------SiIODef
Product name
: SOFTUNE Workbench
File Path
: Path to SiIODef.dll
Version
: Version of SiIODef.dll
=======================================================
Current path
: Currently specified project path
Language
: Currently selected language
Help file path
: Path to the help files
165
CHAPTER 2 DEPENDENCE FUNCTIONS
2.5
Emulator Debugger (MB2146-07)
This section explains the functions of the emulator debugger (MB2146-08) for the
F2MC-8FX Family.
■ Emulator Debugger
The emulator debugger (MB2146-07) for F2MC-8FX family is a software product that controls the
emulator from the host computer to evaluate programs.
■ Before Use
When using the emulator debugger (MB2146-07), set up the USB interface. For details, refer to "Appendix
D Setting USB Interface" of "SOFTUNE Workbench Operation Manual".
Notes:
• If the connected MCU is not compatible with the BGM adapter (MB2146-07), the debugger cannot
be started. For information of compatibility, refer to the Hardware Manual for the product type you
are using.
• When using MCU of Target Version "3.x" with the emulator debugger (MB2146-07), step
execution for the codes which change the following register values always results in the same
value.
PLLC = 0x90;
SYCC = 0xFE;
To check Target Version, refer to "2.5.9 Confirming the Debugger's State".
166
CHAPTER 2 DEPENDENCE FUNCTIONS
2.5.1
Setting Operating Environment
This section explains the operating environment setup.
■ Setting Operating Environment
When using this debugger, set up the operating environment for the following items. When using the
default settings, this step can be omitted because each item is set to the default at startup. Furthermore, the
setting value is restored during the next debugger startup.
• Optimization of Response Speed
• Oscillation Frequency
• Power Supply to the BGM Adapter
• Synchronization of FLASH memory at startup of debugger
• Automatic Update of Firmware
167
CHAPTER 2 DEPENDENCE FUNCTIONS
2.5.1.1
Optimization of Response Speed
This section describes the optimization of response speed.
■ Optimization of Response Speed
The communication speed between the BGM adapter (MB2146-07) and user system varies depending on
the operating frequency of the target MCU. This emulator debugger provides a function that automatically
raises the operating frequency to optimize the communication speed. This function is called the
optimization of response speed.
If the optimization of response speed is disabled while the operating frequency is low, the screen update
may be delayed because of increase of data reading time for debugger.
■ Setting Method
To enable/disable the response speed optimization function, use one of the following.
The default is enabled.
• Setup wizard
Refer to section "4.7.2.5 Setup Wizard" of "SOFTUNE Workbench Operation Manual" for detailed
information.
• [Response Speed] tab on debug environment setting dialog
Refer to section "4.7.2.3 Debug Environment" of "SOFTUNE Workbench Operation Manual" for
detailed information.
This setting is also used to temporarily stop a user program in the RAM monitoring function.
Note:
When the response speed optimization function is enabled, the operating frequency is automatically
changed at break of user program. If you do not want to change the operating frequency
automatically, disable the response speed optimization function.
168
CHAPTER 2 DEPENDENCE FUNCTIONS
2.5.1.2
Oscillation Frequency
This debugger requires an oscillation frequency setting.
■ Setting Oscillation Frequency
The communication speed between the BGM adapter (MB2146-07) and user system varies depending on
the operating frequency of the target MCU. To obtain the operating speed of the target MCU, set the
oscillation clock (FCH) of the main clock. The default is set to the maximum frequency with which the
specified MCU operates with the main clock. Please refer to the hardware manual of the kind used for
details of the oscillation clock (FCH) of the main clock.
■ Setting Method
The oscillation frequency is set by setup wizard.
For detailed, refer to section "4.7.2.4 Setup Wizard" of "SOFTUNE Workbench Operation Manual".
Note:
If only the built-in main CR clock is enabled, use the default.
For details of the built-in main CR clock, refer to the Hardware Manual for the product type you are
using.
169
CHAPTER 2 DEPENDENCE FUNCTIONS
2.5.1.3
Power Supply to BGM Adapter
This debugger requires a setting for power supply to the BGM adapter.
■ Power Supply Setting
The emulator debugger (MB2146-07) can directly supply power to the target.
■ Setting Method
Power supply to the BGM adapter is set as follows.
The default is disabled.
• Setup Wizard
For detailed, refer to section "4.7.2.4 Setup Wizard" of "SOFTUNE Workbench Operation Manual".
Note:
• Even if "Supply power from the BGM adapter to the target" of setup wizard is enabled, the target
does not operate in any of the following cases. Refer to the specifications of the target board or
the hardware manual of the BGM adapter (MB2146-07) for detailed information.
- A power wire from the BGM adapter (MB2146-07) is not connected to the target.
- The voltage supplied with the BGM adapter (MB2146-07) to the target does not reach the value
level required to drive the target.
170
CHAPTER 2 DEPENDENCE FUNCTIONS
2.5.1.4
Synchronization of FLASH memory at Startup of
Debugger
This debugger requires a setting to specify whether or not to synchronize FLASH
memory when the debugger starts.
■ FLASH Memory Synchronization Setting
The BGM adapter (MB2146-07) secures the content of FLASH memory in the buffer within the debugger,
and the content of the buffer is referenced at reading/writing. Specify whether or not to synchronize the
contents of that buffer with the latest data of FLASH memory when the debugger starts. For details about
synchronizing FLASH memory, refer to section "2.5.2 Erasing or Writing FLASH Memory".
■ Setting Method
FLASH Memory Synchronization is set as follows.
The default is enabled.
• Setup Wizard
For detailed, refer to section "4.7.2.4 Setup Wizard" of "SOFTUNE Workbench Operation Manual".
171
CHAPTER 2 DEPENDENCE FUNCTIONS
2.5.1.5
For this setting, use the setup wizard.
This debugger requires a setting to specify whether or not to automatically update
firmware when the debug starts
■ Automatic Update of Firmware
The BGM adapter (MB2146-07) automatically updates the latest firmware based on information in the
emulator when the debugging starts.
Firmware products compared for update are under Lib\907 of the SOFTUNE installation directory.
■ Setting Method
Automatic Update of Firmware is set as follows.
The default is enabled.
• Setup Wizard
For detailed, refer to section "4.7.2.4 Setup Wizard" of "SOFTUNE Workbench Operation Manual".
172
CHAPTER 2 DEPENDENCE FUNCTIONS
2.5.2
Writing to or Erasing FLASH Memory
This debugger supports writing to or erasing FLASH memory.
■ Writing to or Erasing Flash Memory
The emulator debugger (MB2146-07) supports writing to FLASH memory and making a code break
(software break).
This debugger secures the content of FLASH memory in the buffer within the debugger, and the content of
the buffer is referenced at reading/writing. For details of the code break (software break), refer to "2.5.7.1
Code Break".
Writing FLASH memory is carried out automatically in the following cases.
• Before program execution processing
• Before reset processing
• Before end of debugging
The following dialog is displayed at the time of writing to FLASH memory.
Perform one of the followings to manually write/erase FLASH memory.
• Updating FLASH memory
([Environment] - [FLASH area control] - [Download FLASH memory] menu)
Updates FLASH memory. FLASH memory is usually updated automatically prior to executive operation
or reset processing. Use this menu when updating FLASH memory before carrying out this automatic
updating process.
This menu is enabled when data in FLASH memory is changed, writing to FLASH memory is required.
173
CHAPTER 2 DEPENDENCE FUNCTIONS
• Synchronizing FLASH memory
([Environment] - [FLASH area control] - [Synchronize FLASH memory] menu)
Synchronizes the content of the buffer in debugger with that in the flash memory.
Synchronization is automatically performed in steps shown below.
1. The debugger reads the content in the flash memory.
2. The content is compared to that of the buffer in debugger.
3. If there is any difference, the content of buffer is overwritten with that in the flash memory.
Be sure to perform this synchronization when flash memory is written by the user program.
If the synchronization of flash memory is not performed, the following problems may occur.
- The memory content of the debugger cannot be referred properly.
- The user program cannot be executed properly.
• Erasing FLASH memory
([Environment] - [FLASH area control] - [Erase FLASH memory] menu)
Erases all data in FLASH memory. Note that this operation will erase all code break (software break)
settings.
Note:
When setting code break (software), the contents of the flash memory of the specified address are
temporarily rewritten.
174
CHAPTER 2 DEPENDENCE FUNCTIONS
2.5.3
Writing to or Erasing FRAM Area
This debugger supports writing to or Erasing the FRAM area.
■ Writing to or Erasing FRAM
This debugger supports writing to or erasing a FRAM product.
This area can be written to or erased in the memory window, in the same way as for a normal RAM area.
To erase all the FRAM area, select the following menu.
[Environment] - [FLASH area control] - [Erase FLASH memory] menu
Note:
• When an FRAM product is used, FRAM area update or synchronization is not performed even if
any of the following menus is selected.
- [FLASH area control] - [Download FLASH memory] menu
- [FLASH area control] - [Synchronize FLASH memory] menu
175
CHAPTER 2 DEPENDENCE FUNCTIONS
2.5.4
Precautions on Program Execution
In this debugger, note the following points when executing a program.
■ Break in Standby Mode
If abort operation is performed in the standby mode, the debugger releases the standby mode, and aborts
program execution. Therefore, abort at the address following the instruction that changes to the standby
mode.
176
CHAPTER 2 DEPENDENCE FUNCTIONS
2.5.5
Flash Security Detection Function
This debugger supports the flash security function installed in the MCU.
■ Flash Security
This debugger supports the flash security function installed in the MCU.
The flash security function places programs in FLASH memory into the protected state, keeping the
contents private for third parties. FLASH memory is placed into the protected state (*2) state by writing the
specific value to the security byte (*1) in MCU. The protect state can be canceled by erasing all contents in
the flash memory.
(*1) Security byte:
1 byte area within FLASH memory, specified for each MCU.
(*2) Protected state:
Debug operations other than erasing FLASH memory are not accepted.
The flash security function detects the protected state at the following two times.
- At startup of debugger:
Flash memory is already placed in the protected state.
- During debugging:
Flash memory changes to the protected state due to memory writing.
If FLASH memory is in the protected state, the following dialog appears.
If "Yes" is selected, FLASH memory is erased. The debugger is started if debugging is running.
If "No" is selected, the debugger is stopped.
■ For FRAM product
The FRAM memory security function is supported in the same way as for flash security.
177
CHAPTER 2 DEPENDENCE FUNCTIONS
2.5.6
Precautions on Starting and Ending the Debugger
In this debugger, note the following points when starting and ending the debugger.
■ When Starting the Debugger
• Synchronizing FLASH Memory
Flash memory is controlled in the buffer method; therefore, the debugger must synchronize with FLASH
memory at startup.
- Synchronize:
Reads all the contents of FLASH memory.
- Not synchronize: Erases the contents of FLASH memory.
For this setting, use the setup wizard. Refer to section "4.7.2.5 Setup Wizard" of "SOFTUNE Workbench
Operation Manual" for detailed information.
It takes up to 20 seconds longer for the debugger to start under the following conditions when
"synchronization" takes place compared to the time when "synchronization" does not take place.
Flash memory:
The sector size is 16 KB.
Clock:
The clock-up mode is enabled.
• Power Monitoring
This debugger supports power monitoring. If an error is detected at startup of the debugger, the following
dialog appears.
If "OK" is selected, the startup of the debugger is retried. If "Cancel" is selected, the debugger is stopped.
• Detecting CR trimming
This debugger cannot be started unless the clock status is normal. If an error is detected at startup of the
debugger, the following dialog appears.
If "Yes" is selected, the startup of the debugger is retried. If "No" is selected, the debugger is stopped. For
details of CR trimming, refer to the Hardware Manual for the product type you are using.
178
CHAPTER 2 DEPENDENCE FUNCTIONS
■ When Ending the Debug
Considering that the MCU is to be used in the stand-alone mode after the debugging ended, this debugger
automatically erases software breaks specified in FLASH memory when the debugging process ends.
Therefore, update FLASH memory for each sector in which a software break is specified. The required
time depends on the software break setting.
Note:
If a software break is specified, stand-alone operations cannot be ensured under the following
conditions.
1. Updating FLASH memory was aborted when the debugger ended.
2. Workbench has been ended abnormally during debugging.
3. A connection with hardware has been disconnected during debugging.
179
CHAPTER 2 DEPENDENCE FUNCTIONS
2.5.7
Break
This debugger supports two types of break functions. If program execution is aborted
by each break function, break address and break cause are displayed on the screen.
■ Break Functions
This debugger supports the following two types of break functions.
- Code break
- Forced break
180
CHAPTER 2 DEPENDENCE FUNCTIONS
2.5.7.1
Code Break
This function aborts program execution by monitoring a specified address. A break
occurs before executing an instruction at the specified address.
■ Code Break
This function aborts a program by monitoring a specified address using hardware or software. A break
occurs before executing an instruction at the specified address.
The maximum number of setting points are as follows.
Hardware: 3 points
Software: 256 points
When the code break occurs, the following message appears in the status bar.
- Hardware
Break at address by hardware breakpoint
- Software
Break at address by breakpoint
■ Setting Method
Code break can be set as follows.
• Command
- SET BREAK
Refer to "3.1 SET BREAK (type 1)" of "SOFTUNE Workbench Command Reference Manual".
• Dialog
- Break point setting dialog [code] tab
Refer to "4.6.4 Break Point" of "SOFTUNE Workbench Operation Manual".
• Window
- Source window/disassemble window
Refer to "3.7 Source Window" or "3.9 Disassemble Window" of "SOFTUNE Workbench Operation
Manual".
181
CHAPTER 2 DEPENDENCE FUNCTIONS
2.5.7.2
Forced Break
This function forcibly aborts program execution.
■ Forced Break
This function forcibly aborts program execution.
When program is stopped by a forced break, the following message appears on the status bar.
Break at address by command abort request
■ Setting Method
A forced break is controlled as follows.
• Command
- ABORT
Refer to section "2.4 ABORT" of "SOFTUNE Workbench Command Reference Manual.
• Menu
- [Debug] - [Stop] menu
Refer to "4.6.2 ABORT" of "SOFTUNE Workbench Operation Manual".
182
CHAPTER 2 DEPENDENCE FUNCTIONS
2.5.8
RAM Monitoring
RAM Monitoring function monitors memory contents at a specific address while
executing a user program.
■ RAM Monitoring
This function monitors memory contents at a specific address while executing a user program.
The monitoring function reads for each sampling cycle (refer to Figure 2.5-1); therefore, a user program
stops at periodical intervals.
Up to 16 addresses can be specified on a 16-bit basis.
The specified addresses can be monitored on the RAM monitoring window.
■ Use Conditions
RAM monitoring is available when the following conditions are satisfied.
SOFTUNE Workbench:
V30L33 or later
BGM adapter (MB2146-07):MB2146-07
■ Setting Method
RAM monitoring is controlled as follows.
• Command
- SET RAMMONITOR
Refer to section "4.29 SET RAM MONITOR" of "SOFTUNE Workbench Command Reference
Manual".
• Dialog
- RAM Monitoring Setup Dialog
Refer to "4.4.15 RAM Monitoring" of "SOFTUNE Workbench Operation Manual".
■ Stop Time during Monitoring
The RAM monitoring function temporarily stops executing a user program when reading, and restarts it
after reading.
The stop time at reading varies depending on the following values.
• Operating frequency of user program
• Number of specified addresses
183
CHAPTER 2 DEPENDENCE FUNCTIONS
Figure 2.5-1 User Program StopTime (Tstp)
Tcyc
Tcyc
Tstp
Tstp
Tstp
Tstp
Tp
(Tr * N)
Ts
The stop time at reading can be obtained in the following formula.
User program stop time (Tstp) = Program stop processing time (Tp)
+ (1-address reading time (Tr) * Number of addresses (N))
+ Program restart processing time (Ts)
Sampling cycle (Tcyc): Default: 1 sec., Allowable range: 100 to 65535 ms
Table 2.5-1 Approximate time the user program stops
CPU product
Stop time
Operating
(Target
frequency
Version)
Minimum (N=1) Maximum (N=16)
MB95F636
(From 3.1)
8 MHz
Approx. 55 ms
Approx. 60 ms
1 MHz (*)
Approx. 55 ms
Approx. 60 ms
MB95F564
(2.x)
8 MHz
Approx. 58 ms
Approx. 65 ms
1 MHz (*)
Approx. 76 ms
Approx. 83 ms
MB95F264
(1.x)
8 MHz
Approx. 78 ms
Approx. 105 ms
1 MHz (*)
Approx. 84 ms
Approx. 120 ms
Remarks
* When the optimization of response speed is disabled
* When the optimization of response speed is disabled
* When the optimization of response speed is disabled
For details of the optimization of response speed, refer to "2.5.1.1 Optimization of Response Speed".
To check Target Version, refer to "2.5.9 Confirming the Debugger's State".
184
CHAPTER 2 DEPENDENCE FUNCTIONS
Notes:
• This function reads memory while temporarily stopping the execution of a user program. If a
number of addresses are registered, it requires a longer program execution stop time.
• When a user program operates in the sub clock mode, it stops for a long time (1 sec. or more). Do
not use the RAM monitoring function to avoid influence caused by stopping user program for a
long time while running performance measurement, etc.
• The sampling cycle can be changed; however, if it is shorter than the stop time, a user program
remains stopped. Specify the appropriate sampling cycle.
185
CHAPTER 2 DEPENDENCE FUNCTIONS
2.5.9
Confirming the Debugger's State
This section explains how to confirm debugger information.
■ Confirming the Debugger's State
This emulator debugger allows you to confirm the following information at startup.
• File information of SOFTUNE Workbench
• Hardware information
"If problems are encountered with SOFTUNE Workbench and its behavior, this file information can be
referred when contacting the Sales/Support Division."
■ Confirmation Method
Use the following methods to confirm debugger information.
• Command
- SHOW SYSTEM
Refer to section "1.12 SHOW SYSTEM" of "SOFTUNE Workbench Command Reference Manual".
• Dialog
- Version information dialog
Refer to section "4.9.3 Version Information" of "SOFTUNE Workbench Operation Manual".
■ Content to be Displayed
The debugger information is displayed as shown below.
F2MC-8L/8FX Family SOFTUNE Workbench VxxLxx
ALL RIGHTS RESERVED,
COPYRIGHT(C) FUJITSU SEMICONDUCTOR LIMITED 1997
LICENCED MATERIAL PROGRAM PROPERTY OF FUJITSU SEMICONDUCTOR LIMITED
=======================================================
Cpu information file path
:Path to the CPU information file
Cpu information file version :Version of the CPU information file
=======================================================
Add in DLLs
------------------------------------------------------SiCmn
Product name : SOFTUNE Workbench
File Path
: Path to SiC896.dll
Version
: Version of SiC896.dll
- - - - - - - - - - - - - - - - - - - - - - - - - - - SiiEd
File Path
: Path to SiiEd3.ocx
Version
: Version of SiiEd3.ocx
------------------------------------------------------SiM896
Product name : SOFTUNE Workbench
File Path
: Path to SiM896.dll
Version
: Version of SiM896.dll
- - - - - - - - - - - - - - - - - - - - - - - - - - - Language Tools
- Compiler
File Path : Path to fcc896s.exe
- Assembler
186
CHAPTER 2 DEPENDENCE FUNCTIONS
File Path : Path to fasm896s.exe
- Linker
File Path : Path to flnk896s.exe
- Librarian
File Path : Path to flib896s.exe
- FJ-OMF to S-FORMAT Converter
File Path : Path to f2ms.exe
- FJ-OMF to INTEL-HEX Converter
File Path : Path to f2is.exe
- FJ-OMF to INTEL-EXT-HEX Converter
File Path : Path to f2es.exe
- FJ-OMF to HEX Converter
File Path : Path to f2hs.exe
------------------------------------------------------SiOsM
Product name : Softune Workbench
File Path
: Path to SiOsM896.dll
Version
: Version of SiOsM896.dll
------------------------------------------------------F2MC-8L/8FX Series Debugger DLL
Product name : SOFTUNE Workbench
File Path
: Path to SiD896.dll
Version
: Version of SiD896.dll
- - - - - - - - - - - - - - - - - - - - - - - - - - - Debugger type
: Current debugger type
MCU type
: Currently selected target MCU
VCpu dll name
: Path and name of currently selected virtual debugger section DLL
VCpu dll version
: Version of currently selected virtual debugger section DLL
Adapter type
: BGM adapter currently used
Adapter version
: Version of the BGM adapter
Target type
: BGM target currently used
Target version
: BGM target version
Communication device : Device type
------------------------------------------------------SiIODef
Product name : Softune Workbench
File Path
: Path to SiIODef.dll
Version
: Version of SiIODef.dll
=======================================================
Current path
: Currently specified project path
Language
: Currently selected language
Help file path : Path to the help files
187
CHAPTER 2 DEPENDENCE FUNCTIONS
2.6
Monitor Debugger
This section describes the functions of the monitor debugger for the F2MC-8FX family.
■ Monitor Debugger
The monitor debugger works by incorporating a monitor program into the target system which provides
debugging functions via communication with a host computer.
Before it can be used, the monitor program must be ported to the target hardware. Refer to the "Appendix E
Incorporating the Monitor Debugger" of "SOFTUNE Workbench Operation Manual" for details.
Note:
The BGM adapter (MB2146-09A or later) is required to use the monitor debugger. The monitor
debugger cannot be used with the old BGM adapter (MB2146-09). Attempting to use the old BGM
adapter (MB2146-09) as a monitor debugger may cause a system fault.
188
CHAPTER 2 DEPENDENCE FUNCTIONS
2.6.1
Writing to the FLASH memory
The monitor debugger supports writing to the FLASH memory.
■ Writing to the FLASH memory
The monitor debugger writes to the FLASH memory. Writing is only performed when loading the file.
The following dialog is displayed while writing to the FLASH memory.
■ Error Message if Loading Fails
The following error messages may be displayed depending on the content of the file being loaded to the
FLASH memory. Refer to "Appendix B Debugger Related Error Messages" in the "SOFTUNE Workbench
Command Reference".
1. If access to the FLASH memory occurs other than for loading:
"The FLASH area can only be accessed by the LOAD command."
2. If a file that includes ROM or RAM areas is loaded:
"Loading of files that include ROM or RAM areas is not permitted."
Notes:
• The FLASH memory is only written to when loading a file. The FLASH memory cannot be
modified directly using the memory window or other memory manipulation commands.
• Only load files for the FLASH memory range to the FLASH memory. If a file contains data for
other areas, it will not be written to the FLASH memory.
• Chip erasing is automatically executed for 1-sector device.
189
CHAPTER 2 DEPENDENCE FUNCTIONS
2.6.2
Fast downloading
Monitor debugger can shorten the download time to FLASH memory.
■ Fast downloading
When loading programs to FLASH memory, load time can be shorten to 1/6.
However, the Workbench automatically performs the following operations.
• Complete erasing of flash memory
• Resetting target files
• Rewriting RAM area
■ Conditions for Use
Fast downloading can be used under the following conditions.
SOFTUNE Workbench: Version V30L32 or later
BGM adapter:
Model MB2146-09B-E
■ Setting Method
Set fast downloading as follows.
• Command
- LOAD
Refer to Section "7.1 LOAD" of "SOFTUNE Workbench Command Reference Manual".
• Dialog
- [Load] tab of setup debug environment dialog
Refer to Section "4.7.2.3 Debug Environment" of "SOFTUNE Workbench Operation Manual".
190
CHAPTER 2 DEPENDENCE FUNCTIONS
2.6.3
Points to Note when Executing Programs
Take note of the following points when using this emulator to execute a program.
■ Code Break Settings when Using Step Execution
The wild register is used temporarily when using the monitor debugger in step-in mode at the machine
language level. As it is not possible to set code breakpoints during this time, code breakpoints are disabled.
In particular, when using step execution with the "interrupt mask" set to disable interrupts, you need to take
note of this point in situations such as when a breakpoint is set in an interrupt handler. As breakpoints set in
interrupt handlers are disabled, execution will not break even if the breakpoint code is executed.
191
CHAPTER 2 DEPENDENCE FUNCTIONS
2.6.4
Break
This Debugger provides two types of break functions. When by each break function
aborts program execution, the address where a break occurred and the break factor are
displayed.
■ Break Functions
This Debugger provides the following two types of break functions;
- Code break
- Forced break
192
CHAPTER 2 DEPENDENCE FUNCTIONS
2.6.4.1
Code Break
This function aborts the program execution by monitoring a specified address by
software. A break occurs before executing an instruction at the specified address.
■ Code Break
This function aborts the program execution by monitoring a specified address by software. A break occurs
before executing an instruction at the specified address.
Up to 2 addresses can be set for this debugger.
When the code break occurs, the following message appears at the status bar.
Break at address by breakpoint
■ Setting Method
Set code break as follows.
• Command
- SET BREAK
Refer to "3.1 SET BREAK (type 1)" of "SOFTUNE Workbench Command Reference Manual".
• Dialog
- "Code" tab in breakpoint setting dialog
Refer to "4.6.4 Breakpoint" of "SOFTUNE Workbench Operation Manual".
• Window
- Source window/disassemble window
Refer to "3.7 Source Window" or "3.9 Disassemble Window" of "SOFTUNE Workbench Operation
Manual".
193
CHAPTER 2 DEPENDENCE FUNCTIONS
2.6.4.2
Forced Break
This function forcibly aborts the program execution to generate a break.
■ Forced Break
This function forcibly aborts the program execution to generate a break.
When the forced break occurred, the following message appears at the status bar.
Break at address by command abort request
194
CHAPTER 2 DEPENDENCE FUNCTIONS
2.6.5
Confirming the Debugger's State
This section explains methods of confirming the debugger's state and its information.
■ Debugger Information
With this monitor debugger, the following information can be obtained at the time of startup.
- File information of SOFTUNE Workbench
- Hardware-related information
If problems are encountered with SOFTUNE Workbench and its behavior, refer to the information before
contacting the Sales Representatives.
■ Confirmation Method
Debugger's information can be confirmed as follows.
• Command
- SHOW SYSTEM
Refer to section "1.12 SHOW SYSTEM" of "SOFTUNE Workbench Command Reference Manual".
• Dialog
- Version information dialog
Refer to section "4.9.3 Version Information" of "SOFTUNE Workbench Operation Manual".
■ Content to be Displayed
The debugger information is displayed as shown below.
F2MC-8L/8FX Family SOFTUNE Workbench VxxLxx
ALL RIGHTS RESERVED,
COPYRIGHT(C) FUJITSU SEMICONDUCTOR LIMITED 1997
LICENCED MATERIAL PROGRAM PROPERTY OF FUJITSU SEMICONDUCTOR LIMITED
=======================================================
Cpu information file path
: Path to the CPU information file
Cpu information file version : Version of the CPU information file
=======================================================
Add in DLLs
------------------------------------------------------SiCmn
Product name
: SOFTUNE Workbench
File Path
: Path to SiC896.dll
Version
: Version of SiC896.dll
- - - - - - - - - - - - - - - - - - - - - - - - - - - SiiEd
File Path
: Path to SiiEd3.ocx
Version
: Version of SiiEd3.ocx
------------------------------------------------------SiM896
Product name
: SOFTUNE Workbench
File Path
: Path to SiM896.dll
Version
: Version of SiM896.dll
- - - - - - - - - - - - - - - - - - - - - - - - - - - Language Tools
- Compiler
File Path
: Path to fcc896s.exe
- Assembler
195
CHAPTER 2 DEPENDENCE FUNCTIONS
File Path
: Path to fasm896s.exe
- Linker
File Path
: Path to flnk896s.exe
- Librarian
File Path
: flib896s.exe
- FJ-OMF to S-FORMAT Converter
File Path
: Path to flib896s.exe
- FJ-OMF to INTEL-HEX Converter
File Path
: Path to f2is.exe
- FJ-OMF to INTEL-EXT-HEX Converter
File Path
: Path to f2es.exe
- FJ-OMF to HEX Converter
File Path
: Path to f2hs.exe
------------------------------------------------------SiOsM
Product name
: SOFTUNE Workbench
File Path
: Path to SiOsM896.dll
Version
: Version of SiOsM896.dll
------------------------------------------------------F2MC-8L/8FX Series Debugger DLL
Product name
: SOFTUNE Workbench
File Path
: Path to SiD896.dll
Version
: Version of SiD896.dll
- - - - - - - - - - - - - - - - - - - - - - - - - - - Debugger type
: Current debugger type
MCU type
: Currently selected target MCU
VCpu dll name
: Path and name of currently selected virtual debugger section DLL
VCpu dll version
: Version of currently selected virtual debugger section DLL
Adapter type
: BGM adapter currently used
Adapter version
: Version of the BGM adapter
Target type
: BGM target currently used
Target version
: BGM target version
Clock mode
: Main clock / sub clock
Communication device : Device type
------------------------------------------------------SiIODef
Product name
: SOFTUNE Workbench
File Path
: Path to SiIODef.dll
Version
: Version of SiIODef.dll
=======================================================
Current path
: Currently specified project path
Language
: Currently selected language
Help file path
: Path to the help files
196
INDEX
INDEX
Symbols
A
/CYCLE
Display All Bus Cycles (Specify/CYCLE.)......... 104
/INSTRUCTION
Display in Only Instruction Execution
(Specify/INSTRUCTION.) .................. 105
/SOURCE
Display in Source Line Units (Specify/SOURCE.)
.......................................................... 105
Access Attributes
Access Attributes for Memory Areas ....................61
Memory Area Access Attributes ..........................36
Active Project
Active Project ......................................................2
Active Project Configuration .................................4
Assembly
Line Assembly ...................................................27
Automatic Update
Automatic Update of Firmware ..........................172
B
Break
Break at Standby Mode .............................144, 157
Break by Sequencer ............................................88
Break Functions ...........42, 67, 133, 161, 180, 192
Buffer-full Break ................................................54
Code Break ..........................43, 68, 134, 162, 193
Code Break Settings
when Using Step Execution ..................191
Data Break ...........................................44, 70, 135
Forced Break........................47, 75, 138, 163, 194
Monitoring Data Break......................................136
Notes on Instruction Execution Break...................68
Performance Buffer-full Break.............................74
Sequential Break ........................................71, 137
Specify Performance-Buffer-Full Break..............111
Trace Buffer-full Break .................................46, 73
Breaks
Guarded Access Breaks.................................45, 72
Build
Build Function .....................................................6
Customize Build Function .....................................7
Bus Cycles
Display All Bus Cycles (Specify/CYCLE.) .........104
C
C Language
Notes on Symbols of C Language ........................31
Specifying Variables of C Language.....................31
Clock
Main Clock Oscillation .....................................130
Setting Main Clock Oscillation Frequency ..........153
Clock-up Mode
Clock-up Mode ................................................129
197
INDEX
Code Break
Code Break.................. 43, 68, 134, 162, 181, 193
Code Break Settings
when Using Step Execution.................. 191
Commands
Commands for External Probe Data ................... 122
On-the-fly Executable Commands ....................... 64
Coverage
Coverage Measurement Function....................... 115
Coverage Measurement Operation ..................... 115
Coverage Measurement Procedures.................... 115
Displaying Coverage Measurement Result.......... 116
Measuring Coverage......................................... 116
Setting Range for Coverage Measurement .......... 116
Customize
Customize Build Function ..................................... 7
D
Data Break
Data Break........................................... 44, 70, 135
Debug
Debug the End ................................................. 160
When Ending the Debug ................................... 179
Debugger
Emulator Debugger .............................. 24, 57, 151
Emulator Debugger
(MB2146-09/09A/09B)........................ 125
Monitor Debugger ...................................... 24, 188
Simulator Debugger...................................... 24, 34
Type of Debugger .............................................. 24
When Starting Debugger ................................... 159
When Starting the Debugger.............................. 178
Debugger’s
Confirming the Debugger’s State ....................... 186
Dependence
Project Dependence .............................................. 5
Disassembly
Disassembly ...................................................... 27
E
Editor
External Editor................................................... 14
Standard Editor .................................................. 13
Emulator
Emulator Debugger .............................. 24, 57, 151
Emulator Debugger
(MB2146-09/09A/09B)........................ 125
Emulator Debugger
Emulator Debugger ...................... 24, 57, 151, 166
Emulator Debugger
(MB2146-09/09A/09B)........................ 125
Erasing
Erasing/Programming FLASH Memory
.................................................. 131, 154
198
Writing to or Erasing Flash Memory.................. 173
Writing to or Erasing FRAM............................. 175
Error
Error ............................................................... 148
Error Jump
Error Jump Function .......................................... 11
Error Message
Error Message if Loading Fails ................. 189, 190
Event
Event Modes ..................................................... 77
Event-related Commands in Multi Trace Mode
........................................................... 81
Event-related Commands in Normal Mode ........... 79
Event-related Commands in Performance Mode
........................................................... 83
Event Mode
Setting Event Mode.......................................... 111
Event Modes
Event Modes ..................................................... 77
Events
Setting Events............................................ 76, 112
External Editor
External Editor .................................................. 14
External Probe
Commands for External Probe Data ................... 122
Displaying and Setting External Probe Data
......................................................... 122
External Probe Sampling Timing....................... 121
Sampling by External Probe.............................. 121
External Tools
External Tools ................................................... 16
F
Firmware
Automatic Update of Firmware ......................... 172
FLASH
Using the FLASH Area .................................... 190
FLASH Memory
Erasing/Programming FLASH Memory
................................................. 131, 154
FLASH Memory Synchronization Setting .......... 171
Writing to the FLASH memory ......................... 189
Flash Memory
Writing to or Erasing Flash Memory.................. 173
FLASH Security
FLASH Security .............................................. 158
Flash Security
Flash Security.................................................. 177
Forced Break
Forced Break ............... 47, 75, 138, 163, 182, 194
Format
Display Format of Trace Data ........................... 141
INDEX
FRAM
For FRAM product........................................... 177
Writing to or Erasing FRAM............................. 175
Frame Number
Frame Number and Step Number in Single Trace
............................................................ 96
Multi Trace Frame Number................................. 99
Frame number
Frame number ................................................. 140
G
Guarded Access Breaks
Guarded Access Breaks ................................ 45, 72
I
I/O Port
I/O Port Settings ................................................ 37
I/O Port Simulation ............................................ 37
Include Dependencies
Analyzing Include Dependencies........................... 9
Instruction
Display in Only Instruction Execution
(Specify/INSTRUCTION.) .................. 105
Instruction Simulation ........................................ 35
Instruction Execution Break
Notes on Instruction Execution Break .................. 68
Interrupt
Interrupt Simulation ........................................... 38
L
Line Assembly
Line Assembly................................................... 27
Line Number
Line Number Information ................................... 29
Low-Power Consumption Mode
Low-Power Consumption Mode Simulation ......... 40
M
Macro
Examples of Macro Expansion ............................ 20
Macro List..................................................... 7, 17
Macros
Macros.............................................................. 17
Main Clock Oscillation
Main Clock Oscillation..................................... 130
Setting Main Clock Oscillation Frequency
.......................................................... 153
Make
Make Function..................................................... 6
MCU
MCU Operation Mode........................................ 59
Measurement Range
How to Extend the Measurement Range..............147
Measurement Result
Clearing the Measurement Result .......................148
Displaying the Measurement Result ...................147
Memory
Access Attributes for Memory Areas ....................61
Functions for Memory Operations ........................25
Memory Area Access Attributes ..........................36
Memory Area Types ...........................................60
Memory Simulation ............................................36
Read/Write Memory while On-the-fly ..................65
Simulation Memory Space...................................36
Memory Map
Creating and Displaying Memory Map .................61
Minimum Measurement Unit
Setting Minimum Measurement Unit for Timer
..........................................................111
Mode
Break at Standby Mode .............................144, 157
Clock-up Mode ................................................129
Event-related Commands in Multi Trace Mode
............................................................81
Event-related Commands in Performance Mode
............................................................83
Low-Power Consumption Mode Simulation ..........40
MCU Operation Mode ........................................59
Operation in Multi Trace Mode............................80
Operation in Normal Mode ..................................78
Operation in Performance Mode ..........................82
Setting Event Mode ..........................................111
Monitor
Monitor Debugger ......................................24, 188
Monitor Debugger
Monitor Debugger ......................................24, 188
Monitoring
Halt Time During Monitoring ............................145
RAM Monitoring..............................................183
Stop Time during Monitoring ............................183
Monitoring Data Break
Monitoring Data Break......................................136
Multi Trace
Multi Trace Frame Number .................................99
Multi Trace Function ..........................................99
Reading Trace Data On-the-fly in the Multi Trace
..........................................................107
Setting Multi Trace ...........................................101
Multi Trace Mode
Event-related Commands in Multi Trace Mode
............................................................81
Operation in Multi Trace Mode............................80
199
INDEX
N
Normal Mode
Event-related Commands in Normal Mode ........... 79
Operation in Normal Mode.................................. 78
O
On-the-fly
On-the-fly Executable Commands ....................... 64
Read/Write Memory while On-the-fly .................. 65
Reading Trace Data On-the-fly in Single Trace
.......................................................... 106
Reading Trace Data On-the-fly in the Multi Trace
.......................................................... 107
Operating Environment
Operating Environment................................. 23, 58
Setting Operating Environment.......... 128, 152, 167
Operation Mode
MCU Operation Mode ........................................ 59
Optimization of Response Speed
Optimization of Response Speed........................ 168
Optional Settings
Example of Optional Settings .............................. 15
Options
Function of Setting Tool Options ......................... 10
Setting Options ........................................ 7, 14, 16
Tool Options...................................................... 10
Oscillation
Main Clock Oscillation ..................................... 130
Setting Main Clock Oscillation Frequency .......... 153
Oscillation Frequency
Setting Oscillation Frequency ............................ 169
P
Performance Buffer-full Break
Performance Buffer-full Break ............................ 74
Performance Measurement Data
Clearing Performance Measurement Data ........... 112
Displaying Performance Measurement Data
.......................................................... 112
Performance Measurement Function
Performance Measurement Function .................. 110
Performance Mode
Event-related Commands in Performance Mode
............................................................ 83
Operation in Performance Mode .......................... 82
Performance-Buffer-Full Break
Specify Performance-Buffer-Full Break ............. 111
Port
I/O Port Settings................................................. 37
I/O Port Simulation ............................................ 37
I/O Port Simulation (Input Port)........................... 38
Power Supply
Power Supply Setting ....................................... 170
200
Program
Executing Program........................................... 112
Programming
Erasing/Programming FLASH Memory
................................................. 131, 154
Project
Active Project...................................................... 2
Active Project Configuration................................. 4
Project ................................................................ 2
Project Configuration ........................................... 4
Project Dependence.............................................. 5
Project format...................................................... 3
Project Management Function ............................... 3
Project Configuration
Active Project Configuration................................. 4
Project Configuration ........................................... 4
Projects
Restrictions on Storage of Two or More Projects
............................................................. 2
R
RAM
RAM Monitoring ............................................. 183
Reference
Reference Section .............................................. 23
Register
Register Operations............................................ 26
Reset
Reset Simulation................................................ 39
S
Sample Flow
Sample Flow of Time Measurement by Sequencer
........................................................... 92
Sampling
External Probe Sampling Timing....................... 121
Trace Sampling Control by Sequencer ................. 89
Scope
Scope................................................................ 30
Search Procedure
Specifying Symbol and Search Procedure ............ 30
Section
Reference Section .............................................. 23
Sequence
Sequence Function ............................................. 84
Sequencer
Break by Sequencer ........................................... 88
Control by Sequencer ......................................... 84
Sample Flow of Time Measurement by Sequencer
........................................................... 92
Setting Sequencer .............................................. 86
Time Measurement by Sequencer ........................ 91
Trace Sampling Control by Sequencer ................. 89
INDEX
Sequential Break
Sequential Break........................................ 71, 137
Setting
Setting Method ................... 41, 43, 44, 45, 46, 68,
70, 71, 72, 73, 74, 129, 130, 134, 135,
136, 137, 145, 153, 162, 169, 170, 171,
172, 193
Simulation
I/O Port Simulation ............................................ 37
Instruction Simulation ........................................ 35
Interrupt Simulation ........................................... 38
Low-Power Consumption Mode Simulation
............................................................ 40
Memory Simulation ........................................... 36
Reset Simulation................................................ 39
Simulation Memory Space .................................. 36
Simulation Range............................................... 34
Simulator
Simulator Debugger ..................................... 24, 34
Simulator Debugger
Simulator Debugger ..................................... 24, 34
Single Trace
Frame Number and Step Number in Single Trace
............................................................ 96
Function of Single Trace..................................... 95
Reading Trace Data On-the-fly in Single Trace
.......................................................... 106
Setting Single Trace ........................................... 97
Source Line Units
Display in Source Line Units (Specify/SOURCE.)
.......................................................... 105
Standard Editor
Standard Editor.................................................. 13
Standby Mode
Break at Standby Mode ............................ 144, 157
Break in Standby Mode .................................... 176
Step Number
Frame Number and Step Number in Single Trace
............................................................ 96
Storage Information
Displaying Trace Data Storage Information
.......................................................... 141
Storage Status
Displaying Trace Data Storage Status ................ 102
STUB
Outline of STUB Function .................................. 41
Subproject
Subproject ........................................................... 2
Symbol
Setting Symbol Information ................................ 28
Specifying Symbol and Search Procedure............. 30
Symbols
Notes on Symbols of C Language ........................31
Types of Symbols ...............................................28
Syntax
Syntax ...............................................................11
T
Time Measurement
Sample Flow of Time Measurement by Sequencer
............................................................92
Time Measurement by Sequencer.........................91
Timer Minimum Measurement Unit
Setting Timer Minimum Measurement Unit ..........63
Tool Options
Function of Setting Tool Options .........................10
Tool Options ......................................................10
Trace
Trace ...............................................................139
Trace Functions ..................................................49
Trace Sampling Control by Sequencer ..................89
Trace Buffer-full Break
Trace Buffer-full Break .................................46, 73
Trace Data
Clearing Trace Data ..........................................141
Display Format of Trace Data ............................141
Displaying Trace Data Storage Information.........141
Displaying Trace Data Storage Status .................102
Reading Trace Data On-the-fly in Single Trace
..........................................................106
Reading Trace Data On-the-fly in the Multi Trace
..........................................................107
Sampling Trace Data.........................................139
Saving Trace Data ....................................108, 142
Searching of Trace Data ....................................109
Specify Displaying Trace Data Position ..............103
Trace Data .......................................................139
V
Variables
Specifying Variables of C Language.....................31
W
Workspace
Workspace ...........................................................2
Workspace Management Function..........................2
Writing
Writing to or Erasing Flash Memory ..................173
Writing to or Erasing FRAM .............................175
201
INDEX
202
Colophon
CM25-00324-5E
FUJITSU SEMICONDUCTOR • CONTROLLER MANUAL
F2MC-8L/8FX FAMILY
SOFTUNETM Workbench
USER'S MANUAL
August 2011 the 5th edition
Published
FUJITSU SEMICONDUCTOR LIMITED
Edited
Sales Promotion Dept.