1
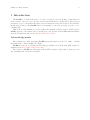
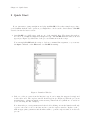
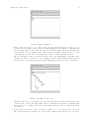
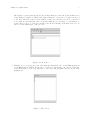
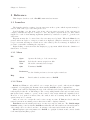
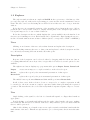
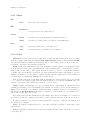
Process Behaviour Explorer
ProBE User Manual
14 Jan 2003
Formal Systems (Europe) Ltd <http://www.fsel.com/>
c 2003 Formal Systems (Europe) Ltd
Copyright This is the third edition of this User Manual.
It covers primarily ProBE version 1.30.
i
Table of Contents
.......................................................... 1
1
Introduction . . . . . . . . . . . . . . . . . . . . . . . . . . . . . . . . . . . . . . . . . . . 2
2
Quick Start . . . . . . . . . . . . . . . . . . . . . . . . . . . . . . . . . . . . . . . . . . . . 3
3
Reference . . . . . . . . . . . . . . . . . . . . . . . . . . . . . . . . . . . . . . . . . . . . . . 6
3.1
3.2
3.3
3.4
3.5
4
6
6
6
7
8
8
9
9
9
Technical Details . . . . . . . . . . . . . . . . . . . . . . . . . . . . . . . . . . . . . . 10
4.1
4.2
4.3
5
Launcher . . . . . . . . . . . . . . . . . . . . . . . . . . . . . . . . . . . . . . . . . . . . . . . . . . . . . . . . . . . . . . . . .
3.1.1 Menu . . . . . . . . . . . . . . . . . . . . . . . . . . . . . . . . . . . . . . . . . . . . . . . . . . . . . . . . . . . .
3.1.2 Notes . . . . . . . . . . . . . . . . . . . . . . . . . . . . . . . . . . . . . . . . . . . . . . . . . . . . . . . . . . . .
Explorer . . . . . . . . . . . . . . . . . . . . . . . . . . . . . . . . . . . . . . . . . . . . . . . . . . . . . . . . . . . . . . . . . .
3.2.1 Menu . . . . . . . . . . . . . . . . . . . . . . . . . . . . . . . . . . . . . . . . . . . . . . . . . . . . . . . . . . . .
3.2.2 Notes . . . . . . . . . . . . . . . . . . . . . . . . . . . . . . . . . . . . . . . . . . . . . . . . . . . . . . . . . . . .
Inspector . . . . . . . . . . . . . . . . . . . . . . . . . . . . . . . . . . . . . . . . . . . . . . . . . . . . . . . . . . . . . . . . .
Trace display. . . . . . . . . . . . . . . . . . . . . . . . . . . . . . . . . . . . . . . . . . . . . . . . . . . . . . . . . . . . . .
Viewer . . . . . . . . . . . . . . . . . . . . . . . . . . . . . . . . . . . . . . . . . . . . . . . . . . . . . . . . . . . . . . . . . . .
Display font. . . . . . . . . . . . . . . . . . . . . . . . . . . . . . . . . . . . . . . . . . . . . . . . . . . . . . . . . . . . . . 10
GUI style . . . . . . . . . . . . . . . . . . . . . . . . . . . . . . . . . . . . . . . . . . . . . . . . . . . . . . . . . . . . . . . . 10
Operational semantics . . . . . . . . . . . . . . . . . . . . . . . . . . . . . . . . . . . . . . . . . . . . . . . . . . . . 10
Licence . . . . . . . . . . . . . . . . . . . . . . . . . . . . . . . . . . . . . . . . . . . . . . . 11
Appendix A Revision History . . . . . . . . . . . . . . . . . . . . . . . . . . . . 13
Appendix B Bibliography . . . . . . . . . . . . . . . . . . . . . . . . . . . . . . . . 14
1
c 2003, Formal Systems (Europe) Ltd.
The ProBE tool and this User Manual are Copyright Chapter 1: Introduction
2
1 Introduction
The ProBE tool enables the user to “browse” a CSP process by following events that lead
from one state of the process to another. It uses a hierarchical list to display the possible actions
and states of a process in much the same way as a filesystem viewer shows directories and files.
In this way, it is hoped that ProBE will be very intuitive to use and, not least, a great boon to
teaching CSP.
This version of the manual does not document the machine-readable version of CSP used by
ProBE. A guide to the syntax can be found in [Roscoe97] and also in the FDR2 manual available
from the Formal Systems web-site (http://www.fsel.com/).
Acknowledgements
The semantics for CSP underlying ProBE was partly funded by the U.S. Office of Naval
Research under contract N00014–87–J1242.
ProBE uses the Qt cross-platform GUI library available from Troll Tech (full details are
available from http://www.trolltech.com/).
The releases of ProBE are built using various GNU software components, notably g++, but
also including awk, bison, flex and make.
Chapter 2: Quick Start
3
2 Quick Start
If you just want to jump straight in and play with ProBE, follow these simple steps. Once
you’re familiar with the basic operation, you might like to check out the other features of ProBE
described in the the later sections.
1. Start ProBE on a CSP script, such as one of the supplied files. The figures shown here
are based on ‘examples/chapter01/chapter1.csp’. The ProBE launcher window should
appear (see Figure 1), with a list of the process definitions from the script.
You can supply ProBE with the script to load as a command line argument, or you can use
the Open command on the File menu once ProBE is running.
Figure 1: Launcher Window
2. Pick one of the processes from the list (‘B0’, say, if you’re using the suggested script) and
double-click on it. The explorer window should appear (see Figure 2) with the process in
its initial state, offering its initial events as start points in the tree (which are ‘a’ and ‘b’ if
you’re following the ‘B0’ example).
Note that if the process is parameterised then double-clicking on it in the launcher will only
copy it to the text box above the list, and not open the explorer window. Replace each ‘_’
with an appropriate parameter and then hit return to open the explorer window on the new
process.
Chapter 2: Quick Start
4
Figure 2: Explorer Window
3. Click on the arrow next to one of the events. It rotates and the next level of the tree (or
several levels, depending on the preference setting) will appear (see Figure 3). This unfolded
tree shows the state (or list of states) of the process after it has done the event which has
been unfolded. You can further explore these states by clicking on their arrows to see the
events that these states offer. A terminal state offers no events, and has no arrow.
The tree alternates between events and states; states are distinguished by having a blue
background. It is good practice to use a naming convention when writing scripts, such as
all lowercase for event names and (at least) an initial uppercase letter for process names.
Figure 3: An Explored Process
Clicking on the arrow of an unfolded tree folds up all levels below this point and the arrow
rotates back to point to the right again. The tree remembers the amount of unfolding that
had been done, so clicking on the arrow again will reveal all of the tree which was visible
beforehand.
4. Double-click on an event or state, and the tree will be re-rooted at that point to show the
list of subsequent states (in the case of an event) or initial events (in the case of a state).
Chapter 2: Quick Start
5
The display of circles (states) and arrows (events) changes to show the position that is now
being displayed. Figure 4, which is the same as Figure 3 except the root has been moved
to the most unfolded position, is an example of this. You can click on a circle or an arrow
to see what it represents (the text box updates with the process name or event name), or
double-click on one to root the tree at that point. Double-clicking on the first circle re-roots
the tree at the initial state of the process.
Figure 4: A New Root
5. With the tree rooted at some point other than the initial state, choose the View menu item
on the Trace menu. This shows the trace of events corresponding to the arrows. Using the
Copy menu item you can copy this trace to the clipboard (as plain text) for use in other
applications.
Figure 5: Trace View
Chapter 3: Reference
6
3 Reference
This chapter describes each of ProBE’s main windows in turn.
3.1 Launcher
The launcher window consists of a text entry area at the top into which expressions may be
entered, with a list of process terms given below.
Double-clicking on a list item copies it into the text entry area and, if the expression is
complete, launches an explorer or inspector on it. Incomplete expressions need to have values
supplied for each of their missing arguments (marked by a underscore symbol ‘_’) in the text
entry area.
Expressions may also be entered into the text entry area by hand. When the Enter key is
pressed either an explorer or inspector window is displayed. (Explorer windows are produced
for process terms and inspector windows for other values.) An error message is displayed if a
problem occurs while evaluating the expression.
Right-clicking on an item in the list displays a pop-up menu which allows the definition of
that item to be viewed.
3.1.1 Menu
File
Open
Opens a file dialog to load a new script.
Reload
Reloads the current script from disk.
View
Shows the currently loaded script.
Quit
Terminates ProBE.
Edit
Preferences
Set the default preferences for new explorer windows.
Help
About
Brief details about this version of ProBE.
3.1.2 Notes
Reload and View are only enabled once a script has been opened, either from the Open
command or by supplying the filename when starting ProBE from the command-line.
View opens a window displaying the text of the currently loaded script. The view is automatically updated if the file on disk changes. The corresponding launcher and explorer windows are
not updated and continue to operate on the version of the script which was originally loaded.
However, a ‘(!)’ symbol is inserted into the window title as a warning that the window in
question may not be current.
Only one view onto a script file can be active at any one time. If View is selected when the
script is present in an existing viewer, that viewer will be displayed instead.
Preferences sets the initial preferences for any new explorer windows. The Unfold unique
branches setting controls whether ProBE automatically unfolds branches in a hierarchy where
only a single choice is offered, and if so, how many consecutive such branches it unfolds.
About displays version information for ProBE, a copyright declaration and contact details
for Formal Systems (Europe) Ltd.
Chapter 3: Reference
7
3.2 Explorer
The explorer window is the most complex in ProBE. At the top is a trace of the history of the
process being explored, with circles representing processes and arrows the transitions between
them. The trace can be scrolled using the scrollbar below it if the trace is too long to fit in the
window.
Below the trace is a textural description of the currently selected item in the trace. Subexpressions can be selected and ‘rotated’ to display various parts of the description (as described
below) and ‘inspected’ to focus on their behaviour.
Below the description is the tree which displays the options available after the final node in
the trace as a branching tree view. Each branch can be expand and collapsed using the arrow to
its left. A branch without an arrow has no children (and so corresponds to STOP or OMEGA.)
Trace
Clicking on an element of the trace selects that element and updates the description.
Double-clicking truncates the trace to that point and updates both the description and the
tree, effectively retracting all decisions made after that point.
Description
Regions of the description can be selected either by dragging with the left mouse button,
or by using shift and the arrow keys. Once a region has been selected, several options become
available.
The right mouse button displays a pop-up menu with options Inspect, Rotate, Rotate back.
Inspect
creates a new inspector or explorer window on the selected region.
Rotate
replaces the region by the next natural presentation of that region.
Rotate back
replaces the region by the previous natural presentation of that region.
The middle button performs a Rotate and shift middle performs a Rotate back.
In all of these cases, if the selection does not correspond to a complete expression it will
be extended to the next outermost complete expression rather than performing the requested
operation. The user then needs to select the newly marked expression again to inspect or rotate
it.
Tree
Single-clicking on the symbol to the left of a branch will expand or collapse that branch as
appropriate.
Double-clicking on a branch itself will append the path to that branch to the trace, making
the branch the last and selected element of the trace. Any branches open below that branch in
the tree will be preserved.
Shift double-clicking on a branch creates a new explorer window with that branch with the
final element of the trace. This allows explorations to proceed in separate directions at the same
time.
Chapter 3: Reference
8
3.2.1 Menu
File
Close
Closes the explorer window.
Edit
Preferences
Set the preferences for this explorer.
Search
Event
Searches for an event matching a regular expression.
Stable
Searches for a stable state (one with no tau transitions.)
Copy
Copies the entire trace to the clipboard.
View
Presents the trace vertically in a new window.
Trace
3.2.2 Notes
Preferences sets the preferences for this explorer windows (the initial preferences are taken
from the settings on the launcher.) The Unfold unique branches setting controls whether ProBE
automatically unfolds branches in a hierarchy where only a single choice is offered, and if so,
how many consecutive such branches it unfolds.
Event searches (breadth-first) for an event matching a regular expression, starting the search
from the last node in the trace and limiting the total depth (in terms of events and processes) to
that specified in the dialog. The regular expression can use ‘?’ and ‘*’ to match any character
or string. Once a search has been started, progress is displayed in terms of the number of nodes
finished, the number of nodes still to consider and the current depth reached. The search can
be interrupted by pressing the Cancel button in the dialog.
If the search reaches the depth limit without matching the pattern, and some nodes remain
to be considered at further depth, then the limit is raised by one and the Continue button is
enabled. Selecting it will continue the search at one level deeper.
Stable searches (depth-first) for a process which has no tau-transitions (internal actions
resulting from hiding or non-determinism.) By default, the search does not try all branches: it
simply chooses a tau if one is available (which may fail to terminate if the process can diverge.)
The check box Try all branches in the dialog box will force other branches to be considered once
the specified depth has been reached.
If no stable state is found within the specified limit, and some nodes remain to be considered
at a greater depth, the continue button will be enabled and an alternate depth can be selected.
If either search succeeds, then the path is appended to the trace, with the description and
tree updated accordingly.
Copy copies all the events in the trace to the clipboard (they can then be pasted into other
applications.)
View presents the events in the trace in a vertical list, allowing a finer selection to be copied
to the clipboard.
Chapter 3: Reference
9
3.3 Inspector
When a non-process value is displayed, ProBE uses an inspector window to show a description
of the value which can be manipulated in exactly the same way as the description in the explorer
window (see Section 3.2.1 [Description], page 8).
3.4 Trace display
The trace display presents the events in a trace in a vertical list.
Close closes the window.
Copy copies the selected elements of the trace to the clipboard. (If no elements are selected,
the entire trace is copied.)
3.5 Viewer
The viewer displays the contents of a script file, either in response to the View command on
the launcher menu, or to a View definition command from the pop-up menu on the launcher
process list.
The view is automatically updated if the file on disk is changed.
Chapter 4: Technical Details
10
4 Technical Details
This chapter discusses some of the more technical aspects of ProBE. You should only need
to consult this chapter if you want to configure the screen display or adjust the operational
semantics used by ProBE.
4.1 Display font
The size and family of font used by ProBE in its windows can be configured by setting the
PROBESIZE and PROBEFONT environment variables (using ‘setenv’ or ‘export’ under UNIX and
‘set’ under Windows.)
The default value for PROBESIZE is 12, but larger values can be useful for demonstrations.
The default value for PROBEFONT is Helvetica. Which other fonts are supported depends
upon your system setup, but Times, Lucida and Courier are usually also available.
4.2 GUI style
By default, ProBE uses a style of GUI compatible with your operating-system (Motif under
Unix and Windows under Win32.) This can be altered using a command-line switch.
‘-style motif’ selects a Motif appearance.
‘-style windows’ selects a Windows appearance.
The effect is subtle, altering the way menu items are highlighted, the emphasis on default
buttons and the presentation of drop-down choice lists.
4.3 Operational semantics
By default, ProBE implements the operational semantics for CSP described in [Roscoe97].
This differs from earlier operational semantics in the handling of distributed termination. Earlier
semantics refuse to allow any component of a parallel network to terminate until all the components can. The current semantics allows termination of the components and uses a special
OMEGA term to control termination of the network as a whole.
The earlier semantics can be selected by providing a ‘-no-omega’ flag to ProBE at startup.
Chapter 5: Licence
11
5 Licence
Use of ProBE version 1.30 does not require the purchase of a registration key from Formal
Systems (Europe) Ltd.
ProBE is distributed under the following licence:
The program ProBE and its associated documentation is Copyright 1997
to 2003 Formal Systems (Europe) Ltd.
Hereafter Formal Systems (Europe) Ltd is identified as ’the author’
and the binary program ’ProBE’ and its associated documentation is
identified as ’the software’.
Use of the software for any purpose is subject to the following
licence and disclaimer of liabilities. In the event that you do not
accept the terms of either this licence or disclaimer of liabilities
then no permission exists from the author for you to use ProBE for any
purpose.
The author grants the reader of this licence a non-exclusive right to
execute the software in unmodified form for any purpose subject to the
following conditions and disclaimers of liability:
THE SOFTWARE IS PROVIDED BY THE FORMAL SYSTEMS (EUROPE) LTD. "AS IS"
AND ANY EXPRESS OR IMPLIED WARRANTIES, INCLUDING, BUT NOT LIMITED
TO, THE IMPLIED WARRANTIES OF MERCHANTABILITY AND FITNESS FOR A
PARTICULAR PURPOSE ARE DISCLAIMED. IN NO EVENT SHALL THE AUTHOR BE
LIABLE FOR ANY DIRECT, INDIRECT, INCIDENTAL, SPECIAL, EXEMPLARY, OR
CONSEQUENTIAL DAMAGES (INCLUDING, BUT NOT LIMITED TO, PROCUREMENT OF
SUBSTITUTE GOODS OR SERVICES; LOSS OF USE, DATA, OR PROFITS; OR
BUSINESS INTERRUPTION) HOWEVER CAUSED AND ON ANY THEORY OF
LIABILITY, WHETHER IN CONTRACT, STRICT LIABILITY, OR TORT (INCLUDING
NEGLIGENCE OR OTHERWISE) ARISING IN ANY WAY OUT OF THE USE OF THIS
SOFTWARE, EVEN IF ADVISED OF THE POSSIBILITY OF SUCH DAMAGE.
The name of the author may not be used to endorse results obtained
from the use of the software without specific prior written
permission.
Redistribution of the software to third parties and associated
documentation in unmodified form is permitted provided that the
following conditions are met:
1. The software must be redistributed as it was originally obtained
from the author. No changes to the software are permitted. No
files may be removed or added to the software.
Mere aggregation of the software with other data is expressly
permitted.
2. This licence must accompany any redistribution of the software.
Chapter 5: Licence
3. The software must be identified as being the product of Formal
Systems (Europe) Ltd.
12
Appendix A: Revision History
13
Appendix A Revision History
1.0
The first release of ProBE was in early October 1997 to coincide with the release of
[Roscoe97]. Versions before 1.0 were pre-release copies with limited circulation.
1.10
Changes from 1.0:
• View definition menu on launcher.
• Try all branches option in search for stable states.
• Local version of explorer preferences added.
• Corrected backtrace functionality when opening another explorer view.
1.15
Changes from 1.10:
• Use updated operational semantics from FDR2.24.
1.19
Changes from 1.15:
• Use updated operational semantics from FDR2.25. Fixes sequence to set conversion bug.
• Registration system added.
1.26
Changes from 1.25
• Move to gcc-2.95 and qt-1.42
• Precedence change in parsing of boolean guards.
1.27
Changes from 1.26
• Move to qt-2.1.1
1.30
Changes from 1.27
• Move to gcc-3.2 and qt-2.3.2
• Removed licencing restrictions
• Includes all changes in CSP parser up to 9 Jan 2003, including
• Removal of parser limits – this ProBE can parse very large CSP files
• Made both ‘|[ ]|’ and ‘[| |]’ valid syntax for the alphabetised parallel
operator
• Module system
Appendix B: Bibliography
14
Appendix B Bibliography
[Hoare85]
C.A. Hoare. Communicating Sequential Processes. Prentice-Hall International, Englewood Cliffs, New Jersey, 1985.
[Roscoe97] A.W. Roscoe. The Theory and Practice of Concurrency. Prentice-Hall, 1997.
[Scat95]
J.B. Scattergood. Tools for CSP and Timed CSP. D.Phil., Oxford University Computing Laboratory, September 1995.