1
Universität Stuttgart
Institut für Energiewirtschaft und Rationelle Energieanwendung
...
...
...
...
...
...
...
...
...
...
User’s Manual ....
...
...
...
...
...
...
...
...
...
...
...
Brazil/Latin America .....
.
Version 1.0 ..
EcoSense
IER
Acknowledgment
The implementation of the EcoSense software is based on the
methodological approach developed in the ExternE-Project on External
Costs of Energy, funded by the European Commission, DG XII, JOULE
Programme. The development of EcoSense would not have been possible
without the input of many experts involved in the ExternE project, including
Fintan Hurley (IOM), Mike Hornung (ITE), Mike Holland and Jacquie Berry
(ETSU), Nick Eyre (EEE), Anil Markandya (University of Bath), Ari Rabl
(ARMINES) and many others. The implementation of the EcoSense model in
Brazil/Latin America was supported by the International Atomic Energy
Agency.
The windrose trajectory model which is implemented in EcoSense is a
HTM-like atmospheric model (HTM = Harwell Trajectory Model,
developed by Derwent and co-workers at AEA Technology, Harwell
Laboratory, UK). It is configured to resemble results of a 1991 FORTRAN
version of HTM, but program design and implementation are quite different
from the FORTRAN HTM, and it contains no code written by AEA
Technology. Dr. Colin Johnson, at that time (1993) AEA Technology,
encouraged the use of the model by various ExternE teams, provided the
1991 FORTRAN version of the HTM, literature on the model, and a oneweek training on concepts and application of HTM at Harwell Laboratory.
He also approved that IER would develop a model interpreter based on the
windrose approach of HTM and give this interpreter to the public. Dr. David
Lee, AEA Technology, provided help on details of the chemical mechanism,
and approved that IER employs a HTM-like windrose trajectory model in the
EcoSense software for application in the ExternE project.
The emission inventory for Latin America was derived from the Emission
Database for Global Atmospheric Research (EDGAR), Version 2.0.
EcoSense has been developed within the Section of Technology Assessment
at the Department of Technology Assessment and Environment (TFU), IER,
with contributions from
Bert Droste-Franke, Thomas Heck, Wolfram Krewitt, Dirk Malthan, Petra
Mayerhofer, Frank Pattermann, Alfred Trukenmüller, Ralf Ungermann, and
Rainer Friedrich.
Head of the Department of Technology Assessment and Environment:
Prof. Rainer Friedrich
Head of the Section of Technology Assessment:
Dr. Wolfram Krewitt
Address of the institute:
Institute of Energy Economics and the Rational Use of Energy (IER)
University of Stuttgart
Hessbruehlstrasse 49a
D-70565 Stuttgart
Germany
Internet: http://www.ier.uni-stuttgart.de
University of Stuttgart 1999
Content
1
Introduction/General Remarks
1.1
1.2
1.3
1.4
1.5
2
Structure of the EcoSense system
Software used
Air quality modeling
Reference Environment Database
Structure of the Manual
Installation
2.1
2.2
1
2
3
4
4
5
7
Hardware requirement
Installation
7
7
3
The EcoSense Main Screen
9
4
The Database Interface
4.1
4.2
4.3
4.4
4.5
5
Pathway Analysis
5.1
5.2
5.3
6
Selector
Atmospheric Modeling
Impact Assessment Modules
The Report Manager
6.1
6.2
7
The Reference Technology Database
The Emission Scenario Manager
The Reference Environment Database
Exposure Response Functions
Monetary Values
Create and Edit an Aggregation Scheme
Create and Edit Impact Categories
Setup
7.1
7.2
7.3
7.4
Reference Technology Database input controller
Human health risk groups
Exchange Rates
Consumer Price Index
11
11
15
20
23
27
31
31
34
35
39
42
44
47
47
47
48
49
Introduction
1
1 INTRODUCTION/GENERAL REMARKS
EcoSense is an integrated computer system developed for the assessment of
environmental impacts and resulting external costs from electricity
generation systems and other industrial activities. Based on the impact
pathway approach established in the ExternE-Project on External Costs of
Energy funded by the European Commission, EcoSense provides relevant
data and models required for an integrated impact assessment related to
airborne pollutants.
The European version of the EcoSense model, which was developed under
the ExternE and GARP II (Green Accounting Research Project II) projects,
has been used successfully in a large number of research projects and policy
advise studies as a standard tool for the assessment of environmental
externalities in Europe. The implementation of the EcoSense package in
Brazil/Latin America is a first step to make the tools that support the well
established ExternE methodology applicable also in other regions of the
world. Compared to the European version, the implementation of EcoSense
Brazil/Latin America Version 1.0 led to a major revision of the underlying
database system (e.g. adaptation of the basic grid system, compilation of data
relevant for Brazil/Latin America), while the calculation procedure is
similar to the European version, and thus represents the ExternE
methodology. However, due to the limited availability of data, and also the
limited resources available for the implementation, EcoSense Brazil/Latin
America Version 1.0 does not completely cover the full functionality of the
European version. The present version provides data for Brazil in a rather
high spatial resolution, while for other countries only national average data
are available.
The development of EcoSense Brazil/Latin America was supported by the
International Atomic Energy Agency (IAEA) with the objective of linking the
assessment of environmental impacts and external costs from power
generation to the DECADES modeling framework developed by the IAEA.
2
EcoSense Brazil/Latin America User’s Manual
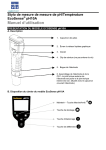
1.1 Structure of the EcoSense system
Figure 1-1 shows the general structure of the EcoSense system. The main
modules are
•
•
•
•
a database system comprising several sub-modules,
air transport models completely integrated into the system,
impact assessment modules, and
tools for the evaluation and presentation of results.
From a user's perspective, the structure of the system appears to be quite
different from the technical structure (see Figure 1-2). An important feature
of the system design was the strict separation between the database module
and the air transport modeling/impact assessment modules in order to
guarantee consistency among the various levels of data (input data,
intermediate results, final results). If for instance the user modifies the SO2emission factor of a facility specified in the reference technology database,
the system automatically deletes all related intermediate (e.g. results from air
transport modeling) and final results (e.g. physical impacts) from the
database.
Impact
ImpactAssessment
Assessment
Impact
ImpactAssessment
Assessment
Human
Humanhealth
health
Impact
ImpactAssessment
Assessment
Crops
Crops
reporting
technology
database
Materials
Materials
Impact
ImpactAssessment
Assessment
Ecosystems
Ecosystems
Air quality models
Monitor
reference
environment
database
- ISC
- WTM
- S-R Ozone model
doseresponse
functions
monetary
values
Figure 1-1 Modular structure of the EcoSense model (items printed in gray
are only available in the European version of EcoSense)
Introduction
Database
- Reference Technologies
- Reference Environment
- Exp.-Response Functions
- Monetary Values
Tools
Pathway Analysis
- Air Quality Modeling
- Impact Assessment
3
- Report Manager
- Met.-Dat. Import Routine
- Setup
se
en
S
o
Ec
Main Screen
Figure 1-2 The EcoSense modules from a user’s perspective
1.2 Software used
The following software has been used for the implementation of the
EcoSense system:
•
•
•
Microsoft Visual C++ 1.52 for Windows
Borland Paradox
Borland Paradox Engine
The use of a high level programming language in combination with a
relational database system seems to be an appropriate technical solution for
processing and managing large amounts of data required for impact
assessment. The Paradox Engine organizes the transfer of data between the
database tables and the C-Program.
4
EcoSense Brazil/Latin America User’s Manual
1.3 Air quality modeling
The Windrose Trajectory Model (WTM) included in the EcoSense package
is a user-configurable trajectory model based on the windrose approach of
the Harwell Trajectory Model developed at Harwell Laboratory, UK. For
current applications, the WTM is configured to resemble the atmospheric
chemistry of the Harwell Trajectory Model, other mechanisms can be
adopted as well.
1.4 Reference Environment Database
The reference environment database provides an emission inventory,
receptor data and meteorological data on administrative units (except of
meteorological data) to facilitate the user’s access to the data, and on a
regular grid system (gridded data are used as an input for air quality
modeling and impact assessment). The system automatically organizes the
transfer of data between administrative units and the grid system. The grid
system is based on geographical longitude and latitude with a gridcell size of
0.5o x 0.5o. The modeling domain covers an area from 33.5o West to 96o
West, and 42o South to 12o North.
In the Version 1.0 of EcoSense Brazil/Latin America, receptor data are
available for population, and the production of various crop types. The
database provides meteorological data (wind speed, wind direction,
precipitation) which are required by the Windrose Trajectory Model.
Table 1-1 Reference environment data included in the EcoSense database
Source
Receptor distribution
Population
Production of barley, potatoes,
FAO
sugar beets, wheat
Meteorological data
Wind speed
US NCAR
Wind direction
US NCAR
Precipitation
Global Precipitation Climatology Centre
(GPCC)
Emissions
SO2, NOx, NH3
Emission Database for Global
Atmospheric Research (EDGAR)
Introduction
5
1.5 Structure of the Manual
The EcoSense User’s Manual does not provide any information on
methodological aspects. For a full discussion of the methodological
framework the reader should refer to
European Commission, DG XII, Science, Research and Development,
JOULE. ExternE - Externalities of Energy. Volume 2 Methodology,
EUR 16521, 1995
and
European Commission, DG XII, Science, Research and Development,
JOULE. ExternE Externalities of Energy., Volume 7: Methodology
1998 update, EUR 19083, 1999.
A comprehensive set of reports produced within the ExternE project is
available at the ExternE homepage: http://ExternE.jrc.es/
The following sections give a description of how to use the EcoSense
system, following the logical way of doing a complete impact assessment
procedure, i. e.
-
installation,
specification of a power plant/emission scenario,
defining exposure response functions,
assigning monetary values to physical impact categories,
air transport modeling,
impact assessment, and
evaluation of results.
For a standard application, in which the user relies on predefined exposureresponse functions and monetary values, the sections 4.1 (Emission
database), 5 (Pathway Analysis), and 6 (Report Manger) are the most
relevant ones.
6
EcoSense Brazil/Latin America User’s Manual
Installation
7
2 INSTALLATION
2.1 Hardware requirement
EcoSense runs on an IBM-compatible PC with a 486 processor (or higher)
and with 32 bit MS-Windows. 8 MB RAM are required, and to install and
run the system you should have >85 MB free on your hard disk.
2.2 Installation
To install EcoSense Brazil/Latin America 1.0, insert the EcoSense CD into
your CD-ROM drive, and start ECOB1INS.EXE from Windows. The
installation program asks for a directory on your hard disk where EcoSense
will be installed. Enter a directory path and click the "Unzip" button. The
installation program copies all files and tables necessary to run EcoSense
except CTL3DV2.DLL. If CTL3DV2.DLL is not yet installed on your system,
copy the file CTL3DV2.DLL to your Windows System directory where
several other .DLL files may be located.
8
EcoSense Brazil/Latin America User’s Manual
The EcoSense Main Screen
9
3 THE ECOSENSE MAIN SCREEN
After starting the EcoSense system, the EcoSense main screen (further
referred to as the main screen) appears. You start any activity from the main
screen's menu. The menu structure is as follows:
• System
• Pathway Analysis
Start your impact pathway analysis (including
air transport modeling and impact assessment).
Note that you should have specified a power
plant or an emission scenario before in the database module.
• Database
• Emission Database
• Reference Technology Database
• New data
Define a new power plant
• Edit data: Edit data of a previously defined power plant
• Emission Scenario Manager
Define a new or edit an existing emission
scenario.
• Reference Environment Database
Edit receptor data (based on administrative
units).
• Exposure Response Functions
• Crops
Define/edit an exposure response function
• Human Health
Define/edit an exposure response function
• Monetary Values
Assign monetary values to impact categories
• Exit
Close the EcoSense System
• Tools
• Report Manger
Generate a report of the results
• Setup
• Reference Technology Database
• Tech. Data Min/Max
Define minimum and maximum values for
the input controller
• Reference Environment Database
• Risk Group Fractions
Specify the fraction of specific risk groups within
the total population
• Currency
• Exchange Rates
Specify exchange rates
• Consumer Price Index
Specify consumer price index
10
EcoSense Brazil/Latin America User’s Manual
The Database Interface
11
4 THE DATABASE INTERFACE
4.1 The Reference Technology Database
Open the Reference Technology database to define a new reference facility.
Select the items <System> <Database> <Reference Technology Database>
<New data> from the main screen's menu.
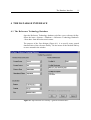
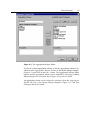
The purpose of the first dialogue (Figure 4-1) is to specify some general
characteristics of the reference facility. Use the mouse or the tab/shift-tab key
to move around in the window.
Figure 4-1 Specification of a facility’s general characteristics
12
EcoSense Brazil/Latin America User’s Manual
Technical Characterization
Specify the energy group, energy source, process step, operational phase and
mode of the facility by selecting one of the options offered in the list boxes.
Localization
Select the country from the Country List-Box, and write the facility's site into
the Site-Edit-field.
Facility Identification
Enter an alpha-numeric facility-identification flag (maximum 4 characters)
into the Facility Id edit-field. Although the program needs the facility-id for
internal use only, some of the temporary files use the facility-id as filename,
so that a descriptive filename is helpful. The program ensures that the Id is
unique.
Write an alpha-numeric short-name of the facility (maximum 32 characters)
into the Facility Shortname edit-field. The short name should be descriptive,
it is used in several other screens, mainly for the identification and selection
of the facility. The program ensures that the facility shortname is unique.
For the purpose of documentation, you might add (optional) a brief
description of the facility's main characteristics (maximum 255 characters).
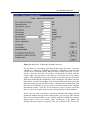
After clicking on the OK button, the dialogue with the technical data sheet
shown in Figure 4-2 appears. Fill in all the technical data you are asked for.
Use the mouse or the tab/shift-tab key to move around. The range of values
that is accepted by the system is defined in the EcoSense-Setup (see section
7.1). Clicking the OK button, the current data are stored in the Reference
Technology Database.
Note
The ISC model, which currently is included only in the European Version of
EcoSense, requires more data than the Windrose Trajectory Model. The data
fields that are related to the ISC model only are de-activated in the current
version.
The Database Interface
13
Figure 4-2 Reference Technology Database interface
To edit data of a previously specified facility select the items <System>
<Database> <Reference Technology Database> <Edit Data> from the main
screen's menu. Select the facility that you want to modify from the Facility
list-box. After the selection of a facility, all edit-fields are filled with the
current values. Use the mouse or the tab key to select the value you want to
modify. After editing this value, use the mouse or the tab key to go to the next
field, thus confirming the modification. After clicking the OK button, the new
data will be stored in the database, and all intermediate and final results that
depend on the previously modified value are deleted (after confirmation from
the user) in the database system to ensure consistency between the technical
data and the results. Click the Delete button to remove all data (technical
data as well as all results) related to the selected facility from the database.
In the case you want to perform a sensitivity analysis and change specific
parameters without loosing all the related results, you can copy the technical
data of the selected facility to a new facility and then modify the technical
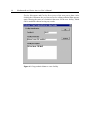
characteristics of the new facility. After clicking the Copy button, the
dialogue shown in Figure 4-3 pops up. The user is asked for the Facility Id,
14
EcoSense Brazil/Latin America User’s Manual
Facility Shortname and Facility Description of the new power plant. After
clicking the OK button, the previous screen for editing technical data appears
again, showing the same set of technical data now for the new facility, which
can be modified without loosing any results.
Figure 4-3 Copy technical data to a new facility
The Database Interface
15
4.2 The Emission Scenario Manager
The Emission Scenario Manager is a tool to set up new emission inventories
to be used as an input to air quality modeling and impact assessment. The
starting point for new emission scenarios is the so called ‘BRAZIL 90
Reference (EDGAR)’ inventory, which was derived from the world wide
emission inventory provided by the Emission Database for Global
Atmospheric Research (EDGAR) for the year 1990. The system provides
different ‘template scenarios’ that are based on the ‘BRAZIL 90 Reference
(EDGAR)’ inventory, and which should be used to create new emission
scenarios. The different template scenarios provide emission data on
different levels of aggregation with respect to administrative units and
industry sectors.
Based on the data format used in the EDGAR database, emission data are
available according to the following categorization of source sectors:
Table 4-1 Categorization of source sectors
Industry Sector
Level 1
Level2
1
2
3
4
5
5
5
5
10
10
10
10
10
11
11
11
11
11
1
4
8
1
2
3
4
1
4
6
7
Industry (excluding coke ovens, refineries, etc.)
Power generation (public and autoproduction; including
cogeneration)
Other transformation sectors (refineries, coke ovens, gas
works)
Residentials, commercials and other sectors
Transport (including international shipping)
Road
Rail, inland shipping, other/non-specified (land non-road)
International shipping
Land use and waste treatment
Agriculture
Animals (ruminant/waste)
Biomass burning
Waste treatment
Natural sources
Natural soils
Oceans
Wild animals
Human population
16
EcoSense Brazil/Latin America User’s Manual
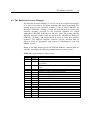
The system currently supports three different levels of administrative units
for Brazil (country, state, municipal), while for all other countries only
national average data are available.
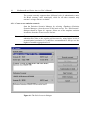
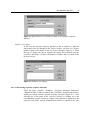
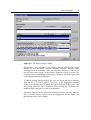
4.2.1 Create a new emission scenario
Start the Emission Scenario Manager by selecting <Database><Emission
Scenario Manager> from the menu of the main screen. The ‘Edit Scenario’
dialogue shown in Figure 4-1 appears. Select one of the template emission
inventories from the Scenario name list box.
Note
The computing time for the transformation of emission data from
administrative units to the regular grid increases by using higher levels of
sectoral/spatial resolution. It is therefore recommended to always use the
highest reasonable aggregation level.
Figure 4-1 The Edit Scenario dialogue
The Database Interface
17
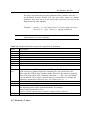
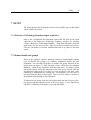
After selecting one of the template inventories, click the Copy Scenario
button to copy the emission data from the template inventory to a new
scenario. The dialogue shown in Figure 4-2 appears, asking the user for the
scenario identification code (maximum 4 characters) in the New Scenario ID
edit field, a scenario name in the New Scenario Name edit field, and
(optional) a brief description of the scenario in the Comment edit field. After
clicking the OK button, the previously selected template emission inventory
is stored under the new scenario name in the database. Go back to the Edit
Scenario dialogue by clicking on the Exit button, select the new defined
scenario by clicking on the new scenario name in the Scenario name list box,
and then click the Rescale Scenario button. Now the emission data for the
new emission scenario can be specified in the ‘Rescale Scenario’ dialogue
(Figure 4-3).
Figure 4-2 Specification of the new scenario name
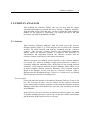
In the Rescale Scenario dialogue, select the pollutant to be modified from the
Pollutant list box. The system differs between ‘high’ emission sources (stack
height > 100 m) and ‘low’ emission sources (stack height < 100 m), as
emissions from ‘low’ and ‘high’ stacks are treated differently in the
Windrose Trajectory Model.
18
EcoSense Brazil/Latin America User’s Manual
Figure 4-3 Definition of new emission scenarios. Example 1: Additional
SO2-emissions in the municipal of Candiota, Rio Grande do Sul, Brazil, due
to new power capacity. Example 2: Reduction of NOx-emissions from road
transport in Colombia by 10%.
The Database Interface
19
The user can now successively select the administrative units (Region list
boxes) and the source sectors (Sector list boxes) to be modified. The number
in the Reference Value text field gives the annual emissions from the selected
region/sector combination in the original ‘BRAZIL 90 Reference (EDGAR)’.
To change this value, the user can either write a new absolute number into
the Scenario Value edit field, or use the up/down buttons of the Rescaling
field to specify the new amount of annual emissions as a given percentage of
the Reference Value. After confirming the new value by clicking on the
Accept button, the user might select further region/sector combinations to
modify emission data for the same pollutant. Before selecting another
pollutant in the Pollutant list box, click on the Save button to write the
modified emission data to the database. After saving data for one pollutant,
the user might modify emission data for other pollutants within the same
scenario. The definition of a new emission scenario is finished by clicking
the Exit button, the system goes back to the Edit Scenario dialogue (Figure
4-1) dialogue.
Before using the new emission scenario as an input to air quality modeling
and subsequent impact assessment, the new emission data have to be
transferred from the administrative units to the regular grid system. Start the
transformation procedure by selecting the scenario in the Scenario name list
box, and then click the Transformation to Grids button. Note that the
transformation is a complex task which needs some computing time!
A scenario can be deleted by selecting it from the Scenario name list box,
and then click on the Delete Scenario button. The system deletes several
database tables related to the selected scenario from the database.
Return to the main menu by clicking on the Cancel button.
Note
The EDGAR database does not provide any emission data for particles. To
allow the re-scaling of particle emissions (which is not possible for ‘zero’emissions), the ‘low’ and ‘high’ particle emissions in each country are set to
1E-18.
20
EcoSense Brazil/Latin America User’s Manual
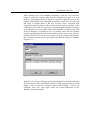
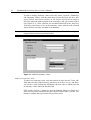
4.3 The Reference Environment Database
The Reference Environment Database interface supports the display and
editing of receptor data according to administrative units. The module
organises the transfer of data between administrative units and the grid
system.
Select the items <System> <Database> <Reference Environment Database>
<Edit data> from the main screen’s menu. In the dialog box shown in Figure
4-1, select the receptor to be edited from the Receptor-list box. After
selecting a receptor, a list of all ‘NUTS 0’ administrative units (countries)
appears in the NUTS 0-list box. Select the adminstrative unit you want to edit
by stepwise clicking through the NUTS 0, NUTS 1, and NUTS 2 - list boxes.
After confirming the selection by clicking the OK-button, the dialogue shown
in Figure 4-2 appears, which –as far as applicable - contains a list of
subregions of the region selected in the previous dialog box. In this dialog
you can edit the numerical value for each subregion.
Figure 4-1 Reference Environment Database Dialog box 1.
The Database Interface
21
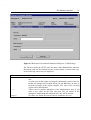
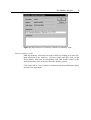
Figure 4-2 Reference Environment Database Dialog box 2 (Edit dialog).
The lists box shows the NUTS code, the name of the administrative unit and
the current value for the selected receptor. In the column „Current value“ one
of the following entries may be displayed:
Current value
(a number)
..
-->
(empty)
Meaning
A value exists already in the database for exactly this administrative
unit
A value exists in the region covering all administrative units in the list.
In this case changes are accepted only if you edit all entries in order to
keep the coverage of the region complete. The value of the covering
region will be deleted then.
Values exist in smaller subregions of the administrative unit. If you
enter a new value for this line and push OK, all entries in the
subregions subdividing this administrative unit will be deleted.
No value was found, the current value is assumed to be zero.
22
EcoSense Brazil/Latin America User’s Manual
Select the administrative unit you wish to edit and enter a new value and a
new reference string into the edit boxes below. After clicking the OK- button,
all changes are stored in the database and the input is transformed to the grid
system. The calculation of the grid transformation may take some time.
Note
You can edit values on any NUTS level you want. But the way down to
smaller regions must be taken step by step. For example, if the current
database has one entry on NUTS level 0 (i.e. one value for the whole of the
country) you cannot enter new values for NUTS level 3 (the finest
resolution). Instead, first you have to give values for NUTS level 1, then
NUTS level 2, then NUTS level 3. This is because the program always
expects a unique coverage for the countries.
Be careful when editing a field with the sign „- - >“. This sign indicates that
values for the region exist already in subregions. If you enter a new value for
this line, all entries in the subregions will be deleted.
The Database Interface
23
4.4 Exposure Response Functions
4.4.1 Add a new exposure response function
To define a new exposure response function, select the items <System>
<Database> <Exposure Response Function> <Human Health> (or other
receptors), and <New Data> from the main menu, leading to the screen
shown in Figure 4-1. Use the Receptor sub-group list-box, Impact list-box
and Pollutant list-box to specify the receptor sub-group (e.g. children,
asthmatics), the impact and the pollutant the new exposure response function
refers to by clicking on one of the items in each list-box.
Use the edit-field to enter the exposure response function as a mathematical
expression. The Constant/Variables list-box provides a list of constants and
variables for which numerical values are available in the system and thus can
be used to build up the exposure response function. To get some information
on units etc. of the constants and variables offered in the list-box, click on the
Explain-button after selecting on of the items in the Constants/Variables listbox. Items from the list-box are copied into the edit-field by clicking on the
Select-button.
Besides of the basic mathematical operations (+,-,*,/), a set of mathematical
functions listed in the Math. Functions list-box is supported. Click on a
function in the list-box to copy it into the edit-field, and insert text between
the brackets. Click the Accept-button to confirm the exposure response
function after writing it into the edit field. The syntax of the function is
checked, and in the case of syntax errors an error message appears.
Low, mid and high estimate
To take into account information on confidence intervals for calculating a
possible range of results, the user can define three different functions
representing a low, mid and high estimate. Click the low, mid or high radiobutton before writing the respective function into the edit-field.
Define a threshold
To define an exposure response function with threshold (i.e. no effects at
concentrations below the threshold), click the Threshold check-box at the
bottom of the screen and enter the numerical value into the related edit-field.
Note that you can define a single threshold value only for a set of related
low/mid/high functions.
24
EcoSense Brazil/Latin America User’s Manual
Figure 4-1 Add a new exposure response function
Note
Clicking one of the low/mid/high radio buttons before you terminate the
editing of a function by clicking the Accept-button leads to a loss of the
current content of the edit-field.
The current version requires the definition of a function for the low, mid and
high case. If you want to work with a single function only, save the same
function as a low, mid and high function. (Use the Windows clipboard
functions to copy a function: mark the expression you want to copy with the
mouse (left button down), press the <Ctrl> and <Ins> keys to copy the
expression into the clipboard, click the low, mid or high radio-button, click
the edit field to make it active and then press the <Shft> and <Ins> keys to
copy the expression from the clipboard into the edit-field.)
Reference
Click on the Reference-button to open the Function Reference dialogue
(Figure 4-2). Enter the reference and comments into the respective editfields. Click the OK-button to confirm and to go back to the previous screen.
Note that the reference entry is used for the identification of the exposure
response function in various list-boxes in other modules of the system.
The Database Interface
25
Figure 4-2 Specification of a reference related to an exposure-response
function
Define a new impact
In the case the exposure response function to add is related to a physical
impact that is not yet included in the Impact list-box, click the New Impact
button to define a new impact in the New Impact dialogue (Figure 4-3). Enter
the type of impact, the unit to measure the impact and comments into the
respective edit-fields. Click the OK-button to confirm and to go back to the
previous screen.
Figure 4-3 Define a new impact
4.4.2 Edit existing exposure response functions
Select the items <System> <Database> <Exposure Response Functions>
<Human Health> (or other receptors) and <Edit Data> from the main menu to
modify previously defined exposure response functions (Figure 4-1). After
selecting one of the items in the Function list-box by clicking on it, the
corresponding receptor sub-group, impact, and pollutant is displayed in the
respective text-fields, and the mathematical function is shown in the edit-
26
EcoSense Brazil/Latin America User’s Manual
field. Delete the function by clicking on the Delete-button, or edit the
mathematical expression in the edit field. Editing a function is similar to the
procedure of defining a new exposure response function described above.
After confirming the modifications by clicking the OK-button, all
intermediate and final results related to the modified or deleted function are
deleted from the database system.
Figure 4-1 Edit a previously defined exposure-response function
4.4.3 Standard functions and Operators in EcoSense Formulas
You can define your own functions at the beginning of the formula. An
expression may be preceded by one or more definitions like
{ funcname(parameter,...) = subst_expression }
Funcname and each parameter must not be defined yet. You cannot define a
function that starts with a known name. "expe(x)" will cause an error at the
`e', since "exp" is a predefined function. Any character is allowed except of
"(),+*-/;" and white space. Avoid characters other than A-Z, a-z, 0-9, and _
(underscore).
Parameters are separated by commas. The list may be empty, but the
surrounding parentheses are still necessary.
The Database Interface
27
The subst_expression may use these parameters like variables. After the `}',
all parameters become invalid. You can reuse these names for another
definition. From now on up to the end of this expression you can use the
function like any other function.
Examples: { invert ( x ) = if x=0 then 0 else 1/x } invert ( max(1.5,Conc) )
{ f(x)=x*x+1 } { g(x) = f(f(x))-1 } f(g(g(g(Variable))))
Note
A function definition does not increase evaluation speed. This feature is
implemented to increase readability.
Table 4-1: Standard functions and operators supported by EcoSense
Name
+-*/
^
Sqrt()
Sqr()
Ln()
Log10()
Exp()
Relative(,
)
If then
else
Min(,)
Max(,)
Theta()
Range(,,)
Description
Addition,Subtraction,Multiplication,Division with standard rules
Power. Associativity: a^b^c = (a^b)^c, a*b^c = a*(b^c)
Square root
Square sqr(x)=x^2
Natural logarithm, ln, is the logarithm with base exp(1) = 2.71828..
Logarithm with base 10
Exponential function
Relative deviation from x due to y. relative(x,y) = (x-y) / y
A special function is "IF expr <|=|> expr THEN expr ELSE expr".
Each expr may be another expression, including IF's. The result is the value
of the expr after THEN, if the condition holds. Otherwise, the function returns the
value of the expr after ELSE. Conditions other than <, =, and > are not available.
Use parentheses, if you want to continue after an if-expression. For example the
following construction is allowed: sqrt ( if x>0 then x else -x ) - 1
Minimum of the two arguments
Maximum of the two arguments
Heaviside function. theta(x) means: if x>=0 then 1 else 0.
This function can be used to include thresholds, for example
„theta(TotalConcentration-0.2)*x“
yields x if TotalConcentration exceeds 0.2, otherwise the result is 0.
range(x,a,b) means: if x in interval [a,b] then 1 else 0.
4.5 Monetary Values
28
EcoSense Brazil/Latin America User’s Manual
To add or modify monetary values select the items <System> <Database>
and <Monetary Values> from the main menu. Use the Receptor list-box, Subgroup list-box and Impact list-box in the Impact Specification panel to
select the physical impact related to the monetary value you want to add or
edit (Figure 4-1). After selection, the left-hand edit-field in the Monetary
Valuation panel shows a list of the monetary values related to the selected
impact that are currently available in the database.
Note
Monetary values can be defined only for impacts for which an exposure
response function has been defined before.
Figure 4-1 Add/edit monetary values
Add a new monetary value
To add a new monetary value, enter the numerical value into the Value editfield and select the related currency and base year in the Currency and Baseyear list box. After clicking the Add-button, the new value is added to the list
of monetary values shown in the edit-field.
Click on the Reference- button to open the dialogue shown in Figure 4-2.
Enter reference and comments into the respective edit-fields. Click the OKbutton to confirm and to go back to the previous screen.
The Database Interface
29
Figure 4-2 Specification of a reference related to a monetary value
Delete a monetary value
Mark the monetary value that you want to delete by clicking on it in the lefthand edit-field of the Monetary Valuation panel and then click on the
Delete-button. Note that all intermediate and final results related to the
deleted monetary value are deleted from the database system.
Click on the OK or Cancel button to confirm/cancel the modifications and to
go back to the main menu.
30
EcoSense Brazil/Latin America User’s Manual
Pathway Analysis
31
5 PATHWAY ANALYSIS
After defining the reference facility, the user can now start the impact
assessment procedure by selecting the items <System> <Pathway Analysis>
from the main screen. Note that once you have started the impact pathway
module, for the purpose of consistency, you cannot edit any of the data
previously specified in the database module.
5.1 Selector
After selecting <Pathway Analysis> from the main screen, the Selector
dialogue appears (Figure 5-1). In the Selector, the user selects the ‘emission
scenario’ for which external costs shall be calculated, and the ‘reference
scenario’. The reference scenario specifies the background conditions
against which the emission scenario is compared. The difference in
concentration and deposition between the emission scenario and the
reference scenario is the basis for the impact assessment.
Emission scenarios are defined via the interface to the emission database
(see section 4.1), either by defining a single power plant (the ‘scenario’ is
created by adding the emissions from a point source to an existing emission
inventory), or by using the Emission Scenario Manager which allows to set
up more complex emission scenarios. Basically, every emission scenario
stored in the database can be used also as a reference scenario. (This is
different from the EcoSense Europe Version 2.0, which uses a pre-defined
default reference scenario as a background.)
Scenario panel
Choose the emission scenario to be analyzed from the Emission Scenario list
box. The Emission Scenario list box shows all the emission scenarios
(power plants and/or complex scenarios created with the Emission Scenario
Manager) which have been defined in a previous step, and which are stored
in the database.
In the Reference Scenario list box all emission scenarios appear for which
air quality modeling has been carried out, so that the related concentration
and deposition fields can be used as a reference.
32
EcoSense Brazil/Latin America User’s Manual
Figure 5-1 The Selector dialogue
Scenarios for total assessment panel
A selected emission scenario/reference scenario combination can be added
to the list of Scenarios for total assessment by clicking on the Add Scenario
button in the Emission Scenario panel. The ‘total assessment’ feature allows
the user to carry out a full impact assessment automatically for several
emission scenario/reference scenario combinations (see below). Scenarios
can be removed from the list by using the Remove selected or Remove all
buttons.
Impact Assessment panel
The user specifies which impacts are evaluated in the Receptor list box. In
the current version the impact pathways related to human health and crop
losses are supported. The item ‘All pathways’ in the list box can be used to
evaluate ‘all’ pathways (i.e. human health and crops) automatically in the
total assessment mode (see below).
The currency and the related base year in which external costs will be
presented are specified in the Currency and Base Year list boxes. (Ensure
that exchange rate and consumer price index for the selected currency/base
year combination is available in the database. If not, add relevant data to the
Pathway Analysis
33
database by using the interface available under the <Setup><Currency> menu
from the main screen (see sections 7.3 and 7.4).
According to the status of the Impact per Year and Impact per kWh radio
buttons, impacts and external costs are calculated as impacts per year, or as
impacts per kWh (The calculation of impacts per kWh are not possible for
emission scenarios defined with the Emission Scenario Manager.)
If the Calculation Country by Country check box is checked, the system
calculates the impacts in each individual country within the modeling domain
in addition to the total impacts. Note that this mode significantly increases the
space requirement for writing results to the hard disk.
Air Quality Modelling button
Clicking on the Air Quality Modelling button starts the Windrose Trajectory
Model for the emission scenario selected in the Emission Scenario list box.
(It is not possible to automatically start consecutive WTM runs for several
scenarios.)
Impact Assessment button
Clicking on the Impact Assessment button starts the selected impact
assessment module (see section 5.3). In the impact assessment module, the
user can evaluate individual dose-response functions, has access to
intermediate results and maps showing e.g. concentration fields. The Impact
Assessment button is de-activated if the ‘All Pathways’ is selected in the
Receptor list box.
Total Assessment button
The Total Assessment button is active only if
-
-
at least one emission scenario/reference scenario combination is added
to the list of scenarios for total assessment, and
‘All Pathways’ is selected in the Receptor list box.
In the ‘Total Assessment’ mode, the impact assessment modules (human
health and crops) consecutively run in the background for all emission
scenario/reference scenario combinations previously added to the list of
Scenarios for total assessment. The system automatically calculates impacts
and external costs for all dose-response functions and monetary values
available in the database, and writes results into the database. The ‘Total
Assessment’ mode allows to evaluate several scenarios without any actions
required from the user.
34
EcoSense Brazil/Latin America User’s Manual
5.2 Atmospheric Modeling
In contrast to the European version of EcoSense, the version 1.0 of
EcoSense Brazil/Latin America includes only the Windrose Trajectory
Model for air quality modeling. As a consequence, there is no extra dialogue
required to operate different air quality models in this version. The Windrose
Trajectory Model and the relevant pre- and postprocessors are directly
started from the ‘Selector’ dialogue by clicking on the Air Quality Modelling
button (see section 5.1).
Pathway Analysis
35
5.3 Impact Assessment Modules
In the following, only the human health impact pathway is described in detail.
Other impact pathways have a similar structure.
The impact assessment module offers two different approaches:
-
-
A step-by-step analysis for each single combination of pollutant and
exposure-response relationship, with the possibility of presenting
detailed intermediate results (e.g. maps showing incremental air
pollution concentrations).
A Full Assessment Procedure performing an automised impact
assessment of selected combinations of pollutant/exposure-effect
relationships.
5.3.1 Step-by-step analysis
The dialogue (Figure 5-1) is organized according to the logical structure of
the impact pathway (environmental burden, air quality modeling, impact
assessment, valuation) .
36
EcoSense Brazil/Latin America User’s Manual
Figure 5-1 The Human Health Impact Pathway dialogue
Activity panel
Select the pollutant to be analyzed in the pollutant list-box.
Note
Only pollutants, for which both exposure-response functions and air transport
modeling results are available in the database are included in the list.
Ambient Air Concentration panel
The Range of Analysis boxes indicate whether results from air transport
modeling are available on the local or/and the regional range (box checked =
data available). As version 1.0 of EcoSense Brazil/Latin America does not
include a detailed local air quality model, the ‘local’ check box is not active.
By clicking on one of the map buttons, you can display the background
concentration as well as the increment in concentration of the previously
selected pollutant.
Note
The map buttons are only active after performing at least one impact
assessment calculation (the system loads the relevant data into memory for
calculation only).
No data on background concentrations for particulates are currently available
in the database.
Impact Assessment panel
Select an exposure-response function from the Exp.-response function list
box. Only functions related to the previously selected pollutant are included
in the list. Click the Calc button to start the physical impact quantification.
Valuation panel
Select a monetary value from the list box. Only monetary values related to
the impact specified by the previously selected exp.-response function are
included in the list. Click the Calc button to start the calculation of costs.
Note
After specifying the exp.-response function, you can immediately select a
monetary value in the Valuation panel and then start the calculation of both
physical impacts and economic damage at the same time by clicking the Calc
button in the Valuation panel.
Use the <Save> item from the menu to save the current results to the
database.
Pathway Analysis
37
5.3.2 Full Assessment procedure
While the step-by-step analysis described above provides a high degree of
transparency, it is not very comfortable to carry out a full fuel cycle
evaluation. Thus, the Full Assessment procedure has been implemented,
allowing a more automised analysis of impacts. Start the Full Assessment
procedure by selecting the <Full Assessment> item from the menu (Figure
5-1).
Figure 5-1 The Full Assessment dialogue
In the pollutant field a list of pollutants for which exp.-response functions
and air transport modeling results are available is displayed. Select those
pollutants that you wish to include in your full assessment by clicking on
them with the mouse. Confirm the selection by clicking the Accept button.
After clicking the Accept button of the pollutant field, a list of exp.-response
functions related to the selected pollutants is displayed in the Exposure
Response Function field. Select those functions that you want to include in
your full assessment by clicking on them with the mouse. Confirm the
selection by clicking the Accept button. Note that the structure of the database
system allows results to be stored only with one monetary value for each of
the possible exposure-response functions. Thus, immediately after selecting
one of the exposure-response functions, the Monetary Value field becomes
active and you have to select one of the related monetary values.
38
EcoSense Brazil/Latin America User’s Manual
The Full Assessment procedure automatically saves results to the database.
In the case you have not checked the Replace current results box, you are
asked for each single result before overwriting existing results from previous
model runs. Click the OK button to start the calculation of physical impacts
and economic damages.
Report Manager
39
6 THE REPORT MANAGER
EcoSense supports the evaluation of results by generating two different types
of reports:
-
an ASCII text file in a ‘readable’ format with the extension .rpt, and
an ASCII file pre-formatted for import into spreadsheet programs like
Microsoft-Excel with the extension .tab.
Select the <Tools> < Report Manger> items from the main screen's menu to
start the report manager (Figure 6-1).
Note
You can generate a report only if you have performed an impact pathway
analysis and saved results to the database before.
Results are presented in the report according to a user-defined ‘aggregation
scheme’. As in most cases the user is interested in aggregated information
rather than in detailed results for all impact indicators, the use of the
aggregation scheme helps to present results on the level of aggregation
required. The aggregation scheme defines for which impacts and impact
categories aggregated results are presented in the report.
Report Specification panel
In the Report Specification panel the user specifies for which emission
scenario a report is generated, and how results are presented. The emission
scenario/reference scenario combination for which a report shall be
generated is selected in the Emission Scenario and Reference Scenario list
boxes. Only those scenario combinations appear in the list boxes for which
results are available in the database.
The selection of an aggregation scheme in the Aggregation Scheme list box
specifies the way how results are presented in the report. By selecting a
currency and the related base year in the Currency and Base-Year list boxes,
the user specifies the currency in which monetary values are reported.
To present impacts and external costs occurring within individual countries,
click on the Individual Countries radio button, and select the countries to be
included in the report from the list box. The report will present results for
individual countries in addition to the total impacts/external costs. If the All
40
EcoSense Brazil/Latin America User’s Manual
Countries radio button is checked, only the total impacts/external costs
occurring in the whole modeling area are reported.
Note
The reporting of results for individual countries is possible only if the impact
assessment was carried out in the ‘Calculation Country by Country’ mode
(see Selector, section 5.1).
As in Version 1.0 of EcoSense Brazil/Latin America only the Windrose
Trajectory Model is included for air quality modeling, results are presented
only on the ‘regional’ scale (which includes the ‘local’ impacts!), so that the
separate presentation of local or global impacts is not supported.
The low, mid or high estimates of the results are included in the report if the
related Low-, Mid- and High-Estimate check boxes are checked. The low,
mid and high values refer to the respective low, mid and high estimates of the
exposure-response functions (see section 4.4).
Depending on the calculation mode under which the impact assessment was
carried out, results might be available for different reference units (e.g.
impacts per year or impacts per kWh). In such a case the user should select
one of the options to be considered in the report by checking the relevant
radio button.
Options panel
The Options panel provides some further options to format the report:
-
-
-
Impacts and resulting external costs are reported for every individual
exposure-response function that was included in the impact assessment if
the Detailed Results check box is checked
A summary of aggregated results for the impact categories defined in the
selected aggregation scheme is included in the report if the Aggregation
by Impact Category check box is checked.
A summary of aggregated results for the impact categories defined in the
selected aggregation scheme is included for the individual countries
selected in the Individual Countries list box in the report if the Agg.
Damages of Ind. Countries check box is checked. (This check box
becomes visible only if a country has been selected previously.)
Report Manager
41
Figure 6-1 The Report Manager dialogue
Output Files panel
In the Output Files panel the user specifies the names of the report files, and
the directory to which the reports are written. As a default, the system uses a
combination of the (maximum 4-character) identification of the emission
scenario, and the (maximum 4-character) identification of the reference
scenario to build the filenames. The filenames might be modified by the user.
Use the Directories and Drives list-boxes to specify the directory to which
the reports are written. The default directory is the ...\reports
directory.
Click on the Generate Report button to start the generation of the report. By
clicking the View buttons, you can directly browse or print the report files
after generating them.
42
EcoSense Brazil/Latin America User’s Manual
6.1 Create and Edit an Aggregation Scheme
Click on the New... button in the Report Specification panel of the Report
Manger dialogue to start the definition of a new aggregation scheme. The
dialogue shown in Figure 6-1 appears. Enter a name for the new aggregation
scheme, and (optional) a brief description of the scheme. To copy impact
categories from an existing scheme into the new scheme check the Copy
impact categories from existing scheme check box. This might simplify the
definition of a new scheme.
Figure 6-1: Definition of a new aggregation scheme
After clicking the OK button, the Aggregation Scheme Editor pops up (Figure
6-2). The list of Available Impact Categories on the right hand side of the
dialogue shows all the impact categories that have been defined earlier and
thus can be used to build up a new aggregation scheme (for the creation of a
new impact category see section 6.2). Use the arrow buttons to copy impact
categories to the list of Impact Categories Included on the left hand side of
the dialogue. The impact categories that are listed under the Impact
Categories Included are elements of the new aggregation scheme. Click on
the OK button to confirm the selection and finish the definition of the
aggregation scheme.
Report Manager
43
Figure 6-2: The Aggregation Scheme Editor
To edit an existing aggregation scheme, select the aggregation scheme to be
edited from the Aggregation Scheme list box of the Report Manger dialogue
(Figure 6-1), and click on the Edit... button. The Aggregation Scheme Editor
appears, and the aggregation scheme can be modified by removing or adding
impact categories to or from the list of Impact Categories Included.
An aggregation scheme can be deleted by selecting it from the Aggregation
Scheme list box of the Report Manger dialogue (Figure 6-1), and then
clicking on the Delete button.
44
EcoSense Brazil/Latin America User’s Manual
6.2 Create and Edit Impact Categories
The impact categories are the basic elements of an aggregation scheme. The
impact category is the level on which individual impacts are aggregated to a
single number. A new impact category can be defined by clicking on the New
button in the Aggregation Scheme Editor (Figure 6-2). The dialogue shown in
Figure 6-1 pops up, asking for the name and (optional) a description of the
new impact category. Like in the case of aggregation schemes, it is possible
to copy data from existing impact categories by checking the Copy impact
data from existing category check box to simplify the definition of a new
category.
Figure 6-1: Definition of a new impact category
After clicking the OK button, the Impact Category Editor (Figure 6-2)
appears. The user consecutively selects the receptor, the pollutants, the
exposure-response functions and monetary values that shall be included in
the new impact category by clicking on the entries in the respective list
boxes. After selecting a receptor in the Receptor list box, and confirming the
selection by clicking the Accept button, the Pollutant list box is filled with
those pollutants available in the exposure-response database that are linked
to the selected receptor. After selecting pollutants from the list, and
confirming the selection by clicking on the Accept button, the ExposureResponse Function list box shows all the exposure response functions
available in the database that are related to the selected receptor and the
selected pollutants.
Immediately after selecting one of the exposure response functions from the
list by clicking on it, the Monetary Value list box becomes active, showing
Report Manager
45
Figure 6-2: The Impact Category Editor
the monetary values available in the database that are related to the impact
defined by the previously selected exposure response function. After
selecting one of the monetary values, the Exposure-Response Function list
box becomes active again, so that further functions can be selected. The
selection process is finished by clicking the OK button, the system goes back
to the Aggregation Scheme Manager.
To edit an existing impact category, the user first selects the impact category
from the list of Available Impact Categories in the Aggregation Scheme
Editor. After clicking the Edit button the Impact Category Editor opens, and
the existing selections can be modified. After clicking the OK button, the
modified impact category is saved to the database.
An impact category can be deleted by selecting the impact category from the
list of Available Impact Categories in the Aggregation Scheme Editor, and
then clicking on the Delete button.
46
EcoSense Brazil/Latin America User’s Manual
Setup
47
7 SETUP
The Setup option in the main menu can be used to modify some of the default
values used by the system.
7.1 Reference Technology Database input controller
Open a list of minimum and maximum values that are used by the input
controller of the Reference Technology Database interface by selecting
<Setup> <Reference Technology Database> <Tech. Data Min/Max> from the
main menu. Use the mouse or the <Tab> key to move around in the screen.
Click the OK-button to confirm modifications and to go back to the main
screen.
7.2 Human health risk groups
Some of the exposure response functions related to human health impacts
refer to specific risk groups (e.g. children, asthmatics) within the total
population. You can add risk groups or modify risk group fractions in the
screen shown in Figure 7-1 after selecting <Setup> <Reference Environment
Database> <Risk Group Fractions> from the main menu. To change a given
risk group fraction, select the risk group in the Risk group list-box and edit
the numerical value in the Percentage of total population edit-field. After
confirming a modification by clicking the Accept-button, you can select a
new item from the Risk group list-box. The set of new values is written to
the database after clicking on the OK-button.
To add a new risk group, write the risk group's name into the Risk group listbox and specify the numerical value in the Percentage of total population
edit field. Confirm by clicking the Accept and OK-button.
48
EcoSense Brazil/Latin America User’s Manual
Figure 7-1 Add/edit risk group fractions within the total population
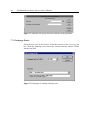
7.3 Exchange Rates
Select the base year in the list box. Select the currency in the Currency list
box. Write the exchange rate between the selected currency and the EURO
into the text field.
Figure 7-1: Dialogue for editing exchange rates
Setup
49
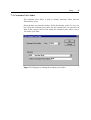
7.4 Consumer Price Index
The consumer price index is used to transfer monetary values between
different base years.
Select the base year from the list box. Select the currency in the Currency list
box. Write the consumer price index for the selected base year into the text
field. In the current version of the model, the consumer price index is set to
100 for the year 2000.
Figure 7-1: Dialogue for editing the consumer price index


![[R]évolution énergétique](http://vs1.manualzilla.com/store/data/006505877_1-9a68e3b94b746560087ea7608196d13a-150x150.png)


![[R]évolution énergétique](http://vs1.manualzilla.com/store/data/006428010_1-7d13a368cc3d3cf870c8252f3dab4fe4-150x150.png)