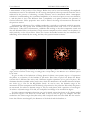
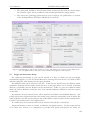
1
E U R O P E A N S O U T H E R N O B S E R V A T ORY Organisation Européenne pour des Recherches Astronomiques dans l'Hémisphère Austral Europäische Organisation für astronomische Forschung in der südlichen Hemisphäre VERY LARGE TELESCOPE NACO User Manual Doc. No.: VLT-MAN-ESO-14200-2761 Issue: 97.0 Date: 30.07.2015 Prepared: E. Pompei, J. Smoker and the Instrument Operations Team* 30/07/2015 Name Approved: Date Signature Date Signature A. Kaufer NameA. * Signature S. Mieske Name Released: Date and the former member / Instrument Scientists: D. Mawet, P. Amico, N. Ageorges, C. Lidman, J. Girard User’s Manual VLT-MAN-ESO-14200-2761 CHANGE RECORD ISSUE DATE First issue 82.1 31/7/2001 26/2/2008 SECTIONS AFFECTED all all 82.2 27/7/08 All 83.1 03/08/08 83.2 06/10/08 2 5.6 5.10 6.8 10 All All 83.3 83.4 09/10/08 23/10/08 All 2 5.8 83.5 08/03/09 85.0 12/09/2009 5.7 5.5 7.1.2 7.3.8 7.10 all 86.0 26/02/2010 all 87.0 27/10/2010 ~all 88.0 01/03/2011 all 88.2 05/06/2011 5, 7,9 89.1 89.2 30/08/2011 24/11/2011 7 7.3.9, 7.7.2 5.10 90.1 90.2 91.0 28/02/2012 24/05/2012 06/09/2012 91.1 92.0 93.0 19/12/2012 01/03/2012 12/09/2013 5.4.1 5.5.1 5.4.3 5.8 6.1 5.3 5.3 all REASON/INITIATION DOCUMENTS/REMARKS New New revisited version! Changed list of authors. Porting to doc/pdf Introduction of cube, SAM and pupil tracking modes. Corrected some errors related to the use of the Return to Origin? Flag in some templates. Eliminated the Add. Velocity parameters.. Correction of typos Modified for p83 Updated, added faint targets with SAM Added section on data format Updated Added DPR keywords table. Improved figures, reformatting. Typos Addenda for the new modes (sam, cube, data format, pupil tracking) New info on new modes after change-over to P82. Changes for P83 Phase II Added some more info on overheads. Added SAMPol Added info on pupil tracking angles Added details for SAMPol Improved description of Wollaston prisms Chopping conventions SAM and SAMPol acquisition template SAM and SAMPol science templates New revised version for P85; SE and cube imaging in SM added. New revised version for P86; APP_coro, noAO added, PT comments, Spectro modified, cube mode frame losses… More APP information (from com. report), APP Spectroscopy, Prism Spectroscopy, minor changes in many sections, Cube mode for Polarimetry. As for CfP88, Lyot Coronagraphy in SM (no PT), SDI and PT in SM (no 4QPM), some information about PT astrometric (filed orientation) calibration. Template information fixes. Figure, tables 5.9, 9-1. Section7: some template comments. Minor fix to Pol. ACQ template description. Note about the drift in Pupil Tracking (fixed since Oct 15th 2011) SDI+4 decommissioned. Polarimetric flats clarification. Prism Spectroscopy: warnings Cube mode time overheads P2PP3: containers for SM Coronagraphy section, AGPM Coronagraphy section, AGPM update Some modes are not offered anymore (SDI+, Lyot, 4QPM, LGS) and some other modes become VM only (AGPM, spectroscopy, Polarimetry). 2 User’s Manual VLT-MAN-ESO-14200-2761 93.1 16/01/2014 5, 7, 10 94.0 28/02/2014 5, 7 96.0 27/02/2015 All 11/5/2015 All 30/07/2015 2, 5.3, 5.4, 6.6, 7.3, 7.5 97.0 Cube mode windowing options, some templates removed. Correction of HWP Encoder/degrees formula. Added info about reinstallation on UT1/NasA. Recommissioning on UT1, change of detector, additional background. APP Imaging decommissioned Removed all info on decommissioned modes Removed decommissioned modes 3 User’s Manual VLT-MAN-ESO-14200-2761 TABLE OF CONTENTS 1 Scope 12 2 Introduction 2.1 Additional resources 2.2 Current version of the manual 14 15 15 3 Observing with adaptive optics in the infrared 3.1 Atmospheric turbulence 3.2 Adaptive optics 3.3 Infrared Observations with an AO system 3.4 Transmission and background 3.5 Background subtraction 17 17 17 18 18 19 4 NAOS 4.1 Overview 4.2 NAOS Performance 4.3 Anisoplanatism 21 21 22 23 5 CONICA 5.1 CONICA detector 5.1.1 General characteristics 5.1.2 DIT and NDIT 5.1.3 Readout Modes and Detector Modes 5.1.4 Cameras 5.1.5 Filters 5.2 Imaging 5.2.1 Calibration Plan for imaging 5.2.2 Pipeline for imaging 5.2.3 noAO : “speckle” imaging 5.3 Coronagraphy 5.3.1 Annular Groove Phase Mask coronagraph (AGPM) 5.3.2 Calibration plan for coronagraphy 5.3.3 Night flat fields for LW coronagraphy: 5.3.4 Pipeline for mask coronagraphy 5.4 Polarimetry: VM only since P93 5.4.1 Calibration plan for polarimetry 5.4.2 Pipeline for polarimetry 5.5 Sparse Aperture interferometric Masks (SAM): VM only 5.5.1 SAM: why and when to use it 5.5.2 Pupil tracking with SAM 5.5.3 Detector readout and cube mode setup for SAM 5.5.4 SAM with LW filters 5.5.5 Choosing which mask to use 5.5.6 Calibrations: flat fields and data cleaning 5.5.7 PSF calibrations strategies 5.5.8 SAM imaging tests 5.5.9 U-‐V coverage 5.5.10 References and further readings 5.5.11 On sky observations: VY Canis Majoris 5.5.12 Faint companion detection: theory. 5.5.13 On-‐sky observations: BD-‐21 4300 5.5.14 On sky observations AB Dor in H and K 23 25 25 26 26 27 28 30 30 30 30 32 33 36 36 36 36 38 38 38 40 40 41 41 42 42 43 43 44 46 47 48 51 53 4 User’s Manual VLT-MAN-ESO-14200-2761 5.5.15 Additional considerations for faint companion detection 5.5.16 Calculating exposure times: throughput and sensitivity for selected filters. 5.5.17 PSF and MTF 5.5.18 Calibration plan for SAM 5.5.19 Pipeline for SAM 5.6 SAMPol 5.6.1 Calibration plan for SAMPol 5.6.2 Pipeline for SAMPol 5.7 Cube mode 5.7.1 Cube mode overheads 5.8 Pupil Tracking (PT) mode 5.9 NACO data format 54 55 61 61 61 61 61 61 62 64 64 69 6 Observing with CONICA at the VLT 6.1 Service Mode (SM) containers 6.2 Visitor Mode (VM) operations 6.3 Active Optics versus Adaptive Optics 6.4 The influence of the moon 6.5 Telescope control 6.6 Target acquisition 6.6.1 Imaging 6.6.2 Coronagraphy 6.6.3 Polarimetry 6.6.4 SAM 6.6.5 SAMPol 6.7 Pre-‐imaging 6.8 Finding charts, readme files and OB naming conventions 6.9 Reference sources for wavefront sensing 6.10 Strehl Ratio and classification of OBs in Service mode (SM) 6.11 PSF reference star 6.12 Recommended DIT and NDITs 6.13 IR background 6.14 Recommended magnitude ranges for Standard Stars 6.15 Maximum brightness of observable targets 6.16 Nighttime calibrations 6.17 Instrument and telescope overheads 70 70 70 71 71 71 72 72 73 73 73 73 73 73 74 74 75 75 75 76 76 77 77 7 NAOS-‐CONICA Templates 7.1 General remarks and reminders 7.1.1 Offset conventions and definitions 7.2 NACO General templates 7.2.1 NACO_all_obs_Rotate 7.3 NACO Acquisition templates 7.3.1 NACO_img_acq_MoveToPixel 7.3.2 NACO_img_acq_MoveToPixelNoAO 7.3.3 NACO_img_acq_MoveToMask (only with AGPM and VM since P93) 7.3.4 NACO_img_acq_Polarimetry 7.3.5 NACO_img_acq_SAMMoveToPixel (for SAM and SAMPol) 7.4 NACO imaging science templates 7.4.1 NACO_img_obs_AutoJitter 7.4.2 NACO_img_obs_GenericOffset 7.4.3 NACO_img_obs_GenericOffsetNoAO 7.4.4 NACO_img_obs_FixedSkyOffset 7.4.5 NACO_img_cal_StandardStar 7.5 NACO polarimetry science templates 83 83 85 86 86 86 88 89 89 90 91 91 92 93 95 95 97 98 5 User’s Manual VLT-MAN-ESO-14200-2761 7.5.1 NACO_pol_obs_GenericOffset 7.5.2 NACO_pol_obs_Retarder 7.5.3 NACO_pol_cal_StandardStar 7.6 NACO coronagraphic science templates 7.6.1 NACO_coro_obs_Stare (only with AGPM since P93) 7.6.2 NACO_coro_cal_NightCalib 7.7 NACO SAM and SAMPol science templates 7.7.1 NACO_sam_obs_GenericOffset 7.7.2 NACO_sampol_obs_GenericOffset 98 100 101 101 101 103 103 103 104 8 Filter Transmission Curves 8.1 CONICA Broad Band Imaging and order sorting filters 8.2 CONICA Neutral Density Filters 106 106 107 9 Preparation Software 9.1 Starting the PS 9.2 Graphical User Interface Overview 9.3 Target and Instrument Setup 9.4 Sky Conditions 9.5 Reference Objects 9.5.1 Handling several reference objects 9.5.2 Morphology 9.5.3 Photometry 9.5.4 Tracking table 9.5.5 Optimizing NAOS and Getting a Performance Estimation 9.5.6 Exporting to the Exposure Time Calculator 9.5.7 Exporting to P2PP 9.5.8 Exporting OBs from P2PP 9.5.9 Saving/Restoring a PS Session 9.5.10 Giving names to session, P2PP and PSF files 9.5.11 User’s preferences 108 108 108 109 110 110 110 111 111 113 113 116 117 117 117 117 117 10 Appendix -‐ DPR Keywords for NACO 119 LIST OF TABLES Table 2-1: Main modes and parameters of NACO. Please check NACO (public web) overview for updates. ......................................14 Table 4-1: NACO dichroics/beamsplitters ........................................................................................................................................21 Table 4-2: Wavefront sensors characteristics ........................................................................................................................................22 Table 4-3: Summary of NACO Strehl ratios at 2.2 microns for an A0 reference star at an airmass of 1.2. Values are listed for the onaxis case (when the source and the reference are the same) and for a source that is 30ʺ″ away from the reference star. The assumed seeing values are 0.8ʺ″and 1.2ʺ″ (at Zenith at a wavelength of 0.5 mm). These values were derived with the Preparation Software (PS) and are also used in the CONICA Phase 1 Exposure Time Calculator to estimate signal-to-noise ratios. .................................................................................23 Table 5-1: CONICA detector characteristics……………………………………………………………………………...24 Table 5-2: CONICA detector readout modes: for each astronomical use, the mode, Readout Noise (RON), gain, full-well (FW) capacity and minimum DIT (min-DIT) are given. ..................................................................................................................................................26 Table 5-3: List of available Cameras with plate scales, fields of view and wavelength ranges. ................................................................27 Table 5-4: CONICA Broad Band Imaging filters…………………………………………………… …………………27 Table 5-5: List of narrow and intermediate band filters……………………………………………………………………28 Table 5-6: CONICA’s masks and phase plates for coronagraphy. .....................................................................................................32 6 User’s Manual VLT-MAN-ESO-14200-2761 Table 5-7: Beam separation of the Wollaston-prism on the sky [arcsec] and in pixels as a function of the camera………………….36 Table 5-8: X and Y location of the holes as measured in mm from the centre of the mask 18Holes………………………….…. .43 Table 5-9: X and Y location of the holes as measured in mm from the centre of the mask 9Holes…………………………… .... 44 Table 5-10: X and Y location of the holes as measured in mm from the centre of the mask BB_9Holes………………………….44 Table 5-11: X and Y location of the holes as measured in mm from the centre of the mask 7Holes……………………………....45 Table 5-12: Results from phase fitting of target BD-21 4300……………………………………………………………....51 Table 5-13: False detections on calibrator stars…………………………………………………………………………...52 Table 5-14: result of the observations of AB Dor and its calibrator…………………………………………………………52 Table 5-15: Mask area and peak flux ratios for the used mask/filter combinations…………………………………………...55 Table 5-16: characteristics of cube mode………………………………………………………………………………….62 Table 6-1: Recommended DIT and NDIT range ...............................................................................................................................75 Table 6-2: IR. Backgrounds. The hyphens mark invalid combinations of a NAOS dichroic + CONICA filter. ...............................75 Table 6-3: Recommended magnitude range of standard stars for observations with the visual dichroic. ....................................................76 Table 6-4: Magnitude limits for DIT<1 sec .......................................................................................................................................76 Table 6-5: NACO Overheads…………………………………………………………………………………………77 Table 6-6: Example 1 – Imaging a faint source (V=15 for visual WFS or K=10 for IR WFS) with FowlerNsamp .........................79 Table 6-7 – Example 2: Imaging a bright source (V=11 with the VIS WFS or K=7 with the IR WFS) with Double_RdRstRd ..79 Table 6-8: Example 3: Imaging a bright source in the L band (V=11 for the VIS WFS or K=7 for the IR WFS) with Uncorr .....80 Table 6-9 – Example 4: Spectroscopy of faint source with FowlerNsamp ............................................................................................80 Table 6-10: Example 5: SW Polarimetry of bright source with the Wollaston.....................................................................................81 Table 6-11 – Example 5b: Polarimetry of bright source with the Wollaston and HWP......................................................................81 Table 6-12: Example 6: SW coronagraphy of a bright source with Double_RdRstRd .........................................................................82 Table 6-13 – Example 7: LW coronagraphy of a bright source ..........................................................................................................82 Table 7-1: NACO template suite ......................................................................................................................................................84 Table 7-2: Parameters of NACO_img_acq_MoveToPixel ................................................................................................................88 Table 7-3: Parameters of NACO_img_acq_MoveToPixelNoAO ....................................................................................................89 Table 7-4: Parameters of NACO_img_acq_MoveToMask ...............................................................................................................90 Table 7-5: Parameters of NACO_img_acq_Polarimetry ...................................................................................................................90 Table 7-6: Parameters of NACO_img_acq_SAMMoveToPixel.......................................................................................................91 Table 7-7: Parameters of NACO_img_obs_AutoJitter .....................................................................................................................93 Table 7-8: Parameters of NACO_img_obs_GenericOffset.................................................................................................................94 Table 7-9: parameters for the example shown in Figure 7-3 ................................................................................................................94 Table 7-10 : parameters for the example shown in Figure 7-4 .............................................................................................................95 Table 7-11: Parameter of NACO_img_obs_FixedSkyOffset ............................................................................................................96 Table 7-12: Parameters of NACO_img_cal_StandardStar ...............................................................................................................97 Table 7-13: Parameters of NACO_pol_obs_GenericOffset ...............................................................................................................99 Table 7-14: Parameters of NACO_pol_obs_Retarder.................................................................................................................... 100 Table 7-15: Parameters of NACO_coro_obs_Stare……………………………………………………………………..102 Table 7-16: Parameters of NACO_sam_obs_GenericOffset ........................................................................................................... 104 Table 7-17: Parameters of NACO_sampol_obs_GenericOffset ...................................................................................................... 105 7 User’s Manual VLT-MAN-ESO-14200-2761 Table 9-1: Various AO modes and tracking and differential tracking cases. .................................................................................... 113 8 User’s Manual VLT-MAN-ESO-14200-2761 LIST OF FIGURES Figure 3-1: Principle of Adaptive Optics 18 Figure 3-2: Model atmospheric transmission between 4 and 5 µm for a water vapour column density of 1.6 mm and at airmass 1 (Lord 1992, NASA Tech. Mem. 103957). 20 Figure 4-1: A view of the NAOS optical train. 21 Figure 5-1: CONICA Schematic overview 24 Figure 5-2: Illustration of the ghosts present on CONICA images when observing a bright object. In addition to the electronic ghosts, there is also an optical ghost characterised by its circular shape. The electronic noise visible on the sides of the array, as well as the ’bias’ levels of rows 512 & 513, disappear in the background subtraction. 25 Figure 5-3: Some results of the speckle masking experiment (Rengaswamy et al 2010) applied on a 0.16” separation binary star. Comparison between the reconstructed intensity map (bottom left) and the closed-loop AO image (bottom right) is given. Seeing conditions were excellent for this test. 31 Figure 5-4: Speckle holography technique applied to the NGC3603 cluster. The holography image on the right is nearly as deep as the AO-corrected one on the left (the 3-sigma detection limit is ~Ks= 18 in both cases). However it is advantageously more suitable for astrometry as every single star of the field appears in its true position, unaffected by AO-induced distortion effects. The holography PSF itself is very clean, diffraction limited with a K-band Strehl ratio reaching 65%, about 2.5 times superior to the closed-loop PSF which suffers an obvious waffle-mode pattern. 31 Figure 5-5: left, scanning electron microscope (SEM) image of the AGPM center, and corresponding cross-cut. It shows the fine microstructure patterned at the subwavelength scale (Delacroix et al. 2012, Appl. Opt. 51, 5897). Right: raw CONICA image of the sky background through the AGPM in Lp band and L27 camera, showing the clear 15” aperture, and the vortex center, located slightly off the intersection of CONICA’s quadrants. 33 Figure 5-6: left, saturated PSF with a DIT of 0.05s. Middle: residual after the AGPM coronagraph (DIT of 0.2s), displayed at the exact same linear scale. Note the attenuation of the peak brightness, the diffraction pattern, and the speckles pinned to the PSF (including the spiders), showing the threefold benefits of coronagraphy. Right: contrast curves, showing the PSF, the RAW azimuthally-average intensity, as well as the 5-σ final contrast after LOCI/PCA-type speckle subtraction on a typical but short ADI sequence (30º PA variation, 200 s of total exposure time on source). The purple curve shows the limit for larger PA variations. The background limit, reached here at 0”.4 will be lower for brighter targets and/or longer integration times (see NACO ETC). 34 Figure 5-7: comparison between standard Full Oversized stop, showing the VLT pupil and the Apo_165 stop. The latter is used with the AGPM and hence requires pupil tracking mode. It covers the diffraction and thermal emission from both the central obscuration (M2) and the support structures (spiders), making the AGPM more efficient. 35 Figure 5-8: Inner working angle (IWA) capabilities of the AGPM, as measured in the lab (left, Delacroix et al. 2013, in preparation) and as demonstrated on sky on a standard star under median-to-bad seeing conditions (right, Mawet et al. 2013, A&A). 35 Figure 5-9: Transmission as a function of wavelength for the Wollaston prism. The big absorption feature at 3.4 microns is due to the resin material 37 Figure 5-10: Mechanical drawings of the four aperture masks installed in the CONICA camera 38 Figure 5-11: Optical diagrams showing the effect of apodizing the pupil with the four 2-dimensional masks implemented in the CONICA camera. 40 Figure 5-12: Canis Majoris images reconstructed from 18-hole masking data (top) and from a set of shift-and-add stacked full pupil AO frames (bottom) 48 Figure 5-13: (left) image as obtained on the detector observing a calibrator star with the BB_9Holes mask. (right) Fourier transform of this image, revealing peaks corresponding to the different vector baselines passed by the mask 49 Figure 5-14: Models of fringe phase as a function of the baseline length. A binary system generates phases with a sinusoidal pattern, whose amplitude corresponds to the brightness ratio between the primary and the secondary, while the frequency is proportional to the angular separation 50 Figure 5-15: Left : CONICA image of a binary star. Centre : best fit artificial fringe pattern giving the Fourier amplitudes and phases. Right: the fitting residual shows the discrepancy between data and model 51 Figure 5-16: χ2 maps showing detection of the binary BD-21 4300. Left: H band data. Right: K band data. The general χ2 minimum is at the same position on the two maps 51 9 User’s Manual VLT-MAN-ESO-14200-2761 Figure 5-17: Phases measurement for BD-21 4300 as a function of the baseline length. The solid curve is the best fit of a model of a binary star (Tuthill et al 2010, SPIE 7735 56). Right panel: H band data. Left panel: K band data. The companion position and flux ratio are reported in Table 552 Figure 5-18: Same as Figure 5-17 but using a point-source reference star observed in different filters and masks. Left: 9 Holes (NB_2.17). Middle: BB9_Holes (NB_2.17). Right: BB9_Holes (Lp). All give statistically null results for the presence of a binary companion, with best-fit limits reported in 52 Figure 5-19: Likelihood for the presence of a secondary star as a function of its position. At maximum likelihood, the flux ratio between the main star and its companion is 1.29+/-0.14% in K band (left) and 1.47+/-0.24% in H band (right). 53 Figure 5-20: Example of strong systematic effect on the phases. Both dataset consists in 400 0.11 ms exposures. The only different between these two dataset are the position of the star on the detector. In red is plotted the mean phase, as well as its statistical rms. If the phases could be de-biased, potential precision on the phase would be 0.1 deg, allowing detection with dynamic range of 1 000 55 Figure 5-21: Throughput for the 18-Holes mask. Top panel shows throughput with three narrowband filters in J, H and K bands respectively, while the longer wavelengths are given to the bottom panel. Various integration times are shown (annotated on the plot). 57 Figure 5-22: Same as Figure 5-20 but for the 9-Holes mask 58 Figure 5-23: Same as Figure 5-20 but for the BB 9-Holes mask 59 Figure 5-24: Same as Figure 5-20 but for the 7-Holes mask 60 Figure 5-25: Orientation of the pupil (or spikes) in field tracking (FT) mode: angular (parallactic) variation as a function of time in FT mode as a function of the star declination 65 Figure 5-26: Pupil and Field rotations as a function of the star declination. The pupil rotation is shown in black and the field rotation in red. PAsky refers to the rotator offset that can be applied during the OB acquisition 66 Figure 5-27: Orientation of the telescope spiders for different position angles. The spiders have 180 degrees symmetry, i.e. 90 and -90 look identical. Spiders rotate clockwise for positive angles 68 Figure 7-1: Orientation for imaging, polarimetry and coronagraphy. (Left): Field orientation on detector at 0o rotation angle on sky, (Right): Field orientation at +45o rotation angle on sky. 85 Figure 7-2: An illustration of the NACO_img_obs_AutoJitter. In this example the jitter box width is set to 10ʺ″, NEXPO is 1, number of offset position is 7, Return to Origin? is T and the camera is S27. The dotted line defines the jitter box width. 92 Figure 7-3 An illustration of how the NACO_img_obs_GenericOffset template works. In this example the offsets are in DETECTOR co-ordinates. Exposures 1 and 5 occur at the same place. The telescope will return to the origin after the eighth exposure, as indicated by the dashed line connecting point 8 to 1. The parameter settings for this example were: 94 Figure 7-4: A second illustration of how the NACO_img_obs_GenericOffset template works. As with the previous example, exposures 1 and 5 occur at the same place, and the telescope returns to the origin after the eighth exposure (indicated by the dashed line connecting point 8 with 1/5). The parameter settings for this example are given in Table 7-5. 95 Figure 7-5: An illustration of how the NACO_img_obs_FixedSkyOffset template works with Jitter Box Width = 9, Number of AB or BA cycles = 4, Sky offset in Dec. = 15, Sky offset in RA. = -35 and Camera = S13 96 Figure 7-6: An illustration of how the NACO_pol_obs_GenericOffset template works with Number of offset positions = 9, NEXPO per offset position = 1, Observation Type (O or S) = O, List of offsets in X = -4 0 0 4 0 0 4 0 0, List of offsets in Y = 2.3 -2.3 -2.3 0 2.3 2.3 0 -2.3 -2.3 and List of Position Angle Offsets = 0 45 99 Figure 7-7: An illustration of how the NACO_coro_obs_Stare template works. The dashed line connecting position 10 with 1 is the offset done at the end of the template, when the telescope returns to origin. The rather erratic bold lines are wires, which hold the coronagraphic mask in place. The AO loop is off when the sky is observed (large filled in circles) and on when the object is observed (small filled in circles). In this example, the parameter settings were: Number of AB cycles = 2, Number of Exposures (Object Only) = 2, Number of offset positions (Sky only) = 3, Jitter Box Width = 9, Sky offset in Dec. = 15, Sky offset in RA. = -35, Camera = S13 103 Figure 8-1: Filter curves for J, H, Ks, Lp and Mp and the order-sorting spectroscopic filters SJ, SK, L. The SH and L band filters are also used as order-sorting filters in spectroscopy 106 Figure 8-2: Transmission curves of the CONICA neutral density filters. 107 Figure 9-1:PS GUI (Note: The current version is v1.105. The GUI for the current version differs from the one depicted above only in the version number that appears on the top bar.) 109 Figure 9-2: Illustration of the extinction curve used when giving a non zero value to the extinction AV . The J, H, K and R bands are shown for reference along with the monochromatic wavelength for V. The bottom graph represents the quantum efficiency for the WFS detectors as a function of wavelength. 112 10 User’s Manual VLT-MAN-ESO-14200-2761 Figure 9-3: An example of tracking table window (acquisition and observation of moving objects). Offsets in RA and DEC are given in arcsec. 114 Figure 9-4: Performance subpanel: the AO optimal configuration and the PSF is available from buttons in this panel. 114 Figure 9-5: Pop-up window showing an optimal configuration of the AO system. 115 Figure 9-6: Pop-up window showing the PSF profile. This also gives access to the PSF FITS file. The different width of the PSF in xand y-direction are due to anisoplanatism. The x-axis is here defined as the axis that is parallel to the line connecting the reference object with the science target. 116 11 User’s Manual 1 VLT-MAN-ESO-14200-2761 SCOPE This is the Naos-Conica (hereafter, NACO) User’s Manual. It can be used as a reference for users interested in preparing observing proposal with NACO. This document has been completely revised and partly rewritten in 2009, using the latest available version of 2008. List of Abbreviations & Acronyms This document employs several abbreviations and acronyms to refer concisely to an item, after it has been introduced. The following list is aimed to help the reader in recalling the extended meaning of each short expression: Acronym Meaning ADI AGPM AO ATP ATR CCS CONICA CPU DCR DCS DFS DIT DM DPR ESO ETC FLI FNS FoV FS FW FWHM GUI HB HD HS HWD HW HWP IB ICS INS I/O IR IRACE ISF IWS JNPS Angular Differential Imaging Annular Groove Phase Mask (“Vortex” coronagraph) Adaptive Optics Acceptance Test Plan Acceptance Test Report Central Control Software High Resolution IR Camera and Spectrometer Central Processing Unit Double_RdRstRd Detector Control Software Data Flow System Detector Integration Time Deformable Mirror Data Product European Southern Observatory Exposure Time Calculator Fractional Lunar Illumination FowlerNsampling Field of View Field Selector Full well Full-Width at Half Maximum Graphical User Interface HighBackground HighDynamic HighSensitivity HighWellDepth Hardware Half-Wave Plate Intermediate band Instrument Control Software Instrumentation Software Package input/output Infra-red Infra-red Array Control Electronics Instrument Summary File Instrument Workstation Java NACO Preparation Software 12 User’s Manual LAN LCC LCU LGS, LGSF LN2 LW M2 mas MS MSCO MVCO MTF N/A NAOS NACO NB ND NDIT NGS noAO OB PAE P2PP PS PSO PSF PT RAM RON RTAP RTC RTD SAM SAMPol SM SR SW TBC TBD TCS TIM TRS TSF TTM TTS VLT VM WF WFS WS ZNVA VLT-MAN-ESO-14200-2761 Local Area Network LCU Common Software Local Control Unit Laser Guide Star, Laser Guide Star Facility Liquid Nitrogen Long Wavelength Secondary Mirror Milli-arcsec Maintenance Software Residual (Modal) Slope Covariance matrix Modal Voltages Covariance matrix Modulation Transfer Function Not Applicable Nasmyth Adaptive Optics System NAOS-CONICA Narrow Band Neutral Density Number of Detector Integration Time Natural Guide Source Open loop (no AO correction) Observation Block Preliminary Acceptance Europe Phase 2 Proposal Preparation Preparation Software Paranal Science Operations Point-Spread Function Pupil Tracking Random Access Memory Read Out Noise Real-Time Application Platform Real-Time Computer Real Time Display Sparse Aperture interferometric Mask Sparse Aperture interferometric Mask + Polarimetry Service Mode Strehl Ratio Short Wavelength To Be Clarified To Be Defined Telescope Control Software Time Interface Module Time Reference System Template Signature File Tip-Tilt Mirror Tip-Tilt Source Very Large Telescope Visitor Mode Wavefront Wavefront Sensor Workstation Zernike Noise Variance 13 User’s Manual 2 VLT-MAN-ESO-14200-2761 INTRODUCTION The Nasmyth Adaptive Optics System (NAOS) and the High—Resolution Near IR Camera (CONICA) were installed at the Nasmyth B focus of UT4 from 2001 to 2013. Since 2014, they are installed at the Nasmyth A focus of UT1. NACO provides multimode, adaptive optics corrected observations in the range 1-5 µm. NAOS (Section 4) is an Adaptive Optics (AO) system (Section 4.1) that is designed to work with natural guide sources (NGS, point-like or extended objects) with either a visible or an IR wavefront sensor. CONICA (Section 5) is an Infra-Red (IR) (1 - 5 µm) imager and spectrograph fed by NAOS. It is capable of imaging, with and without AO, long slit spectroscopy, coronagraphy, polarimetry and sparse aperture interferometry, with several different plate scales, filters and options (e.g. cube mode for “lucky-imaging”, pupil tracking for imaging, coronagraphy and SAM). The modes offered for P97 are listed in Table 2-1 . NACO can be used in Service (SM) or Visitor Mode (VM). The Observatory provides daily calibrations, as the NACO Calibration Plan. Pipelines for quick look data reduction are available for some modes of the instrument. Since P86, it is possible to observe without closing the loop (noAO mode) and use NACO as a “speckle imager”, which can be useful for some applications and/or under bad seeing conditions. Table 2-1: Main modes and parameters of NACO. Please check NACO (public web) overview for updates. Adaptive Optics Performance - NGS 50% Strehl ratio in Ks under good atmospheric conditions (good seeing AND coherence time >4ms) and with a reference object of V=10 mag or K=6 mag, Imaging - simple Broad- and narrow- band filters in the 1-5 µm region with 14”–56” fields of view and 13–54 mas pixel scales - noAO Open-loop imaging (no AO) is offered in SM/VM (not pipeline supported). Coronagraphy - AGPM Since P93, only the AGPM (L’, NB_4.05) is offered (pupil tracking and cube mandatory) only in VM. Polarimetry Imaging with a Wollaston prism, works with/without pupil tracking, VM only since P93. Sparse Aperture Masking Interferometry with 4 different masks. SAM is only offered in VM. SAM with polarimetry, offered in VM. Cube or burst mode (all NDIT are saved) is offered in SM and VM for any of the above modes. SAM SAMPol Cube Mode This manual is organized as follows: • Section 3.: a summary of AO techniques and IR observations. 14 User’s Manual VLT-MAN-ESO-14200-2761 • Section 4.: description of NAOS • Section 5: description of CONICA • Section 6: operations with NACO. • Section 7: acquisition and observations templates manual. • Section 8: filters transmission curves. • Section 9: the Preparation Software (PS) user manual. • Section 10: Appendix – DPR keywords for NACO. 2.1 Additional resources NACO Web Pages NACO Online Documentation NACO News NACO contributed library NACO Call for Proposal NAOS Preparation Software Exposure Time Calculator Catalogues for adaptive optics reference objects Phase 2 Proposal Preparation User Support Department NACO Quality Control http://www.eso.org/sci/facilities/paranal/instruments/naco http://www.eso.org/sci/facilities/paranal/instruments/naco/doc/ http://www.eso.org/sci/facilities/paranal/instruments/naco/news.html http://www.eso.org/sci/facilities/paranal/instruments/naco/tools.html http://www.eso.org/sci/observing/proposals/ http://www.eso.org/sci/observing/phase2/SMGuidelines/NAOSPS.html http://www.eso.org/observing/etc/ Optical sources: ESO GSC2 (skycat): http://archive.eso.org/skycat/ GSC2 at STScI http://www-gsss.stsci.edu/ Infrared Sources (VIZIER Catalogue): http://vizier.u-strasbg.fr/viz-bin/VizieR?-source=2MASS http://www.eso.org/sci/observing/phase2/SMGuidelines/Documentation/ P2PPTutorialNACO.html http://www.eso.org/sci/observing/phase2/USD.html http://www.eso.org/observing/dfo/quality/NACO/qc/qc1.html For any question regarding NACO Service Mode operations, the point of contact is the User Support Department ([email protected]) in Garching. Users with approved Visitor Mode programs can contact [email protected]. 2.2 Current version of the manual This is version 97. of the NACO User Manual, applicable for Phase 1 and Phase 2 preparation of P96. Since NACO is being constantly improved and modes are constantly refined (especially the new ones), it is advisable to check the NACO web page for possible updates to this manual and for recent news. For P97, long slit spectroscopy has been decommissioned. The idea is to mitigate risks (associated to commissioning, training, etc.) and stick to the essential and high performance setups. The following modes are offered for P97: • Imaging: all filters except Mp • One coronagraph (AGPMs) is now offered in VM in pupil tracking (PT). • noAO: open-loop imaging. Associated with the cube mode, it allows to do speckle interferometry with NACO and recover very good Strehl ratios down to 1 µm. Offered in VM and SM. 15 User’s Manual VLT-MAN-ESO-14200-2761 • Pupil Tracking (PT): PT is now offered in SM but only for direct imaging (no image plane masks). • SAM/SAMPol: sparse aperture mask interferometry (SAM) can be combined with polarimetry. The simultaneous use of the Wollaston_00 together with the SAM masks presents a unique opportunity to examine systems where there may be polarization signals at very high spatial resolutions. SAMPol is similar to SAM and uses pupil tracking and cube modes. SAMPol is only offered in VM. • Lucky imaging – Offered: Simple imaging in cube mode is offered in SM since P85; the mode is similar to having AO assisted speckle imaging, since the user can discard from the cube the images with the worst quality. • Polarimetry: Wollaston_00 in combination with the retarder plate. • Special calibrations: all observations requesting special calibrations will be moved to VM. Exceptions to this rule will be considered on a case-by-case basis during technical feasibility 16 User’s Manual 3 VLT-MAN-ESO-14200-2761 OBSERVING WITH ADAPTIVE OPTICS IN THE INFRARED 3.1 Atmospheric turbulence The VLT (Very Large Telescope) has a diffraction-limited resolution of λ/D = 0.057” at λ=2.2 µm. But the resolution is severely limited by atmospheric turbulence to λ/r ~0.7”, where r is the Fried parameter. The Fried parameter is directly linked to the strength of the turbulence and it depends on the wavelength as λ6/5. 0 0 For average observing conditions, r is typically 60 cm at 2.2 µm. The correlation time of the turbulence, τ , is related to r and the speed at which the turbulent air travels. For a wind speed of 10 m/s the correlation time is of the order of 60 ms at 2.2 µm. Both τ and r are critical parameters. The larger they are the more stable the atmosphere is and the better the performance of NAOS will be. Atmospheric conditions are better suited to AO observations during the summer months in Paranal, with larger τ and r 0 0 0 0 0 3.2 0 0. Adaptive optics A powerful technique in overcoming the degrading effects of atmospheric turbulence is real-time compensation of the deformation of the wavefront (WF) by adaptive optics (AO, Figure 3-1). The wavefront sensor (WFS) measures WF distortions and these measurements are processed by a RealTime Computer (RTC). The RTC controls a deformable mirror (DM) and corrects the WF distortions. The DM is a continuous thin plate mirror mounted on a set of piezoelectric actuators that push and pull on the back of the mirror. Because of the significant reduction in the WF error by AO correction, it is possible to record images with exposure times that are significantly longer than the turbulence correlation time. The WF error directly determines the quality of the formed image. One of the main parameters characterizing this image quality is the Strehl ratio (SR), which basically corresponds to the amount of light contained in the diffraction-limited core relative to the total flux. An AO system is a servo-loop system working in closed loop. The DM flattens the incoming WF and the WFS measures the residual WF error. The WFS in NAOS uses a Shack-Hartmann screen. It consists of a lenslet array that samples the incoming WF in a pupil plane. Each lenslet forms an image of the object and the displacement of the image gives an estimate of the WF slope at that lenslet. A good feature of this WFS is that it works with white light, extended sources and very faint stars. The performance of an AO system is directly related to the number of lenslets in the lenslet array, the number of actuators behind the DM, and the rate at which WF errors can be measured, processed and corrected (the server-loop bandwidth). The performance of an AO system is also directly linked to the observing conditions. The most important parameters are the seeing (or more explicitly r0 and t0), the brightness of the reference source used for WFS and the distance between the reference source and the object of interest. In case of good conditions and a bright, nearby reference source, the correction is good and the resulting point spread function (PSF) is very close to the diffraction limit. A good correction in the K-band typically corresponds to a SR larger than 30%. At shorter wavelengths (particularly in the J-band) or in the case of poor conditions or a faint, distant reference source, the correction is only partial - the Strehl ratio may only be a few percent. 17 User’s Manual VLT-MAN-ESO-14200-2761 Figure 3-1: Principle of Adaptive Optics 3.3 Infrared Observations with an AO system Observing in the IR with an AO system is, in broad terms, very similar to observing with other IR instruments. One has to deal with high and variable backgrounds and modest detector cosmetics. In general, the IR background, particularly at longer wavelengths, is higher for an IR instrument with an AO system, because of the additional optics in an AO system. Additionally, the classical chop and nod technique, which is commonly used for the LW filters in non-AO systems, works less well as the DM introduces background fluctuations that do not cancel perfectly. This does not degrade L-band observations but it may degrade M-band observations. Given the relatively small field of view of CONICA, it is possible to observe in the L-band without having to chop and nod. However, the overheads are relatively large (typically 50-100%) because the sky has to be sampled frequently (at least once a minute), and poor results can be obtained if one does not offset frequently or if the time scale for fluctuations in the L-band background is short. We strongly recommend that users limit themselves to the autojitter template. Jittered observations for the Lp, NB_3.74 and NB_4.05 filters will allow a reasonably good background subtraction. One of the major differences between AO and non-AO systems is the pixel scale. The pixel scale of CONICA can be as fine as 0.013”, which is a factor 10 smaller than ISAAC. Hence, it will take ~100 times longer to reach background limiting performance. Additionally, the fields-of-view are smaller, so large scale changes in the sky background are less noticeable in CONICA than in ISAAC. Thus, the typical integration time and the typical amount of time between telescope offsets will be larger for CONICA. 3.4 Transmission and background The transmission of the Earth's atmosphere in the 1–5 µm region is shown in Figure 3-2. The Y, J, H, K, L and M bands correspond to atmospheric windows which are approximately centred at 1, 18 User’s Manual VLT-MAN-ESO-14200-2761 1.25, 1.65, 2.2, 3.6, and 4.8 µm The absorption is mostly due to water and carbon dioxide and it varies with zenith distance and the amount of water vapour. Regarding observations with NACO, the sky background can be split into two regions. Below ~2.2 µm the sky background is dominated by OH emission that originates at an altitude of ~80 km. At longer wavelengths the thermal background of the atmosphere and telescope dominate. 3.5 Background subtraction Subtraction of the background is critical to the success of observing in the IR and special observing techniques have been developed to do it. The techniques depend on the type of observation and on the wavelength region at which one is observing. For imaging observations short ward of 4.2 microns and for regions that are relatively un-crowded (i.e. tens of point sources in 20 square arcsec or moderately extended objects), the standard practice is to resort to the jitter technique, and most NACO imaging templates make use of it. The technique basically consists of taking numerous images of the field (typically 10 or more) with small offsets between the positions. The sky is then estimated from all the observations. The most critical aspect of jittering is that the size of the offsets should be larger than the spatial extent of the object(s) one is observing. For more crowded fields or extended objects (i.e. covering a large fraction of the array), the jittering technique works less well and the sky has to be sampled separately from the object, resulting in a loss of observing efficiency, which can amount to 50% of the time if the sky has to be sampled as frequently as the object. Still, all the `object' positions can be “jittered” between themselves, as well as the `sky' positions. This minimises the effect that poor array cosmetics have on the data. In the case of crowded fields where there is no suitable, nearby sky field, the jittering technique can still give good results as long as the number of offsets is large, i.e. greater than 20. For crowded fields or extended objects, the sky has to be sampled separately from the object. At thermal IR wavelengths (> 3 µm) the background is considerably higher and more variable. In order to avoid saturation, the detector at these wavelengths needs to be read very rapidly which in turn leads to poorer detector cosmetics. 19 User’s Manual VLT-MAN-ESO-14200-2761 Figure 3-2: Model atmospheric transmission between 4 and 5 µm for a water vapour column density of 1.6 mm and at airmass 1 (Lord 1992, NASA Tech. Mem. 103957). The standard sky subtraction technique is to use chopping and nodding, which is, unfortunately, not offered on NACO any longer. For observations with NACO it is not necessary to use chopping and nodding for LW imaging, spectroscopic and polarimetric observations if the central wavelength of the filter is less than 4.2 µm, the sky is sampled frequently (i.e. more than once per minute) and if conditions are clear. But, for coronagraphic observations, where one cannot jitter, and for filters with wavelengths greater than 4.2 µm, efficient subtraction of the sky background would require chopping and nodding. 20 User’s Manual 4 VLT-MAN-ESO-14200-2761 NAOS 4.1 Overview NAOS provides a turbulence-compensated f/15 beam and a 2 arcmin field of view (FoV) to CONICA. Two off-axis parabolas re-image the telescope pupil on the deformable mirror and the Nasmyth focal plane on the entrance focal plane of CONICA. A schematic sketch of the optical train of NAOS common path is shown in Figure 4-1. The optical trains of the wavefront sensors are not shown in this figure. The tip-tilt plane mirror (TTM) compensates for the overall WF tip and tilt, which are the largest disturbances generated by the turbulence. Figure 4-1: A view of the NAOS optical train. The DM, which contains 185 actuators, compensates for the higher order aberrations including the static aberrations of NAOS and CONICA. Table 4-1: NACO dichroics/beamsplitters Dichroic Name VIS N20C80 N90C10 JHK K 1 The Reflected light to the WFS V,R,I 0.46-0.95 µm V,R,I,J,H,K 0.45-2.55 µm V,R,I,J,H,K 0.45-2.55 µm I,J,H,K 0.80-2.55 µm Efficiency K 1.9-2.55 µm 90% 90 % 20 % 90 % 90 % Transmitted light to CONICA J,H,K,L,M 1.05-5.0 µm V,R,I,J,H,K 0.45-2.55 µm V,R,I,J,H,K 0.45-2.55 µm L,M 2.8-5.5 µm Efficiency V,R,I,J,H 0.45-1.8 µm 90% Use 90% Near-IR observations with optical WFS 80 % WFS and observations in the IR 10% WFS and observations in the IR1 90% Thermal-IR observations and nearIR WFS J, H observations and K band WFS N90C10 dichroic can also be used with the visible WFS. In this case, it acts as a neutral density filter. 21 User’s Manual VLT-MAN-ESO-14200-2761 A dichroic splits the light between CONICA and the WFS channel. Each dichroic is associated with one WFS with the exception of the N90C10. For example, the visual dichroic can only be used with the visual WFS and the other dichroics can only be used with the IR WFS. The conditions under which the dichroics can be used are listed in Table 4-1. Users are invited to study this table carefully. The N90C10 can be used with the visible WFS and serves as a neutral density filter for CONICA. A field selector (FS) is placed just after the WFS input focus in order to select the reference object for WF sensing. The FS also allows object tracking, pre-calibrated flexure compensation and counter-chopping (currently this is not functional). It is made up of two parallel tip-tilt mirrors working in closed loop to achieve a very high angular stability. Two WF sensors are implemented in NAOS: one operating in the visible and one in the near–IR. An off-axis NGS can be selected anywhere within a 110 arcsec diameter FoV, facilitating a target-toreference distance of up to 55 arcsec. NAOS allows WF sensing with faint NGS and extended objects but with lower performance. Observations of very bright objects are possible with the visible WFS using neutral density filters. Note that these neutral density filters are distinct from the neutral density filters of CONICA and are not selectable within the NAOS-PS software or within P2PP. They are linked to the first three available AO-modes (1-1, 1-2 and 1-3). The two WF sensors are of the Shack-Hartmann type. For the visible WFS, two configurations are available: a 14×14 lenslet array, with 144 valid sub-apertures and a 7×7 lenslet array, with 36 valid sub-apertures. For the IR WFS, three configurations are available: a 14×14 lenslet array, with 144 valid sub-apertures and two 7×7 lenslet arrays, with 36 valid sub-apertures, with different FoVs. Independent of which Shack-Hartmann sensor is being used, all 185 actuators on the DM are used. The FoV, the temporal sampling frequency and the pixel scale of the WFS can also be optimized, providing a good performance over a large magnitude range. Characteristics of both WFS are given in Table 4-2. Table 4-2: Wavefront sensors characteristics Characteristics Wavelength range FoV per lenslet 14×14 7×7 Magnitude range 14×14 7×7 Detector 4.2 Visible WFS 0.45 – 1.0 µm Infrared WFS+N20C80 0.8 – 2.5 µm Infrared WFS+N90C10 0.8 – 2.5 µm 2.32ʺ″ 4.64ʺ″ 5.15ʺ″ 4.8ʺ″ (V0) and 5.5ʺ″ (V1) 5.15ʺ″ 4.8ʺ″ (V0) and 5.5ʺ″ (V1) 0-12 12-16.7 128×128 EEV CCD 4-9 9-12 1024×1024 Rockwell Hawaii 5.5-10.5 10.5-13.5 1024×1024 Rockwell Hawaii NAOS Performance The level of the AO correction depends on a large number of factors, such as seeing, the speed of the turbulence, the airmass, the brightness and morphology of the reference object, the distance between the reference object and target and instrument performance. The performance of NAOS is summarised in Table 4-3. The preparation software should be used for more detailed predictions and simulated PSFs. 22 User’s Manual VLT-MAN-ESO-14200-2761 Table 4-3: Summary of NACO Strehl ratios at 2.2 microns for an A0 reference star at an airmass of 1.2. Values are listed for the on-axis case (when the source and the reference are the same) and for a source that is 30ʺ″ away from the reference star. The assumed seeing values are 0.8ʺ″and 1.2ʺ″ (at Zenith at a wavelength of 0.5 mm). These values were derived with the Preparation Software (PS) and are also used in the CONICA Phase 1 Exposure Time Calculator to estimate signal-to-noise ratios. V magnitude 10.0 11.5 13.0 14.5 16.0 On-axis (0.8ʺ″ seeing) 47 44 26 17 5 Strehl ratios (SR) [%] On-axis 30ʺ″ off-axis (1.2ʺ″ seeing) (0.8ʺ″ seeing) 9 32 9 12 7 7 5 5 3 1 30ʺ″ off-axis (1.2ʺ″ seeing) 1.5 1.4 1.3 1.0 0.7 Note that a seeing of 0.8ʺ″ or better can be obtained on Paranal 50% of the time, while 1.2ʺ″ or better can be obtained 80% of the time. 4.3 Anisoplanatism Anisoplanatism is the field dependence of the PSF. It corresponds to the angular decorrelation of the wavefront coming from two angularly separated stars. This phenomenon affects the quality of the AO correction in the direction of the target when the reference star is not on axis. 5 CONICA CONICA is an IR (1–5 µm) imager and spectrograph, which is fed by NAOS. It is capable of imaging (including Simultaneous Differential Imaging), coronagraphy, polarimetry and Sparse Aperture Masking observations with several different plate scales. This section describes the optical components of CONICA. See Figure 5-1 for a drawing of the instrument The optical path includes the following components: o The slider wheel, which is either open, or closed in calibration position, or with the Half Wave Plate inserted. o The mask/slit wheel, which contains various masks for imaging and polarimetry (note that now only the Wollaston_00 is available), the coronagraphic mask (Lp-band AGPM). o The Lyot wheel, which includes the ND filters and the SAM masks. o The grism wheel, which contains the grisms, the prism, the Wollaston, the Wollaston_00 for polarimetry, the J broadband filter, and the new IB_4.05 filter. o The first filter wheel, which contains all the intermediate band (IB) filters (except the IB_4.05 filter), NB_2.17, NB_2.12 and NB_4.05. o The second filter wheel, which contains all the broadband filters (except J), the remaining NB filters. o The camera wheel, which contains all the objectives. 23 User’s Manual VLT-MAN-ESO-14200-2761 Figure 5-1: CONICA Schematic overview 24 User’s Manual 5.1 VLT-MAN-ESO-14200-2761 CONICA detector 5.1.1 General characteristics The CONICA detector was a Santa Barbara Research Centre (SBRC) InSb Aladdin 3 array until September 2013. It was installed into CONICA during May 2004 and it replaces the Aladdin 2 detector that had been used since the instrument was first offered. The main characteristics of the Aladdin 3 array are summarized in Table 5-1. Since December 2014 and the P94 recommissioning, the CONICA detector has been replaced again with an Aladdin 2 (from the ISAAC instrument). Please check online for characteristics. To first order (OB preparation), they are practically the same as the Aladdin 3. Table 5-1: CONICA detector characteristics Detector Format Pixel Size [µm] Aladdin 2 1024×10262 27 Dark Current1 [ADUs-1 pixel-1] 0.05-0.15 Wavelength range Q.E. [µm] 0.8-5.5 0.8-0.9 The new detector is more sensitive to heavily saturated sources. The limiting magnitudes, that are observable, are specified in Table 6-4. Please check carefully Section 6.14 for tolerated “saturated” observations. Figure 5-2: Illustration of the ghosts present on CONICA images when observing a bright object. In addition to the electronic ghosts, there is also an optical ghost characterised by its circular shape. The electronic noise visible on the sides of the array, as well as the ’bias’ levels of rows 512 & 513, disappear in the background subtraction. The dark current consists of the array dark current, which is much lower than the numbers listed here, and thermal radiation from the instrument. 1 Although the array has 1026 rows, only the first 1024 are used. The last two rows do not contain useful data. In most cases, the exception being the cube mode images and Mp imaging frames, users will receive images that have 1024 pixels in x and y. For observations in the Mp, the array is windowed to 512 × 514. 2 25 User’s Manual VLT-MAN-ESO-14200-2761 For bright objects, a number of electronic and optical ghosts become apparent. If the source is at pixel coordinates (x,y), there will be electronic ghosts at approximately (1024-x,y), (1024-x,1024-y) and (x,1024-y) and there may be an optical ghost which looks like a set of concentric rings. The ghosts can be seen in Figure 5-2 An additional thermal noise has been measured in the detector, of the order of 41 e-/s/pix. A new intervention is planned for September 2015, in order to further decrease it, but, for the time being, users should take this into account when planning their observations. The ETC has been updated accordingly. 5.1.2 DIT and NDIT The IRACE controller controls the detector front-end electronics and manages preprocessing of the data before transferring them to the workstation. A single integration corresponds to DIT (Detector Integration Time) seconds. The pre-processor averages NDIT of these before transferring the result to disk (except in the case of Cube Mode, see Section 5.7). Note that the number of counts in the images always corresponds to DIT, not to the total integration time (i.e. DIT × NDIT). 5.1.3 Readout Modes and Detector Modes The readout mode refers to the way the array is read out. We offer three readout modes: o Uncorr - The array is reset and then read once. It is used for situations when the background is high, e.g. LW imaging. The minimum DIT without windowing is 0.1750 seconds. For observations in Mp, the array is windowed to 512x514 and the minimum DIT is 0.0558 seconds. Refer to Table 5-21 for minimum DIT values for windowed readout schemes. o Double_RdRstRd - The array is read, reset and read again. It is used for situations when the background is intermediate between high and low, such as SW imaging. The minimum DIT is 0.3454 seconds. Refer to Table 5-18 for minimum DIT values for windowed readout schemes. o FowlerNsamp - The array is reset, read four times at the beginning of the integration ramp and four times again at the end of the integration ramp. Each time a pixel is addressed, it is read four times. It is used for situations when the background is low, such as SW NB imaging. The minimum DIT is 1.7927 seconds. Refer to Table 5-21 for minimum DIT values for windowed readout schemes. The detector mode refers to the setting of the array bias voltage, and four modes have been defined: HighSensitivity, HighDynamic, HighWellDepth and HighBackground. The well depth and the number of hot pixels are directly related to the detector mode. HighSensitivity has the fewest hot pixels, but it has the smallest well depth. Conversely, HighBackground has the largest well depth but has many more hot pixels. The former is used for long integrations in low background situations, where cosmetic quality and low readout noise are paramount, while the latter is used in high background situations where cosmetic quality is less important. The detector mode is not a parameter that users can select. It is set automatically and depends on the instrument setup. For example, all observations in FowlerNsamp will use HighSensitivity. Details of how the detector modes are assigned are given in Table 5-2. Table 5-2: CONICA detector readout modes: for each astronomical use, the mode, Readout Noise (RON), gain, full-well (FW) capacity and minimum DIT (min-DIT) are given. 26 User’s Manual VLT-MAN-ESO-14200-2761 Instrument mode Readout mode Detector Mode HighSensitivity RON [ADU] 1.3 Gain [e-/ADU] 12.1 Full Well [ADU] 7500 Min-DIT [sec] 1.7927 SW FowlerNsamp SW Double_RdRstRd HighDynamic 4.2 11.0 15000 0.3454 LW NB imaging Uncorr HighDynamic 4.4 11.0 15000 0.1750 LW Lp imaging Uncorr HighWellDepth 4.4 9.8 22000 0.1750 LW Mp imaging Uncorr HighBackground 4.4 9.0 28000 0.0560 The maximum allowed DIT is now unconstrained by the array. However, in practice, the maximum DIT is defined by the need to get sky frames. As part of the updated NACO calibration plan, photometric standard stars (STD) will be observed with the same setup (dichroic, FLM/camera, filter, gain and readout mode) as the science observations for all OBs requiring CLR or PHO conditions. Full Well refers to the full well depth. In this case the array is completely saturated and photometry cannot be done. Generally, users should keep the peak count to below two-thirds of the full well depth. For exposures with DITs that are within a factor of a few of the minimum DIT the well depth is reduced by a factor of approximately two because of the readout overhead. 5.1.4 Cameras The characteristics of the cameras of CONICA are described in Table 5-3, in terms of plate scale and field-of-view. Each camera has a corresponding field mask that is automatically set by the instrument software. The scales and relative errors for the S13 and S27 SW cameras were measured by B. Sicardy using Pluto's motion against field stars, using an accurate Pluto ephemeris. The errors are 1-sigma, i.e. 68.3% confidence level, obtained by χ2 tests, with 13 stellar trails for S13 and 31 stellar trails for S27. These numbers agree well with the previously measured values using galactic centre data (R. Schödel, Ph.D. Thesis). (S54: C. Lidman). Table 5-3: List of available Cameras with plate scales, fields of view and wavelength ranges. Camera S13 Scale [mas/pixel] 13.221±0.017 FoV [arcsec] 14×14 Spectral Range [microns] 1.0-2.5 S27 27.053±0.019 28×28 1.0-2.5 S54 54.50±0.10 56×56 1.0-2.5 L27 27.19 28×28 2.5-5.0 L54 54.9 56×56 2.5-5.0 27 User’s Manual 5.1.5 VLT-MAN-ESO-14200-2761 Filters All but one of the CONICA filters (Section 5 and Table 5-5) are mounted on two filter wheels. Transmission curves of several filters are given in Section 8.1. The J band filter is mounted on a third wheel that also contains the Wollaston prism and the wire grids, so J-band polarimetric observations are not possible with NACO. In this manual filters with central wavelengths longer than 2.5 microns will be referred to as LW filters and filters with wavelengths shorter than 2.5 microns will be referred to as SW filters. Not all filter and camera combinations are supported. For the S13, S27 and S54 cameras, all SW filters can be used. For the L27 camera the NB_3.74, NB_4.05, Lp and Mp filters can be used. For the L54 camera, only the NB_3.74 and NB_4.05 filters can be used. Observations with the Mp filter are restricted to a FoV of 14ʺ″×14ʺ″, corresponding to a detector window of 512×512. The FoV is smaller in Mp than in other LW filters because the background in Mp is considerably higher: the integration time has to be reduced which can only be done by windowing the array. However, Mp observations also require chopping that is currently not offered. Exceptionally and through a waiver and setup change requests in VM only, Mp imaging can be requested/attempted for bright sources for which an acceptable SNR can be achieved with extremely low integration time (256x256 windowing and therefore only 7”x 7” FoV) with dithering but no chopping. Information on the CONICA’s broadband filters can be found in Table 5-4 and for narrow and intermediate band filters in Table 5-5. Table 5-4: CONICA Broad Band Imaging filters Name J H Ks Lp Mp λc [µm] 1.27 1.66 2.18 3.80 4.78 FWHM [µm] 0.25 0.33 0.35 0.62 0.59 Max. Transmission [%] 78 77 70 95 91 28 User’s Manual VLT-MAN-ESO-14200-2761 Table 5-5: List of narrow and intermediate band filters Name λc FWHM Max. Transmission [%] [µm] [µm] NB_1.04 1.040 0.015 62% NB_1.08 1.083 0.015 65% NB_1.09 1.094 0.015 64% NB_1.24 1.237 0.015 60% NB_1.26 1.257 0.014 60% NB_1.28 1.282 0.014 67% NB_1.64 1.644 0.018 47% NB_1.75 1.748 0.026 72% NB_2.12 2.122 0.022 55% NB_2.17 2.166 0.023 52% NB_3.74 3.740 0.02 92% NB_4.05 4.051 0.02 89% IB_2.00 2.000 0.060 68% IB_2.03 2.030 0.060 64% IB_2.06 2.060 0.060 66% IB_2.09 2.090 0.060 62% IB_2.12 2.120 0.060 59% IB_2.15 2.150 0.060 60% IB_2.18 2.180 0.060 61% IB_2.21 2.210 0.060 58% IB_2.24 2.240 0.060 57% IB_2.27 2.270 0.060 51% IB_2.30 2.300 0.060 55% IB_2.33 2.330 0.060 54% IB_2.36 2.360 0.060 56% IB_2.39 2.390 0.060 53% IB_2.42 2.420 0.060 52% IB_2.45 2.450 0.060 57% IB_2.48 2.480 0.060 53% * IB_4.05 4.05 - Additionally, there are two neutral density filters: ND_Long, which can only be used with LW setups and ND_Short, which can only be used with SW setups. These filters are mounted in another wheel, so they can be used in parallel with other filters to reduce the flux of extremely bright sources. The intensity of sources is reduced by factors of 80 and 50 for the ND_Short and ND_Long filters respectively (Transmission curves are given in Section 0). *IB_4.05 was decommissioned due to a non-recoverable defocus issue and therefore it is not offered from P87 onward. Please, use NB_4.05 instead. 29 User’s Manual 5.2 VLT-MAN-ESO-14200-2761 Imaging Imaging uses different combinations of filters, and cameras. 5.2.1 Calibration Plan for imaging For imaging observations a variety of calibration frames will be taken, archived and updated at regular intervals. The details are described in the NACO Calibration Plan. o Nightly zero points (provided it is clear) in J, H and Ks with the S27 objective and visual dichroic. Zero points in Lp and Mp with the L27 objective, and zero points in the J, H and Ks filters with either the S13, S27 or S54 objectives, other dichroics and readout/detector modes, will be taken when these modes are used under CLR or PHO constraints. These calibrations aim to provide a photometric accuracy of 5%. Users needing higher accuracy should provide standard star OBs that will be executed either immediately before or after their observations. The time spent doing user-supplied observations will be charged to the user. o Extinction coefficients for J, H and Ks filters. The observatory does not measure extinction every night. Instead, the observatory has calculated the average extinction from data that have been taken since operations began (E. Mason et al., Paranal NIR Extinction Coefficients, in the Proceedings of the 2007 ESO Instrument Calibration Workshop, p 439-442, Springer) o Internal lamp Flat Fields are taken for every setup observed during the night. Weekly J,H,Ks/S27/DCR sky flat fields are taken in Double_RdRstRd for instrument checks. Long wavelength flats (Lp, NB_3.74, and NB_4.05) will be taken on sky, but only when observations with the corresponding set-up are executed during the night. Twilight sky flats in any other modes are only supported in VM. o Detector darks in all readout modes and DITs as required. 5.2.2 Pipeline for imaging The NACO_img_obs_AutoJitter and the NACO_img_obs_FixedSkyOffset templates are supported by the pipeline. The NACO_img_obs_GenericOffset is only partly supported. Sequences of observations with offsets larger than the field of view (mosaicking) are not reduced by the pipeline. The pipeline also calculates zero points and Strehl ratios for data taken with the NACO_img_cal_StandardStar template, read out noise from detector darks, and it creates master twilight flats, master lamp flats and master dark frames. 5.2.3 noAO : “speckle” imaging From P86 onwards, an open-loop imaging mode with NAOS-CONICA has been offered. Associated with hardware windowing and fast readouts (Cube Mode (Section 5.7)), it allows the user to apply various speckle interferometry techniques. Some tests were carried out recently with NaCo and gave nice results using the following “poor man’s AO” techniques: - simple shift and add (SSA) or weighted shift and add (WSA) methods yielding Strehl of ~1040% (Ks-band) - speckle masking image reconstruction a la Weigelt (1977, Opt.Co., 21, 55) allowing a very high Strehl ratio but on a small field (adapted to not so extended sources, multiple systems, etc.). speckle holography (Petr 1998/ApJ, Schödel 2013/MNRAS) allowing very precise astrometry over a somewhat large field of view (Figure 5-4, lead R. Schödel, [email protected]). 30 User’s Manual VLT-MAN-ESO-14200-2761 Figure 5-3: Some results of the speckle masking experiment (Rengaswamy et al 2010) applied on a 0.16” separation binary star. Comparison between the reconstructed intensity map (bottom left) and the closed-loop AO image (bottom right) is given. Seeing conditions were excellent for this test. Figure 5-4: Speckle holography technique applied to the NGC3603 cluster. The holography image on the right is nearly as deep as the AO-corrected one on the left (the 3-sigma detection limit is ~Ks= 18 in both cases). However it is advantageously more suitable for astrometry as every single star of the field appears in its true position, unaffected by AO-induced distortion effects. The holography PSF itself is very clean, diffraction limited with a K-band Strehl ratio reaching 65%, about 2.5 times superior to the closed-loop PSF which suffers an obvious waffle-mode pattern. 31 User’s Manual VLT-MAN-ESO-14200-2761 If you are interested by this mode, just consider the cube mode and its overheads. We made simpler templates for not having to close the loop: NACO_img_acq_MoveToPixelNoAO NACO_img_obs_GenericOffsetNoAO No .aocfg file has to be created via JNPS and the overheads are hence smaller. To be conservative, one can use the overall execution time of an AO+cube OB and remove 5 minutes. Overall the acquisition template takes approximately 420 seconds (value used in p2pp). The science template is identical to the classical NACO_img_obs_GenericOffset one in terms of timing (using cube=T). This mode is offered in service but no pipeline is offered as experts can apply whatever techniques they like. It is recommended to not observe stars fainter than J=7 (if observations carried out in J) for an exposure time of ~40 ms (typical example using a 254x256 sub-array). Users have to provide their own photometric standard(s) as the calibration plan does not take this mode into account and photometric precision is subject to the technique used. This mode is offered in SM but it is more appropriate to VM to adapt the DIT/NDIT and observing strategy. For the speckle holography, tests have been carried out using either 512x514 0.2s DIT or 1024x1026 0.35s DIT. They allow one to reach K~18 (see Figure 5-4). 5.3 Coronagraphy For coronagraphic applications, a brand new annular groove phase mask (AGPM), synthesizing an optical vortex coronagraph tuned for Lp band operation (including NB_3.74 and NB_4.05) has been recently installed and successfully validated. The available masks and their characteristics are listed in Table 5-6 Table 5-6: CONICA’s masks and phase plates for coronagraphy. Name AGPM Diameter NA Comments Annular Groove Phase Mask synthesizing an optical vortex coronagraph for Lp band (0”.1-7”.5, 360º FoV) Since P93, only the AGPM is only offered in PT and VM. No photometric standard stars will be taken as part of the calibration plan (even for CLR conditions) unless provided by the users. Since P91 it is allowed to use detector windowing with coronagraphy. Windowed coronagraphic observations may result in overly compromised fields of view. See the images linked to http://www.eso.org/sci/facilities/paranal/instruments/naco/inst/corono.html for guidance. . 32 User’s Manual 5.3.1 VLT-MAN-ESO-14200-2761 Annular Groove Phase Mask coronagraph (AGPM) Following a recent proposal led by the University of Liege (AGPM proposing team: O. Absil, D. Mawet, J. Girard, A. Boccaletti, P. Baudoz, C. Delacroix, P. Forsberg, M. Karlsson, S. Habraken, J. Surdej, and M. Kasper), a successful implementation and validation tests, the NACO IS team is happy to offer a new-generation high performance coronagraphic mode for NACO. The Annular Groove Phase Mask coronagraph (AGPM, Mawet, Riaud, Absil, Surdej 2005, ApJ 633, 1191-1200) is an optical vortex made out of diamond subwavelength gratings. The optical vortex coronagraph is one of the most advanced new-generation coronagraphs recently brought to operational level (Mawet et al. 2012, SPIE 8442). Optical vortices occur when the phase structure of light is affected by a helical ramp around the optical axis, forcing the amplitude to zero at that singular location (nature prevents the phase from having an infinite number of values at a single point in space, which is non physical, by simply nulling the light locally). When centered on the diffraction pattern of a star seen by a telescope, optical vortices affect the subsequent propagation to the downstream Lyot stop by redirecting the on-axis starlight outside the pupil. Vortex center d = 15” FoV Figure 5-5: left, scanning electron microscope (SEM) image of the AGPM center, and corresponding cross-cut. It shows the fine microstructure patterned at the subwavelength scale (Delacroix et al. 2012, Appl. Opt. 51, 5897). Right: raw CONICA image of the sky background through the AGPM in Lp band and L27 camera, showing the clear 15” aperture, and the vortex center, located slightly off the intersection of CONICA’s quadrants. The advantages of the AGPM coronagraph over classical Lyot coronagraphs or phase/amplitude apodizers (such as the APP) are: • Small inner working angle (IWA), down to the 1-λ/D diffraction limit (~0”.1 at Lp) • Clear 360º off-axis FoV/discovery space, up to an outer working angle of 7”.5 (15” FoV) • Achromatic over the entire Lp band (hence compatible with NB_3.74 and NB_4.05) • High throughput (~88% measured) The other side of the coin is sensitivity to image quality/Strehl ratio (as all coronagraphs. It is also sensitive to pointing/centering errors. Indeed, to maintain its high contrast capabilities (< 1:100 on the peak, i.e. below the limit imposed by the wavefront quality/SR), the centering of the star on the AGPM must be within (λ/D) / 10, or ~10 mas (~ third of a pixel at L27). Such a centering capability is now routinely obtained with NACO, both in pupil and field tracking modes. If a target 33 User’s Manual VLT-MAN-ESO-14200-2761 transits very close to zenith (dec ~-24 +/- 10), you might want to fractionate your OB so that a manual recentering of the star is possible every ~5-10 minutes. 5.3.1.1 Contrast of the AGPM As pointed out above, the raw contrast will be limited by image quality and pointing errors. Under average seeing conditions (~1”.0), and for reasonably bright stars yielding Lp Strehl ratio between 70 and 80% (cf. NAOS-PS), the raw contrast will be around ~50 on the brightest peak (see Figure 5-6). The direct benefits of such a starlight attenuation capability are the following: • The saturation limit are decreased by ~ 4 magnitudes. • The level of static speckles pinned to the pupil is decreased accordingly (lower speckle noise). • In the stellar photon noise limited regime (close to the center), the contrast limit is improved by roughly 2 magnitudes. L’ PSF (APO_165) L’ AGPM residuals (~50:1) 0".5 0.0000 0.0050 0.0100 0.0150 0.0200 0.0250 0.0300 0.0350 0.0400 0.0450 0.0500 Figure 5-6: left, saturated PSF with a DIT of 0.05s. Middle: residual after the AGPM coronagraph (DIT of 0.2s), displayed at the exact same linear scale. Note the attenuation of the peak brightness, the diffraction pattern, and the speckles pinned to the PSF (including the spiders), showing the threefold benefits of coronagraphy. Right: contrast curves, showing the PSF, the RAW azimuthally-average intensity, as well as the 5-σ final contrast after LOCI/PCA-type speckle subtraction on a typical but short ADI sequence (30º PA variation, 200 s of total exposure time on source). The purple curve shows the limit for larger PA variations. The background limit, reached here at 0”.4 will be lower for brighter targets and/or longer integration times (see NACO ETC). 5.3.1.2 Observing strategy To stabilize speckles on the science camera CONICA, we force the use of the pupil tracking mode. It allows the angular differential imaging (ADI) strategy to be used (or not, i.e. frames can always be simply derotated), which is perfectly adapted to the circular symmetry and 360º FoV of the AGPM. Pupil tracking is also useful to enable maximum contrast capability as well as minimum background contamination from the telescope obstructing structures (mainly M2, and associated support structures, see Figure 5-7). 34 User’s Manual VLT-MAN-ESO-14200-2761 Figure 5-7: comparison between standard Full Oversized stop, showing the VLT pupil and the Apo_165 stop. The latter is used with the AGPM and hence requires pupil tracking mode. It covers the diffraction and thermal emission from both the central obscuration (M2) and the support structures (spiders), making the AGPM more efficient. 5.3.1.3 Inner working angle capabilities of the AGPM The AGPM has been designed to provide exquisite IWA capabilities as is demonstrated in Figure 5-8. The theoretical IWA of 1 λ/D (1 resolution element, corresponding to ~ 100 mas at Lp) has been measured in the lab prior to installation (Figure 5-8, left). A representative technical test was performed on an old main sequence standard star (V~7, Lp~6), under ~1”.2 visual seeing conditions (yielding a 70-80% SR at Lp). An ADI sequence was obtained with a PA range of 30º and for a total exposure time of 200 s on source. The result is presented in Figure 5-8 (right). By pure chance, a ~1:100 off-axis companion (likely a late-type star) was discovered at ~0”.19 (< 2 λ/D), demonstrating the best contrast/IWA capability ever obtained by NACO.1 Figure 5-8: Inner working angle (IWA) capabilities of the AGPM, as measured in the lab (left, Delacroix et al. 2013, in preparation) and as demonstrated on sky on a standard star under median-to-bad seeing conditions (right, Mawet et al. 2013, A&A). 1 SAM (see Section 5.5) can provide an IWA down to ~0.4 lambda/D but with contrast of just a few (<5) magnitudes). 35 User’s Manual VLT-MAN-ESO-14200-2761 IMPORTANT NOTE/WARNINGS: • For somewhat faint stars (Typ L > 7.5) the AGPM isn’t really useful. The raw attenuation (~40) brings the star flux to < 200 ADU per pixel when the star is correctly centered behing the mask, making the precise centering difficult. The AGPM overheads in addition make the mode less efficient than normal L’-band imaging. • Since the AGPM is transparent down to its very center, the location of the star can be known at any time more precisely than in the saturated regime or, of course, in Lyot coronagraphy, easing astrometric measurements. • Depending on the brightness of the target, saturation will occur when off-axis and during acquisition. It is therefore recommended to use the ND_long for the acquisition. • Photometric standard stars will not be taken in Service Mode (even for CLR conditions) unless OBs are provided by the users using this same template (see the P93 Calibration Plan). • No imaging flats will be taken in Service Mode (even for CLR conditions) unless the users specify it in their ReadMe file (P93 Calibration Plan). References: 5.3.2 • Mawet et al. 2005, ApJ 633, 1191-1200 • Delacroix et al. 2012, Appl. Opt. 51, 5897 • Delacroix et al. 2013 A&A, 553, 98 / Mawet et al. 2013, A&A, 552, L13 Calibration plan for coronagraphy o Detector darks in all readout modes and DITs. o No photometric standard stars will be observed unless the OBs are provided by the users. 5.3.3 Night flat fields for LW coronagraphy: AGPM flat field: lamp flat fields are not taken at Lp band. Instead, at least a few sky frames can be used to generate a map (flat field) of the coronagraph (useful for dust/imperfections mapping). 5.3.4 Pipeline for mask coronagraphy Coronagraphic observations are not supported by the pipeline. 5.4 Polarimetry: VM only since P93 An MgF2 Wollaston prism is available for imaging polarimetry, as well as a turnable half-wave plate. The latter is installed in the entrance wheel of CONICA, where the calibration mirror is situated. Internal calibrations with the half-wave plate are thus impossible. 36 User’s Manual VLT-MAN-ESO-14200-2761 The Wollaston splits the incoming light into ordinary and extraordinary beams. An image taken with the Wollaston prism will contain two images of every object. To avoid sources overlapping, a special mask, consisting of alternating opaque and transmitting strips, can be inserted at the focal plane. In a single exposure, at least half the field will then be missing, so that three exposures, with telescope offsets in between, are required to image one field. Sample flat fields with the special polarimetric mask in the focal plane are available from the NACO web pages. To measure the Stokes parameters and hence the degree and position angle of polarisation, a second set of images with the Wollaston prism rotated by 45 degrees with respect to the first pair is required. This can be achieved either by rotating the entire instrument or by taking data with the half-wave plate rotated by 22.5 degrees compared to previous data. The beam separations for the different cameras and as a function of wavelength are given in Table 5-7. The wavelength dependence of the beam separation shows that from 1 to 2.5µm the Wollaston prism can be used for broadband application without loss of spatial resolution. Within the K-band, for example, the resulting chromatic error is about 86 mas. The Wollaston can also be used with the LW filters; however, the beam separation is less and there is slight overlap between the ordinary and extraordinary beams. At larger wavelengths is best to use narrow band filters. No Mp band observations are offered with polarimetry. Table 5-7: Beam separation of the Wollaston-prism on the sky [arcsec] and in pixels as a function of the camera. Wavelength [µm] Separation [arcsec] Camera Separation [pixels] 1.65 (H) 3.38 S13 260 S27 126 S54 62 2.2 (K) 3.30 S13 254 S27 122 S54 61 3.8 2.97 L27 110 L54 55 4.0 2.91 L27 108 L54 54 Since the J-band filter is in the same wheel as the Wollaston prism, J-band polarimetric observations are not possible. The transmission curve of the Wollaston is shown in Figure 5-9. 37 User’s Manual VLT-MAN-ESO-14200-2761 Wollaston Prism Transmission [%] 100 90 Transmission [%] 80 70 60 50 40 30 20 10 0 0.5 1 1.5 2 2.5 3 3.5 4 4.5 5 5.5 Waelength [microns] Figure 5-9: Transmission as a function of wavelength for the Wollaston prism. The big absorption feature at 3.4 microns is due to the resin material. The instrument-induced polarisation, as for all Nasmyth instruments, is a function of the parallactic angle; it is generally of the order of 2%, but can be as high as 4%. If users do not take care in determining the instrument-induced polarisation, then it is not possible to get meaningful estimates of the polarisation, unless sources are more than 3% polarised. In general, we recommend that users come as visitors if they wish to measure the polarisation of sources that are less than 5%. For more details, we recommend the following reading: Witzel et al. 2011, A&A 525, A130. 5.4.1 Calibration plan for polarimetry For polarimetric observations, a variety of calibration frames will be taken, archived and updated at regular intervals. The calibrations are described in detail in the NACO Calibration Plan. o Twilight flats as described in Section 5.2.1. Twilight flats are done without the polarimetric mask and without the polarizer. However in visitor mode, twilight flats with the half-wave plate can be requested. Internal lamp flats are taken with the Wollaston prism as part of the Calibration Plan (VM only since P93) but without the HWP (since the lamp mirror needs to be inserted). o Detector darks in all readout modes and DITs. 5.4.2 Pipeline for polarimetry Polarimetry is not supported by the ETC or the pipeline. 5.5 Sparse Aperture interferometric Masks (SAM): VM only As part of the original design of the CONICA camera, provision was made for the possibility of utilizing aperture masking interferometry in order to obtain the very highest angular resolutions at the diffraction limit. Following highly successful demonstrations of the technique elsewhere, both in the AO-corrected and non-AO case, a proposal was submitted to ESO to install custom-fabricated aperture masks into the pupil wheel of CONICA. SAM was commissioned in March 2008, after a first attempt in Feb. 2007 adversely affected by bad weather, by the PI Peter Tuthill (School of Physics, Sydney University) and his Co-I Sylvestre Lacour (University of Grenoble, now at Paris 38 User’s Manual VLT-MAN-ESO-14200-2761 Meudon Observatory). The results reported in this manual are taken from their commissioning report. The design of aperture masks for a telescope needs to take into account several complicating factors. For a given observation, there are trade-offs between various parameters, which means that a range of different masks can be used in order to tailor the experiment to somewhat varying targets and science. The factors relevant to mask design include: The desired Fourier coverage (especially the shortest & longest baseline required) The bandwidth of the optical passband to be used for observations The apparent brightness of the target star The readout noise properties of the detector The degree of correction provided by the AO system In order to span a promising range of observational parameter space, five masks were fabricated and the physical properties of the masks is illustrated in Figure 5-10. They were fabricated by precision laser machining onto 0.2 mm steel stock. The outer diameter of the final masks was 20 mm to fit within the CONICA pupil wheel slots. Figure 5-10: Mechanical drawings of the four aperture masks installed in the CONICA camera. In general, the more holes appear in the mask, then the smaller the holes must be (to preserve non-redundancy) and consequently the less light that is passed by the mask. The mask to the left shows the 18holes configuration which yields excellent Fourier coverage, but which does not pass a large fraction of the incident light. In order to access successively fainter targets, the 9 and 7 holes configurations may be used, although the Fourier coverage becomes markedly worse. There are two different 9-hole configurations: 9holes and BB_9holes. The distinction between these two being that the simple “9holes” offers superior Fourier coverage and slightly higher throughput, but is not suitable for large fractional bandwidth observations. For bandwidths wider than about 10-15%, the “9holes” mask is unsuited and the “BB_9holes” should be used. The two-dimensional layout of the holes specifies the Fourier coverage afforded by the given mask. This was optimized with a computer parameter space search algorithm that follows from and extends the work of Golay (1970 JOSA 61 272). Exact locations of the holes cut for each mask, together with all relevant dimensions and specifications of the physical masks themselves, have been provided in the NACO SAM web pages: http://www.eso.org/sci/facilities/paranal/instruments/NACO/inst/mask_datasheet.html A scaled illustration depicting the optical effect of the masks as projected onto the correctly scaled VLT telescope pupil (assuming ideal optical alignment) is given in Figure 5-11. The large circumscribed circle represents the outline of the VLT primary mirror, while the smaller centred circle shows the silhouette of the secondary mirror. It is important to note that the spiders, which support the secondary mirror, are not depicted here, but they have an important effect which will be discussed later. 39 User’s Manual VLT-MAN-ESO-14200-2761 Figure 5-11: Optical diagrams showing the effect of apodizing the pupil with the four 2-dimensional masks implemented in the CONICA camera. 5.5.1 SAM: why and when to use it Masking is useful for very narrow fields of view (the outer limit is set by the resolution of the shortest baseline in the mask). Any advantages it enjoys over conventional full-pupil imaging are only manifest at such very high resolutions – typically within several resolution elements of the PSF core. In the infrared, this typically means that the scientific niche is for objects where the entire field of interest lies within several hundred milli-arcsecs from a bright star. (Although there may be ways to mosaic larger fields together, these have never been successfully demonstrated). Key strengths of a dilute and (ideally) non-redundant pupil are in the mitigation of atmospheric phase noise (seeing) and the use of robust, self-calibrating observables such as the Closure Phase. For brevity, we refer the reader to the references (Section 5.5.10) for discussion of the philosophical underpinnings that motivate masking interferometry. Masking is furthermore (by its nature) limited to brighter classes of targets. This is because it is only effective at combating atmospheric phase noise – seeing – and it is counterproductive in photon-starved regimes where detector readout noise dominates. Earlier experiments with seeinglimited telescopes (before the advent of AO) in the near-IR had a magnitude limit of about 5th mag in K-band. With NACO we estimate that the useful magnitude limit for some types of observations could be as faint as 10-12th mag, depending on the level of correction obtained. Here, we limit our discussion to two basic types of observation: (1) imaging and (2) faint-companion detection. For both of these modes, masking interferometry has demonstrated levels of performance that match or exceed those obtainable by any other means. Further discussion of these strengths can be found in the sections below detailing the on-sky performance obtained with SAM at NACO. 5.5.2 Pupil tracking with SAM One additional aspect of experimental implementation that was requested in advance was the ability to drive the optical rotator and telescope control system in such a fashion that the image of the pupil within the CONICA camera is maintained fixed at a given orientation while the telescope tracks and slews to different stars. This “pupil tracking mode” is crucial for experiments such as aperture masking, where the occultation of one of the mask holes by the telescope spiders will cause highly detrimental loss of Fourier coverage and compromise the calibration properties of the experiment. Furthermore, for observational programs relying on precision calibration, it is simply good practice to preserve the optical system in a stable configuration between source and reference star. Although simple in principle (the rotator simply has to track the elevation axis, ignoring the azimuth axis), in practice such a mode can take some effort to fully implement as software driving the pointing, tracking and guiding systems, together with the AO system, all needs to understand the implications of the new sky rotation. 40 User’s Manual VLT-MAN-ESO-14200-2761 Pupil tracking mode is the default way to observe with SAM and is implemented in a transparent way for the users. The masks have 120 degrees symmetry, while the telescope spiders have 180 degrees symmetry. In theory it should be possible to find 6 angles at which no overlaps between spiders and mask holes occur and use these 6 setups to observe with the pupil at different orientations: this technique allows avoiding the spider arms falling onto unwanted areas of the detector and achieving the highest possible dynamic range. However, the telescope pupil and NACO are not perfectly aligned, and only one angle per mask has been found suitable for use. 5.5.3 Detector readout and cube mode setup for SAM For bright targets, the dominant noise term is in the perturbations from the turbulent atmospheric phase screen. Rapid readout of the detector array tends to freeze the motion of the interference fringes, reducing the impact of the seeing on the measured coherence of the incoming wavefront. Thus seeing drives us to read as many rapid-exposure frames as possible, but this needs to be traded off against detector readout noise, which will rapidly dominate for fainter stars. CONICA is ideally suited as a masking camera because it offers a readout mode (DCR/HD) for collecting data cubes of consecutive frames of any given integration time with minimal overheads and high duty cycle. These data cubes typically consist of hundreds of short-exposure (0.1 sec) frames for bright targets, or perhaps a few tens of longer exposure frames (1–10 sec). More details on cube mode can be found in Section 5.7. Given the very small useful science field-of-view, it is generally not necessary to read the entire 1024 pixel array. In fact, normally only a 256x2581 pixel region would be sufficient. In addition to saving on data storage, the smaller sub-arrays can be read out faster and with a lower-noise readout strategy. Arrays of size 1024, 512 and 256 can be read out in 0.34, 0.11 and 0.04 seconds, respectively (in Double_RdRstRd). Other windows, such as 128×130 and 64×66, are too small to contain the SAM patterns and are not to be used. Although for some of the brightest targets, there may be good arguments for pursuing a 256x258 sub-array, the 512x514 sub-array is recommended. The main advantage of this is that the image of the science target can be dithered between two separate quadrants on successive data cube integrations. Thus while collecting data in one quadrant, one collects a sky background frame in another quadrant at the same time. 5.5.4 SAM with LW filters Operation in the 3-5 µm region, using the long-wavelength filters offered within CONICA, is straightforward. This was commissioned using the L27 camera, which adequately samples the fringes, and has optical components optimized for this region. For the shorter wavelength operation, only the S13 was used – again to ensure adequate sampling of the fringes. Special strategies such as chopping to remove sky fluctuations are generally not essential for longwavelength aperture masking. One reason is that the masks themselves dramatically cut down the sky background (and stellar target) by a factor ranging from 84 to 96% depending on the mask. Furthermore, thermal anisotropies in the sky tend to be smooth and slowly varying, with little finegrained structure on scales of tens of milli-arcsec where the interference fringes from the masking are formed. 1 Hardware windowing with the CONICA array requires NY=NX+2, where NX and NY are the number of pixels in X and Y respectively. 41 User’s Manual 5.5.5 VLT-MAN-ESO-14200-2761 Choosing which mask to use The philosophy of aperture masking taken to the extreme would suggest a mask with many tiny holes, each of which makes an almost point-sample of the incoming wavefront. Such a mask would pass very little light, and be useless for all but extremely bright targets. With only 4% throughput, the 18Holes mask is the nearest approximation to this ideal in CONICA, with the other masks having fewer but larger holes, and passing increasingly more light up to a maximum of 16% for the 7Holes mask. Masks with many closely spaced holes also suffer from a second problem: that of bandwidth smearing. Using a wide optical bandwidth filter, the fringes formed between a pair of holes will occupy a range of spatial frequencies proportional to the bandwidth. This can mean that power from neighbouring baselines can smear into one another, confusing the signals. In general, this means that masks with many holes must also be used with the narrowest bandwidth filter sets. In terms of optical throughput, this therefore gives a double-penalty. The use of the more closely “ideal” masks (many tiny holes) is therefore restricted to quite bright targets. The primary determinant for which mask to choose in any given situation is the brightness of the stellar target. For bright targets, try for a mask with many small holes (18Holes). For faint targets, a mask with fewer large holes and the ability to observe in the broad filter sets (e.g. BB_9Holes) is likely more optimal. There can also be secondary issues motivating the choice of a mask. In general, to get enough Fourier coverage to do good mapping of a complex structured target, one should push for a mask with more holes and short minimum baselines to extend the field-of-view. Furthermore, some observations may be needed in specific narrowband filters, or with special setups, and so mask choice can be a complex optimization. The four commissioned masks are now briefly described in turn. More detailed specifications and hole layouts are given in Section 5.5.9. 18Holes: this mask can only be used with the narrow and intermediate (NB, IB) filter sets. Useful range is targets brighter than about 4th Mag. Excellent Fourier coverage for imaging, and should also serve well for faint companion detection. 9Holes: this mask is designed for use with the NB and IB filters, although it may be marginally OK with broadband filters such as Ks, Lp, or Mp. Useful range is from about 3rd to 7th Mag (fainter if bandwidth smearing is not an issue). Gives very good Fourier coverage, and could be used for mapping relatively simple objects. Good for faint companions. BB_9Holes: this mask was specifically optimized for broadband (hence BB_) operation, and should be used with the broad filter set. Although bandwidth smearing is unavoidable, this mask is not affected because the holes are arranged so that they do not smear into each other. Useful range of target brightness is about 5th to 10th. Fourier coverage is not as good as 9Holes. 7Holes: this mask passes the most light, and should operate from about 8th to 11th or maybe 12th mag. Probably it is most useful for faint companion detection due to limited Fourier coverage. 5.5.6 Calibrations: flat fields and data cleaning Data processing entails all the normal imaging data tasks such as subtraction of any bias, flat fielding and removal of bad pixels. To obtain flats and bad pixel maps, the standard NACO calibration plan and pipeline recipes are fine. Results using the standard pipeline reduced flats were compared with flats generated by hand, with the finding that there was no significant difference. Normally, masking data will be taken in a data cube mode, which yields a large sample of the interferograms (up to several hundred frames). A further data cleaning strategy is based on frame selection over this data cube: any frames with poor AO performance or any other strange effects are 42 User’s Manual VLT-MAN-ESO-14200-2761 rejected. This can be easily achieved by cutting the data according to outliers in simple statistical tests on quantities such as the counts in the peak pixel, the total counts, etc. 5.5.7 PSF calibrations strategies As with all forms of optical interferometry, it is paramount to preserve a focus on calibration. To do this, it is suggested to bracket observations of the science target with observations of a nearby point-source reference object. Ideally, this reference star will be an unresolved point (or if not, at least a single star of well-known size). Good calibration is helped by observing the reference star(s) at similar airmass and observed with as near-identical telescope/AO configuration as possible. To this end, the SAM template will use the “PSF” flag to keep the AO configuration the same as the one used for the previously observed science object. The pupil position is kept identical, since science and calibrator are observed with the same mask, and each mask has its own assigned pupil angle. Finding reference stars is straightforward, but does take some work and it may help to consult some local interferometrists, or interferometry web resources (some institutions such as the Michelson Science Centre have calibrator-finding catalogue search engines available online). For the case of CONICA, the resolutions are relatively modest so almost all single stars of any spectral type will present photospheres that are essentially unresolved (with the exception only of a handful of extremely bright, red late-M supergiants and Miras). This being the case, a good calibrator is then any star which is single and without an extensive circumstellar dust shell (or if binary, has a relatively wide companion of at least several arcsec). An attempt should be made as far as possible to preserve the same AO parameters between source and calibrator star. If using the visible wavefront sensor, this can present difficulties, because often science targets will be very red or dusty (to give resolved structure). Finding calibrator stars for such extreme-spectrum objects can be challenging. If we consider an object such as WR 104, which is 14th mag in V but 2nd mag in K, then any normal star with similar IR fluxes will be orders of magnitude too bright for the visible WFS at the same settings. For such targets, it may be necessary to use the IR WFS. Calibration is further enhanced by taking more rapid exposures, removing the effects of seeing and irregular AO correction from the data. There are compelling reasons to make multiple visits between the source and calibrator. This will help to beat down the random noise and explore any systematic term in the calibration. Furthermore, Fourier coverage will be enhanced by the sky rotation obtained between successive visits. This is helpful for imaging, but even more crucial for faint-companion detection. The regular sampling grid on which the Fourier data is recorded permits some ambiguity when only a single snapshot is recorded. Wide binaries can masquerade as much closer companions and give false signals. Taking a second or even third visit to an important target helps to eliminate these problems. 5.5.8 SAM imaging tests For the imaging tests given here, the 18Holes mask was used. This gives the best Fourier coverage and well-sampled short and long baseline data. This means it is well suited to imaging of complex targets, but of course this mask is the least sensitive and so only relatively bright targets are shown here. Imaging using the 9Holes or other masks may be possible, but the more limited Fourier coverage will limit the complexity of targets that can be mapped well. One way to help circumvent this problem a little would be to observe the object over a period of several hours, with visits alternating between the source and calibrator. This would help build Fourier coverage by Earth rotation synthesis. 43 User’s Manual VLT-MAN-ESO-14200-2761 In general, errors on the visibilities produced by masking are large. The Fourier amplitude data is therefore quite poor. A large fraction of the success of the images depicted in this section is due to the relatively good Closure Phase data. This is an important point to keep in mind, because many targets that one might wish to image do not show large closure phase signals at all. Closure phases arise in situations where the source has non-point-symmetric structure, and so objects such as a spherical shell, and elliptical ring, or an equal binary star, will all give closure phase signals which may be weak or zero everywhere, and thus lead to difficulties in producing a good image. 5.5.9 U-V coverage This section contains information on the physical dimensions of the sparse aperture masks placed in the CONICA camera. These values are necessary to compute the u-v coverage of the instrument. Assumptions: o The pupil diameter in the camera is 10 mm. o The clear aperture of the telescope is assumed 8.00m o The central obscuration assumed 1.116 m. o Telescope mirror area = 49.29 m2 Masks manufactured to fit within slots in the pupil wheel 20 mm outer diameter. Each mask is embossed with an identifier and in addition has orientation marks "+" at the centre and towards the edge. Material: .02 mm steel sheet. 1) Mask“18Holes”. Hole size = 0.465 mm diameter Table 5-8: X and Y location of the holes as measured in mm from the centre of the mask 18Holes. X -0.203155 Y -3.87061 -0.203155 -4.57435 -1.42208 -1.75937 -3.25047 -0.703745 -3.85992 1.05562 -3.85992 -2.46311 3.45362 1.75936 4.06308 2.11124 2.23470 -0.351874 2.23470 -2.46311 1.01577 -3.87061 4.06308 -2.11124 44 User’s Manual VLT-MAN-ESO-14200-2761 -3.25047 2.11124 -3.85992 2.46311 -0.812615 2.11124 1.01577 3.16686 2.84415 2.81498 -0.203153 4.57435 2) Mask 9Holes”. Hole size = 1.156 mm diameter Table 5-9: X and Y location of the holes as measured in mm from the centre of the mask 9Holes. X 3.50441 Y -2.60135 3.50441 2.60135 2.00252 -1.73423 0.500629 -4.33558 0.500631 2.60135 0.500631 4.33558 -2.50315 -4.00503 -0.867115 -1.73423 -4.00503 1.73423 3) Mask: “BB_9Holes. Hole size = 0.980 mm diameter Table 5-10: X and Y location of the holes as measured in mm from the centre of the mask BB_9Holes X -3.18399 Y 0.0607701 -3.53717 1.49530 0.0805017 4.39864 1.64462 2.72703 3.06355 2.31563 45 User’s Manual VLT-MAN-ESO-14200-2761 3.76908 -2.26903 1.53937 -2.78780 0.473616 -3.81093 -3.84958 -2.12960 4) Mask 7Holes. Hole size = 1.50 mm diameter Table 5-11: X and Y location of the holes as measured in mm from the centre of the mask 7Holes X 3.51064 3.51064 1.56907 1.56907 -0.372507 -2.31408 4.25565 Y -1.99373 2.49014 1.36918 3.61111 4.23566 3.61111 0.248215 5.5.10 References and further reading We have tried to give brief notes on the practical use of the aperture masks in the CONICA camera. When used correctly, these masks transform the single 8-m telescope pupil into a sparse interferometer array, and it is therefore necessary to understand the principles of optical interferometry and in particular the recovery of complex Fourier data (amplitudes and phases) from the Fizeau interference patterns that result. A full explanation of the mathematical techniques necessary to do this task is beyond the scope of the present document. The reader is advised to consult sources form the open literature concerning aperture masking. Some useful references specific to masking include: o Tuthill P.G. et. al. “Michelson Interferometry with the Keck I telescope” PASP 112 555 (2000). o Tuthill P.G. et al. “Sparse-aperture adaptive optics” SPIE 6272 103 (2006). o Lloyd J.P et. al. “Detection of the Brown Dwarf GJ 802B with Adaptive Optics Masking Interferometry” ApJ 650 131 (2006). o Tuthill P.G. et al. “Sparse Aperture Masking (SAM) at NAOS/CONICA on the VLT” SPIE 7735 56 (2010). In brief, masking is useful for very narrow fields of view (the outer limit is set by the resolution of the shortest baseline in the mask). Any advantages it enjoys over conventional full-pupil imaging are only manifest at such very high resolutions – typically within several resolution elements of the PSF core. Dynamic ranges obtained within this realm have been demonstrated to be in excess of 200:1 for point source detections. To attain this level of precision, careful analysis of closure phase signals is required and exhaustive understanding of error sources such as PSF calibration and chromatic effects arising from atmospheric dispersion. Furthermore, with full recovery of closure phase 46 User’s Manual VLT-MAN-ESO-14200-2761 signals, complex and arbitrary flux distributions can be mapped with high fidelity. The particular strengths of aperture masking are for relatively bright targets where there is resolved or partially resolved structure within a few resolution elements of bright PSF cores. The range of masks installed in the camera is intended to span a variety of target fluxes, with the 18-holes mask being tailored to give the best results for bright targets, through to the 7-holes which is for use on the faintest targets. Section 5.5.16 gives calibrations of the counts expected for varying mask/filter combinations. 5.5.11 On sky observations: VY Canis Majoris VY Canis Majoris is a bright M-supergiant which has produced an extensive infrared nebula several arcsec in extent. At the core, VY CMa exhibits a bright asymmetric plume, first imaged in detail in Monnier et al 1999 (ApJ, 512 351). This form of strongly asymmetric structure, together with the spatial structure on ideal scales of less than 200 milli-arcsec, all makes VY CMa an ideal test target for SAM. Figure 5-12 shows images produced in narrowband filters within the H and K bands using 18Holes mask data recorded at the commissioning run in March 2008. For comparison, we also show the results of contemporaneous imaging observations using the full telescope pupil and adaptive optics system. We have taken an identical series of rapid exposures to the masking case, and use the shift-and-add algorithm to stack these data into a final resultant best image. This is given in the bottom panel of Figure 5-12. There is some correspondence between the AO-only and masking images, in that there is evidence for a similarly skewed centre of brightness in the AO image. However, the fine detail and diffraction-limited structures appearing in the masking data cannot be seen in the AO image. It is possible that with deconvolution using a carefully recorded PSF frame that more real structure may be recovered from the AO, but this procedure has proved to be controversial in the past, and can lead to spurious structures. 47 User’s Manual VLT-MAN-ESO-14200-2761 Figure 5-12: Canis Majoris images reconstructed from 18-hole masking data (top) and from a set of shiftand-add stacked full pupil AO frames (bottom). Other examples of scientific results obtained with SAM on sky can be found on the NACO Web pages: http://www.pl.eso.org/sci/facilities/paranal/instruments/NACO/inst/sam.html 5.5.12 Faint companion detection: theory. At first glance the spread-out diffraction pattern generated by the mask, which scatters light over a large region, seems to act counter to the objective of revealing a faint companion buried in the halo. Although there is no way to tell from the image plane whether a companion may be present or not, the key advantage offered by a mask is that it enforces a very high degree of stability on the optical transfer function of the telescope. This stability can be exploited to recover moderate-to-high dynamic range companions at high spatial resolution. A Fourier transform of SAM data will reveal a pattern of regular peaks in the frequency plane (see Figure 5-13 right). Each peak in this complex-number array has an amplitude giving a measurement of the contrast (visibility) of the fringes on that specific baseline, and a phase which is 48 User’s Manual VLT-MAN-ESO-14200-2761 a measurement of the position of the fringes. Before they can be used scientifically, the amplitude measurements need to be calibrated for the average atmosphere/telescope transfer function: this is achieved by the process of observing a nearby reference star as mentioned earlier. Atmospheric turbulence notwithstanding, the normalized amplitude of an unresolved point source star should be 1, and the phase 0. Any value different form 1 (amplitude) or 0 (phase) indicates the presence of resolved structures. These properties were used to achieve the image reconstructions discussed in the previous section. Unfortunately, calibration of the visibility amplitudes is typically not achieved with high precision (performance will vary greatly with conditions but precision better than 5-10% or so cannot be relied upon). Under these circumstances, visibilities add nothing to the faint-companion search and they are discarded. Thus our detection of high contrast companions relies entirely on the phases, or more precisely, on the Closure Phases. These are a better observable because they are inherently selfcalibrating, are not biased by the seeing, and they obey quasi-Gaussian statistics. Figure 5-13: (left) image as obtained on the detector observing a calibrator star with the BB_9Holes mask. (right) Fourier transform of this image, revealing peaks corresponding to the different vector baselines passed by the mask. To give an idea of the behaviour of fringe phase for binary star systems, Figure 5-13 represents the phases as a function of the baseline in the mask. This series of plots was drawn for binary systems with 3 different flux ratios, and 3 different angular separations (for a grid of 9 plots). The maximum baseline available with a mask is 8m, while the minimum is the smallest distance between two holes (e.g. 1.17m for the BB_9Holes mask). As can be seen, the dynamic range of the instrument for faint companions will be directly proportional to the precision with which the phases are measured. To achieve a dynamic range of 100, we need phases with a precision of one degree. To achieve a dynamic range of 10 000, we need phase knowledge to be around 0.01 degree. For high contrast companion detection our goal is simple: extract the phases to fit a binary model as shown in Figure 5-14. There are several ways to do so; here we give one example. The data needed are: the science target data (data cube) and a bad pixel mask and a flat field. We also need to know the effective wavelength λ, the diameter of the holes d and the baselines u. 49 User’s Manual VLT-MAN-ESO-14200-2761 Figure 5-14: Models of fringe phase as a function of the baseline length. A binary system generates phases with a sinusoidal pattern, whose amplitude corresponds to the brightness ratio between the primary and the secondary, while the frequency is proportional to the angular separation. The data reduction steps are: 1. Flat-field the data. 2. Select a 80×80 pixel zone around the PSF (could be more depending on the size of the PSF. An example is shown in the left panel of Figure 5-15. 3. Fit a model of fringes to each image of the cube separately. The frequency of the fringes should be u/λ¸, with an apodization equivalent to the diffraction figure of a single hole (an Airy pattern of size λ /d. See the middle panel of Figure 5-15.). 4. Derive from the phase and amplitude of the fringes a complex value for each frequency u. 5. From these values derive the bispectrum, and co-add it over all the frames. 6. Take the phase of the bispectrum to obtain the closure phase, eventually de-biased from photon noise. 7. Retrieve the phase of the object from the closure phase and fit with binary model. 50 User’s Manual VLT-MAN-ESO-14200-2761 5.5.13 On-sky observations: BD-21 4300 BD-21 4300 is a close unequal binary observed in March 2008. One wavelength dataset consists of 4 batches of 60 images of 1.5 sec integration time each (i.e. a total integration time of 6 minutes). It was observed with the H and K broad band filters and with the BB_9holes mask. Seeing was average, between 0.8 to 1 arcsec. Figure 5-15 illustrates the process of fringe fitting. The left panel is a single CONICA exposure, the middle panel gives the best-fit model image, while the right pane is the residual. We derived the closure phases of the object with the method mentioned in Section 5.5.12, and fitted these data with a binary star model. The free parameters are the position of companion, the flux ratio, and a piston for each sub-aperture. Figure 5-15: Left : CONICA image of a binary star. Centre : best fit artificial fringe pattern giving the Fourier amplitudes and phases. Right: the fitting residual shows the discrepancy between data and model. The parameter space which must be searched for the position of the companion is not necessarily convex, i.e. several minima in χ2 may exist. Therefore, it is necessary to start with a grid search of the entire space before refining the best fit with gradient-descent. The resulting χ2 maps are shown in Figure 5-16. Figure 5-16: χ2 maps showing detection of the binary BD-21 4300. Left: H band data. Right: K band data. The general χ2 minimum is at the same position on the two maps. A clear minimum appears both in the H and K bands. However, note that several other local minima exist. The best fitting result at the global minimum is plotted in Figure 5-17. 51 User’s Manual VLT-MAN-ESO-14200-2761 Figure 5-17: Phases measurement for BD-21 4300 as a function of the baseline length. The solid curve is the best fit of a model of a binary star (Tuthill et al 2010, SPIE 7735 56). Right panel: H band data. Left panel: K band data. The companion position and flux ratio are reported in Table 5-12. Errors on the phases are on average around 0.5 deg in the K band and around 1 deg in the H band. Parameters for the best-fit detection are presented in Table 5-12. The contrast and separation of this companion (4 magnitudes and 90 mas) agree well with the original detection of this companion at Keck (Kraus et al. 2008, arXiv :0801.2387). This companion lies far beyond the detection limit of direct imaging with or without AO. Figure 5-18: Same as Figure 5-17 but with best fit limits reported using a point-source reference star observed in different filters and masks. Left: 9 Holes (NB_2.17). Middle: BB9_Holes (NB_2.17). Right: BB9_Holes (Lp). All give statistically null results for the presence of a binary companion, with best-fit limits reported in Table 5-12. Table 5-12: Results from phase fitting of target BD-21 4300. Separation is in mas Flux ratio Separation K Band 2.8 ± 0.3% 89.8 ± 4.0 H Band 2.4 ± 0.5% 91.3 ± 5.5 52 User’s Manual VLT-MAN-ESO-14200-2761 Table 5-13 False detections on calibrator stars Flux ratio Separation 9Holes (NB_2.17) 0.7 ± 0.2% 152.8 ± 10.4 BB_9Holes (NB_2.17) 0.4 ± 0.1% 100.3 ± 12.5 BB_9Holes (Lp) 0.8 ± 0.3% 88.3± 7.5 5.5.14 On sky observations AB Dor in H and K Figure 5-19: Likelihood for the presence of a secondary star as a function of its position. At maximum likelihood, the flux ratio between the main star and its companion is 1.29+/-0.14% in K band (left) and 1.47+/-0.24% in H band (right). AB Dor was observed between 1h17 and 1h42UT. HD41371 was used for PSF calibration and was observed between 1h54 and 2h12UT. For each one of these targets, the data consist of two data cubes in each band (2.24 µm and 1.75 µm). The cubes are sets of 100 exposures of 2 seconds integration time using a 512×514 windowing of the detector. Seeing was around 1.5”, but AO correction was nevertheless stable, with occasional disruptions. The 9 holes mask was used. Correction for dark, flat-field and bad pixels was applied to our data. An important step was to eliminate exposures where AO correction was unstable. The frequency components (visibilities and closure phases) are then derived. A binary system is fitted to the data, and the likelihood computed. Figure 5-19 gives the likelihood for the presence of a binary companion as a function of its relative position to the star. A good fit was obtained for several different positions, due to the regular Fourier sampling of the u-v plane. Because the minimum spacing between two holes is 1.73 meters, images are obtained with a modulo 1.73/λ rad-1. This corresponds to 208 mas in H and 267 mas in K. By using data from the two spectral bands, it is therefore possible to identify the position of the secondary star. The position is indicated by the two arrows in Figure 5-19. Data fitting also allows derivation of the flux ratio between the star and its companion. These results are summarised in Table 5-14: Table 5-14: result of the observations of AB Dor and its calibrator Star AB Dor AB Dor 53 User’s Manual VLT-MAN-ESO-14200-2761 Wavelength K H ΔRA (mas) -183 +/- 6 -192 +/- 9 ΔDec (mas) 75 +/- 6 77 +/- 8 Relative flux (%) 1.29 +\- 0.14 1.47 +/- 0.24 Delta mag -4.71 +/- 0.15 -4.58 +/- 0.2 The results on AB Dor are in agreement with the results obtained by coronagraphic means, and with results from the literature (see Janson et al. A&A 462 615 2007). Sources of potential errors are: 1) Uncertainty on the orientation on the field of view on the pupil. Aperture masking requires freezing the spider arms in the pupil plane (vertical mode). The field orientation on the detector is therefore changing with time, which requires further sophistication of the software because the recorded data-header values become inaccurate. 2) Uncertainty on the central wavelength due to the spectral type of the target. 3) Uncertainty on the pupil diameter inside the camera filter wheel. These sources of error at present limit the determination of the relative positions to a few percent – a value that should improve with further characterization. 5.5.15 Additional considerations for faint companion detection 1) What is the best mask to use for faint companions detection? It depends primarily on the brightness of the source. If the target is faint (mag > 7), the broadband filters should be used. Therefore, the BB_9Holes mask is recommended (or possibly the 9Holes for fractional bandwidths less than 15%). If the target is bright, the 9Holes mask is recommended, a good compromise between Fourier coverage and throughput. 2) What is the current limit for the dynamic range? We tested the dynamic range of the two 9 holes masks for two different wavelengths: K and Lp. False detections are represented in Figure 5-19 and results are reported in. 3) Table 5-15. This result shows why it is important to have a stringent SNR cut-off of 5σ for detection of binarity. The parameter space being very large, false detection is likely at 1σ. A result of these tests is that we did not reach the 1/500 detection limit that was hoped for. From the data, we are confident we can have 5σ detections with a dynamic range between 100 and 200. The second result is that the principal source of error is a bias in the closure phase signal due to some unknown artefact in the instrument and/or the data reduction. This bias is illustrated in Figure 5-20, which shows closure phases recorded on a given baseline triangle over 400 separate exposures when looking at a point source reference star (which should give zero closure phases everywhere). It is important to note that the mean (red line) does not converge to zero closure phase as more samples are averaged (dashed envelope). Even worse, this bias offset from the true value (zero) can change as the experimental configuration is moved, as illustrated in the right-hand panel where the same star is observed, but with the interference pattern falling on a different location on the CONICA detector. 4) What can be done about it? The bias that can be observed on the phases (see Figure 5-20) does change with the position of the star on the detector. This is why it is difficult to calibrate with a reference star. We are presently investigating the source of this bias and some possible strategies to mitigate it. It may be worthwhile to attempt to put the science and calibrator star at an identical location on the detector. Furthermore, a strategy which consists of multiple visits between the science target and a calibrator spanning an interval of several hours may also help to get rid of some of this systematic error. 54 User’s Manual VLT-MAN-ESO-14200-2761 Figure 5-20: Example of strong systematic effect on the phases. Both datasets consists in 400 0.11 ms exposures. The only difference between these two dataset are the position of the star on the detector. In red is plotted the mean phase, as well as its statistical rms. If the phases could be de-biased, potential precision on the phase would be 0.1 deg, allowing detection with dynamic range of 1 000. 5.5.16 Calculating exposure times: throughput and sensitivity for selected filters. In order to convert from the standard CONICA exposure-times given by the online calculator tool (ETC) into SAM exposure data, only two additional numbers are needed. These are (1) the fraction of the mirror area passed by the mask and (2) the fraction of the total flux that will be found in the brightest pixel. These numbers have been calibrated using the commissioning data for a subset of the total available filter/mask combinations. For filters that have not been calibrated, it should be fairly simple to extrapolate from these numbers to get reasonably close. Note that these numbers have been taken from limited observations, and some values may not be representative of normal seeing conditions, being biased by small sample statistics. Table 5-15 gives mask areas and peak pixel flux ratios for all mask/filter combinations used in commissioning. These values have been converted into expected count rates using the throughputs from the online sensitivity calculator, and verified on sky. Figure 5-21, Figure 5-22, Figure 5-23 and Figure 5-24 give the expected peak throughput for various mask, filter and integration time combinations. The information is organized by the various masks, with each plot applying to a separate mask configuration. The different CONICA narrowband interference filters are indicated with different coloured line types. For each mask/filter, the expected peak counts received is given for a range of different exposure times starting with the shortest possible (per subframes) up to 10 second integrations. The chip nonlinear regime begins with the horizontal line near the top, and saturation is at the very top. 55 User’s Manual VLT-MAN-ESO-14200-2761 Table 5-15: Mask area and peak flux ratios for the used mask/filter combinations 18Holes Total area = 3.9% of pupil Filter NB_1.75 IB_2.24 NB_3.74 NB_4.05 9Holes. Peak Pixel Flux 6.38e-4 6.10e-4 1.12e-3 1.26e-3 Total area = 12.1% of pupil . Filter NB_1.75 IB_2.24 NB_3.74 NB_4.05 BB_9Hol es. Filter H Ks L' M' 7Holes. Filter H Ks L' M' Peak Pixel Flux 1.53e-3 1.18e-3 4.42e-3 4.75e-3 Total area = 8.7% of pupil Peak Pixel Flux 1.53e-3 1.37e-3 2.95e-3 2.72e-3 Total area = 16% of pupil Peak Pixel Flux 2.67e-3 2.53e-3 5.52e-3 ** use L’value ** 56 User’s Manual VLT-MAN-ESO-14200-2761 Figure 5-21: Throughput for the 18-Holes mask. Top panel shows throughput with three narrowband filters in J, H and K bands respectively, while the longer wavelengths are given to the bottom panel. Various integration times are shown (annotated on the plot). 57 User’s Manual VLT-MAN-ESO-14200-2761 Figure 5-22: Same as Figure 5-21 but for the 9-Holes mask. 58 User’s Manual VLT-MAN-ESO-14200-2761 Figure 5-23: Same as Figure 5-21 but for the BB 9-Holes mask 59 User’s Manual VLT-MAN-ESO-14200-2761 Figure 5-24: Same as Figure 5-21 but for the 7-Holes mask 60 User’s Manual VLT-MAN-ESO-14200-2761 5.5.17 PSF and MTF Information on PSF and MTF can be found in the NACO-SAM web pages: http://www.eso.org/sci/facilities/paranal/instruments/naco/inst/sam.html 5.5.18 Calibration plan for SAM • • Twilight flats as described in Section 5.2 and internal flats without the masks. Detector darks in all readout modes and DITs. 5.5.19 Pipeline for SAM SAM is not supported by the pipeline. 5.6 SAMPol The simultaneous use of the Wollaston together with the SAM masks presents a unique opportunity with CONICA to examine systems where there may be polarization signals at very high spatial resolutions. Note that given the very small fields of view of SAM, it will generally not be necessary to use the image-plane masks with the Wollaston_00. SAMpol is offered with all filters except J. In order to get all the Stokes parameters, one can chose between two options: using the retarder plate the same way it is done in classic polarimetry, or make use of the rotation of the field induced by the pupil tracking mode. Is this sky rotation enough? This is not a completely simple question to answer. It partly depends on where the star is located in the sky: sources which transit near the Zenith will have a position angle which rotates rapidly - making it easy to get a lot of sky rotation in a hurry. However, being too near the Zenith could make data analysis more complicated, with rotation during exposure issues. For most stars in the sky, the way to exploit the sky rotation to help map out the polarization would be to wait some interval - maybe several hours typically - and observe the object a second time. In terms of efficiency the use of the retarder plate is the best option. The implementation of these two possibilities it is done via the template. At the beginning of the science observation, the operator is asked whether the retarder plate should be used, making it possible to decide in real time whether the object does have a sufficient rotation to render the use of the retarder plate unnecessary. Note that SAMPol does not use the Polarimetry Mask, usually needed in classic polarimetry to cover the overlapping parts of the beams, because SAM/SAMPol are only used for single-object targets and there should never be the possibility for confusion between overlapping fields that the mask is intended to avoid. 5.6.1 Calibration plan for SAMPol • • 5.6.2 Twilight flats as described in Section 5.2.1. Detector darks in all readout modes and DITs. Pipeline for SAMPol SAMPol is not supported by the pipeline. 61 User’s Manual VLT-MAN-ESO-14200-2761 5.7 Cube mode Cube mode is a variant of the burst mode offered with VISIR and HAWK-I. In this mode, a data-cube with each single DIT frame is saved. This mode is particularly interesting for luckyimaging type of observations, where one wants to select the best frames out of a set before coadding them. The mode can be used for time resolved applications, provided one selects detector setups that do not lose frames and no single DIT frame time stamping is needed. The timing accuracy has been measured in the case of 1-sec sampling frequency. The IRACE controller is able to acquire data with microseconds timing accuracy and it is assumed that the additional frame writing overheads are homogeneously distributed during the exposure time. There are stringent limitations to the use of the cube mode, in particular it will only be offered in combination with basic imaging, coronagraphy and SAM in NGS mode. Additional advantage of the cube mode is the much smaller overheads needed to save large quantities of frames. When in the past a user would select a certain number of exposures per offset (by means of the NEXP parameter), now one can select cube mode and save all the images in one frame, saving the time needed to save each file (16-17 sec): there is only one readout per cube, which means that hundreds or thousands of frames can be taken with very little overheads. See Section 5.7.1 for more information on overheads. The size of each cube is limited by the maximum file size accepted by our flavour of Linux, 512 MB. Therefore, given a certain detector window, this fixes the maximum number of planes that can be saved in a cube (i.e. NDIT). Cube mode is offered in combination with 5 different window sizes. Note that since windowing is done on chip (i.e. hardware windowing), NY=NX+2. Another feature of hardware windowing is that one cannot choose the position of the window within the full frame array: each window is centred on pixel (512,512), and the STARTX and STARTY parameters are fixed by the chosen window size. Table 5-16 lists the available windows, the minimum DIT and the maximum NDIT for various readout and detector modes. Cube mode is also offered with FowlerNsamp and Uncorrelated read, for NB thermal imaging and Lp without chopping, respectively. Chopping is indeed incompatible with cube mode, since the chopped frames are a different type of cubes by themselves. The noise characteristics of the cube mode are similar to the normal frames, and temporal noise, i.e. the noise across the cube, is at the same levels of spatial noise. Some extra noise features (fixed pattern 8-pixel noise) appear in the cube frames, especially when very small windows are used). The cosmetic of the detector is also different, with more blemishes with smaller windows. These patterns can be eliminated during post-processing of the data. The overall signal-to-noise in the complete dataset is usually as predicted by the ETC, since the cube mode does not add extra noise, except of course that the readout noise is much more important given the many reads. One can see some additional horizontal additive pattern on the images, not stable between cubes or frames: this pattern can be removed by subtracting the median of each row (M. Durant, private communication) Random drifts (jitter) in x and y can be seen across the cube. For example, a star can move from one frame of the cube as much as 1-2 pixels, when data are taken with good AO correction. The causes of this jitter are not yet well understood. They represent one more reason why cube mode observations and shift and add post-processing of the images can result in a significant increase of Strehl and image quality. As for P93, two new cube windowing options are offered: 384x and 768x. They allow to optimize the efficiency (framelosses and timelosses) with a FoV trade-off. Values in Table 5-16 for these setups are conservative. 62 User’s Manual VLT-MAN-ESO-14200-2761 Table 5-16: characteristics of cube mode. Detector Setup Window Min Max NDIT2 Frame Loss Time Loss3 size1 DIT DCR/HD 0.35 126 20-22% ~16 s 1024×1026 DCR/HD 0.50 126 0 0 1024×1026 DCR/HD 0.27 224 0 0 768×770 DCR/HD 0.109 508 0 0 512×514 DCR/HD 0.075 900 0 0 384×386 DCR/HD 0.039 2027 0 0 256×258 DCR/HD 0.016 8049 0 0 128×130 DCR/HD 0.007 31711 0 0 64×66 Note DCR: minDIT (0.35sec) always loses frames. 0.5 sec does not. Efficient FNS/HS 1.793 126 1 frame 0 1024×1026 FNS/HS 1.2 224 1 frame 0 768×770 FNS/HS 0.419 508 1 frame 0 512×514 FNS/HS 0.35 900 1 frame 0 384×386 FNS/HS 0.145 2027 1 frame 0 256×258 FNS/HS 0.048 8049 1 frame 0 128×130 FNS/HS 0.014 31711 1 frame 0 64×66 Note FNS: always one frame is lost. Large overheads. UCR/HD 0.175 126 ~39% ~15s 1024×1026 4 UCR/HD 0.35 126 0 ~3s 1024×1026 UCR/HD 0.14 224 ~30% ~15s 768×770 UCR/HD 0.055 508 ~25% ~5s 512×514 UCR/HD 0.08 508 0 0 512×514 UCR/HD 0.045 900 0 0 384×386 UCR/HD 0.02 2027 0 0 256×258 UCR/HD 0.008 8049 0 0 128×130 UCR/HD 0.004 31711 ~21% ? 64×66 Note UCR/HD: for NB thermal imaging only. UCR/HWD 0.175 126 ~39% ~15s 1024×1026 UCR/HWD 0.350 126 0 ~3s 1024×1026 UCR/HWD 0.14 224 ~30% ~15s 768×770 UCR/HWD 0.055 508 ~28% ~5s 512×514 UCR/HWD 0.08 508 0 0 512 ×514 UCR/HWD 0.045 900 0 0 384×386 UCR/HWD 0.02 2027 0 0 256×258 UCR/HWD 0.008 8049 0 0 128×130 UCR/HWD 0.004 31711 ~21% ? 64×66 UCR/HWD 0.007 31711 0 0 64×66 Note UCR/HWD for Lp imaging only, no chopping. 1 2 Since January 2015 with the Aladdin 2 detector, NAXIS2 = NAXIS1 + 8. The min DIT and frame losses are sensibly the same. The dimension of the cube will be NAXIS3=NDIT+1. See section 5.9 for details. 3 Cube mode frame losses go along with time overheads as the system struggles to write the cube to the disk. In this column are displayed approximate writing times for each cube for some known setups. The p2pp currently accounts for these overheads only for the full frame / minimum DIT cases. In case the overhead is negligible (0 here), the total OB execution time can be pessimistically estimated by p2pp. This part will be refined upon further tests. 4 Beware that will such DIT, the background might saturate with the L’ filter. 63 User’s Manual 5.7.1 VLT-MAN-ESO-14200-2761 Cube mode overheads Overheads in cube mode depend on the readout mode and on the observing setup (DIT, NDIT). Not all possible configurations were tested and if one wishes to use a case not covered some custom tests may be needed. Contact [email protected] for inquiries. For DCR/HD the overheads are minimal, given the fact that no readout is performed until the entire cube has been produced. The rule of ~0.7 seconds overhead per exposure (DITxNDIT) is no longer valid in cube mode. The time to complete an exposure is typically 1.5 times the exposure time (DIT×NDIT). To that, one has to add the data cube writing to disk and controller (IRACE) overheads, which are approximately 16-20 seconds per cube. When using min DIT and small windows overheads increase, but are still of the order of few seconds. This is not the case for FowlerNsampling (FNS) read. This technique inevitably introduces large overheads: for instance, a full frame cube at minDIT needs 8 minutes observations for 03:45 minutes total exposure time (i.e. 130% overheads). As a general rule, the smaller the window the higher the overheads, which are ~170% for 512 and for 256, ~230% for 128, 170% for 64. To that, one has to add the overheads for data cube writing to disk and controller (IRACE) overheads, which are approximately 15 seconds per cube. When one does not use the minimum DIT (DIT > 1-3 secs) the overheads are much lower: in the case of FNS the typical overhead is 1.8×NDIT seconds. 5.8 Pupil Tracking (PT) mode IMPORTANT NOTE: since October 15th 2011, the PSF drift previously observed when tracking the pupil through meridian (especially strong close to zenith) has been fixed. Pupil tracking can now be used efficiently with coronagraphic masks in the image plane (AGPM as of P91). The residual drift of ~1 pix/hour (up to 60 times smaller than before) can be attributed to an imperfect flexure compensation model. As for P93 however, only the AGPM remains offered among the focal plane masks and only in VM because it requires a centering accuracy of ~0.3 pixel (Mawet 2013 A&A). When observing with an alt-az telescope at the Nasmyth focus (it is the case for NaCo), FoV and telescope pupil are both rotating. Since P82, you can either decide to freeze the field on the detector and let the pupil rotate with a field rotation given by the parallactic angle (conventional mode called Field-Tracking, FT) or decide to freeze the pupil and let the field rotates with the same field rotation but in the opposite direction (mode called Pupil-Tracking, PT). Both modes are available on NaCo and used for high-contrast imaging observations. For both modes, to conduct astrometric studies, one has to understand which angular offsets are applied and when to properly calibrate at the end the true north orientation in the final product of reduction and analysis. The scope of this section is to clarify the field orientation issues in the case of pupil tracking observations. This work was conducted by Gael Chauvin (visiting scientist at ESO/Chile at the end of 2010) and Julien Girard. PT is a suitable option for imaging applications, and it is imposed for AGPM coronagraphy. PT was originally implemented to support SAM (5.5), but given the demand from the community, it is now offered for a wider range of applications. Using PT, the telescope, independently from NACO, tracks the pupil orientation (see Figure 5-25) instead of the field. This new tracking mode opens the possibility to improve Angular Differential Imaging (ADI), a high contrast imaging technique that reduces quasi-static speckle noise and facilitates the detection of nearby companions. 64 User’s Manual VLT-MAN-ESO-14200-2761 Figure 5-25: Orientation of the pupil (or spikes) in field tracking (FT) mode: angular (parallactic) variation as a function of time in FT mode as a function of the star declination. Pupil tracking is set during acquisition of the target. The users have only to specify in their template the need for pupil tracking (set the flag to T) and the position angle at which they wish the telescope spiders to be set. Once set in the acquisition, pupil tracking will be “left on” for the duration of the science. For observations requiring a calibrator it is also possible to specify that the spiders keep the same orientation on sky as for the science. In this case the PSF flag in the acquisition template for the calibrator has to be set to T. The orientation of the spiders is illustrated in Figure 5-26 and Figure 5-27. 65 User’s Manual VLT-MAN-ESO-14200-2761 South (dec < −24.4deg) Field Pupil N N E PAsky PAsky E North (dec > −24.4deg) Field Pupil E N N E PAsky PAsky Figure 5-26: Pupil and Field rotations as a function of the star declination. The pupil rotation is shown in black and the field rotation in red. PAsky refers to the rotator offset that can be applied during the OB acquisition. The spiders angle can be set in the acquisition template by means of the parameter position angle, the same used to set the orientation on the sky field-tracking mode. A positive angle rotates the spiders clockwise. As of Nov. 14th 2008, pupil tracking is supported by the VLT software and new keywords are available to describe the pupil tracking observations1: TEL.ROT.ALTAZTRACK is set to T when PT is on, to F for NORMAL tracking. ADA.POSANG specifies the position angle (PA) on sky at the start of exposure: very important parameter when a lot of field rotation is expected (especially for the APP imaging observations). We can express the PA of the source (S) in the world coordinate system (WCS) by: PA(S) = - (360 +ADA.POSANG) ADA.POSANG.END specifies the position angle on sky at the end of exposure. Note that it is wise to recalculate the parallactic variations (if important during an exposure) using the coordinates of the object and the DATE or DATE-OBS keywords (in ADI, to “derotate” and stack the frames) because the keywords ADA.POSANG and TEL. PARANG are not very precise. Also, we have: ADA.POSANG = TEL.PARANG – (180 – ADA.PUPILPOS) 1 As a consequence, all files taken before that date are missing those keywords. Since the mode was officially offered as of Oct. 5th, the number of affected files is rather small. 66 User’s Manual VLT-MAN-ESO-14200-2761 ADA.PUPILPOS specify the pupil angle. Note that this value does not coincide with the position angle specified by the user: ADA.PUPILPOS ≈ position angle + C with C=88.99±ε. Since the PUPILPOS is a function of the absolute rotator position, and this one has a range of ±270 degrees, for a given position angle there can be two possible values. For example: if position angle =10, PUPILPOS can be either 99.9 or -260.1 (99.9–360). Another important thing to remember is that the calculation of the rotator position is a function of the altitude. Since the altitude changes from the moment the rotator angle is calculated to the moment the pupil is frozen in place, there is an uncertainty in the value of C (ε). Let us call ROT.PT.OFFSET the rotator offset applied in PT mode. We find the ROT.PT.OFF angular offset varies between 90.3 and 92.2 deg in our tests. It significantly varies between two successive observing sequences during a same night. The systematic variation seems to be reported in the ADA.PUPILPOS keyword. The difference φ = ADA.PUPILPOS − (ROT.PT.OFF − 90.0) is stable in time and results to a 0.1 deg uncertainty. If confirmed, the ADA.PUPILPOS keyword can then be used to calibrate the absolute position of the ROT.PT.OFF angular offset applied at the beginning of the PT-sequence and needed for the final ADI images calibration. Proposed absolute calibration using ε with: 90.0 - ε = φ = 89.44 ± 0.04 deg for reduced ADI observation ROT.PT.OFF =90.0+(φ−ADA.PUPILPOS). At a second order, platescale and true north calibration are always mandatory to achieve an absolute astrometric precision of 0.1 deg. The use of the same astrometric field is necessary for reducing the systematics. 67 User’s Manual VLT-MAN-ESO-14200-2761 Figure 5-27: Orientation of the telescope spiders for different position angles. The spiders have 180 degrees symmetry, i.e. 90 and -90 look identical. Spiders rotate clockwise for positive angles. During pupil tracking, the field will rotate around the AO reference at a speed that depends on the object coordinates. Targets close to zenith and passing meridian rotate the fastest. Given its complexity and novelty, pupil tracking was only offered in VM until P85. Starting with P86, PT is offered in SM as well only for simple imaging only. 68 User’s Manual 5.9 VLT-MAN-ESO-14200-2761 NACO data format With the introduction of the cube mode NACO will have two different types of data formats, single frames and data cubes. Single frames are 2-D FITS files (i.e. NAXIS=2) comprised of 1 image and 3 FITS extensions, namely the Modal Voltage COvariance matrix (MVCO), the residual (Modal) Slope COvariance matrix (MSCO) and the Zernike Noise VAriance vector (ZNVA). The extensions store data produced by the NAOS RTC that can in principle be used for PSF reconstruction. The typical image will be a 1024 square array (i.e. NAXIS1 and NAXIS2=1024), when the array is not windowed. The two covariance matrices have dimensions 159×160 or 42×43, depending whether the WFS used the 14×14 or the 7×7 subapertures. The variance vector has dimension 35. Datacubes are 3-D FITS files (i.e. NAXIS=3), a cube plus the same 3 FITS extensions. The size of the third axis (NAXIS3) is equal to NDIT+1: NDIT is the number of saved DIT frames, and the additional frame at the end of the cube is the combined image, i.e. the frame obtained as a sum of all DIT planes divided by NDIT. This last plane in the cube is the equivalent 2-D image one would obtain in “single frame” mode. The combined image is used for sanity check and quality control at the observatory. Users are cautioned to use only the first NDIT frames of each cube for their data reduction. Note also that the first frame in the cube may suffer from some reset anomaly and should probably be discarded. Cubes have NAXIS2=NAXIS1+2 as a rule. For example, if one windows the array to half its size and takes NDIT=200, the size of the cube will be (NAXIS1,NAXIS2,NAXIS3)=(512,514,201). The FITS extensions remain unchanged. 69 User’s Manual 6 VLT-MAN-ESO-14200-2761 OBSERVING WITH CONICA AT THE VLT As with other ESO instruments, users prepare their observations with P2PP. Acquisitions, observations and calibrations are coded via templates (Section 7) and two or more templates make up an OB. OBs contain all the information necessary for the execution of an observing sequence. Specific to NAOS-CONICA, the Preparation Software (PS) (See Appendix B) is a key tool, since it allows one to optimize the adaptive optics configuration and to estimate performance. Both the ETC and P2PP use the output from PS to determine feasibility and to prepare observations. For Phase 2 preparation, the PS must be used. The ETC can be accessed via the regular web based interface (http://www.eso.org/observing/etc/) or via the HTML file produced by the PS. For the former, the ETC now calls the NAOS-PS server itself to retrieve the performance estimate. For Phase 1 preparation, users can use either access route, although we strongly recommend the use of the PS for Phase 1 preparation as well. At the telescope OBs are executed by the instrument operator (night astronomer or TIO). Both NAOS and CONICA are setup according to the contents of the OB. Note that the NAOS configuration might be further optimized at this time in order to provide better performance. A Real–Time Display is used to view the output of CONICA and to perform acquisitions, while the wavefront pupil is also displayed. Daytime calibrations are executed the following morning by observatory staff. 6.1 Service Mode (SM) containers Since P90, and thanks to p2pp v3, the users are able to group Observation Blocks (OBs) into “containers” for calibration or time-link purposes as explained here: http://www.eso.org/sci/observing/phase2/P2PP3.html The Phase 2 OB preparation must therefore be made with P2PP version 3 (P2PP3) available from the User Portal: http://www.eso.org/sci/php/phase2/P2PP3Download.html 6.2 Visitor Mode (VM) operations Visitors arrive on Paranal two days ahead of their observing run and receive support from Paranal Science Operations (PSO). Users are requested to read the P2PP and NAOS-CONICA User Manuals before arriving. During the night, users do not have direct interaction with the instrument and the telescope. The instrument operator observes the programs under the supervision of the visiting astronomer. Observers should note that twilight during visitor mode runs is used by the observatory to acquire calibrations and will be given to observers on a best-effort basis The calibrations usually consist of twilight flat fields and imaging standards. The observatory staff will help them make the right choice. Even though Paranal is an excellent site, bad weather or poor and fast seeing can occur. Visitors should come with pre-approved backup programs (http://www.eso.org/sci/facilities/paranal/sciops/vm_backup.html), particularly if the targets are in the North, where, on some occasions, the wind can be strong enough to prevent the telescope from pointing in that direction. Visitors should also prepare targets with bright (V < 10) reference sources so that telescope time can be effectively used when the turbulence is fast. 70 User’s Manual VLT-MAN-ESO-14200-2761 NACO can, in principle, also observe in open loop, should the conditions be unsuitable for adaptive optics, but users should consider this only as a last resort (unless the noAO mode has been requested). 6.3 Active Optics versus Adaptive Optics Active optics is the active control of the primary and secondary mirrors of the telescope its main goal is to correct for dome turbulence and gravity pull on the mirror, in order to ensure the same seeing as can be measured outside the dome with the telescope at zenith. VLT mirrors have been optimized to make use of this correction, hence it is not possible to observe without using the active optics. Adaptive optics is the correction of wavefront errors induced by atmospheric turbulence. Although, the instrument can run in principle in closed loop without the active optics system controlling the primary and secondary mirrors, one gets better adaptive optics performance if the active optics system of the telescope is running. 6.4 The influence of the moon Moonlight does not noticeably increase the background in any of the CONICA modes, so there is no need to request dark or grey time for this reason. However, it is recommended not to observe targets closer than 30o to the moon to avoid problems linked to the telescope guiding/active optics system. The effect is difficult to predict and quantify as it depends on too many parameters. Just changing the guide star often solves the problem. Visitors are encouraged to carefully check their target positions with respect to the Moon at the time of their scheduled observations. Backup targets are recommended whenever possible, and users are encouraged to contact ESO in case of severe conflict (i.e. when the distance to the Moon is smaller than 30o). Visitors can use the tools that are available in http://www.eso.org/observing/sci/observing/tools/calendar/skycalc.html (select the link “Airmasses Calculator” which is under “User Support Tools”) to help determine the distance between targets and the moon for given dates. However, the moon may affect the quality of the adaptive optics correction, if the source used for wavefront sensing is fainter than V=16. In these cases, reducing the FLI constraint to approximately 0.7 and increasing the distance to the Moon to approximately 50 degrees is generally adequate. Even here, it is important not to over-specify the constraints, as this reduces the chances of the Observing Block being executed. For wavefront sensing in the IR and for reference sources that are brighter than V=16, the values for Lunar Illumination and Moon Angular Distance in the Constraint Sets of your OBs should be 1.0 and 30, respectively. 6.5 Telescope control Most interactions with the telescope consist of telescope presets for acquisition, telescope offsets during observations, and M2 chopping for some LW observations. Small offsets (i.e. less than one arc minute) are usually completed in 10 seconds of time or less. It is important to distinguish between the star that is used by the telescope for active optics and the reference object used by NAOS for wavefront sensing. The active optics stars, which are also used for guiding, are automatically selected by the Telescope Control System, and users in general do not have to worry about finding them. For some specific cases, i.e. large offsets to the sky from a crowded field, users might wish to keep the same guide star. It is recommended in such a case that they select it by themselves and explicitly indicate its position in one or more (dedicated) Finding Charts, and refer to its use in the text of the README information. Appropriate magnitude for guiding stars range from R = 9-11, with 12-13 magnitude in good conditions. This guide star has to be within a radius of up to 15’ (arcminutes) from the centre of the field (field of view of a unit telescope). It is recommended to draw a circle on the guide star finding chart to show it lies within this 30’ circle. 71 User’s Manual VLT-MAN-ESO-14200-2761 The reference object used by NAOS for wavefront sensing, and specified within the PS, is chosen by the astronomer (See Appendix B). It is quite common to offset the telescope very frequently when observing with NAOSCONICA, and since there are two stars that are used to control the system (one for active optics and the other for adaptive optics) as well as the scientific target (which may, in fact, be the same as the adaptive optics star), users have to pay very special attention to the restrictions imposed by the system. There are essentially two kinds of offsets. The first is an offset that results in the NAOS AO loop being closed at the end of the offset. The second is an offset that results in the NAOS AO loop being opened at the end of the offset. In the first case, the field selector (FS) has to move from where it was when the NAOS AO loop was last closed. In the second case the FS does not move. The field of view of the FS is a bit less than 2 arcminutes. If the offset sequence is such that the positions at which the loop needs to be closed is outside this region, the observations will fail. It is not possible for the system to know beforehand what offsets it will be asked to perform, so if it encounters an offset command which would move the FS beyond its limits, it will ’politely’ (and sometimes not so politely) refuse. Template parameters, which would lead to that happening, are checked for possible problems during OB verification. When small telescope offsets are used (less than one arc minute), the telescope keeps the same active optics star. If, however, large telescope offsets are used (several arcminutes), the active optics star changes. Nevertheless, when returning to the science target and closing the AO loop on the same reference source, any offsets that might be caused by changing guide stars should be compensated by NAOS. 6.6 Target acquisition Irrespective of the observing mode, the acquisition sequence is composed of a telescope preset to the object, the selection of the guide star from the operator (unless the star has been selected previously by the user), its centering the guiding camera, at least one full correction of the active optics and the telescope in guiding status. Once this cycle is completed, control returns to NACO, and the operator is asked to identify the science target on the CONICA detector, and to centre it in the middle of the field-of-view of the wavefront sensor, indicated by a white box overlaid on the CONICA detector. Once the centering is done, the set-up specified in the aocfg file will be sent to NAOS RTC: the flux from the star is measured once, then the WFS will execute a slight offset to measure the sky background around the star and come back on the position. A first estimate of the adaptive optics correction is calculated. The process is repeated one more time, in what is called the fine acquisition, and, once the adaptive loop is closed, the control is returned to the operator to continue with the template. Below we provide a list of the various templates available for acquisition of the target, depending on the desired observations; it is very important to understand that acquisition and science templates should be consistent, i.e. it is not possible to mix a spectroscopic observation with an image acquisition. 6.6.1 Imaging The NACO_img_acq_MoveToPixel template provides interactive tools like dragging arrows to define telescope offsets. Users wishing to use the no AO mode must use the NACO_img_acq_MoveToPixelNoAO. 72 User’s Manual 6.6.2 VLT-MAN-ESO-14200-2761 Coronagraphy It is mandatory to use the NACO_img_acq_MoveToMask acquisition template for all coronagraphic OBs and the same mask in both the acquisition and observing templates. This template provides interactive tools to centre objects behind the selected mask, which is overlaid on the RTD. 6.6.3 Polarimetry It is mandatory to use the NACO_img_acq_Polarimetry acquisition template. 6.6.4 SAM It is mandatory to use NACO_img_acq_SAMMoveToPixel and use the same mask in both the acquisition and the science templates. 6.6.5 SAMPol It is mandatory to use NACO_img_acq_SAMPol and use the same mask in both the acquisition and the science templates 6.7 Pre-imaging Pre-imaging is offered for programs where critical conditions need to be checked to guarantee the successful execution of the science program. This mode ensures a quick delivery of the data to the user and is restricted to: o programs that have already requested a separate pre-imaging Run, or otherwise indicated an amount of time to be used for pre-imaging. Examples of cases that may require pre-imaging are programs needing to check either the field orientation (because of possible contamination by a close-by bright star), or the possible binarity of potential targets for occultations. o 2 imaging templates: NACO_img_obs_AutoJitter and NACO_img_obs_GenericOffset. For these 2 templates, a user selectable keyword Observation Category is available and should be set to PRE-IMAGE in the above-mentioned cases only. By default this parameter is set to SCIENCE. Failure to set this keyword properly will result in delays to process and deliver the preimaging data. 6.8 Finding charts, readme files and OB naming conventions In addition to the general instructions on finding charts and README files that are available at http://www.eso.org/sci/observing/phase2/SMGuidelines/FindingCharts.generic.html and http://www.eso.org/sci/observing/phase2/SMGuidelines/ReadmeFile.generic.html, respectively, the following NACO requirements apply: o At least one chart for each observation must be 2' x 2' in size, with additional charts showing more details as appropriate.. o All wavefront reference stars must be clearly marked according to the way they are ordered in the preparation software. They should be marked R1, R2, R3, etc. o For imaging, the field of view of the selected camera must be drawn. o For polarimetric and coronagraphic observations, the field of view of the selected camera must be drawn and the object that is to be placed behind the mask (in the case of coronagraphy) or centred in the mask (in the case of polarimetry) should be clearly indicated. 73 User’s Manual VLT-MAN-ESO-14200-2761 o For PSF reference stars, the OB name must be prefixed with the string PSF_. o For pre-imaging, the OB name must be prefixed with the string PRE_. o For PSF observations, which are to be done as pre-imaging, the OB name must begin with PRE_PSF_. o The magnitude of the brightest object in all fields, including standard stars, must be explicitly given in the README file. o For OBs that need a maximum of field rotation using pupil tracking (angular differential imaging), users are requested to use the suffix “_Meridian” in their OB name. That way the operator will know this OB has to be observed around the meridian. Beware that in Paranal, the latitude is -24º35’. If the declination of the object is within 4º of this value, the telescope cannot “cross” the meridian and therefore these objects must be observed either before or after the meridian (LST +/10 minutes). In addition, explain explicitly in the ReadMe file at which LST the OB should be started, taking into account the preset and acquisition overheads. 6.9 Reference sources for wavefront sensing The brighter the reference source is and the closer it is to the science target, the better the correction will be. Typically, closer “wins” over brighter, but in any event the NAOS-PS should be consulted. It can even be the science target itself if it is sufficiently bright and point like. Whenever possible, several reference sources should be chosen in order to avoid acquisition problems due to binarity, faintness or proper motion of the reference source. The Guide Star and 2MASS catalogues can be used to find suitable references. In general, the visual WFS will be used for most of the observations, as this ensures that the largest fraction of IR light enters the science channel. The IR WFS should be used for very red sources (V–K ≥ 6 mag), which could otherwise not be observed with NAOS-CONICA, or for which the IR WFS provides a better correction. Strehl Ratio and classification of OBs in Service mode (SM) To help the observatory determine whether or not an OB has been successfully executed in service mode, the Strehl Ratio of the reference source can be measured with the NB_2.17 filter during acquisition or at the observed wavelength using a dedicated tool. The measurement during the acquisition process is automatic. Users do not have to worry about it. Depending on the morphology and brightness of the target, the service observer will measure the Strehl ratio on the reference source and a preliminary classification will be made. If the reference source is extended, too faint or too bright, the measurement will not be made and the OB classification will be based on the performance that is computed by the RTC. If the RTC cannot give a valid estimate (which is the case for “slow” IR WFS AO modes) and no other measurement is possible the operator will report the seeing as seen by the guide probe, which is more indicative of the actual observing conditions than the DIMM seeing measurement and indicate the values for other parameters of interest, such as the coherence time. If we believe that we have achieved a Strehl Ratio which is greater than 50% of that requested by the user, we will consider that the OB has been successfully completed (in the event that all other constraints are met satisfactorily). 74 User’s Manual VLT-MAN-ESO-14200-2761 6.10 PSF reference star Observations of PSF stars are frequently used in the analysis of AO data. Generally speaking, the instrument set up should not change between the observation of the science target and the PSF reference, the brightness and colour of the two should be similar and atmospheric conditions should be stable. With NACO, the simplest way of ensuring that the instrument configuration does not change is to ensure that the “PSF reference? (T/F)” flag in the acquisition template is set to T. When this flag is T, the telescope will preset to the target, the operator will acquire the target and AO will start without changing the NAOS configuration. The time required for PSF reference star observations will be charged to the user. For service mode observations, we request that all PSF reference OBs are prefixed with the string PSF_ and that clear instructions are written in the README file and the Instrument Comments fields for the science and PSF OBs. 6.11 Recommended DIT and NDITs Unless the object is bright enough to cause saturation (Table 5-2), DITs need to be somewhat larger than those that were used in ISAAC, because the NACO plate scale is considerably finer and it takes longer for exposures to be sky noise limited. However, if there are bright objects of scientific interest in the field of view, then DITs will have to be much smaller than the ones listed in Table 6-1. For DITs larger than 60 seconds, users should consider using FowlerNsamp and not Double_RdRstRd. With DITs larger than 60 seconds, the number of hot pixels in Double_RdRstRd is noticeably larger. Table 6-1: Recommended DIT and NDIT range Filter J, SW NB filters H and Ks LW NB filters Lp SW Spectroscopy LW Spectroscopy DIT[sec] 60-300 20-120 0.175-2.4 0.175 60-900 0.4-3.0 DIT×NDIT [sec] 120-300 60-240 40-80 30 120-900 60-120 These recommendations do not necessarily hold for cube mode, where the choice of DIT and NDIT will depend on the application. 6.12 IR background Background is a function of the filter and the dichroic. They are listed in Table 6-2. Users should note that the RON of the array can dominate if DIT is too small. Table 6-2: IR. Backgrounds. The hyphens mark invalid combinations of a NAOS dichroic + CONICA filter. Filter J H Background magnitude/sq. arcsec VIS N20C80 N90C10 JHK K 15.8 15.8 15.8 5.8 14.0 14.0 14.0 14.0 75 User’s Manual VLT-MAN-ESO-14200-2761 Ks Lp Mp 12.8 3.0 -0.5 12.5 - 11.0 - 3.0 -0.5 - 6.13 Recommended magnitude ranges for Standard Stars The recommended magnitude range for standard stars in imaging and spectroscopy is given in Table 6-3. Saturation with the minimum DIT can occur for targets that are about 1 magnitude brighter than the lower limit in these ranges, but this limit is very sensitive to the level of correction. These magnitude ranges are valid for observations with the visual dichroic. Limits are similar for the JHK and K dichroics and respectively 0.2 and 3 magnitudes brighter for the N20C80 and N90C10 dichroics. For detailed estimates, users should use the ETC. Table 6-3: Recommended magnitude range of standard stars for observations with the visual dichroic. Mode SW broad band filters SW NB filters FP LW Lp band LW Mp band LW NB filters Magnitude Range 10-12 8-10 4-6 7-9 6-8 4-6 6.14 Maximum brightness of observable targets Bright targets leave residual images that can take several minutes to disappear. presents the absolute limits acceptable. Table 6-4 Table 6-4: Magnitude limits for DIT<1 sec IR Magnitude >6 > 4 and <6 > 2 and <4 > 0 and <2 Filters to use Any Any narrow band filter Any filter plus one neutral density filter. Any narrow band filter plus one neutral density filter. Please note that the maximum brightness limit is set considering the following limitations: o The AO acquisition is done on CONICA in imaging mode (i.e. with no other dimming optical elements in the path) o The need to avoid persistence on the CONICA detector. These limits apply for DIT < 1. Such bright objects heavily saturate the detector and cannot be used for science. For longer DITs, these limits should be increased by approximately 1 magnitude for every 10-fold increase in DIT. The careful reader will note that this is not a linear relation. When acquiring or when observing targets in imaging or polarimetry, a saturation of a factor 10 is the maximum acceptable. The saturation level is defined for each detector mode by the full well depth (see Table 5-2). Any other expected saturation level (for field stars) should be accepted prior to observation. In service mode a waiver request must be submitted. In most cases, the waiver can be granted, but, depending on the level of saturation requested and the amount of persistence, time will be charged 76 User’s Manual VLT-MAN-ESO-14200-2761 to the program to wait for the persistence to clear out. In visitor mode, prior approval for such observation must be obtained, especially if only half nights are attributed to the project. The magnitude at which saturation starts depends on several parameters (filters, Strehl, objective, etc.). The ETC should be used to check that objects of scientific interest do not saturate the detector. Moreover, actual weather conditions may change this limits. In particular, users are warned that asking for THIN conditions is not a viable strategy, given the variability of the clouds it is too risky to acquire and observe brighter targets that could saturate badly when the conditions change for the better. Note also that the WFS itself cannot be allowed to saturate, the penalty being the impossibility to perform AO correction. Users need to restrict themselves to the magnitude limits indicated in Table 4-2. 6.15 Nighttime calibrations All night-time calibrations will be charged to the users, with the exception of those explicitly mentioned in the calibration plan of the instrument. 6.16 Instrument and telescope overheads The execution time report produced by P2PP computes the overheads according to the rules reported in Table 6-5. Users, especially those in service mode, should check them and make sure to take them into account for their Phase 1 (& 2) proposal. It is possible to simulate the detailed breakdown of the programme in terms of its constituent OBs using the P2PP tutorial accounts; see Section 1.4 of the P2PP User Manual available at: http://www.eso.org/sci/observing/phase2/P2PP3/P2PP3Documentation.html. The Execution Time Report option offered by P2PP then provides an accurate estimate of the time needed for the execution of each OB, including all the necessary overheads. Some examples are given below to illustrate how to compute overheads with NACO. In all examples, we have assumed that the reference source used for AO and the target are the same. Users wishing to make use of Cube Mode should also consult Section 5.7.1. Not all parameters of the listed templates are shown. Only those that have an impact on the overheads are listed. 77 User’s Manual VLT-MAN-ESO-14200-2761 Table 6-5: NACO Overheads Acquisition Templates Overhead Comment 3 min 0.75 min 2 min 5-10 min Depends on the brightness of the source used for AO Strehl measurement 4 min Not charged to the user Imaging acquisition 0.5 min Polarimetric acquisition 1 min Coronagraphic acquisition 2-3 min Depends on target brightness Observation templates Readout overhead per DIT (FowlerNsamp) 2 sec Readout overhead per DIT × NDIT 0.7 sec (Double_RdRstRd) Readout overhead per DIT (Uncorr) Negligible Telescope Offsets 9 sec 1 NAOS header 7 sec 2 Stop and Start AO 2 sec 3 Start and completion overheads for IRACE 9 sec 4 1+2+3+4 = typical offset 27 sec 2+4 = time between frames without offsets 16 sec Change in instrument configuration 1 min HWP in (or out) 30 sec HWP angle setup 15 sec Rotator offset (for polarimetry) 1-2 min Re-centering for AGPM 2 min All observations using chopping 30% Add to the exposure time Night time coronagraphic flats 6 min per on/off pair Description Telescope Preset Guide star acquisition Initial setup (NAOS+CONICA) AO acquisition 78 User’s Manual VLT-MAN-ESO-14200-2761 Table 6-6: Example 1 – Imaging a faint source (V=15 for visual WFS or K=10 for IR WFS) with FowlerNsamp Template parameters Acquisition Template NACO_img_acq_MoveToPixel Observation Template NACO_img_obs_AutoJitter DIT 3 sec NDIT 20 Number of offset positions 60 NEXPO per offset position 1 Readout Mode FowlerNsamp Execution Time [min] Preset 3 Guide Star Acquisition 0.75 Initial Setup 2 AO Acquisition 10 Imaging acquisition 0.5 Sub Total (acquisition) 16.25 Observation= 60×(27+20×(3+2)) 127 Total [min] 145 Overheads 141% Observation= Number of offset positions×(Offset overhead+NDIT×(DIT+readout overhead)) Table 6-7 – Example 2: Imaging a bright source (V=11 with the VIS WFS or K=7 with the IR WFS) with Double_RdRstRd Template parameters Acquisition Template NACO_img_acq_MoveToPixel Observation Template NACO_img_obs_AutoJitter DIT 2 sec NDIT 30 Number of offset positions 20 NEXPO per offset position 3 Readout Mode Double_RdRstRd Execution Time [min] Preset 3 Guide Star Acquisition 0.75 Initial Setup 2 AO Acquisition 5 Imaging acquisition 0.5 Sub Total (acquisition) 11.25 Observation= 20×(27+2×16+3×(30×2+0.7)) 80.3 Total [min] 91.6 Overheads 53% Observation= Number of offset positions*(Offset overhead+ (NEXPO per offset position1)*time between frames without offset)+NEXPO per offset position×(DIT×NDIT+readout overhead)) 79 User’s Manual VLT-MAN-ESO-14200-2761 Table 6-8: Example 3: Imaging a bright source in the L band (V=11 for the VIS WFS or K=7 for the IR WFS) with Uncorr Template parameters Acquisition Template NACO_img_acq_MoveToPixel Observation Template NACO_img_obs_AutoJitter DIT 0.2 sec NDIT 150 Number of offset positions 120 NEXPO per offset position 1 Readout Mode Uncorr Execution Time [min] Preset 3 Guide Star Acquisition 0.75 Initial Setup 2 AO Acquisition 5 Imaging acquisition 0.5 Sub Total (acquisition) 11.25 Observation= 120×(27+150×0.2) 114 Total [min] 125 Overheads 108% Observation= Number of offset positions×(Offset overhead+DIT×NDIT) Table 6-9 – Example 4: Spectroscopy of faint source with FowlerNsamp Template parameters Acquisition Template NACO_img_acq_MoveToSlit Observation Template NACO_spec_obs_AutoNodOnSlit DIT 300 sec NDIT 1 Number of AB or BA cycles 6 NEXPO per offset position 1 Readout Mode FowlerNsamp Return to Origin ? T Jitter Box Width 10 Execution Time [min] Preset 3 Guide Star Acquisition 0.75 Initial Setup 2 AO Acquisition 10 Spectroscopic acquisition 5 Through slit 2 Sub Total (acquisition) 22.75 Observation= 2×6×(27+300+2) 65.8 Total [min] 88.6 Overheads 48% Observation= 2×Number of AB or BA cycles×(Offset overhead+DIT+readout overhead) 80 User’s Manual VLT-MAN-ESO-14200-2761 Table 6-10: Example 5: SW Polarimetry of bright source with the Wollaston Acquisition Template Observation Template DIT NDIT Number of offset positions NEXPO per offset position Readout Mode List of position angle offsets Template parameters NACO_img_acq_Polarimetry NACO_pol_obs_GenericOffset 10 sec 6 5 1 FowlerNsamp 0 45 Execution Time [min] Preset 3 Guide Star Acquisition 0.75 Initial Setup 2 AO Acquisition 5 Polarimetric acquisition 1 Sub Total (acquisition) 11.75 Observations at 0 and 45 degrees = 2×(5×(27+6×(10+2))) 2×8.3=16.4 Rotator offset in between angles 1 Total [min] 23.95 Overheads 193.5% Observation= Number of offset positions×(Offset overhead+NDIT*(DIT+readout overhead)) Table 6-11 – Example 5b: Polarimetry of bright source with the Wollaston and HWP Template parameters Acquisition Template Observation Template DIT NDIT Number of offset positions NEXPO per offset position Readout Mode List of HWP offsets NACO_img_acq_Polarimetry NACO_pol_obs_Retarder 10 6 5 1 FowlerNsamp 0 22.5 Execution Time [min] Preset Guide Star Acquisition Initial Setup Setting HWP in/out AO Acquisition Polarimetric acquisition Sub Total (acquisition) Observations at 0 and 22.5 degrees= 2×(5×(27+6×(10+2))) HWP rotation Total [min] Overheads 3 0.75 2 1 5 1 12.75 2×8.3=16.4 0.25 29.6 196% 81 User’s Manual VLT-MAN-ESO-14200-2761 Observation= Number of offset positions×(Offset overhead+NDIT×(DIT+readout overhead)) Table 6-12: Example 6: SW coronagraphy of a bright source with Double_RdRstRd Template parameters Acquisition Template Observation Template DIT NDIT for the OBJECT positions NDIT for the SKY positions Number of AB cycles Number of exposures (OBJECT Only) Number of offset positions (SKY only) Readout Mode Execution Time [min] Preset Guide Star Acquisition Initial Setup AO Acquisition Coronagrahic acquisition Sub Total (acquisition) Observations= 2×(10×(6×10+0.7)+9×16+27+4×(5×10+0.7+27)) Total [min] Overheads NACO_img_acq_MoveToMask NACO_coro_obs_Stare 10 sec 6 5 2 10 4 Double_RdRstRd 3 0.75 2 5 2 12.75 36 49 84% Observation= Number of AB cycles × (Number of exposures (OBJECT)×(DIT×NDIT+readout overhead)+(Number of exposures (OBJECT)-1) × time between frames without offset) + Offset overhead)+Number of offset positions (SKY)×(DIT×NDIT+readout overhead+offset overhead)). Table 6-13 – Example 7: LW coronagraphy of a bright source Template parameters Acquisition Template NACO_img_acq_MoveToMask Observation Template NACO_coro_obs_AutoChopNod Integration Time 20 min Execution Time [min] Preset 3 Guide Star Acquisition 0.75 Initial Setup 2 AO Acquisition 5 Coronagraphic acquisition 2 Sub Total (acquisition) 12.75 Observation= 20×(1.3×60+27) 35 Total [min] 48 Overheads 140% Observation= Integration time (minutes)×((1+30%) × 60 sec + Offset Overhead) 82 User’s Manual 7 VLT-MAN-ESO-14200-2761 NAOS-CONICA TEMPLATES The instrument, detector and telescope are controlled by OBs, which are made up of templates. Templates are divided into three categories: acquisition, observation and calibration. Usually, OBs consist of an acquisition template and one or more observation templates for nighttime observations and, in some limited cases, an additional nighttime calibration template. Only one acquisition template is allowed in an OB, and therefore only one preset on sky. It is not possible e.g. to group in the same OB observation templates on the science object and calibration template on a standard star. Table 7-1 provides a short summary of the templates offered for P89. These templates should cover most needs. If this is not the case, users must contact the User Support Department ([email protected]) well before the start of observations. 7.1 General remarks and reminders Only parameters specific to NACO are described. The description of other parameters can be found in the P2PP User Manual (http://www.eso.org/sci/observing/phase2/P2PP3.html). We strongly recommend that you consult the NACO web pages for the latest information. o All imaging observations must use the NACO_img_acq_MoveToPixel template for acquisition, except those using noAO mode in which case NACO_img_acq_MoveToPixelNoAO must be used. o All polarimetric observations must use NACO_img_acq_Polarimetry for acquisition. o All coronagraphic observations must use NACO_img_acq_MoveToMask for acquisition (only AGPM since P93) o Al observations with SAM must use NACO_img_acq_SAMMoveToPixel for acquisition. o All observations with SAMPol must use NACO_img_acq_SAMPol for acquisition. o It is possible to submit a single OB that comprises several observing descriptions, for example one can observe a single target with different filters, but most mixed mode observations are generally not allowed. Direct imaging after any other mode is allowed, but users should note that the position of the object in the CONICA FoV will slightly change when moving from either coronagraphy to imaging, because different flexure compensation models are used for these modes. o Some targets saturate the detector with the minimum DIT. Consult the ETC. o The pixel scale is very small, so the readout noise can dominate if the DIT is too small. Consult the ETC. o Cube Mode is a feature that can be turned on for science templates (not acquisition) by means of the flag in the P2PP templates. Note that the default window is 1024×1026, and other windows will have different sizes (512, 256, 128 and 64, with NY=NX+2) centred on pixel 512, 512 (i.e. the user cannot set STARTX and STARTY, the lower-left coordinates for the detector window). o Pupil tracking mode is set in the acquisition template by means of the corresponding flag in P2PP. 83 User’s Manual VLT-MAN-ESO-14200-2761 Table 7-1: NACO template suite Action Template Turn the field (= telescope rotator) General to all observing modes NACO_all_obs_Rotate Acquisition Templates Preset telescope and acquire for imaging NACO_img_acq_MoveToPixel Preset telescope and acquire for imaging NACO_img_acq_MoveToPixelNoAO without AO Preset telescope and acquire for NACO_img_acq_Polarimetry polarimetry Preset telescope and centre object behind a NACO_img_acq_MoveToMask mask Preset telescope and acquire for SAM NACO_img_acq_SAMMoveToPixel Preset telescope and acquire for SAMPol NACO_img_acq_SAMPol Imaging Imaging of un-crowded fields NACO_img_obs_AutoJitter Imaging of extended objects or crowded NACO_img_obs_GenericOffset fields NACO_img_obs_FixedSkyOffset Imaging requiring special offset sequences NACO_img_obs_GenericOffset Imaging without AO NACO_img_obs_GenericOffsetNoAO Polarimetry Imaging Polarimetry NACO_pol_obs_GenericOffset Polarimetry with the Half Wave Plate NACO_pol_obs_Retarder Coronagraphy Coronagraphy NACO_coro_obs_Stare SAM (includes observations SAMPol (includes observations Pupil Pupil Tracking) SAM NACO_sam_obs_GenericOffset Tracking) SAMPol NACO_sampol_obs_GenericOffset Standard star for imaging Standard star for coronagraphy Standard star for polarimetry Standard Stars NACO_img_cal_StandardStar NACO_coro_cal_StandardStar NACO_pol_cal_StandardStar Night time coronagraphic flats Night time calibrations NACO_coro_cal_NightCalib or o With the exception of standards, the minimum amount of time between exposures is 30 seconds. This limit is set to allow the telescope Active Optics to at least perform one correction. o When doing a blind offset from a bright reference object to a faint target, we strongly recommend that the position angle be set so that the reference object and target do not fall in the slit at the same time, in order to avoid light reflection contaminate the fainter spectrum. At the end of the science sequence, it might also be a good idea to take an image long enough to allow you to see the faint object in the field. Additionally the coordinates of the reference object are the ones that should go into the OB. 84 User’s Manual VLT-MAN-ESO-14200-2761 o When using extended objects as AO reference sources, make sure that the flux within the specified aperture is correct. Users tend to significantly overestimate this flux. o The verify button on P2PP checks that individual parameters are within the defined ranges and some additional checking on the global logic of selected OBs. Please be very careful: the verify button is a logical check only, hence it will return no error if for example you typed a DIT of 3600s rather than the 36s you meant originally. o The Strehl, seeing and airmass constraints, as well as the epoch, equinox and RA and DEC (and respective proper motion) fields of P2PP will be automatically filled when the configuration file is loaded. Do not edit these fields. o There must be one AO configuration file per target. The same AO configuration file cannot be used for different targets. o For NGS observations of moving targets and where the reference star is itself a moving target, you will have to provide two additional files: the ephemeris file, with the differential tracking expressed in arcsec/sec, which will be attached to the OB at the moment you check it in. The second file is the tracking table, i.e. an ASCII file expressing the offsets in α, δ in arcsec between the moving NGS and the moving target. This file must be inserted in the NAOS-PS software when you prepare the AO configuration file. o Each acquisition, science or calibration template that generates files, writes three header keywords, DPR.CATG, DPR.TYPE and DPR.TECH. These keywords are used by the pipeline, and can be used by the users, to classify files or to make queries in the archive (for example, using the NACO specific query form at http://archive.eso.org/wdb/wdb/eso/naco/form). The complete list of templates and corresponding DPR keywords is given in Section 10. 7.1.1 Offset conventions and definitions Figure 7-1: Orientation for imaging, polarimetry and coronagraphy. (Left): Field orientation on detector at 0o rotation angle on sky, (Right): Field orientation at +45o rotation angle on sky. o For imaging, polarimetry and coronagraphy, East is on the left (−X) of the images for zero position angle. For spectroscopic acquisition, East is at the top (+Y) for zero position angle. o For imaging, polarimetry and coronagraphy, North is at the top (+Y) of the images for a zero position angle. For spectroscopic acquisition, North is on the right (+X) for a zero position angle. 85 User’s Manual VLT-MAN-ESO-14200-2761 o Position angle on sky. This angle is measured in the standard way, i.e. it is positive from North to East. o For polarimetry, a position angle of zero means that the mask is aligned East-West. The templates make extensive use of telescope offsets. In some templates the offsets are set automatically (e.g. NACO_img_obs_AutoJitter), but in others the offsets have to be entered manually as lists. In this latter case, the convention is that offsets are relative. E.g. the following list of offsets RA offset list (arcsec) 0 10 -10 20 -20 DEC offset list (arcsec) 00000 will result in a first image without offset, a second image in which the telescope was moved 10 arcsec East, a third image at the original position, etc. Sometimes offsets may be defined in detector coordinates. In that case, a positive offset in X will move the image to the right (+X) (the telescope offset is therefore in the opposite direction). All offsets are defined in arcsec, even the offsets that are defined in detector coordinates. Therefore, an offset of +10 in X will move the object 10ʺ″ to the right. All offsets are relative from the last position entered. At the end of the template, the telescope will return at the beginning of the sequence if the keyword RETURN is set equal to T. 7.2 7.2.1 NACO General templates NACO_all_obs_Rotate The NACO_all_obs_Rotate template rotates the field of view and it has only one parameter - the rotator offset angle. The angle is in degrees and a positive angle will rotate the adaptor from North to East. Hence, objects in an image will rotate from North to West. The angle is relative; hence the position angle of the field at the end of the rotation will be the position angle of the field before the template was run plus the angle in the template. The template can only be followed by imaging templates. 7.3 NACO Acquisition templates Telescope presets can only be done via acquisition templates and all observing blocks must start with one. There are seven acquisition templates: one for imaging, one for imaging without AO, and one each for spectroscopy, coronagraphy, polarimetry, and two for SAM (one SAM, one SAMPol). They are listed in Table 7-1. Apart from the acquisition template for no AO observations, all acquisition templates preset the telescope to the AO reference star, set up NAOS and CONICA, close the loop and acquire the science target. NACO_img_acq_MoveToPixelNoAO presets to the science target. With the same exception of the acquisition template for no AO observations, all acquisition templates require a NAOS parameter file (an “aocfg” file) which contains information about the target, the reference source, the NAOS setup and other ancillary data. Once this file is loaded, the target fields in P2PP will contain the target coordinates. The acquisition templates can take anywhere from one to five images during the acquisition process. See the description of the individual acquisition templates for a description of what kind of images are recorded. 86 User’s Manual VLT-MAN-ESO-14200-2761 In general, it is not necessary for the acquisition and the subsequent observation templates to have the same DIT and NDIT, nor the same filter, but it is recommended. An exception is SAM, where the mask cannot change from acquisition to science. The detector and readout modes are not parameters of the acquisition templates. They are automatically set and they depend on the filter. For LW filters, the readout mode is set to Uncorr and the detector mode is set to HighDynamic. For all other filters the readout mode is set to Double_RdRstRd and the detector mode is set to HighDynamic. The minimum DITs for these modes are listed in Table 5-2. For very bright targets a neutral density filter can be inserted into the light path. The choices are: Full for no neutral density filter, ND_Long for a LW neutral density filter and ND_Short for a SW neutral density filter. Filter curves are plotted in Section 8. All acquisition templates can be used to acquire PSF stars. In such cases, the “PSF reference? (T/F)” flag should be set to true. Although the NAOS configuration will be ignored during the acquisition, a valid NAOS parameter file is still required (the obvious exception to this is acquisition done in no AO mode, using NACO_img_acq_MoveToPixelNoAO). By default, the “PSF reference? (T/F)” flag is F. Note that this flag, when used with pupil tracking (including SAM) will additionally keep the pupil angle fixed. As of P82 some acquisition templates have been modified to collect useful calibration data, “free” (i.e. at no extra time cost) for the users: 1. NACO_img_acq_MoveToMask: these template sets the instrument in coronagraphic mode. In all cases the setup includes an optical element on glass substrate (thus affected by dust) which does not reposition accurately when it moves in, out and again in the optical path. Night time flat fields are taken for Lp coronagraphs such as the AGPM. 2. NACO_img_acq_MoveToMask has also been modified to allow taking a PSF image and the relative sky. This is useful only when the main target (i.e. the one which will be placed behind the mask) can be used as PSF calibrator. If this is the case, it is not necessary to tick on the PSF keyword in the acquisition template, since this process is completely hard-coded within the template. When the operator elects to take the PSF calibrator, a pop-up window will appear asking for confirmation, the ND filter, if inserted, will be taken out of the path, and two images taken: one with the star in the field but at least 2” off the mask and one with no star (i.e. a sky frame). The files created by these templates are saved together with the acquisition image. They can be recognized by a unique combination of headers keywords: Users should request that they wish their science target to be observed as PSF calibrator in their README file. Alternatively, should the science target be unsuitable as PSF calibrator, a separate OB for the calibrating target (with a name starting with PSF_) should be submitted, and it will be observed immediately after the main science target. In this case, the PSF key in the acquisition template should be ticked on, because this will tell NAOS not to change the AO configuration. The time needed to observe the PSF target will be charged to the user. The NACO_img_acq_MoveToPixelNoAO template will allow an OB to be executed on NaCo without .aocfg files because the AO loop will remain open (“speckle mode”). Pupil tracking is started in the acquisition template and it can be set to true only for the templates that support this feature: NACO_img_acq_SAMMoveToPixel (T by default, angle is fixed) NACO_img_acq_MoveToPixel (usually F, T is optional) NACO_img_acq_MoveToPixelNoAO (usually F, T is optional) NACO_img_acq_MoveToMask (usually F, T is optional). NACO_img_acq_Polarimetry (usually F, T is optional) 87 User’s Manual VLT-MAN-ESO-14200-2761 In these templates, the rotator angle assumes a different meaning, since the pupil tracking flag has been set to T: it is the angle to which the telescope spiders should be set. Rotator angle offsets work the same way as in normal rotator mode. A positive angle moves the spiders clockwise. See Figure 5-25 for an illustration. Notes for Pupil Tracking OB preparation: it is encouraged for the users who wish to maximize their parallactic angle variations (field rotation for ADI) to stipulate in the readme at which LST their OB is supposed to be started (on best effort basis). It is also important for operations that users use the suffix “_Meridian” in their OB names when the OB has to be started close to the meridian. For objects with dec= -24º 35 +/- 4º, the meridian cannot be crossed (the telescope would rotate too fast) and 10 to 20 minutes have to be accounted for unless the OB is split into two parts: “before Meridian” and “after Meridian”. 7.3.1 NACO_img_acq_MoveToPixel This template does a telescope preset and is followed by interactive centering of the object. It should be used for normal imaging. It must be followed by an imaging template. Because the objectives are not aligned with respect to each other, we recommend that the acquisition template and subsequent observing templates use the same objective. In service mode, it is mandatory that users provide detailed information for the field centering on their Finding Charts and/or in their README file. In order for faint objects to be clearly seen, an image of the sky is acquired in an offset position defined by the RA offset (arcsec) and DEC offset (arcsec) parameters. This image is then subtracted from all images that are subsequently displayed on the RTD. The integration time for these acquisition images is defined by the DIT and NDIT parameters. This template records an image of the field after the acquisition has been completed. On some occasions, two additional (Br γ) images of the AO reference source, which are used by the operator to help in classifying the OB, are also taken (the so-called Strehl reference images). Table 7-2: Parameters of NACO_img_acq_MoveToPixel P2PP Label DIT NDIT Type of AO Observation (NGS) PSF Reference? (T/F) Pupil Tracking Mode? (T/F) RA offset (arcsec) DEC offset (arcsec) Position angle on sky Filter Neutral Density Filter Camera NAOS parameter file Default Values NODEFAULT NODEFAULT NODEFAULT F F 5 5 0 NODEFAULT Full NODEFAULT NODEFAULT Description Detector Integration Time (sec) Number of DITs LGS or NGS observation type Set to T if it is a PSF reference star Set to true for PT observations RA offset for sky image DEC offset for sky image Position angle or pupil angle in degrees. Filter name (e.g. Ks) Neutral density Filter (Full=none) Camera Name (e.g. S27) NAOS aocfg file from JNPS 88 User’s Manual 7.3.2 VLT-MAN-ESO-14200-2761 NACO_img_acq_MoveToPixelNoAO This template performs the same actions as the NACO_img_acq_MoveToPixel, except that it will leave the loop open, see Table 7-3 Table 7-3: Parameters of NACO_img_acq_MoveToPixelNoAO P2PP Label DIT NDIT PSF Reference? (T/F) Pupil Tracking Mode? (T/F) RA offset (arcsec) DEC offset (arcsec) Position angle on sky Filter Neutral Density Filter Camera 7.3.3 Default Values NODEFAULT NODEFAULT F F 5 5 0 NODEFAULT Full NODEFAULT Description Detector Integration Time (sec) Number of DITs Set to T if it is a PSF reference star Set to true for PT observations RA offset for sky image DEC offset for sky image Position angle or pupil angle in degrees. Filter name (e.g. Ks) Neutral density Filter (Full=none) Camera Name (e.g. S27) NACO_img_acq_MoveToMask (only with AGPM and VM since P93) This template does a telescope preset and is followed by interactive centering of the object behind the coronagraphic mask. It is very similar to the NACO_img_acq_MoveToPixel template; however, it must be followed by a coronagraphic template. A drawing of the selected mask is displayed on the RTD and is superimposed on the image of the field. The centering of the target is then done interactively. Acquisition must be done with the L27 objective for LW filters and can be done with either the S13 or S27 objectives for SW filters. This template records either two or four images. If two images are recorded, then the first image is an image of the approximately centred target without the mask and the second image is an image of the target accurately centred behind the mask. If four images are recorded, then these images become, respectively, the 3rd and 4th images, and the first two are images of the reference and they are used by the operator to classify the OB. In the case of the AGPM mask, the recorded images are: o An image of the star off the mask (~2” off, with the ND filter inserted if specified in the initial setup) and an image of the sky: these images can be used as PSF calibrator. Then the following steps are performed: o Rough offset to position the star behind the mask o Removal of the ND_Short (ND_Long) filter, if used. For the AGPM, the Apo_165 is inserted and the rotator offset by -15º to align the pupil stop to the telescope spiders. o Adjustment of DIT if needed o Fine centering behind the mask o Record the final acquisition image of the star finely centred behind the mask (with/without the ND filter). 89 User’s Manual VLT-MAN-ESO-14200-2761 Table 7-4: Parameters of NACO_img_acq_MoveToMask P2PP Label Default Values DIT NDIT Type of AO Observation (NGS) PSF Reference? (T/F) Pupil Tracking Mode? (T/F) RA offset (arcsec) DEC offset (arcsec) Position angle on sky Filter Mask Neutral Density Filter Camera NAOS Parameter file 7.3.4 NODEFAULT NODEFAULT NODEFAULT F F 5 5 0 NODEFAULT NODEFAULT Full NODEFAULT NODEFAULT Description Detector Integration Time (sec) Number of DITs LGS or NGS observation type Set to T if it is a PSF reference star Set to T for Pupil tracking observations. RA offset for sky image DEC offset for sky image Position angle or pupil angle in degrees. Filter name (e.g. Ks) Coronagraphic mask Neutral density Filter (Full=none) Camera Name (e.g. S27) NAOS aocfg file from JNPS NACO_img_acq_Polarimetry This template does a telescope preset and is followed by interactive centering of the object. It is very similar to the NACO_img_acq_MoveToPixel template; however, it must be followed by a polarimetric template that uses the Wollaston prism. A drawing of the polarimetric mask is displayed on the RTD and is superimposed on the image of the field. The centering of the target is then done interactively. Acquisition must be done with the L27 objective for LW filters or the S27 objective for SW filters. The subsequent polarimetric science templates allow one to set the angle before each template starts. This template records an image of the field after the acquisition has been completed. If three images are recorded, then the first two are images of the reference and they are used by the operator to classify the OB. Table 7-5: Parameters of NACO_img_acq_Polarimetry P2PP Label DIT NDIT Type of AO Observation (NGS) PSF Reference? (T/F) Pupil Tracking Mode? (T/F) RA offset (arcsec) DEC offset (arcsec) Position angle on sky Filter Neutral Density Filter Camera Polarimetric mask NAOS parameter file Default Values NODEFAULT NODEFAULT NODEFAULT F F 5 5 0 NODEFAULT Full S27 Wollaston_00 NODEFAULT Description Detector Integration Time (sec) Number of DITs LGS or NGS observation type Set to T if it is a PSF reference star DEFAULT = F. PT supported since P88. RA offset for sky image DEC offset for sky image Position angle Filter name (all filters theoretically supported) Neutral density Filter (Full=none, DEFAULT) Camera name, DEFAULT = S27 Wollaston_00 or empty. DEFAULT=Wollaston_00. NAOS aocfg file from the JNPS 90 User’s Manual 7.3.5 VLT-MAN-ESO-14200-2761 NACO_img_acq_SAMMoveToPixel (for SAM and SAMPol) This template is used for the acquisition of both SAM and SAMPol targets. The user select whether to use SAM or SAMPol by entering “empty” or “Wollaston_00” in the “Polarizer Wheel” entry. The template does a telescope preset and then sets the pupil-tracking mode sending the spiders to a pre-defined angle, which depends on the SAM mask being used. This angle is chosen to prevent the telescope spiders from intersecting any holes in the mask. The rest of the acquisition is identical to that of NACO_img_acq_MoveToPixel. The template always saves the final acquisition image. The operator will centre the object in the centre of the detector, at pixel (512,512), since in most cases the following science template will make use of a windowed detector in cube mode (recommended setup). The window is always centred on (512,512). For SAMPol, the final step is the insertion of the Wollaston_00 in the beam. The template always saves the final acquisition image. Since the J filter and the Wollaston are in the same filter wheel, SAMPOL observations with the J broad-band are not possible. This template can be followed NACO_sampol_obs_GenericOffset. by either NACO_sam_obs_GenericOffset or Table 7-6: Parameters of NACO_img_acq_SAMMoveToPixel P2PP Label DIT NDIT Type of AO Observation (LGS/NGS) PSF Reference? (T/F) Pupil Tracking Mode? (T/F) RA offset (arcsec) DEC offset (arcsec Position angle on sky Filter Sparse Aperture Mask Polarizer Wheel Camera NAOS Parameter file 7.4 Default Values NODEFAULT NODEFAULT NODEFAULT F T 5 5 0 NODEFAULT NODEFAULT NODEFAULT NODEFAULT NODEFAULT Description Detector Integration Time (sec) Number of DITs LGS or NGS observation type Set to T if it is a PSF reference star Always set to T. PT is compulsory. RA offset for sky image DEC offset for sky image Position angle Filter name SAM mask empty or Wollaston_00 Camera name NAOS aocfg file from JNPS NACO imaging science templates For observations with the SW filters, the readout mode of the detector should be set to either Double_RdRstRd or FowlerNsamp. For observations with LW filters the readout mode should be set to Uncorr. All imaging templates make use of the NEXPO per offset position parameter. It is the number of exposures (one exposure = DIT × NDIT) per offset position. For very bright targets (see Section 6.14), a neutral density filter can be inserted into the light path. The choices are Full for no neutral density filter, ND_Long for a LW neutral density filter and ND_Short for a SW neutral density filter. For LW observations without chopping, only the NACO_img_obs_AutoJitter template should be used. The sky subtraction with the other templates is generally unsatisfactory. 91 User’s Manual 7.4.1 VLT-MAN-ESO-14200-2761 NACO_img_obs_AutoJitter This template offsets the telescope between exposures according to a random pattern of offsets automatically determined by the template. It is ideal for long integrations on sparse fields, and does not require a long list of offsets to be defined. The offsets are distributed randomly within a box whose size is defined by the parameter “Jitter Box Width” (in arc seconds), with the condition that the distance between any two points in a series of ten values is greater than a system-determined minimum. This is intentionally done to ensure that the 5 frames before and after any frame are spatially not too close and can be safely used for creating skies without residual objects for sky subtraction. Figure 7-2: An illustration of the NACO_img_obs_AutoJitter. In this example the jitter box width is set to 10ʺ″, NEXPO is 1, number of offset position is 7, Return to Origin? is T and the camera is S27. The dotted line defines the jitter box width. The value of the “Jitter Box Width” parameter corresponds to the full width of the box in which the offsets are generated. Defining too wide a box may lead to poor image overlap. Conversely, too small a value may lead to poor sky subtraction near extended objects. By construction, there is no telescope offset before the first exposure. If the parameter “Return to Origin? (T/F)” is set to true (T) the telescope moves back to its original position at the end of the template. If not the telescope is not moved. The total integration time (excluding overheads) is defined, in seconds, by: DIT × NDIT × NEXPO per offset position × Number of offset positions 92 User’s Manual VLT-MAN-ESO-14200-2761 Table 7-7: Parameters of NACO_img_obs_AutoJitter 7.4.2 P2PP Label Default Values Description DIT NDIT Readout mode Window Size Observation Category Store Data Cube? (T/F) Jitter Box width NEXPO per offset position Number of offset positions Return to Origin? (T/F) Filter Neutral Density Filter Camera NODEFAULT NODEFAULT Double_RdRstRd 1024 SCIENCE F NODEFAULT 1 NODEFAULT T NODEFAULT Full NODEFAULT Detector Integration Time (sec) Number of DITs Readout mode Size of the window Observation Category Data cube flag Jitter box width Number of exposures per offset position Number of offset positions Return to origin at the end of the template Filter name Neutral density filter (Full=none) Camera Name NACO_img_obs_GenericOffset This template is used for imaging and has the flexibility to do any sequence of telescope offsets, either in detector or sky coordinates. Telescope offsets are defined as lists with the parameters List of offsets in RA or X and List of offsets in DEC or Y. The offsets are relative to the previous position, are in RA and DEC or in X and Y depending on the Offset Coordinates parameter, and are defined in arcsec. Additionally, the observation type can be defined for each image, and is entered as a list in the parameter “Observation Type (O or S).” O stands for Object and assigns the DPR.TYPE header keyword to OBJECT. S stands for Sky and assigns the DPR.TYPE header keyword to SKY. The AO loop is closed for the former and open for the latter. The total number of offset positions is defined in the parameter “Number of offset positions.” This number can be different from the number of elements in the aforementioned lists. Lists do not need to have the same length. If the number of exposures is larger than the number of elements in a list, the list is restarted from the beginning as many times as needed until the correct number of frames have been acquired. The lists can have any length; however, having lists of different lengths can become extremely confusing. It is good practice to use lists of equal length or lists with only one value if one parameter is not changed. At the end of the template, the telescope is returned to the original position. Figure 7-3 and Figure 7-4 illustrate how this template can be used. The total integration time is defined, in seconds, by: DIT× Σ number of offset positions NDIT(i) × NEXPO per offset position 93 User’s Manual VLT-MAN-ESO-14200-2761 Table 7-8: Parameters of NACO_img_obs_GenericOffset P2PP Label Default Values Description DIT Readout mode Window Size Observation Category Store Data Cube? (T/F) List of NDITs NEXPO per offset position Number of offset positions Observation type (O or S) Offset coordinates List of offsets in RA or X List of offsets in DEC or Y Filter Neutral Density Filter Camera NODEFAULT Double_RdRstRd 1024 SCIENCE F NODEFAULT 1 NODEFAULT NODEFAULT NODEFAULT NODEFAULT NODEFAULT NODEFAULT Full NODEFAULT Detector Integration Time (sec) Readout mode Size of the window Observation Category Data cube flag List of NDITs Number of exposures per offset position Number of offset positions O is in closed loop, S in open loop SKY or DETECTOR Offsets in arcsec Offsets in arcsec Filter name Neutral density filter (Full=none) Camera Name Figure 7-3: An illustration of how the NACO_img_obs_GenericOffset template works. In this example the offsets are in DETECTOR co-ordinates. Exposures 1 and 5 occur at the same place. The telescope will return to the origin after the eighth exposure, as indicated by the dashed line connecting point 8 to 1. The parameter settings for this example were: Table 7-9: parameters for the example shown in Figure 7-3 NEXPO per offset position = 1 Observation Type (O or S)= O Number of offset positions = 8 Offset Coordinates = DETECTOR Camera = S27 List of offsets in RA or X = 0 3 0 -3 0 0 -3 0 List of offsets in DEC or Y = 0 0 7 0 -7 -7 0 7 94 User’s Manual VLT-MAN-ESO-14200-2761 Figure 7-4: A second illustration of how the NACO_img_obs_GenericOffset template works. As with the previous example, exposures 1 and 5 occur at the same place, and the telescope returns to the origin after the eighth exposure (indicated by the dashed line connecting point 8 with 1/5). The parameter settings for this example are given in Table 7-10. Table 7-10: parameters for the example shown in Figure 7-4 NEXPO per offset position = 1 Observation Type (O or S)= O Number of offset positions = 8 Offset Coordinates = SKY Camera = S27 List of offsets in RA or X = 0 4 0 -4 0 0 -4 0 List of offsets in DEC or Y = 0 0 8 0 -8 -8 0 8 7.4.3 NACO_img_obs_GenericOffsetNoAO This is the “speckle mode” template, allowing cube mode, hardware windowing, open-loop observations. It’s a copy of NACO_img_obs_GenericOffset, all SW filters will be allowed and the Offsets will be optional (one can always put 1 and 0/0 to stare). Since P88 it is possible to set Return= F (default was T) so that the telescope stays at the position of the last offset of the template instead of coming back to the initial position. This is for users who wish to perform quick “star hopping” cycles between their science and their calibrators, at their own risks (only VM, taking into account the offset sizes with the night astronomer and telescope operator). 7.4.4 NACO_img_obs_FixedSkyOffset This template moves the telescope alternatively between ‘object’ and ‘sky’ positions. The ‘object’ positions are randomly distributed around the initial telescope position and within a box whose dimensions are set by the parameter “Jitter Box Width” (in arcsec). The ‘sky’ positions are randomly distributed around a position that is set at a constant distance (defined by the parameters “Sky offset in DEC” and “Sky offset in RA”) from the original telescope position and within a box whose dimensions are set by the parameter “Jitter Box Width” (in arcsec). The ‘object’ positions’ will be observed with the AO loop closed. For the ’sky’ positions, the AO loop will be open. By default, there is no telescope offset before the first exposure. The telescope moves back to its original position at the end of the template. 95 User’s Manual VLT-MAN-ESO-14200-2761 The Number of AB or BA cycles defines the number of OBJECT-SKY or SKY-OBJECT cycles to be executed. These cycles are executed in ABBA sequences. E.g. if Number of AB or BA cycles is set to 3, 6 exposures will be taken in an ABBAAB sequence. In addition, the template provides the flexibility to adjust the number of NDIT sub-integrations for the OBJECT and SKY frames. NDIT for the OBJECT positions defines the number of subintegrations on the object, and NDIT for the SKY positions defines the number of sub-integrations on the sky. The total integration time (excluding overheads) is defined, in seconds, by: DIT × (NDIT for the OBJECT positions + NDIT for the SKY positions) × NEXPO per offset position × Number of AB or BA cycles Thus, the total integration time on the sky and on the object can be adjusted so that the S/N on the object is optimised. Remember that the ”30 second per telescope position rule” means here that both (DIT x NDIT for the OBJECT positions × NEXPO per offset position plus overheads) and (DIT × NDIT for the SKY positions × NEXPO per offset position plus overheads) shall each exceed 30 seconds of time. Table 7-11: Parameter of NACO_img_obs_FixedSkyOffset P2PP Label Default Values Description DIT Readout mode Window Size Store Data Cube? (T/F) Jitter box width Number of AB or BA cycles NDIT per object position NDIT per sky position NEXPO per offset position Number of offset positions Sky offset in RA Sky offset in DEC Filter Neutral Density Filter Camera NODEFAULT Double_RdRstRd 1024 F NODEFAULT NODEFAULT NODEFAULT NODEFAULT 1 NODEFAULT NODEFAULT NODEFAULT NODEFAULT Full NODEFAULT Detector Integration Time (sec) Readout mode Size of the window Data cube flag Jitter Box Width One cycle is one object-sky pair Number of DITs for the OBJECT Number of DITs for the SKY Number of exposures per offset position Number of offset positions RA offset in arcsec Dec offset in arcsec Filter name Neutral density filter (Full=none) Camera Name Figure 7-5 illustrates how this template can be used. 96 User’s Manual VLT-MAN-ESO-14200-2761 Figure 7-5: An illustration of how the NACO_img_obs_FixedSkyOffset template works with Jitter Box Width = 9, Number of AB or BA cycles = 4, Sky offset in Dec. = 15, Sky offset in RA. = -35 and Camera = S13 The AO loop is off when the sky is observed (large filled in circles) and on when the object is observed (small filled in circles). The dashed line connecting 8 with 1 is the offset done at the end when the telescope returns to origin. The dashed box is defined by the Jitter Box Width. 7.4.5 NACO_img_cal_StandardStar This template is used for imaging standards and is similar to the NACO_img_obs_GenericOffset template with the difference that some DPR keywords in the FITS headers of the images are set to different values allowing pipeline processing and archiving. Additionally, NDIT is single valued in this template and offsets are in detector coordinates only. This template should be used by all users who wish to take calibrations (standard stars observation) beyond the ones provided by the Calibration Plan. Table 7- describes the parameters of this template Table 7-12: Parameters of NACO_img_cal_StandardStar P2PP Label Default Values Description DIT NDIT Readout mode Window Size Store Data Cube? (T/F) NEXPO per offset position Number of offset positions List of offsets in X List of offsets in Y Filter Neutral Density Filter Camera NODEFAULT NODEFAULT Double_RdRstRd 1024 F 1 NODEFAULT NODEFAULT NODEFAULT NODEFAULT Full NODEFAULT Detector Integration Time (sec) Number of DITs Readout mode Size of the window Data cube flag Number of exposures per offset position Number of offset positions Offsets in arcsec Offsets in arcsec Filter name Neutral density filter (Full=none) Camera Name 97 User’s Manual 7.5 VLT-MAN-ESO-14200-2761 NACO polarimetry science templates These templates are for polarimetric observations with the Wollaston prism. For SW observations, the readout mode of the detector should be set to either Double_RdRstRd or FowlerNsamp. For LW observations, the readout mode should be set to Uncorr. All other combinations will be rejected at the time the OBs are checked. For very bright target, a neutral density filter can be inserted into the light path. The choices are Full for no neutral density filter, ND_Long for a LW neutral density filter and ND_Short for a SW neutral density filter. Since the J-band filter is in the same wheel as the Wollaston, J-band polarimetric observations are not feasible. 7.5.1 NACO_pol_obs_GenericOffset This template is used for imaging polarimetry. It can be used with all filters with the exception of J and Mp. Rotator offset angles can now be entered as a list. The angles are relative, so a sequence with 0 45 45 45 would rotate the field by 0, 45, 90 and 135 degrees from the original rotator position. Due to difficulties in compensating for rotator offsets with the FS, we are presently requesting observers to keep the relative offset angle to 45 degrees or less. Additionally, the user can choose to rotate the rotator to the original rotator position once the template has ended with the parameter Return to the Original Rotator Position? (T/F). For observations with NAOS-CONICA the default value for this flag is False. After each rotator offset, the telescope can offset according to a user defined list. Spatial offsets are defined with the parameters List of offsets in X and List of offsets in Y. The offsets are relative to the previous position, are in X and Y and are defined in arcsec. Additionally, the observation type can be defined for each image, and is entered as a list in the parameter “Observation Type (O or S).” O stands for Object and assigns the DPR TYPE header keyword to OBJECT. S stands for Sky and assigns the DPR TYPE header keyword to SKY. The AO loop is closed for the former and open for the latter. The total number of spatial offsets is defined by the parameter “Number of offset positions” This number can be different from the number of elements in the aforementioned lists. If the number of spatial offsets is larger than the number of elements in a list, the list is restarted from the beginning as many times as needed until the correct number of offsets has been done. These lists can have any length; however, having lists of different lengths can become extremely confusing. It is good practice to use lists of equal length or lists with only one value if one parameter is not changed. The total number of exposures is given by: number of rotator positions × Number of offset pos × NEXPO per offset pos Unlike other templates, this template does not have a “Return to Origin ? (T/F)” flag. This flag refers to the spatial offsets only and the template will do this automatically before rotating the rotator to the new position. With this scheme, it is possible for the user to sample the object and the sky as desired at several rotator positions. It is also possible to code the template so that the object and sky are sampled as desired for one angle only. The template can be restarted with another orientation on the sky for another series of exposures. At least two different orientations, separated by 45 degrees, are required for computing the Stokes parameters. 98 User’s Manual VLT-MAN-ESO-14200-2761 Table 7-13: Parameters of NACO_pol_obs_GenericOffset P2PP Label Default Values Description DIT NDIT Readout mode NEXPO per offset position Number of offset positions Observation type (O or S) Offset coordinates List of offset in X List of offset in Y Return to the original rotator position ?(T/F) List of position angle Offsets Filter Neutral density filter Camera NODEFAULT NODEFAULT Double_RdRstRd 1 NODEFAULT NODEFAULT NODEFAULT NODEFAULT NODEFAULT F Detector Integration Time (sec) Number of DITs Readout mode Number of exposures per offset position Number of offset positions O is in closed loop, S in open loop SKY or DETECTOR Offsets in arcsec Offsets in arcsec Return to original rotator position at the end of the template List of rotator offsets in degrees Filter Name Neutral Density filter Camera Name NODEFAULT NODEFAULT Full NODEFAULT To image the entire field of view at one position angle, one must take great care with the offsets. The opaque and transmitting parts of the mask have slightly different widths. The opaque strips have a width of 3.9ʺ″ and the transmitting strips have a width of 3.1ʺ″. An example of how one may choose to image the entire field of view is given in Figure 7-6. The total integration time (excluding overheads) is defined, in seconds, by: DIT × NDIT × NEXPO per offset pos × Number of offset pos × number of rotator pos Figure 7-6: An illustration of how the NACO_pol_obs_GenericOffset template works with Number of offset positions = 9, NEXPO per offset position = 1, Observation Type (O or S) = O, List of offsets in X = -4 0 0 4 0 0 4 0 0, List of offsets in Y = 2.3 -2.3 -2.3 0 2.3 2.3 0 2.3 -2.3 and List of Position Angle Offsets = 0 45 The dashed line connecting position 9 with 5 is the offset done after the 9th and 18th exposures. Position 5 corresponds to the position the target was acquired. This sequence has been designed so that the entire field of view is covered. 99 User’s Manual 7.5.2 VLT-MAN-ESO-14200-2761 NACO_pol_obs_Retarder This template is used for imaging polarimetry exclusively with the half-wave plate. It can be used with all filters with the exception of J and Mp and with the Wollaston prism. This templates works with defined (generic) offsets. It must follow the acquisition template NACO_img_acq_Polarimetry. For each given offset position, the template runs over the list of half-wave plate angles before moving to the next offset position. Only at the end of the OB does the telescope move back to the original position and the half-wave plate to its default position (i.e. 0). The angles in the list of halfwave plate angle are relative one from the other, e.g. (0, 22.5, 22.5, 22.5) would correspond to an absolute rotation of (0, 22.5, 45, 67.5). Note that the first angle provided is absolute, since the HWP is always set to its zero position at the beginning of the template. Once the template has run over the list of half-wave plate angles, the telescope can offset according to a user-defined list. Spatial offsets are defined with the parameters List of offsets in X and list of offsets in Y. The offsets are relative to the previous position, are in X and Y and are defined in arcsec. Additionally, the observation type can be defined for each image, and is entered as a list in the parameter “Observation Type (O or S).” O stands for Object and assigns the DPR TYPE header keyword to OBJECT. S stands for Sky and assigns the DPR TYPE header keyword to SKY. The AO loop is closed for the former and open for the latter. The total number of spatial offsets is defined by the parameter “Number of offset positions” This number can be different from the number of elements in the aforementioned lists. If the number of spatial offsets is larger than the number of elements in a list, the list is restarted from the beginning as many times as needed until the correct number of offsets has been done. These lists can have any length; however, having lists of different lengths can become extremely confusing. It is good practice to use lists of equal length or lists with only one value if one parameter is not changed. The total number of exposures is given by: NEXPO per offset pos × number of half-wave plate angle × Number of offset pos Unlike other templates, this template does not have a “Return to Origin? (T/F)” flag. By default at the end of the template the telescope returns at the original position. It is important to remember that for technical reasons the HWP is moved into the beam, and set to its zero position at the beginning of the template and then it is moved out of the beam at the end of the template. This introduces an extra 1-minute overhead per template. Table 7-14: Parameters of NACO_pol_obs_Retarder P2PP Label Default Values Description DIT NDIT Readout mode NEXPO per offset position Number of offset positions Observation type (O or S) List of offset in X List of offset in Y List of position angle offsets Filter Polarizer Wheel NODEFAULT NODEFAULT Double_RdRstRd 1 NODEFAULT NODEFAULT NODEFAULT NODEFAULT NODEFAULT NODEFAULT Wollaston_00 Neutral density filter Camera Full NODEFAULT Detector Integration Time (sec) Number of DITs Readout mode Number of exposures per offset position Number of offset positions O is in closed loop, S in open loop Offsets in arcsec Offsets in arcsec List of HWP angles Filter Name Wollaston_00 or empty. Setting to Wollaston_00 (default) will insert the Wollaston prism and the Wollaston mask. Neutral Density filter Camera Name 100 User’s Manual VLT-MAN-ESO-14200-2761 The template can be restarted with another orientation on the sky for another series of exposures. At least two different half-wave plate orientations, separated by 22.5 degrees, are required for computing the Stokes parameters. By definition a rotation of the polarisation plane by 45 degrees does correspond to a rotation of the half-wave plate by 22.5 degrees. To image the entire field of view, while observing with the Wollaston prism the same care must be taken as for observation with the NACO_pol_obs_GenericOffset template (see Section 7.5.1). The total integration time (excluding overheads) is defined, in seconds, by: DIT × NDIT × NEXPO per offset pos × number of half-wave plate angle × Number of offset pos The angle of the HWP used is reported in the FITS header under INS.RETA2.NAME. Previously this keyword did not exist. The angle of the HWP can be retrieved from INS.ADC1.ENC (HWP encoder) via the following formula: HWP angle = ((HWP encoder + 205 ) / (4096/360))modulo(360) Example: angles of 0 & 22.5 correspond to INS.ADC1.ENC = 3891 & 51 respectively. This information remains available from the FITS header. Note that the Polarizer Wheel parameter by default is set to Wollaston_00, which will insert both the Wollaston mask and prism. If it is set to empty, both the Wollaston mask and prism will not be inserted; rather, the FLM_13 or the FLM_27 (normal non-polarimetric imaging) masks will be selected according to the camera (S13 or S27). 7.5.3 NACO_pol_cal_StandardStar This template should be used to observe polarimetric standards that do not require chopping. It is strictly equivalent to the NACO_pol_obs_GenericOffset (see 7.5.1) template with the difference that some DPR keywords in the FITS headers of the images are set to different values allowing pipeline processing and archiving 7.6 NACO coronagraphic science templates For LW observations (with Lyot coronagraphs or the AGPM), the readout mode is set to Uncorr. 7.6.1 NACO_coro_obs_Stare (only with AGPM since P93) This template is used for coronagraphic observations and it moves the telescope alternatively between a fixed object position and a sky position. The parameter Number of AB or BA cycles defines the number of times this is done, but, unlike the NACO_img_obs_FixedSkyOffset template, the sequence is ABABAB and not ABBAAB for the example in which the Number of AB or BA cycles is set to 3. The template will likely be modified during P96. Details will appear on the NACO news page and the NACO manual when implemented. The number of exposures at the object position is defined by the Number of Exposures (Object Only) parameter. The telescope does not offset between these exposures. The number of exposures at the sky position is defined by the Number of offset positions (Sky only) and the telescope can offset between these exposures. The ‘sky’ positions are randomly distributed around a position that is set at a constant distance (defined by the parameters “Sky offset in DEC” and “Sky offset in RA”) from the original telescope position and within a box whose dimensions are set by the parameter “Jitter Box Width” (in arcsec). It is strongly recommended, especially for very bright sources to select an area so that the main target is out of the field of view 101 User’s Manual VLT-MAN-ESO-14200-2761 for sky measurements (to avoid saturation effects). The coronagraphic mask is left in the beam for the sky exposures. The ‘object’ positions will be observed with the AO loop closed. The ’sky’ positions will be observed with the AO loop open. The template provides the flexibility to adjust the number of NDIT sub-integrations for the OBJECT and SKY frames. NDIT for the OBJECT positions defines the number of subintegrations on the object, and NDIT for the SKY positions defines the number of sub-integrations on the sky. The total integration time (excluding overheads) is defined, in seconds, by: DIT × (NDIT for the OBJECT pos × Number of Exposures (Object Only) + NDIT for SKY positions × Number of offset positions (Sky only)) × Number of AB cycles. Table 7-15: Parameters of NACO_coro_obs_Stare P2PP Label Default Values DIT Readout mode Window Size Store Data Cube? (T/F) Jitter Box Width Number of AB cycles NDIT for OBJECT positions NDIT for SKY positions Number of exposures (Object only) Number of offset positions (Sky only) Sky offset in RA Sky offset in DEC Filter Mask Position Camera Description NODEFAULT Double_RdRstRd 1024 F NODEFAULT NODEFAULT NODEFAULT Detector Integration Time (sec) Readout mode Size of the window Store in data cube flag Jitter box width (SKY only) Number of AB cycles (e.g. 2 for ABAB) Number of DITs for OBJECT NODEFAULT NODEFAULT Number of DITs for SKY Number of exposures on target NODEFAULT Number of exposures on sky NODEFAULT NODEFAULT NODEFAULT NODEFAULT NODEFAULT RA offset for sky in arcsec DEC offsets for sky in arcsec Filter Name Coronagraphic mask Camera Name 102 User’s Manual VLT-MAN-ESO-14200-2761 Figure 7-7: An illustration of how the NACO_coro_obs_Stare template works. The dashed line connecting position 10 with 1 is the offset done at the end of the template, when the telescope returns to origin. The rather erratic bold lines are wires, which hold the coronagraphic mask in place. The AO loop is off when the sky is observed (large filled in circles) and on when the object is observed (small filled in circles). In this example, the parameter settings were: Number of AB cycles = 2, Number of Exposures (Object Only) = 2, Number of offset positions (Sky only) = 3, Jitter Box Width = 9, Sky offset in Dec. = 15, Sky offset in RA. = -35, Camera = S13 If Number of offset positions (Sky only) is set to zero, the sky is not observed. In this case the total integration time is DIT × NDIT for the OBJECT positions × Number of Exposures (Object Only) and all other parameters are ignored. In this way the template takes a series of exposures of the target without offsets. However, sky subtraction is almost always required, so this option will probably only be used in very special circumstances. 7.6.2 NACO_coro_cal_NightCalib For the LW filters (for AGPM coronagraphy), the only alternative is to use a sky frame to flat field the data. 7.7 NACO SAM and SAMPol science templates Starting in P83, there are two SAM-based science templates; one for SAM observations and the other for SAMPol. 7.7.1 NACO_sam_obs_GenericOffset The science template is similar to NACO_img_obs_GenericOffset. Note that, however not compulsory, SAM will use cube mode for data storage as a default. This, and the handling of the offsets in pupil tracking mode, account for most of the differences with the NACO_img_obs_GenericOffset. Cube mode is highly recommended with the Double_RdRstRd setup. FowlerNsampling has very large overheads and users should weight the loss of time carefully against the advantage of lower noise. 103 User’s Manual VLT-MAN-ESO-14200-2761 In the most basic mode (i.e. recommended setup), SAM will typically require a 512x514 sub frame, and observations will occur in pairs that are dithered between two separate quadrants (e.g. bottom left, top right). Offsets must be given in DETECTOR coordinates, to avoid that the changing position angle on sky, introduced by the pupil-tracking mode in use with SAM, puts the objects in ever different locations on the detector, or worse, outside of the available field. The operator always centres the object on pixel (512,512) and the subsequent offset sequence can be of the type: offsets in X (1 -2), offsets in Y (1 -2), with the result that the star goes from upper right to lower left. Another possible sequence, uses all four quadrants alternatively: offsets in X (1 -2 0 2) and offsets in Y (1 -2 2 -2) will move the object from the centre to upper right to lower left, to upper left and finally to the lower right quadrant. Sky observations will be dealt with as usual (open loop, offset set by the user in the offset sequence, always in DETECTOR coordinates). Table 7-16 describes the parameters of this template. As always in cube mode, DIT=0 will set the minimum integration time allowed for the specific readout mode and window size. The NDIT for each frame is limited by the final cube file size, set to a maximum of 512 MB. For each exposure it can be set to a different number (i.e. list of NDIT can be 2000, 50 100 100). Since most SAM objects are bright, it is always convenient using cube mode and perform shift and add techniques during post-processing of the data. Please refer to Section 5.5 for information on the available setups. Table 7-16: Parameters of NACO_sam_obs_GenericOffset P2PP Label Default Values Description DIT Readout mode Window Size Store Data Cube? (T/F) List of NDITs NEXPO per offset position Number of offset positions Observation type (O or S) Offset coordinates List of offsets in RA or X List of offsets in DEC or Y Filter SAM Mask Camera Return? NODEFAULT Double_RdRstRd 1024 T NODEFAULT 1 NODEFAULT NODEFAULT NODEFAULT NODEFAULT NODEFAULT NODEFAULT Full NODEFAULT T/F Detector Integration Time (sec) Readout mode Size of the window Data cube flag List of NDITs Number of exposures per offset position Number of offset positions O is in closed loop, S in open loop Choose DETECTOR Offsets in arcsec Offsets in arcsec Filter name Name of SAM mask Camera Name Return to origin after last offset Since P88 it is possible to set Return= F (default was T) so that the telescope stays at the position of the last offset of the template instead of coming back to the initial position. This is for users who wish to perform quick “star hopping” cycles between their science and their calibrators, at their own risks (only VM, taking into account the offset sizes with the night astronomer and telescope operator). 7.7.2 NACO_sampol_obs_GenericOffset The science template is similar to NACO_sam_obs_GenericOffset. From an operational point of view the only difference is that the Wollaston_00 is inserted in the optical path (at the end of the acquisition template). Given the small field of views of SAM, it is not necessary to use the image plane mask. In order to get all the Stokes parameters, the template uses the half-wave plate. 104 User’s Manual VLT-MAN-ESO-14200-2761 Since the field of view is now halved, offsets in the Y direction have to be very small. Table 7-17 describes the parameters of this template. Table 7-17: Parameters of NACO_sampol_obs_GenericOffset P2PP Label Default Values Description DIT Readout mode Window Size Store Data Cube? (T/F) List of NDITs NEXPO per offset position Number of offset positions Observation type (O or S) Offset coordinates List of offsets in RA or X List of offsets in DEC or Y List of position angle offsets Filter SAM Mask Camera NODEFAULT Double_RdRstRd 1024 T NODEFAULT 1 NODEFAULT NODEFAULT NODEFAULT NODEFAULT NODEFAULT NODEFAULT NODEFAULT Full NODEFAULT Detector Integration Time (sec) Readout mode Size of the window Data cube flag List of NDITs Number of exposures per offset position Number of offset positions O is in closed loop, S in open loop Choose DETECTOR Offsets in arcsec Offsets in arcsec List of HWP angles Filter name Name of SAM mask Camera Name 105 User’s Manual 8 8.1 VLT-MAN-ESO-14200-2761 FILTER TRANSMISSION CURVES CONICA Broad Band Imaging and order sorting filters The transmission curves at the J, H, Ks, Lp, Mp, and spectroscopic order-sorting filters are displayed in Figure 8-1. Electronic versions of the transmission curves of all filters, including the NB and IB filters, are available from the NACO web pages: http://www.eso.org/sci/facilities/paranal/instruments/naco/inst/filters.html Figure 8-1: Filter curves for J, H, Ks, Lp and Mp and the order-sorting spectroscopic filters SJ, SK, L. 106 User’s Manual VLT-MAN-ESO-14200-2761 CONICA Neutral Density Filters CONICA is equipped with a short wavelength (1 to 2.5 µm) and a long-wavelength (>2.5 µm) neutral density filter. The wavelength dependence of the attenuation is shown in Figure 8-2 Figure 8-2: Transmission curves of the CONICA neutral density filters. 107 User’s Manual 9 VLT-MAN-ESO-14200-2761 PREPARATION SOFTWARE This section describes the Preparation Software (PS), which is a key tool in the preparation of OBs in both Visitor and Service Mode. The purpose of the PS is to find the optimal NAOS configuration for a given set of conditions, to compute the associated performance and to provide input to P2PP and the ETC. Input to the PS is done through a Graphical User Interface (GUI) and includes atmospheric conditions, such as seeing and airmass, target parameters, such as the observing wavelength and the dichroic, and reference source parameters, such as brightness, morphology and the distance between reference and target. Output consists of a configuration file for P2PP (Sec. 9.5.7), an estimate of the performance in terms of Strehl, a 2-dimensional PSF, and an HTML formatted file (Sec. 9.5.6) for the ETC. The ETC can be accessed via the web based interface at http://www.eso.org/observing/etc/ or via the HTML file produced by PS. Finally, in the course of the execution of the observations at the telescope, the PS is able to take into account the current external conditions and actual reference (instead of expected) source characteristics to optimize the observations, still respecting the astronomer’s requirements for observing wavelength, transmission, and so on. The FITS headers of NACO data contain all the necessary information on the setup used. Users can select the WFS directly. This will allow users to use the N90C10 dichroic as neutral density filter for CONICA when using the visual WFS. Additionally, we have updated some parameters to better reflect the average conditions of the atmosphere above Paranal. 9.1 Starting the PS The NAOS Preparation Software can be downloaded for a number of computer platforms at the following URL: http://www.eso.org/sci/observing/phase2/SMGuidelines/NAOSPS.html. After installation, a link to the general server situated at ESO will be required (i.e. the local computer has to have access to the Internet). In principle, JNPS will work within any Java Virtual Machine which supports Java Development Kit (JDK) 1.5.0 or later. It has been reported to work using a variety of Unix and Linux flavours, as well as MacOS X. Until further notice, ESO will only officially support JNPS under Scientific Linux 4.3. The PS client is started by typing the command: jnps After initialization, the main GUI will appear. The start-up procedure partly depends on the contents of your preferences file, which is created in your home directory when you start the PS for the first time. This file, called .jnpscf, contains the user’s choices for several items, some of which can be accessed via the Preferences menu of the main GUI. 9.2 Graphical User Interface Overview The GUI that appears after the initialization phase is depicted in Figure 9-1. The panel is divided into three areas, which are, from top to bottom: o The menu bar, giving access to file-related operations and other miscellaneous functionalities (see following sections). 108 User’s Manual VLT-MAN-ESO-14200-2761 o The main panel, divided in four sub-areas which respectively deal with the science target, the reference object, the sky conditions, and resulting performance (image quality). o The action area, gathering general actions such as requests for optimization, or creation of the P2PP parameter file and the HTML file for the ETC. Figure 9-1:PS GUI (Note: The current version is v1.105. The GUI for the current version differs from the one depicted above only in the version number that appears on the top bar.) 9.3 Target and Instrument Setup The observing wavelength (in µm) can be entered as a filter, in which case the wavelength automatically appears, or it can be entered directly by selecting free from the list of CONICA filters and then typing the value directly into the space provided. The dichroic name can be selected or left free. If left free the PS will select the dichroic, which maximizes the Strehl, which usually means that most of the light will be sent to NAOS. If another dichroic is preferable, then the dichroic can be selected here. Table 4-1 gives the conditions under which the various dichroics should be used. Users should familiarize themselves with the contents of this table. In particular, the most critical choice will be between the N90C10 and N20C80 dichroics. The former will result in higher Strehl ratios but much lower sensitivity, particularly in the K band. The N90C10 dichroic can also be selected with the visible WFS in order to reduce the flux transmitted to CONICA (for instance with a very bright source). In a similar way, the wavefront sensor can be selected. Only NGS is a valid choice. Target information consists of a name, coordinates and proper motion. For the proper motion to be taken into account, it is compulsory to provide both epoch and equinox for which the 109 User’s Manual VLT-MAN-ESO-14200-2761 coordinates are provided. The corresponding coordinates at the time of observation does correspond to the precessed coordinates at the mean epoch for a given period, i.e. 2007.0 for P78, 2007.5 for P79 and so on; this is the hard coded epoch of the reference target. The epoch of the science target is a free parameter to set (between 1850. & 2100.). The target and AO reference star can have different proper motion. It is however assumed that the coordinates are given for the same equinox. 9.4 Sky Conditions The user characterizes the observing conditions via two parameters, the seeing (at Zenith and measured at 0.5 µm) and the airmass. The ”on axis” quantities, such as the seeing on the reference, are automatically computed from these two parameters and some assumptions about the average wind speed and isoplanatic angle on Paranal. The Fried parameter (r0) and the isoplanatic angle θ0 are also displayed. All on-axis quantities are computed at 0.5 µm. 9.5 Reference Objects The information about reference objects is gathered on the right hand part of the main GUI. 9.5.1 Handling several reference objects It is possible to keep a list of several possible reference objects for observations (in NGS) and work alternatively with each of them. The list of reference objects is shown as a table at the top of the form containing all the data pertaining to the reference object. Each row corresponds to a reference object, showing its name – if it has been provided - and its angular distance to the science target (mandatory parameter). The other columns are filled when requesting an optimization by the PS server (Section 9.5.5). If several reference objects are available in the table, you can select the one you want to work with by simply clicking on the corresponding row. This will update the contents of the form below the table, as well as the Resulting Performance sub-panel shown on the bottom left of the GUI. Indeed, each reference object is attached to its own configuration of the AO system, and to the performance estimated when considering this configuration. The order is important: if the first reference object is acquired successfully, then the other reference objects will not even be considered. Reference objects should be sorted in decreasing order of expected performance. Use the list manipulation buttons (Up/Down) to modify this order as needed. Every time you want to add an object to the list, you must first fill in the mandatory fields, and then click the button labelled Register Object, at the bottom of the reference object form. The mandatory fields are: o the coordinates of the reference, which sets the distance to target, o the reference brightness and o the reference morphology If the reference object is the target, one can use the Target → Reference Object option from the Objects menu at the top of the panel as a shortcut. For test purposes, the interface can be run without knowing the precise coordinates of the target nor the reference object. In this case, one need only enter the separation between the two. But names and coordinates must be supplied if the interface is being used for OB preparation. The default morphology of the reference object is point-like, which does not need any additional input. Other morphologies can be specified. 110 User’s Manual VLT-MAN-ESO-14200-2761 Other buttons that can be seen next to Register Object are: o Reset Form: this simply erases the form without confirmation. o Update Object: if you are modifying the characteristics of a reference object which is already recorded in the table, this button will automatically turn red, reminding you to click this button to record your changes. o Cancel: cancel any changes to the selected reference Underneath the table is another set of buttons, which allows one to manipulate the list of reference objects: o Up/Down: moves the selected object in the list, by swapping it with its neighbour. The order in which the reference objects are shown will be the one exported to P2PP (Sec. 9.5.7) and hence the one tried at the telescope. o Delete: this discards all data pertaining to the selected reference object. dialog is shown to prevent mistakes. A confirmation o Clear all: same as above, except that all reference objects of the table will be erased. o Duplicate: makes a copy of all the characteristics of the currently selected reference object, and adds it at the bottom of the list. This may prove useful if you want to experiment with a reference object and you want to be able to compare different results of optimization while keeping all of them in the GUI, instead of simply overwriting the results. 9.5.2 Morphology The Preparation Software - and the NAOS instrument - can also handle moderately extended objects (up to 3 arcsec in diameter) to analyze the incoming wavefront. Several models are available to define the morphology of the reference object. Objects with one of three different morphologies can be used as NAOS reference objects: o Point-like object o Binary object, which requires: - an angular separation between the two components, given in the range (0,2.5) in arcsec, and - the flux ratio of the two components ([{flux of fainter companion} / {flux of brighter component}]; dimensionless). o Disc-like object. When using a resolved object in the solar system, you are asked to enter its diameter, in arcsec. This morphology is modelled by a limb-darkened disk. 9.5.3 Photometry The PS also has to compute the flux coming from the reference object. Since the WFS spectral bandwidths are very large, a single magnitude is not sufficient to compute the detected number of photons. The photometric information may be provided in different ways: o Magnitude + Spectral Type. Well suited to main sequence stellar objects. If you choose this option, you will need to enter the apparent magnitude, the filter in which the magnitude is measured (either V, J, H, K, Lp or Mp), and a spectral type. The spectral type is chosen in an option button. The list of available values is the same as that available in the interface of the CONICA ETC. This ensures the compatibility between the two tools, especially in the case when the target is also used as the reference object (see also Section 9.5.6). 111 User’s Manual VLT-MAN-ESO-14200-2761 o Magnitude + Temperature. The magnitude is given in the same way as above (value + filter), but, in this case, the spectral energy distribution is modelled as a black body, which requires a temperature. Moreover the users now have the possibility to provide a visible extinction, AV value; by default and if not specified this value is 0 and the PS behaves exactly as before. When AV is defined it governs by how much the brightness of the AO reference target changes as function of the wavelength; which is especially important due to the broad bandwidth of the wavefront sensor detectors. We adopted a standard extinction law, represented in Figure 9-2, as defined by Cardelli, Clayton & Mathis (AJ 345, 245 (1989) - Section IIIb), and expressed as: < A(λ)/AV >= a(x) + b(x)/RV with RV = AV /E(B − V) (1) We set <RV> to 3.1, which is an average value for the interstellar medium and is essentially independent of AV for wavelength longer than 0.7µm. Figure 9-2: Illustration of the extinction curve used when giving a non zero value to the extinction AV . The J, H, K and R bands are shown for reference along with the monochromatic wavelength for V. The bottom graph represents the quantum efficiency for the WFS detectors as a function of wavelength. 112 User’s Manual 9.5.4 VLT-MAN-ESO-14200-2761 Tracking table For objects with high proper motions, and this usually means solar system objects, the usual set of coordinates is not sufficient. The user has to provide a separate tracking table, giving the relative offsets between the AO reference object and the target in arcsec ([AO reference - science target] coordinates), as a function of universal time (UTC). An example of the format of this tracking table is given in Figure 9-3. The file containing the tracking data must be edited by hand and be available on the user’s local disk. Checking the Tracking Table check-button (below the coordinates entries) enables the Choose File button next to it. You can then attach your file to the selected reference object, and the tracking table can also be seen via the View button, which is enabled as soon as the file is attached. Please note that the data of the tracking table are then copied into the interface, which means that you do not need to keep the original file on your disk, except of course if you want to edit your data. You would then have to re-attach the table to the reference object. If you changed your mind and do not want the tracking table anymore, just deselect the Tracking Table check-button. The Table 9-1 below shows the various cases of AO mode and tracking options. Table 9-1: Various AO modes and tracking and differential tracking cases. Mode S Moving? Diff. Tracking table Diff. Motion noAO Y S AO on S Y S AO on R1 Y R1-S AO on R2 Y R2-S R2 S: Science target R1: Fixed NGS R2: Moving NGS 9.5.5 Optimizing NAOS and Getting a Performance Estimation The optimal configuration (i.e. the one giving the highest Strehl) and the resulting PSF are determined when the Optimize button, located in the bottom left corner of the graphical user interface, is selected. The typical response time from the server is 10 seconds, and should not exceed 60 seconds. When more than one reference object has been defined, the optimization is done for the selected (highlighted) one. For complete preparation, the Optimize command should be repeated for each (potentially) viable reference object. Once you have made a request for optimization, and if it has been successfully processed, the GUI will be updated with the optimal AO configuration (Figure 9-4) and an estimation of the resulting PSF. The Strehl ratio is always computed for the reference object (on-axis) at the observing wavelength and at 2.166 µm. For the science target (off-axis) the Strehl ratio is given at the observing wavelength only. 113 User’s Manual VLT-MAN-ESO-14200-2761 Figure 9-3: An example of tracking table window (acquisition and observation of moving objects). Offsets in RA and DEC are given in arcsec. Figure 9-4: Performance subpanel: the AO optimal configuration and the PSF is available from buttons in this panel. The optimal Adaptive Optics configuration can be displayed by clicking on the AO Config button in the subpanel depicted in Figure 9-4. An example is shown in Figure 9-5. 114 User’s Manual VLT-MAN-ESO-14200-2761 Figure 9-5: Pop-up window showing an optimal configuration of the AO system. You do not have to worry about these parameters, but they may give you some insight into the way NAOS works. From the perspective of the astronomer, the most significant result of the optimization is the corresponding estimated performance in terms of image quality. It is expressed quantitatively by the computed point-spread function (PSF) and its derived quantities. The PSF is returned to the user interface in FITS format. It characterizes the quality of the optical beam, which is provided by NAOS to CONICA, and is thus logically computed at the observing wavelength, and is available from the Resulting Performance area of the GUI. The provided PSF is computed off-axis, i.e., in the direction of the target seen by CONICA. The PS computes these data on 128x128 pixels. One pixel corresponds to an angle of λ/2D and the extracted PSF is assumed to be monochromatic. To access the PSF data once the optimization has been performed, click on the PSF button. This pops up a window that shows the profile of the PSF along the x- and y-axes (Figure 9-6). The FITS file itself can also be saved to the user’s local disk for later use. If you want to save the file, the Save PSF button brings a file browser and allows you to choose the name of the file on your local disk. This operation is performed by sending the 115 User’s Manual VLT-MAN-ESO-14200-2761 appropriate request to the central server, where your PSF file has been stored under a unique name. Depending on your local installation, the file retrieval may take a few seconds. The other quantities which are outputs of the optimization are: o The Strehl ratio is expressed as a percentage. It is derived from the PSF, and as such it is linked to the observing wavelength. The on-axis Strehl ratio gives an estimate of the correction of the optical beam in the direction of the reference object, i.e. as seen from the wavefront sensor in NAOS. Conversely, the off-axis Strehl ratio is computed from the estimated PSF on the science object, which allows one to estimate the correction provided by NAOS for the target. o The full width at half-maximum of the PSF is given in arcsec both in the main panel and in the pop-up window depicted in Figure 9-6. o Transmission to CONICA is expressed as a fraction of incoming light, at the observing wavelength. Figure 9-6: Pop-up window showing the PSF profile. This also gives access to the PSF FITS file. The different width of the PSF in x- and y-direction are due to anisoplanatism. The x-axis is here defined as the axis that is parallel to the line connecting the reference object with the science target. Note: the PS takes into account a relatively optimistic turbulence model where the coherence time is large enough to reach nominal AO correction levels (i.e. K-band Strehl ratio up to 45 or 50%). Often, in Paranal the coherence time is well bellow this value and therefore, despite having the requested seeing, the requested Strehl ratios are difficult to obtain in reality. 9.5.6 Exporting to the Exposure Time Calculator When clicking on Export to CONICA ETC at the bottom of the main panel, a file browser pops up. You can then give the name of an HTML file that will be created by the GUI and saved to your local disk. This HTML file contains the PSF profile, the CONICA filter and the magnitude and spectral type of the target. 116 User’s Manual VLT-MAN-ESO-14200-2761 To call the ETC, load this file into your favourite web browser and click on the Call CONICA ETC button at the bottom of the page. 9.5.7 Exporting to P2PP All NACO acquisition templates (Section 7.3) require a configuration file which is produced by the Export to P2PP button. It has the default extension aocfg and it is saved in the directory specified in the Preferences menu, under the option set the cache folder. This file contains all the information relevant to the setup of NAOS during acquisition of the target. When preparing your observations with the PS and P2PP the following points should be noted: o The output file is a text file, and it should never be manually edited. If you do, the execution of your OB will be seriously compromised and the time loss will be charged to your program. o There must be one configuration file per target. The same configuration file cannot be used for different targets, but is fine for different OBs using the same target. o The configuration file is inserted into the “NAOS parameter file” keyword of the relevant acquisition template. o The Strehl, seeing and airmass constraints, and the RA and DEC fields of P2PP will be automatically filled when the configuration file is loaded. Do not edit these fields. 9.5.8 Exporting OBs from P2PP The export facility in P2PP allows one to export observing blocks. For NACO, two files are produced, one with the extension obx and another with the extension aocfg. These files should be kept in the same directory. P2PP will report an error if the two files are in different directories. 9.5.9 Saving/Restoring a PS Session The complete PS session can be saved on local disk and restored. The Save Session and Load Session functions, available from the File menu of the main panel, allow you to save or load the corresponding information on your disk. Please be aware that loading a previously saved session file will discard all the data currently stored in the interface. However, it does not alter any of the configuration files that have been saved to disk. Only the files with an extension .jnps can be loaded into the PS. Once a previous session is loaded into the PS, one should run the optimization again before exporting to P2PP, otherwise a corrupted file may be exported and the observation may be impossible. In case one forgot to save a session, it is possible to copy the *.aocfg file into a *.jnps file and then import it as a session. 9.5.10 Giving names to session, P2PP and PSF files Each time a file is about to be saved, one is asked to provide a name. The default name is based on the target name, but one may want to change it. This does not affect the operations, and may be convenient for the user. However, remember the files will be used by Unix-based machines, so one should avoid special characters - spaces, brackets, etc. - in the names. 9.5.11 User’s preferences The Preferences menu gives access to configurable functionalities of the PS, which are detailed below: o Show tool tips: every field in the GUI has an attached tool tip. Though very useful when starting to use the PS, this may be annoying for more experienced users. This option allows one to switch them on/off. 117 User’s Manual VLT-MAN-ESO-14200-2761 o Set working directory: you can specify here the name of the directory where the output files are created by the PS (the one to be inserted in P2PP OBs) are saved. The default is your home directory. o Set server name: this menu item raises a small pop-up window that allows one to change the name of the host machine where the PS server can be accessed. It is unlikely that normal users will need to use this feature. If you do happen to accidentally change the name, the server name can be found at http://www.eso.org/sci/observing/phase2/SMGuidelines/NAOSPS.html. Every change is automatically recorded in the .jnpscf file, located in the user’s home directory. Additionally, depending on your local installation of the PS, you may want to edit the file and modify the web.enable resource, enabling you to switch between the standard installation (web.enable=true) and the case where you access the PS server on your local machine (web.enable=false). However, this latter case should normally never be encountered by the average user, hence the default value is the correct one in most cases. 118 User’s Manual VLT-MAN-ESO-14200-2761 10 APPENDIX - DPR KEYWORDS FOR NACO Each template that collects data with NACO, being it an acquisition template or a science or calibration one, writes a set of “HIERARCH ESO” header keywords that allows quick identification of the type of data. These keywords, commonly called DPR keywords, are three: CATG, which stays for category, TYPE and TECH, which indicates the observing technique. CATG can be of type ACQUISITION, for acquisition images, CALIB for CALIBRATION frames and SCIENCE. There are other types, such as TEST, which is normally reserved for frames of no important content generated while testing. TYPE can be DARK, FLAT,LAMP (internal lamp flat), WAVE, LAMP (internal lamp arc), SKY, OBJECT, PSF-CALIBRATOR, STD (for standard stars). Other values are possible, especially used for technical templates (such that for detector’s tests). TECH for NACO has values, which are linked to the various observing modes. A combinations of keywords is usually necessary to give an accurate description of the technique: for instance, IMAGE, JITTER, SAM, PT, CUBE will describe SAM images with pupil tracking (PT) and CUBE mode active. DIFFERENTIAL is reserved for SDI+. All the other names are self explanatory. These keywords can be used for images selection in the archive when one uses the NACO dedicate query form available at: http://archive.eso.org/wdb/wdb/eso/naco/form 119