1
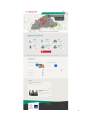
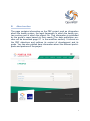
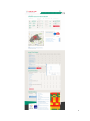
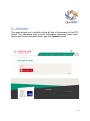
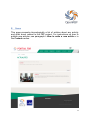
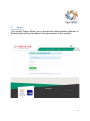
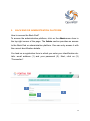
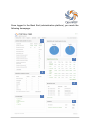
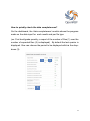
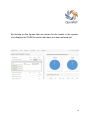
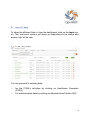
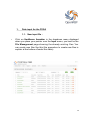
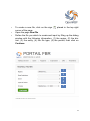
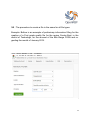
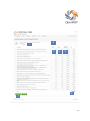
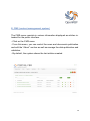
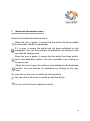
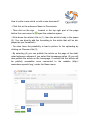
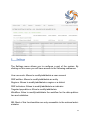
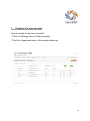
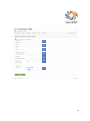
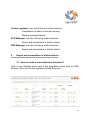
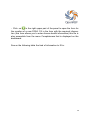
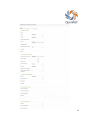
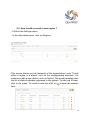
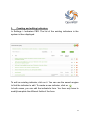
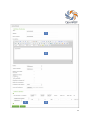
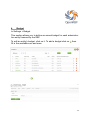
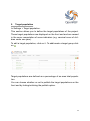
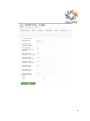
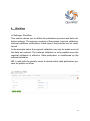
USER MANUAL TABLE OF CONTENTS 1. FRONT END OR PUBLIC INTERFACE A. Homepage p.5 B. About section p.7 C. FPB data section p.8 D. Documents p.10 E. News p.11 F. Admin p.12 2. BACK END OR ADMINISTRATION PLATFORM p.13 A. Dashboard p.15 B. Input of data p.19 1. 2. Data input for the FOSA p.20 1.1. New input file 1.2. Input of Quality and Quantity data 1.2.1. Input of quantitative data 1.2.2. Input of qualitative data 1.3. Input of data for quality improvement bonuses 1.4. Input of fraud data p.20 p.23 p.23 p.26 p.28 p.29 Input of data regarding the Administrative entities p.30 2 C. Reports and bills p.34 D. Exportations p.36 E. CMS (content management system) p.38 F. 1. News and documents menu p.39 2. Publication and data validation p.41 Settings p.42 1. Creation of a user account p.43 2. Creation of a new FBR entity and Regions p.47 2.1. How to create a new healthcare formation? p.47 2.2. How to edit or create a new region? p.50 3. Creating and editing indicators p.51 4. Budget p.54 5. Target population p.55 6. Workflow p.57 3 About the OpenRBF1 user’s manual This user's manual has been written to make the use of the software easier for the different users. It has been written based on the current version of the software as it was conceived for the demonstration portal of OpenRBF. In it you will find a detailed explanation of the different interfaces (Front End and Back End) and of their content. In the first part, you will find the various sections of the public interface or Front End. They are presented as menus. Instructions will be given regarding the relationship between the information in the public interface and the part in which they are created in the administration interface. In the second part you will find detailed and illustrated instructions on how to generate content with the software. A glossary is provided at the end of the manual to help you understanding the concepts and jargon used in the manual. Finally at the beginning of the manual various issues have been written as a Frequently Asked Questions (FAQ) section in order to guide you directly to towards the sections you need the most. 1. OpenRBF : A web base software that allows you to collect and extract data, to display them so that they are accessible to all. The code of this application is open source. 4 1. FRONT END OR INTERFACE PUBLIQUE How to access the OpenRBF demo website? To access the demonstration website of OpenRBF, you just need to type http://www.demo.openrbf.org in the URL bar. You will then land on the homepage of the PBF website. The public interface or front end is the part of the website that is accessible to all. It presents complete information about the PBF project. It shows the progress of the project and the data regarding the evolution of the activities developed as part of PBF. From the front end, you can access the following menus: About, FBP data, Documents, News, and Management. A. Homepage The application homepage shows a summarized version of the information contained on public site. It sums up with pictures and charts the data concerning the PBF project activities, the PBF’s areas of activity and the healthcare formations involved. The homepage also shows the titles of the main sections presents in the public interface. (Sections are in green on top right of the page). 5 6 B. About section The page contains information on the PBF project such as information about the health system, the legal framework in which the health system evolves and in which the project fits. That information is published by the portal’s users based on their needs (The data publication process will be described page 57 in the workflow section). It informs on the PBF objectives and outlines its context of development and its goals. You can also publish here information about the different participants and partners of the project. 7 C. FPB data section The data page gives information about key data related to the indicators and about the evolution during predefined period of the figures of the quantitative and qualitative indicators. You will also find here the periodical evolution of payments for the different entities and by indicators. The figures in red indicate the number of active entities per region. The figures for “real time results”, “quality score”, “quantity” and “received payment” are displayed once they have been entered and are updated every time data are published. . This example of Indicator Page informs about the indicators evolution. This page can be viewed at national, regional , district and entities levels. To display the chart, you just have to move the mouse over the label of the indicator. 8 9 D. Documents This page allows you to publish online all kind of documents in the PFD format. To understand how to enter information regarding these documents and how to download them, see the Content section. 10 E. News This page presents chronologically a list of articles about any activity and other event related to the PBF project. For instructions on how to publish new articles, see paragraph « How to write a new article » in the Content section. 11 F. Admin The section Admin allows you to access the administration platform or Backend that will be described in the second part of this manual. 12 2. BACK END OR ADMINISTRATION PLATFORM How to access the Back End? To access the administration platform, click on the Admin menu item in the top right corner of the page. The Admin section provides an access to the Back End or administration platform. One can only access it with the correct identification details. You land on a registration form in which you enter your identification details: email address (1) and your password (2). Next, click on (3) “Connection”. 1 3 2 13 Once logged in the Back End (administration platform), you reach the following homepage: 1 3 2 4 5 6 14 On top of the page are located the Back End menus that is to say the Dashboard, Input, Reports, Export, CMS and Settings. Every menu item will be described on the next pages. A. Dashboard If you click on Dashboard, the page displays several tab-shaped menus that lead to the different functionalities you can access. The displayed menus depend on the user’s profile (a National Administrator does not have the same rights that a Controller …). The menus that are displayed on this page are: Data completeness (1): You will find more detail about this module functionality on page 17 Fraud summary (2): This table displays the number of reported frauds per region and for a quarter. You will find more details about this module functionality on page 29 . Quick actions (5): This is a shortcut to some of the most used menus. For this portal, the menus set as quick actions are: data input, reports, update your profile and homepage . You will find explications about those menus later on. Alerts: These are messages that are displayed on the dashboard to indicate the recent actions (data input, …). 15 Info FOSA completeness (3): This table displays the completeness of the information from the FOSA level (pictures, coordinates, localization…). You will find more details about how to edit a FOSA on page 48. Log summary (4): Holds the list of actions taken by the users. 16 How to quickly check the data completeness? On the dashboard, the ‘data completeness’ module shows the progress made on the data input for each month and per file type (ex: First level/grade quantity, a report of the number of files (1) over the number of expected files (2) is displayed) . By default the last quarter is displayed. One can choose the period to be displayed with/via the dropdown (3). 1 2 3 17 By clicking on the figures that are shown for the month or the quarter, one displays the FOSA for which data have not been entered yet. 1 2 18 B. Input of data To show the different files to, from the dashboard, click on the Input menu. Two sub-menu options will show up depending on the status and access right of the user. You can proceed to entering data: for the FOSA’s activities by clicking on Healthcare Formation (FOSA) For administrative data by clicking on Administrative Entities (EA). 19 1. Data input for the FOSA 1.1. New input file : Click on Healthcare formation in the dropdown menu displayed when you place your pointer over the Input menu; you land on the File Management page showing the already existing files. You can create new files like this (the procedure to create new files is explain at the bottom of/under this table). 20 To create a new file, click on the sign placed in the top right corner of the page Open the page New File Define the file you which to create and input by filling up the dialog window with the following information: (1) the region, (2) the district, (3) the entity, (4) the file type, (5) the period, then click on Continue 1 2 3 4 5 21 NB : The procedure to create a file is the same for all file types. Example: Bellow is an example of preliminary information filling for the creation of a First grade quality file for the region Center-East, in the district of Tenkodogo, for the account of the Bon Berge FOSA and regarding the month of January 2014. 22 1.2. Input of Quality and Quantity data 1.2.1. Input of quantitative data : First of all input the total amount computed by the controllers and recorded on the input sheets in the cell (1). If this cell is not filled up, the input of the other data is impossible. To validate the file, it is compulsory that this total (1) equals the total showed by the file (6). Write any remark/observation to make about the verification in the cell (2). Then input the indicators’ data as they have been recorded on the input sheets of the controllers in the dedicated columns. The declared values will be recorded in the column (3) dedicated to Declared Data and the validated value in the column (4) dedicated to the validated data. The indicators are likely to be different depending on the regions. The total to be paid for the indicator (5) is calculated automatically. The amount indicated in the cell (1) must be the same than the final total located in the last cell of the column (6) at the bottom of the table. Save the data once everything has been recorded by clicking on Save (7). 23 1 2 3 4 5 6 7 24 Caution/Warning: The data input for the indicators cannot start if the total amount previously calculated by the controllers is not indicated in the total cell If the calculated totals at the beginning and the end of the table are different, the data will not be saved. If the totals are different, check that there is no mistake in the inputted data. In case of input mistakes, the following message will show up “Check the totals and try again” . Two mistakes are then to be checked: i. Mistakes that occurred while inputting data : please double check if the validated data on paper are indeed the same than on the electronic file. ii. If the mistake comes from the paper version: please remake the calculations on paper. 25 1.2.2. Input of qualitative data : - Enter in the cell (1) the total (in percent!) recorded in the input form of the controllers and the remarks or observations regarding this input in the cell (2). - In the cell (3) one enters the points assigned to each component of the quality. NB: For the indicators going from 1 to 10, costs are set up. Once all the available points are inputted, the total is automatically computed (4). And from the indicator 11 to the last one/until the end, the number of available points (5) is manually filed up by the user as it may differ from one FOSA to the other. - Enter the data declared for each indicator in the column (3) as they were recorded in the summary of the input form from the controllers. - The totals shown in (1) and (6) must be the same and they represent the percent obtained for the quality score. - Once the input is complete, click on Save. 26 2 1 3 4 5 6 27 1.3. Input of data for quality improvement bonuses - Input in the cell (1) the total recorded in the input form of the controllers and their remarks. - Click on Save. 1 28 1.4. Input of fraud data - Enter the fraud report date in the cell (1) - Approve the fraud report display by clicking on the cell (2) so that this information shows up on the homepage. Any report created is recorded and thus visible under the “fraud summary” menu that shows up on the dashboard. - Make a description of the nature of the observed fraud (3) - Upload the document reporting the fraud if needed on (4) - Click on Save if all the data are recorded. 1 2 3 4 29 2. Input of data regarding the Administrative entities How to create a new administrative file? The procedure to create new files for the administrative entities is the same than the one for the FOSA. This menu allows you to input evaluation data regarding/of the performance of the ACV, DRS, ECD, DCPP, DGESS, PADS, UAT . NB: the core level entities (DCPP, DGESS, PADS, UAT) are located in the Center region and in the Kadiogo district. To browse exiting files or create a new one: - Mouse over the Input menu so that the dropdown menu appears. - Click on the sub-menu Administrative Entities, you land on the File management page consisting of a list of existing files regarding the administrative entities. 30 - To create a new Administrative Entity file, click on the (+) sign located in the top right corner. - Fill in the new file description form by following the same procedure than for creating a new FOSA file. Example : 31 Here you will allocate points to the indicators. The points will be recorded in the Verified column. For each indicator, the system will automatically display the score. The same goes for the global score of the quality evaluation. Indicate the evaluation score (1) as written on the controllers’ sheet. If comments are to be made, enter them in (2). In the allocated point column (3), input the points allocated to each indicator, the computation will be automatically performed in the Percent column (4) as the data input process progresses. The point total automatically computed by the application will show up in (5). This total must be the same as the one indicated in (1) for the bill to be stored/recorded/saved. Once all data have been inputted, click on Save. 32 2 1 3 4 5 33 C. Reports and bills How to generate a report? The Reports menu consists of a list of reports and bills. To access the reports: - Click on the Reports menu - You land on the Reports page consisting of a list of reports, bills. - The types of file present differ depending on projects (for the current project) we have the following type of reports: 1/ Monthly allowance bill for service providers 2/ Quarter allowance bill for regulators 3/ Quality bonuses bill 4/ Monthly consolidated quality bonuses bill 5/ Indicators synthesis 6/ Fraud report 7/ Quality improvement bonus 34 - To consult and to export on of them, click on the report’s title (1), a selection dialog (2) will appear on the right of the list. - In the selection dialog, select the identification elements of the Report (region, district entity, month, year) then click on Open. - The selected report will open in PDF format in another page. 1 2 35 D. Exportation The Exportation menu allows to export PBF data in excel format. You can export all the data saved in the system’s database as well as the user list. The data export is done by file type. The table thereafter list all the export possibilities. How to export data? - Click on the sign in from of the file type - The ported sign - Click on appears indicating that the file is ready to be ex- this small sign to complete the file export. 36 How to generate a new exportation? - Click on to open the new file creation form - Once the form opened, fill it up with the relevant information - Enter the title of the fill to export in (1). 1 2 3 4 - Select the type of file that you want to export (2) as well as the type of data that will be exported in the file in (3). - Select the concerned region (4), then click on Save to make the file creation effective. - The file shows up in the list of file to export according to the year in which it was created. 37 E. CMS (content management system) The CMS menu consists in various information displayed as articles intended for the public interface. - Click on the CMS menu - From this menu, you can control the news and documents publication and edit the “About” section as well as manage the data publication and validation. - By default, the system shows the last articles created. 38 1. News and documents menu Small icons indicate the article’s status: When the icon is green, it means that the article has been publish on the public interface’s homepage. If it is grey, it means the article has not been published on the homepage. You can thus activate its publication by clicking on the icon that will change color. When the icon is green, it means that the article has been published in the dedicated section. You can un-publish it by clicking on the green icon. When the icon is grey, the article is not published in the dedicated section. You can activate its publication by clicking on the grey icon. You can click on this icon to modify an existing article. You can click on this icon to modify an existing article. You can click this icon to delete an article. 39 How to write a new article or add a new document? - Click first on the submenu News or Documents. - Then click on the sign bellow the user name to located in the top right part of the page open the redaction space. - Write down the article’s title in (1), then the article’s body in the space (2). You can directly add the formatting to the article that will be displayed as you formatted it. - You also have the possibility to load a picture for the uploading by clicking on Choose a file (3). - By selecting (4) you can publish the article on the page of the dedicated submenu whereas if you select the homepage option (5) you will also publish the article on the homepage. It means that this article will be publicly accessible once connected to the website (http:// www.demo.openrbf.org ) under the News menu. 1 2 3 4 5 40 2. Publication and data validation The submenu Publication and validation allows to control the data validation and their publication on the front-end for each quarter. Before having the possibility to public data, it is important to validate them. Once validated by a user, data cannot be changed by a user having less authority (more restricted access) than the person charged of the validation. Example: A regional administrator valid data. The ACV teams or the ECD cannot modify these validated data anymore, except if they are invalidated either by the regional level or by a greater authority (national level). It is possible to place conditions on the validation and the publication of data via the menu Settings > Workflow (see page 47) - The validation is done by selecting the district for which one wishes to validate the data. Here there are two validation levels. Regional level validation then national level validation. - You can choose to publish all or a part of the data by selecting the districts for which you wish to publish data. 41 F. Settings The Settings menu allows you to configure a part of the system. By clicking on this menu you will have access to the following submenus: User accounts: Allows to modify/add/delete a user account FBR entities: Allows to modify/add/delete an entity Regions: Allows to modify/add/delete a region or a district FBR indicators: Allows to modify/add/delete an indicator Targeted populations: Allow to modify/add/delete Workflow: Allow to modify/add/delete the workflow for the data publication and validation. NB: Most of this fonctionalities are only accessible to the national administrator. 42 1. Creation of a user account How to create a new user account? - Click on Settings then on User accounts - The list of registered user in the system show up 43 - Click on the signe in the top-right part of the page to open the account creation form on the User accounts-Add an account - In (1), enter the first names and last names of the user (e.g.: Joseph Minala) - In (2), enter the user’s role (Controller Manager) - Enter in (3) his/her phone number or at least one digit (Compulsory!) - If you want the name to be published in the user list, click on the Publish button - In (4), enter the user e-mail - In (5), create a password that you will communicate to the user - In (6), choose the user group - Click on the Activate button if you want this account to be immediately active - In (7) select the work area (e.g.: for the controller manager for the Nouna area, click on Nouna) - When you are done with the form, click on Save to complete the account creation. 44 1 2 3 4 5 6 7 45 Description of the user groups Super Administrator: Access to every function of the application. National administrator: Has the following authorizations: - Manage the user accounts, entities and budgets - Reports and data exportation - Input/consult/delete data of every entities (Healthcare formation and Administrative entities) - Data validation and publication EAT User: has the following authorizations: - Input/consult/delete data of every entities (Healthcare formation and Administrative entities) - Data validation and publication - Reports and data exportation ACV coordinator: has the following authorizations: - Input/consult/delete data from service provider in his/her region - Reports and data exportation of his/her region - Regional validation ACV operator: has the following authorizations: - Input and consult data for service provider in his/her district - Reports in his/her district 46 Central regulator: has the following authorizations: - Consultation of data in the entire country - Reports and exportations ECD Manager: has the following authorizations: - Export and consultation in his/her district DRS Manager: has the following authorizations: 2. Export and consultation in his/her district Export and consultation in his/her district 2.1. How to create a new healthcare formation? Click on the Settings menu and in the drop-down menu click on FBR Entities. Then click on the submenu Health Structure. 47 - Click on in the right upper part of the panel to open the form for the creation of a new FOSA. Fill in the form with the required information (this form allows you to enter diverse health information) this file is also accessible from the menu Completeness that is displayed on the dashboard. See on the following table the kind of information to fill in: 48 49 2.2. How to edit or create a new region ? - Click on the Settings menu - In the drop-down menu, click on Regions This screen shows you the hierarchy of the organizations' units. To edit either a region or a district, click on the corresponding submenu. For instance to edit a new district, click on District. The screen displays then the list of districts already registered in the system. To edit one of them, click on its name. To create a new one click on to open the creation form. 50 3. Creating and editing indicators In Settings > Indicators FBR. The list of the existing indicators in the system is then displayed. To edit an existing indicator, click on it. You can use the search engine to find the indicator to edit. To create a new indicator, click on In both cases, you can edit the indicator's form. You then only have to modify/complete the different fields of the form. 51 (1) : Indicator's name, its common name and its abbreviation if it has one. (2) : Add the description, the definition (3) : Allows you to associate an indicator with a file. You can assign a same indicator to different files. Click on to add a type of file. Some files are divided into categories (e.g. quality file). You can then assign an indicator to a file's category. (4) : Chose the position of the indicator in the file and define its price/ cost/rate. And the period for which the indicator is available. 52 1 2 3 4 53 4. Budget In Settings > Budget. This section allows you to define an annual budget for each administrative entity financed by the RBF. To edit an entity's budget, click on it. To add a budget click on fill in the available sum and save. then 54 5. Target population In Settings > Target population. This section allows you to define the target populations of the project. These target populations are displayed on the front end and are reused in the cover computation of some indicators (e.g. vaccinal cover of children under one year). To edit a target population, click on it. To add/create a target group click on Target populations are defined as a percentage of an area total population. You can choose whether or not to publish the target populations on the front end by ticking/unticking the publish option. 55 56 6. Workflow In Settings> Workflow. This section allows you to define the publication process and data validation settings. The process consists of three steps (regional validation, national validation, publication). Each step of the process can be conditioned. In the example below the regional validation can only be made once all the data are entered. The national validation is only possible once the regional validation is effective. Data publication is conditioned by the national validation. NB: It rests with the portal's owner to decide which data publication process he prefers to follow. 57 Please do not hesitate to contact us if you have any questions or suggestions: [email protected] 58 59