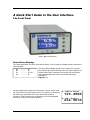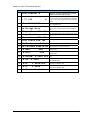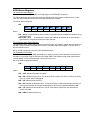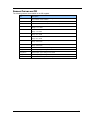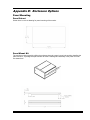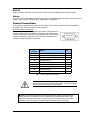
1
User's Guide Models 612 and 614 Cryogenic Temperature Monitor Cryomagnetics, Inc. 1006 Alvin Weinberg Drive Oak Ridge, TN 37830 Tel: (865) 482-9551 Fax: (865) 483-1253 www.cryomagnetics.com © Copyright 2014 Cryomagnetics, Inc. All Rights Reserved. Printing History Revision 1, March 2014 Certification Cryomagnetics, Inc. (Cryomagnetics) certifies that this product met its published specifications at the time of shipment. Cryomagnetics further certifies that its calibration measurements are traceable to the United States National Institute of Standards and Technology (NIST). Warranty This product is warranted against defects in materials and workmanship for a period of one year from date of shipment. During this period Cryomagnetics will, at its option, either repair or replace products which prove to be defective. For products returned to Cryomagnetics for warranty service, the Buyer shall prepay shipping charges and Cryomagnetics shall pay shipping charges to return the product to the Buyer. However, the Buyer shall pay all shipping charges, duties, and taxes for products returned to Cryomagnetics from another country. Warranty Service For warranty service or repair, this product must be returned to a service facility designated by Cryomagnetics. Limitation of Warranty The foregoing warranty shall not apply to defects resulting from improper or inadequate maintenance by the Buyer, Buyer supplied products or interfacing, unauthorized modification or misuse, operation outside of the environmental specifications for the product, or improper site preparation or maintenance. The design and implementation of any circuit on this product is the sole responsibility of the Buyer. Cryomagnetics does not warrant the Buyer's circuitry or malfunctions of this product that result from the Buyer's circuitry. In addition Cryomagnetics does not warrant any damage that occurs as a result of the Buyer's circuit or any defects that result from Buyer-supplied products. Notice The information contained in this document is subject to change without notice. Cryomagnetics makes no warranty of any kind with regard to this material, including, but not limited to, the implied warranties of merchantability and fitness for a particular purpose. Cryomagnetics shall not be liable for errors contained herein or for incidental or consequential damages in connection with the furnishing, performance, or use of this material. No part of this document may be photocopied, reproduced, electronically transferred, or translated to another language without prior written consent. Trademark Acknowledgement Cryomagnetics® are registered trademarks of Cryomagnetics, Inc. All other product and company names are trademarks or trade names of their respective companies. Safety The monitor does not contain any user serviceable parts. Do not open the enclosure. Do not install substitute parts or perform any unauthorized modification to the product. For service or repair, return the product to Cryomagnetics or an authorized service center. Table of Contents Introduction ..................................................................................................................................... 1 Preparing the Monitor for Use ........................................................................................................ 3 Model Identification.................................................................................................................... 3 Supplied Items ............................................................................................................................ 3 Apply Power to the Monitor ....................................................................................................... 3 Factory Default Setup ................................................................................................................. 5 Technical Assistance ................................................................................................................... 5 Returning Equipment .................................................................................................................. 6 Options and Accessories ............................................................................................................. 7 A Quick Start Guide to the User Interface. ..................................................................................... 8 The Front Panel ........................................................................................................................... 8 Power ON / OFF ....................................................................................................................... 11 Restoring Factory Defaults ....................................................................................................... 11 Clearing a latched alarm ........................................................................................................... 11 Re-seeding the display time-constant filter............................................................................... 11 Specifications, Features and Functions ......................................................................................... 11 Specification Summary ............................................................................................................. 11 Data Logging ................................................................................................................................ 14 Status Outputs ............................................................................................................................... 14 Visual Alarms. ............................................................................................................................... 14 Status reported via Remote Interface. ........................................................................................... 14 Relay Outputs................................................................................................................................ 14 Remote Interfaces ......................................................................................................................... 14 Ethernet ......................................................................................................................................... 14 RS-232 .......................................................................................................................................... 14 IEEE-488 (GPIB): External option. Full IEEE-488.2 compliant. ................................................ 14 USB 2.0: External option. Serial port emulator. ........................................................................... 14 Language: Remote interface language is IEEE-488.2 SCPI compliant ........................................ 14 Compatibility: National Instruments LabView™ drivers available for all interfaces. ................. 14 Ethernet API available for C++ and Basic. ................................................................................... 14 Firmware ....................................................................................................................................... 14 General .......................................................................................................................................... 15 Ambient Temperature: 25°oC ± 5 oC for specified accuracy. ........................................................ 15 ii Model 612 and 614 Temperature Monitors Mechanical: 5.75"W x 2.875"H x 8.75"D. ................................................................................... 15 Weight: 3 Lbs. ............................................................................................................................... 15 Enclosure: Aluminum Extrusion. Machined Aluminum front and rear panels. ............................ 15 Power Requirement: Input voltage is 7.5 to 48V, AC or DC, 10VA. ............................................ 15 1. External transformer (Provided). Input 100 – 240VAC @ 50 – 60Hz. ................................. 15 2. IEEE-802.3at Power-Over-Ethernet (requires powered hub or injector) .............................. 15 Performance Summary.............................................................................................................. 16 Input Channel Characteristics ................................................................................................... 17 Output Channel Features........................................................................................................... 20 Remote Interfaces ..................................................................................................................... 20 Mechanical, Form Factors and Environmental ......................................................................... 21 The User Interface......................................................................................................................... 23 Overview ................................................................................................................................... 23 Instrument Setup Menus ........................................................................................................... 24 Basic Operating Procedures .......................................................................................................... 28 Configuring a Sensor ................................................................................................................ 28 Using NTC Sensors................................................................................................................... 30 Data Logging ............................................................................................................................ 31 Downloading a Sensor Calibration Curve ................................................................................ 32 Using Thermocouple Sensors ................................................................................................... 34 Shielding and Grounding Issues ................................................................................................... 35 Utility Software............................................................................................................................. 37 Installing the Utility Software ................................................................................................... 37 Connecting to an Instrument ..................................................................................................... 38 Using the Interactive Terminal .................................................................................................. 39 Downloading or Uploading a Sensor Calibration Curve .......................................................... 40 Using the Real-Time Strip Charts ............................................................................................. 43 Data Logging ............................................................................................................................ 44 CalGen Calibration Curve Generator. ....................................................................................... 46 Instrument Calibration .................................................................................................................. 48 Calibration Services .................................................................................................................. 48 Calibration Interval ................................................................................................................... 48 Minimum Required Equipment ................................................................................................ 48 The Basic Calibration Sequence ............................................................................................... 49 Summary of Calibration Types ................................................................................................. 49 iii Calibration of Silicon Diodes.................................................................................................... 49 Calibration of DC resistors ....................................................................................................... 50 Remote Operation ......................................................................................................................... 51 Remote Interface Configuration ............................................................................................... 51 Remote Programming Guide ........................................................................................................ 54 General Overview ..................................................................................................................... 54 An Introduction to the SCPI Language ..................................................................................... 55 Remote Command Tree ............................................................................................................ 60 Remote Command Descriptions ............................................................................................... 62 Code snippet in C++ ................................................................................................................. 71 EU Declaration of Conformity...................................................................................................... 72 Appendix A: Installed Sensor Curves ........................................................................................... 73 Factory Installed Curves ........................................................................................................... 73 User Installed Sensor Curves .................................................................................................... 74 Sensor Curves on CD ................................................................................................................ 75 User Calibration Curve File Format ......................................................................................... 76 Appendix B: Updating Instrument Firmware ............................................................................... 78 Discussion ................................................................................................................................. 78 Updating unit firmware ............................................................................................................. 78 Appendix C: Troubleshooting Guide ............................................................................................ 81 Error Displays ........................................................................................................................... 81 Temperature Measurement Errors............................................................................................. 81 Appendix D: Enclosure Options .................................................................................................. 83 Panel Mounting ......................................................................................................................... 83 Appendix E: Sensor Data .............................................................................................................. 84 Cryocon S700 Silicon Diode .................................................................................................... 84 Cryocon S900 Silicon Diode .................................................................................................... 85 Cryocon R500 Ruthenium-Oxide Sensor ................................................................................. 86 Cryocon R400 Ruthenium-Oxide Sensor ................................................................................. 87 Sensor Packages ........................................................................................................................ 88 Appendix F: Configuration Scripts ............................................................................................... 91 Script File Structure .................................................................................................................. 91 Script File Example................................................................................................................... 93 Appendix G: Sensor Data Tables .................................................................................................. 94 Silicon Diode ............................................................................................................................ 94 iv Model 612 and 614 Temperature Monitors GaAlAs Diode ........................................................................................................................... 95 Platinum RTD ........................................................................................................................... 96 Rhodium-Iron ............................................................................................................................ 96 Cernox™ ................................................................................................................................... 97 Ruthenium-Oxide ...................................................................................................................... 98 Appendix H: Rear Panel Connections ........................................................................................ 101 Rear Panel ............................................................................................................................... 101 Sensor Connections ................................................................................................................. 103 Relay Connections .................................................................................................................. 106 Ethernet (LAN) Connection .................................................................................................... 106 IEEE-488.2 Connections......................................................................................................... 107 RS-232 Connections ............................................................................................................... 107 INDEX ........................................................................................................................................ 108 v Index of Tables Table 1: Model Identification ........................................................................3 Table 2: Monitor Instrument Accessories.....................................................7 Table 3: Cryogenic Accessories...................................................................7 Table 4: Function Key Descriptions. ............................................................9 Table 5: Temperature Units ..........................................................................10 Table 6: Input Configurations .......................................................................13 Table 7: PTC Resistor Sensor Configuration..............................................17 Table 8: monitor Root Menu ........................................................................24 Table 9: Input Channel Setup Menus. .........................................................25 Table 10: System Functions Menu ..............................................................26 Table 11: Data-logging Setup Menu ............................................................27 Table 12: Recommended Sensor Configuration Data .................................33 Table 13: GPIB Host Setup Parameters ......................................................52 Table 14: Commonly Used Remote Commands .........................................57 Table 15: BB Package Specifications ..........................................................89 Table 16: Cable Color Code ........................................................................89 Table 17: Sensor Input Connector Pinout...................................................103 Table 18: Dual Sensor Cable Color Codes .................................................104 Table 19: Sensor Cable Color Codes .........................................................104 Table 20: Thermocouple Polarities ..............................................................105 Table 21: Relay Connections .......................................................................106 Table 22: RS-232 DB-9 Connector Pinout..................................................107 Index of Figures Figure 1: Model 612 Front Panel .................................................................8 Figure 2: Model 612 Rear Panel .................................................................101 Figure 3: Input Connector ............................................................................103 Figure 4: Diode and Resistor Sensor Connections .....................................105 Figure 5: LAN RJ-45 Pinout.........................................................................106 Figure 6: RS-232 Null Modem Cable ..........................................................107 vi Introduction Input Options: The Model 612 has two input channels and the 614 has four. All inputs are identical and independent with each capable of supporting the same wide range of sensor types. Other than the input channel count, there are no differences between the Model 612 and 614. Easy to use: The monitor's front panel consists of a large, bright TFT-LCD display a 4-key keypad, an audio alarm and three status LEDs. Several display formats may be selected. Additional screens include temperature readings along with relay and alarm status information. A single key press takes the screen to a menu tree where most features and functions of the instrument can be configured. The status of built-in alarms and relays is indicated by LEDs located below the display. Input Flexibility: Silicon Diode sensors are supported over their full temperature range by using 10uA constant-current DC excitation. Positive Temperature Coefficient (PTC) resistor sensors including Platinum and Rhodium-Iron RTDs use constant-current, AC excitation. Platinum RTD sensors have built-in DIN standard calibration curves that have been extended to 14K for cryogenic use. Lower temperature use is possible with custom calibrations. Auto-ranged, constant-voltage AC excitation is used to provide robust support for cryogenic Negative Temperature Coefficient (NTC) sensors including Ruthenium-oxide, Carbon-Glass, Cernox™, CarbonCeramic, Germanium and several others. Thermocouple sensors are supported by using an optional dual thermocouple module. This module plugs into any of the input channels. It is powered by the instrument to provide amplification, cold-junction compensation and connection to copper. Input Power: The monitors are shipped with a 12VDC@1A external power supply but may be powered by any source providing 7.5 to 24 Volts AC or DC. The IEEE 802.3af Power-over-Ethernet (PoE) specification is also supported, allowing the monitor to be powered by its local area network connection. Since PoE provides both instrument power and data over a single cable, remote data acquisition and high channel count systems can be simplified. PoE requires the use of a powered hub or power injector. Ethernet cables up to 300 meters may then be used. Data logging: Data Logging is performed by continuously recording temperature and status to an internal circular memory buffer. Data is time stamped so that the actual time of an event can be determined. Non-volatile memory is used so that data will survive a power failure. The monitors will log up to 800 samples. Each sample includes readings for all input channels. Alarms and Relays: Two 10.0A dry-contact relay outputs are available that can be asserted based on temperature setpoints from user selected input channels. These relays are large enough to switch most cryogenic valves. The visual, remote and audible alarms are supported. Each may be programmed to assert or clear based on temperature setpoints. Alarms may be latched. These are asserted on an alarm condition and will remain asserted until cleared by the user. Note: A latched alarm may be cleared by pressing the Right (►) key on the front panel when the Home Status screen is displayed. 1 Remote Control: Standard Remote Interfaces include 100/10 Ethernet and RS-232. An IEEE-488.2 GPIB interface is optional and may be field installed at any time. The option consists of an external module that is automatically configured by the monitor. A USB 2.0 serial port emulator option is also available. Monitors connect directly to any 100/10 Ethernet Local-Area-Network (LAN). The TCP and UDP data port servers bring fast Ethernet connectivity to data acquisition software including LabView™. Using the SMTP protocol, the monitor will send e-mail based on selected alarm conditions. Using the Ethernet HTTP protocol, the monitor’s embedded web server allows the instrument to be viewed and configured from any web browser. Remote interfaces implement an IEEE-488.2 SCPI compliant remote command language that is easy to learn and easy to read. LabView™ drivers are available for all remote interfaces. Remote Command Language: The Monitor's remote command language is SCPI compliant according to the IEEE-488.2 specification. SCPI establishes a common language and syntax across various types of instruments. It is easy to learn and easy to read. Command Scripts can be used to completely configure an instrument including setting custom sensor calibration curves and PID tables. Further, scripts can query and test data. They are commonly used in a manufacturing environment to set a baseline state and test a target product. In the laboratory, scripts can be used to save and restore configurations for various experiments. XML (Extensible Markup Language) is used for the structure and format of script files. XML can be generated and edited with a standard text editor. Further, it is easy to read and understand. Firmware Updates: Full instrument firmware updates may be installed by using the Ethernet connection. Updates are free of charge and generally include enhancements and new features. 2 Model 612 and 614 Temperature Monitors Ethernet API: An Applications Program Interface (API) package is supplied that facilitates communication with the instrument using the TCP/IP and UDP protocols. It is supplied as a Microsoft Windows™ DLL that is easily linked with C, C++ or Basic programs. Preparing the Monitor for Use Model Identification The model number is identified on the front and rear panel of the instrument as well as in various instrument displays. Part Number Description Model 612 Two-channel monitor. Includes 12VDC external power supply. Model 614 Four-channel monitor. Includes 12VDC external power supply. 4039-005 Dual thermocouple Input Module. Field installable. Supports all thermocouple types. 4001-003 Single Power-over-Ethernet Power injector. 4001-002 IEEE-488.2 (GPIB) Option. Field installable. 4001-001 USB 2.0 Option. Serial Port Emulation. Field installable. 04-0281 Relay connector. 4-pin detachable terminal block. Table 1: Model Identification Supplied Items Verify that you have received the following items with your monitor. If anything is missing, contact Cryomagnetics, Inc. directly. Cryogenic Temperature Monitor. User’s Manual (PN CMI-TM612). Software CD, Version 11 or above (PN 4134-029). One or two dual-input connector/cable assemblies (PN 4034-038). External Power Supply. 12VDC @ 1.0A. Universal Voltage Input. (PN 05-0006). Certificate of Calibration. Apply Power to the Monitor The external power supply provided with the monitor accepts 100 – 240VAC @ 50 – 60Hz and outputs 12VDC @ 1.0A. This may be plugged directly into the monitor's power jack on the rear panel. Alternatively, any supply from 7.5 to 48V, AC or DC with a capacity of greater than 10VA may be used. The monitor also supports Power-Over-Ethernet so that power and communications can both be provided by the Ethernet input. An IEEE-802.3AT Power-Over-Ethernet hub or injector is required. Simply plug the cable from this device into the Ethernet input of the monitor. In this case, the power jack should not used. IMPORTANT: The monitor requires that an Earth Ground reference connection is made at the rear panel. Failure to provide this connection will result in erratic measurements and can even damage input circuits. 3 The sensor cables provided connect their shields to the monitor's chassis; therefore, the required Earth Ground can be made by connecting the shield wire at the opposite end to a ground reference point. This is usually done by connecting it to the back-shell of the cryostat connector. NOTE: The monitor has a power key on the front panel. To turn power ON or OFF, press and hold the power (●) key for two seconds. Note: The monitor uses a smart power on/off scheme. When the power button on the front panel is pressed to turn the unit off, the instrument's setup is copied to flash memory and restored on the next power up. If the front panel button is not used to toggle power to the instrument, the user should configure it and cycle power from the front panel button one time. This will ensure that the proper setup is restored when AC power is applied. While the Power Up display is shown, the monitor is performing a self-test procedure that verifies the proper function of internal data and program memories, remote interfaces and input channels. If an error is detected during this process, the monitor will freeze operation with an error message display. In this case, turn the unit off and refer to Appendix B: Troubleshooting Guide. &U\RPDJQHWLFV0RGHO 615HY' ,3 ,3$GUV0RGH6WDWLF 3RUW&RQQHFWHG &) 195$09DOLG 6HOI7HVW3DVVHG Caution: Do not remove the instrument’s covers or attempt to repair it. There are no user serviceable parts, jumpers or switches inside the unit. Further, there are no software ROM chips, batteries, or battery-backed memories. All firmware installation and instrument calibration functions are performed externally via the remote interfaces. After about ten seconds, the self-test will complete and the monitor will begin normal operation. NOTE: The monitor attempts to connect with the Ethernet as soon as power is applied. If there is a valid Ethernet connection, the power-up sequence is immediate. However, if there is no connection, the monitor will delay about 10 seconds before showing the power-up screen. 4 Model 612 and 614 Temperature Monitors Factory Default Setup A monitor with factory default settings will have an operational display like the one shown here (Model 614). The dash (-) or dot (.) characters indicate that there is no sensor connected. Note that, in some cases, there will be an erratic temperature display when no sensor is connected. This is not an error condition. The high input impedance of the monitor’s $. input preamplifier causes erratic voltage values when unconnected. %. Input Channel factory defaults are: &. Sensor Units: Kelvin. '. Sensor Type: Pt100 385 (DIN standard 100Ω Platinum RTD) Alarm Enables: Off To change these, press the Enter (●) key then refer to the Input Channel Setup Menu section. Instrument setup factory defaults are: Display Filter Time Constant: 4.0 Seconds. Display Resolution: 3 digits. Data Logging: Off To change these, press the Enter (●) key and then select the System Setup Menu. Network settings are: IP Address: 192.168.1.4. Subnet Address: 255.255.255.0 NOTE: Factory defaults may be restored at any time by use of the following sequence: 1) Turn power to the monitor OFF by pressing the Enter(●) key for about two seconds. 2) Press and hold the Right (►) key while turning power back ON. The monitor will display the message "Set Factory Defaults?". Then, press the DEC (▼) key to restore defaults or the INC (▲) key to continue without resetting. Technical Assistance Trouble shooting guides and user’s manuals are available on our web page at http://www.cryomagnetics.com/downloads.php Technical assistance may be also be obtained by contacting Cryomagnetics as follows: Cryomagnetics, Inc. 1006 Alvin Weinberg Drive Oak Ridge, TN 37830 USA e-mail: [email protected] Telephone: (865) 482-9551 Fax: (865) 483-1253 For updates to LabVIEW™ drivers, Utility Software and product documentation, go to our web site at http://www.cryomagnetics.com/downloads.php. 5 Returning Equipment If an instrument must be returned to Cryomagnetics for repair or recalibration, a Return Material Authorization (RMA) number must first be obtained from the factory. This may be done by telephone, FAX or e-mail. When requesting an RMA, please provide the following information: 1. 2. 3. 4. Instrument model and serial number. User contact information. Return shipping address. If the return is for service, please provide a description of the malfunction. If possible, the original packing material should be retained for reshipment. If not available, consult factory for packing assistance. Cryomagnetics’ shipping address is: Cryomagnetics, Inc. 1006 Alvin Weinberg Drive Oak Ridge, TN 37830 USA 6 Model 612 and 614 Temperature Monitors Options and Accessories Instrument Accessories Part # Description 05-0006 AC Power Cord 4034-038 Dual Sensor Cable, 2 x 8 foot 4034-033 Shielded Sensor Connector Kit (DB9) 3012-020 Panel Mount hardware kit. See Appendix C 3012-021 Bench top instrument stand. See Appendix C 3012-022 Tilt-stand and carry handle. Appendix C 4039-005 Dual thermocouple Input Module. Field installable. Supports all thermocouple types. 4001-003 Single Power-over-Ethernet Power injector. 4001-002 IEEE-488.2 (GPIB) Option. Field installable. 4001-001 USB 2.0 Option. Serial Port Emulation. Field installable. 3038-029 Additional User’s Manual/CD Table 2: Monitor Instrument Accessories Cryogenic Accessories Part # Description S900 S900 series Silicon Diode Temperature Sensors. Temperature range: 1.4 to 375K. CP-100 series Ceramic Wound RTD, 100Ω GP-100 GP-100 series Glass Wound RTD, 100Ω R400 R500 Ruthenium-Oxide. Temperature range is 1.4 to 40K. Commonly used with superconducting magnets. Ultra-low temperature Ruthenium-Oxide. Temperature range is 1.0 to 40K. XP-100 XP-100 series Thin Film , 100Ω XP-1K XP-1K series Thin Film , 1,000Ω Table 3: Cryogenic Accessories 7 A Quick Start Guide to the User Interface. The Front Panel Figure 1: Model 612 Front Panel Home Status Displays The instrument powers up with the home status display. This is a status-only display and the contents are user-selectable. $. %. &.+L '. The factory default display (Model 614) is shown here. It shows both channels plus alarm indicators. Here, the alarm indicators are hidden until an alarm is asserted. The monitor has nine different Home Status displays that can be viewed and selected by pressing the Right (►) key. Several displays show temperature information in a large, easy to read font. Also shown is the input channel name. This name is a convenience that allows easy association of the input channel with its actual connection. Channel names may be entered by use of the embedded web site or via any of the remote interfaces. $6DPSOH+ROGHU . %5DG6KLHOG . 8 Model 612 and 614 Temperature Monitors Navigating the Menu Tree Setup and configuration functions are performed by working with the monitor’s menu tree. To access this tree from the Home Status display, press the Enter (●) key. Navigation through all menus is performed by pressing the INC (▲) or DEC (▼) keys. A cursor will scroll up or down to show additional lines. Moving up the tree is done by pressing the Right (►) key. Note that the Home Status display is at the top of the tree. The left most character on each line of a menu is the cursor. These cursors are used as follows: ●Indicates a selectable line. Pressing the Enter (●) key will select the function described on the menu line. Indicates that the line is an enumeration field. Pressing the Enter (●) key will cause the cursor to flash. Then, pressing the INC (▲) or DEC (▼) keys will sequence through the allowed choices for the line. To make a selection, press the Enter (●) key again. To abort the selection process without making any change, press either the INC (▲) or DEC (▼) key. Indicates that the selection is a numeric entry field. To change the value displayed, press the Enter (●) key and the cursor will flash. Then, press the INC (▲) key to increment the number or the DEC (▼) key to decrement the number. When the desired value is shown, press the Enter (●) key. Or, to abort entry without making any changes, press either the INC (▲) or DEC (▼) key. Note that it is much easier to enter numbers from the embedded web page or from a remote interface. Key ● Enter ▲ INC ▼ DEC ► Right Description 1) From Home screen, go to the top level setup menu. 2) Within a setup menu, Enter data or select a field (cursor display will indicate function). 3) Press and hold this key for two seconds to toggle AC power. 1) Scroll Display UP. 2) When in a field selection mode, abort entry and return to scroll mode. 3) In a numeric field, increment. 1) Scroll Display DOWN. 2) When in a field selection mode, abort entry and return to scroll mode. 3) In a numeric field, decrement. 1) Move up the menu tree one level eventually returning to the Home Status display. 2) In selection mode, scroll to next selection. Table 4: Function Key Descriptions. 9 Example Menu Shown here is an example input channel setup menu with all of the cursor characters displayed. Pressing the INC (▲) or DEC (▼) keys will move the cursor. Additional lines will be displayed after the last line shown. The first line is the channel indicator and channel name. pressing the Enter (●) key will cause the cursor to flash, then, each time an INC (▲) or DEC (▼) key is pressed, the next sequential input channel will be shown. Finally, pressing the Enter (●) key again will select the displayed channel menu. &K$6DPSOH+ROGHU . $3W $%LDV9ROWDJH1$ $%ULGJH$XWR $+L$ODUP $+L$ODUP(QD1R $/R$ODUP The second line is an enumeration. It shows the temperature reading in real-time and allows the selection of temperature units. Pressing the Enter (●) key will cause the cursor to flash. Then, pressing the Right (►) key will sequence through the allowed choices of K, C, F or S. To make a selection, press the Enter (●) key again. The sixth line is a numeric entry. To change the value displayed, press the Enter (●) key and the cursor will flash. Then, press the INC (▲) key to increment the number or the DEC (▼) key to decrement the number. When the desired value is shown, press the Enter (●) key. LED indicators There are three LED indicators below the display. They indicate the following: Alarm (Red) – An enabled alarm condition is asserted. Relay 1 (Green) and Relay 2 (Green) - Relay asserted. The Input Channel Temperature Displays Temperature displays are a seven-character field and is affected by the Display Resolution setting in the system menu. This setting will be 1, 2, 3 or Full Settings of 1, 2, or 3 K Kelvin indicate the number of digits to the right of the decimal point to display C Celsius whereas the Full setting causes the display to be left justified in order to display the maximum number of significant digits possible. F Fahrenheit Ω Ohms If the sensor type is None, the Input Channel has been disabled and a V Volts blank line is shown. m millivolts Temperature units are selected in the individual input channel setup menus. Table 5: Temperature Units Temperature Units may be K, C or F. When Sensor Units (S) is selected, the raw input readings are displayed. These will be in Volts, Ohms or milliVolts depending on the specific sensor. A sensor fault condition is identified by a temperature display of seven dash (-) characters as shown here. The sensor is open, disconnected or shorted. If a temperature reading is within the measurement range of the instrument but is not within the specified Sensor Calibration Curve, a display of seven dot (.) characters is shown. 10 . . Model 612 and 614 Temperature Monitors Power ON / OFF Pressing the Power (●) key will toggle the instrument's AC power on and off. This key must be pressed and held for two seconds before power will toggle. Note: The monitor uses a smart power on/off scheme. When the power button on the front panel is pressed to turn the unit off, the instrument's setup is copied to flash memory and restored on the next power up. If the front panel button is not used to toggle power to the instrument, the user should configure it and cycle power from the front panel button one time. This will ensure that the proper setup is restored when AC power is applied. Restoring Factory Defaults Factory default settings may be restored with the following simple procedure: 1. Turn AC power OFF by pressing the Enter (●) key for two seconds. 2. Press and hold the Right (►) key while turning AC power back ON. Keep the key pressed until you see the power-up display "Set Factory Defaults?". Then, press the DEC (▼) key to restore defaults or the INC (▲) key to continue without resetting. Clearing a latched alarm When a latched alarm is asserted, pressing the Right (►) key will clear it. Re-seeding the display time-constant filter The display time-constant filter may be set up to 64 seconds and therefore, might take an exceptionally long time to settle if some event has caused a quick change in the input temperature. Re-seeding the filter will cause the display to immediately settle at the new temperature. To re-seed the filter, navigate to the Home Status display and press the INC (▲) key. The displayed temperature should immediately stabilize. Under remote control, use the SYS:RESEED command. Specifications, Features and Functions Specification Summary User Interface Display Type: 21 x 8 character or 128x64 graphics TFT LCD. Number of Inputs Displayed: Two (Model 612) or Four (Model 614). Keypad: Sealed Silicon Rubber. Temperature Display: Six significant digits, autoranged. Display Update Rate: 0.5 Seconds. Display Units: K, C, F or native sensor units. Display Resolution: User selectable to seven significant digits. Input Channels Input channels are identical and each may be independently configured for any of the supported sensor types. Sensor Connection: 4-wire differential. DB-9 receptacles connect two channels. Connections are described in the “Sensor Connections” section. Isolation: Sensor circuits are not electrically isolated from other internal circuits. However, there is a ‘single point’ internal connection to Earth (or Shield) ground in order to minimize noise coupling. Input Protection: ±30 Volts maximum. 11 Supported Sensors: Include: Type Excitation Temperature Range Cernox™ Constant-Voltage AC 1.4K to 420K Ruthenium-Oxide Constant-Voltage AC 1.4K to 273K Germanium Constant-Voltage AC 4.2K to 100K Carbon Glass Constant-Voltage AC 1.4K to 325K Silicon Diode 10μA DC 1.4 to 500K Rhodium-Iron Constant-Current, 1mA AC 1.4 to 800K Platinum RTD Constant-Current, 1mA AC 14 to 1200K GaAlAs Diode 10μA DC 25K to 325K RO-105 RuOx 10μA DC None 1.4 to 1500K Thermocouple 4.2K Sensor Selection: Front Panel or remote interface. There are no internal jumpers or switches. Sample Rate: 15Hz per channel in all measurement modes. Digital Resolution: 24 bits. Measurement Filter: 0.5, 1, 2, 4, 8, 16, 32 and 64 Seconds. Calibration Curves: Built-in curves for industry standard sensors plus eight user curves with up to 200 entries each. Interpolation is performed using a Cubic Spline. CalGen®: Calibration curve generator fits any Diode or resistor sensor curve at 1, 2 or 3 user specified temperature points. CalGen® is implemented in the Utility software provided with the indicator. 12 Model 612 and 614 Temperature Monitors Sensor Performance Diode Sensors Configuration: Constant-Current, 10μA ± 0.05% DC excitation. Note: Current source error has negligible effect on measurement accuracy. Input voltage range: 0 to 1.8VDC. Accuracy: ± (80μV + 0.005% * reading) Resolution: 2.3μV Drift: <25ppm/ºC PTC Resistor Sensors Configuration: Constant-Current AC resistance. Drift: 25ppm/ºC Excitation Frequency: 1.625Hz bipolar square wave. Range Max/Min Excitation Resolution Resistance Current Accuracy PTC100 1mA 400Ω 0.01Ω 1.0mA 0.1mΩ ± (0.004 + 0.01%) Ω PTC1K 100μA 4.0KΩ 0.1Ω 100μA 1.0mΩ ± (0.05 + 0.02%) Ω Table 6: Accuracy and Resolution for PTC Resistors NTC Resistor Sensors, DC measurement (RO-105 Ruthenium-Oxide) Configuration: Constant-Current DC resistance. Approximately 1.0μA excitation. Ratiometric measurement cancels any error in excitation current. Measurement Drift: 25ppm/ºC Range: 230KΩ to 100KΩ. Accuracy: ± 1.0KΩ @ 100KΩ Drift: <25ppm/ºC Resolution: 10Ω Note: The NTC10uA range is intended for use with NTC sensors that have over 100KΩ of resistance. These sensors are commonly used in superconductor systems and include the SI RO-105 Ruthenium-Oxide device. All other NTC resistor sensors should use the constant-voltage configurations. Thermocouple Sensors Thermocouple devices are supported by using an optional external module. Measurement Drift: 25ppm/ºC Input Range: ±70mV Accuracy: ±1.0µ V ± 0.05%. Resolution: 0.0003% Installed Types: K, E, T and Chromel-AuFe (0.07%). Input Connector: Isothermal, Screw-type terminals. 13 NTC Resistor Sensors, Constant-Voltage AC measurement Type: Constant-Voltage AC resistance bridge with excitations down to 10mV RMS. Excitation Current: 2.5mA to 2.5µA, continuously variable. Two ranges of 2.5mA and 250µA full scale. Excitation Frequency: 1.67Hz bipolar square wave. Accuracy (% reading + % range): Reading >4Ω and < 30KΩ : ±(0.05% + 0.05%). Reading >0.04Ω and < 1.0MΩ : ±(0.15% + 0.15%). Drift: >10Ω, 25ppm/ºC. <10Ω, 35ppm/ºC Resistance Reading Range: 0 to 100KΩ Data Logging Data logging of input channel data is performed into an internal, 40K byte circular buffer and is timestamped with a real-time clock. Buffer memory is non-volatile and will retain valid data indefinitely without AC power. The monitor will log a maximum of 1,000 entries where each entry contains eight temperature readings. Status Outputs Visual Alarms: Independent visual alarms can be configured for each input. They are displayed on the front panel as text characters and an LED indicator. Status reported via Remote Interface: Input channel alarms. Relay Outputs Number: 2 Type: Dry-contact. Contact ratings: 10A@125 VAC, 5A@250VAC or 5A@30VDC. Function: Asserted or cleared based on temperature setpoint data. Deadband: User defined. Connector: 4-pin detachable terminal block. Remote Interfaces Remote interfaces are electrically isolated to prevent ground loops. Ethernet: Industry standard 10-BaseT. Electrically isolated RS-232: Serial port is an RS-232 standard null modem. Rates are 9600, 19,200, 38,400 and 57,200 Baud. IEEE-488 (GPIB): External option. Full IEEE-488.2 compliant. USB 2.0: External option. Serial port emulator. Language: Remote interface language is IEEE-488.2 SCPI compliant. Further, it is identical within the entire Cryomagnetics instrument line. Compatibility: National Instruments LabView™ drivers available for all interfaces. Ethernet API available for C++ and Basic. Firmware Internal firmware and all data tables are maintained in FLASH type memory. 14 Model 612 and 614 Temperature Monitors General Ambient Temperature: 25°oC ± 5 oC for specified accuracy. Mechanical: 5.75"W x 2.875"H x 8.75"D. Weight: 3 Lbs. Enclosure: Aluminum Extrusion. Machined Aluminum front and rear panels. Power Requirement: Input voltage is 7.5 to 48V, AC or DC, 10VA. 1. External transformer (Provided). Input 100 – 240VAC @ 50 – 60Hz. 2. IEEE-802.3at Power-Over-Ethernet (requires powered hub or injector) 15 Performance Summary Measurement Accuracy Diode Sensors The formulas for computing measurement accuracy while using diode sensors are: MAV = 60 * 10-6 + 510-5 X SenRdg MAT = MAV / SenSen Where: MAV is the electronic Measurement Accuracy in Volts MAT is the Measurement Accuracy in Kelvin SenRdg is the sensor reading in Volts at the desired temperature. SenSen is the sensor sensitivity in Volts / Kelvin at the desired temperature. For example, if we want to calculate measurement accuracy using a Cryocon S900 sensor at 10K, we would look up the sensor reading and sensitivity in the S900 data table in Appendix E. At 10K, we see that SenRdg is 1.36317 Volts and SenSen is 0.002604 Volts/Kelvin. Therefore, MAV = 60 * 10-6 + 5 * 10-5 * 1.36317 MAT = MAV / 0.002604 The result is that MAV = 128μV and MAT = 49mK. PTC and NTC Resistor Sensors The formulas for PTC and NTC resistor sensors are stated above. As an example, here is a computation for a PTC resistor with the PTC100 input configuration: Where: MAR = 0.002 + 1.0 * 10-4 * SenVal MAT = MAR / SenRdg MAR is the electronic Measurement Accuracy in Ohms MAT is the Measurement Accuracy in Kelvin SenRdg is the sensor reading in Ohms at the desired temperature. SenSen is the sensor sensitivity in Ohms / Kelvin at the desired temperature. To calculate measurement accuracy using a 100Ω Platinum RTD in the PTC100 range with the sensor at 77.35K, we would look up the sensor reading and sensitivity in Appendix E and see that SenRdg is 20.38Ω and SenSen is 0.423 Ω/Kelvin. Therefore, we compute MAR = 0.004038Ω and MAT = 9.5mK. 16 Model 612 and 614 Temperature Monitors Input Channel Characteristics There are four (Model 614) or two (Model 612) independent, multi-purpose input channels; each of which can separately be configured for use with any supported sensor. The sensor type is selected by the user and this establishes the input configuration. Values of excitation current, voltage gain etc. will be determined by the microprocessor and used to automatically configure the channel. There are no jumpers or optional cards required to configure the various sensors. Input Configurations A complete list of the input configurations supported by the monitor is shown below: Max. Voltage/ Resistance Sensor Type Bias Type Excitation Current Diode 1.75V CI 10µA DC ACR 8Ω to 1.0MΩ CV 1.0mA to 0.1µA AC PTC100 0.5 - 400Ω CI 1.0mA DC PTC1K 5 - 4.0KΩ CI 100uA DC NTC10UA 240KΩ CI 10uA DC TC70 ±70mV None 0 None 0 None 0 Table 6: Input Configurations Bias types are: CI – Constant Current through the sensor. CV – Constant Voltage-drop across the sensor. Note: A complete listing of factory installed sensors and their characteristics can be found in Appendix A. Note: Any disconnected inputs to the monitor should be set to type 'None'. This will turn the input off. Silicon Diode Sensors Silicon Diode sensors (2-Volt diodes) are configured with a 10μA current source excitation and a 2.2Volt input voltage range. PTC Resistor Sensor (RTDs) The monitor supports all types of Positive-Temperature-Coefficient (PTC) resistive sensors using a constant-current AC resistance measurement technique. Standard calibration curves are provided for DIN43760 and IEC751 Platinum sensors. These curves have been extended down to 14K. Below that, the sensors can be used with user supplied calibration curves. A table of recommended setups for various types of PTC resistor sensors is shown here: Measurement Range Sensor Excitation Platinum, 100Ω Type 625Ω - 0.01Ω 1.0mA, AC Platinum, 1000Ω 6.25KΩ - 0.1Ω 100μA, AC Rhodium-Iron 6.25Ω - 0.01Ω 1.0mA, AC Table 7: PTC Resistor Sensor Configuration 17 NTC Resistor Sensors > 100KΩ Ruthenium-Oxide sensors used in superconducting magnet systems commonly have a room temperature resistance of > 100KΩ. The monitor supports these devices using 10μA DC constant-current excitation. The maximum resistance is 220KΩ. DC excitation is used since the high resistance values do not benefit from AC excitation. In addition, 10μA constant-current is implemented because the extremely small current used by constant-voltage modes would lead to measurement noise. Sensor self-heating caused by the high level excitation is calibrated out in the sensor's calibration curve. Since this self-heating is reproducible, high measurement accuracy is maintained. Examples of high resistance sensors include the Cryocon R400 and the Scientific Instruments RO-105. NTC Resistor Sensors The monitor supports almost all types of Negative-Temperature-Coefficient (NTC) resistive sensors by using a constant-voltage AC resistance bridge technique, these sensors can be used down to very low temperatures. Examples of NTC resistor sensors include: Ruthenium Oxide, Cernox™, Carbon Glass, Germanium and other thermistors. Constant-voltage excitation is necessary since the resistance thermometers used below about 10K exhibit a negative temperature coefficient. Therefore, a constant-voltage measurement reduces the power dissipation in the sensor as temperature decreases. By maintaining low power levels, sensor self-heating errors that occur at very low temperatures are minimized. In the constant-voltage mode, sensor excitation is a 1.67Hz bipolar square-wave. This provides DC offset cancellation without loss of signal energy. DC offsets are held to <0.2µA in order to minimize it's contribution to sensor self-heating. For more information on using the monitor with NTC resistor sensors, please refer to the section titled "Selecting a Voltage Bias for NTC Sensors". Power dissipation in the sensor is computed by: Pd = 2 Vbias Rsensor When used with high resistances, measurement accuracy steadily degrades due to the extremely low excitation current required. The trade-off in measurement accuracy vs. sensor excitation current is taken for two reasons: The sensitivity of NTC resistor sensors is extremely high in the low temperature end of their range. Therefore the reduced measurement accuracy does not degrade temperature measurement accuracy. The low current settings are required since sensor self-heating at low temperature is a very significant source of errors. For more information please refer to the section titled "Selecting a Voltage Bias for NTC Sensors" Calibration tables for NTC sensors may be entered either directly in Ohms or in (base 10) Log of Ohms to accommodate the generally logarithmic nature of their calibration curves. 18 Model 612 and 614 Temperature Monitors Gallium-Arsenide Diode Sensors Gallium-Arsenide diodes or 6-Volt diodes are sometimes used in systems where magnetic fields are present. Use is limited to operation above about 30K with fields of less than 5T. The monitor supports these sensors down to 25K. If your requirements are for lower temperature operation, Ruthenium-Oxide is a better choice. Gallium-Arsenide sensors do not fit standard calibration curves, therefore, the user must provide a sensor-specific curve before using this type of sensor. CalGen Calibration Curve Generator The CalGen® feature generates new calibration curves for Silicon diode, thermocouple or Platinum sensors. This provides a method for obtaining higher accuracy temperature measurements without expensive sensor calibrations. Curves can be generated from any user-selected curve and are written to a specified internal user calibration curve area. CalGen is implemented in the Utility Software. Input Channel Statistics Input temperature statistics are continuously maintained on each input channel. This data may be viewed in real time on the Input Channel menu, or accessed via any of the remote I/O ports. Statistics are: Minimum Temperature. Maximum Temperature. Temperature Variance. Slope and Offset of the best-fit straight line to temperature history. Accumulation Time The temperature history may be cleared using a reset command provided. Electrical Isolation and Input Protection The input channel measurement circuitry is not isolated from other internal circuits. The common mode voltage between an input sensor connection and the instrument's ground should not exceed ±40V. Sensor inputs and outputs are provided with protection circuits. The differential voltage between sensor inputs should not exceed ±15V. Thermal EMF and AC Bias Issues DC offsets build up in cryogenic temperature measurement systems due to thermocouple effects within the sensor wiring, though careful wiring minimizes these effects. However, in a few systems, measurement errors induced by thermal EMFs result in unacceptable measurement errors. These cases require the use of an AC bias, or chopped sensor excitation in order to remove DC offsets. Sensor Wiring Diode and Platinum RTD type sensors use a DC measurement scheme. Therefore, the only effective method of minimizing thermocouple (DC) offsets is to wire temperature sensors so that connections between dissimilar metals are grouped together. For example, the connection between sensor leads and cryostat wiring should be kept close together. This way, the thermocouple junctions formed by the connection have equal-but-opposite voltages and cancel each other. In a four-wire measurement scheme, only connections in the voltage sense lines can cause measurement errors. Therefore, the sense wires should have adjacent contacts in a multi-pin connector in order to minimize any temperature difference between them. Usually, the ‘connection to copper’ in a cryostat is made at the top of the cryostat. After this point, Thermal EMFs cannot be generated. AC Excitation When a resistance sensor is selected, the monitor uses a square-wave sensor excitation. This eliminates DC offsets by computing the sensor resistance at two different excitation points. 19 Output Channel Features Alarm Outputs Alarm outputs include a LED indicator, an audible alarm, on-screen display and remote reporting. Alarms may be asserted based on high temperature or low temperature condition. A user selectable dead-band is applied to all alarms. The High and Low temperature alarms may be latched. See the Input Channel Configuration Menu. Note: A latched alarm may be cleared by pressing the Right (►) key on the front panel when the Home Status screen is displayed. Relays The monitor has two large dry-contact mechanical relay outputs. Relays are asserted or cleared based on the temperature reading of selected input channels. Each output has a high and low set-point that may be enabled from the front panel or a remote interface. Furthermore, relays can be manually asserted ON or OFF. Normally-Open contacts are available on the rear panel. Contact ratings: 10A@125 VAC, 5A@250VAC or 5A@30VDC. Remote Interfaces Ethernet LAN and RS-232 interfaces are standard. IEEE-488.2 (GPIB) and USB are external, field installable options. All functions and read-outs available from the instrument may be completely controlled by any of these interfaces. The LAN interface is electrically isolated and is 10/100-BaseT compliant. Connection is made via the RJ45 connector on the rear panel. The Serial port is an RS-232 standard null modem with male DB9 connector. Rates are 9600, 19,200, 38,400 and 57,200 Baud. When installed, the GPIB option is fully IEEE-488.2 compliant. Connection is made at the rear panel's LAN port. The USB option is a serial port emulator. The programming language used by the monitor is identical for all interfaces and is SCPI language compliant. The Standard Command Protocol for programmable Instruments (SCPI) is a sub section of the IEEE-488.2 standard and is a tree structured ASCII command language that is commonly used to program laboratory instruments. 20 Model 612 and 614 Temperature Monitors Mechanical, Form Factors and Environmental Display The display is an eight line by twenty-character graphic TFT-LCD. Enclosure The monitor is bench mountable. Rack mounting can be done by using an optional rack mount kit. Dimensions are: 5.75"W x 2.875"H x 8.75"D. Weight is 3Lbs. Environmental and Safety Concerns. Safety The monitor protects the operator and surrounding area from electric shock or burn, mechanical hazards, excessive temperature, and spread of fire from the instrument. • Keep Away From Live Circuits: Operating personnel must not remove instrument covers. There are no internal user serviceable parts or adjustments. Refer instrument service to qualified maintenance personnel. Do not replace components with power cable connected. To avoid injuries, always disconnect power and discharge circuits before touching them. • Cleaning: Do not submerge instrument. Clean exterior only with a damp cloth and mild detergent only. • Grounding: To minimize shock hazard, the instrument is equipped with a three-conductor AC power cable. Plug the power cable into an approved three-contact electrical outlet only. Safety Symbols 21 Environmental Conditions Environmental conditions outside of the conditions below may pose a hazard to the operator and surrounding area: • Indoor use only. 22 • Altitude to 2000 meters. • Temperature for safe operation: 5 °C to 40 °C. • Maximum relative humidity: 80% for temperature up to 31 °C decreasing linearly to 50% at 40 °C. • Power supply voltage fluctuations not to exceed ±10% of the nominal voltage. • Over voltage category II. • Pollution degree 2. • Ventilation: The instrument has ventilation holes in its side covers. Do not block these holes when the instrument is operating. • Do not operate the instrument in the presence of flammable gases or fumes. Operation of any electrical instrument in such an environment is a definite safety hazard. The User Interface Overview The Models 612 and 614 user interface consists of an eight line by 21-character TFT LCD display and a four key keypad. Most features and functions of the instrument can be accessed via this simple and intuitive menu driven interface. Complex functions, such as downloading a new sensor calibration curve, require using one of the remote interfaces. The instrument powers up with the home status display. This is a status-only display and the contents is user selectable. $. %. &. '. The Model 614’s factory default display is shown here. It shows all eight channels plus alarm indicators. Here, the – characters indicate no alarm. The monitor has nine different Home Status displays that can be viewed and selected by pressing the Right (►) key. $6DPSOH+ROGHU Several displays show temperature information in a large, easy to read font. Also shown is the input channel name. This name is a convenience that allows easy association of the input channel with its actual connection. Channel names may be entered by use of the embedded web site or via any of the remote interfaces. . %5DG6KLHOG . 23 Instrument Setup Menus The root of the instrument’s setup menus is accessed by pressing the Enter (●) key from the Home Status display. The Root Menu The Root Menu displays the list of sub-menus that are used to configure the instrument. Press the Enter (●) key to descend into the sub-menu, or the Right (►) key to return to the Home Status display. Selections in the root menu are as follows (Model 614 shown): Root Menu 1 &K$6HWXS● Press Enter to setup input channel A. 2 &K%6HWXS● Setup input channel B. 3 &K&6HWXS● Setup input channel C. 4 &K'6HWXS● Setup input channel D. 5 6\VWHP6HWXS 6 'DWDORJJLQJ6HWXS● Configure internal data-logging. 7 5HOD\6HWXS● Configure Relay 1 8 5HOD\6HWXS● Configure Relay 2 9 1HW&RQILJ● Go to the Network Configuration Menu. 10 7LPH'DWH6HWXS● Setup the instrument’s time and date. ● Go to the System Setup Menu. Table 8: Monitor Root Menu Input Channel Setup Menu The Input Channel Setup menus are used to configure the four (Model 614) or two (Model 612) input channels. They are accessed from the root menu. The first character on each line of these menus is always the input channel identifier, which is a superscripted A, B, C, or D (Model 614) or A, B (Model 612). Scrolling to a line using the ▲ or ▼ keys and then pressing the Enter (●) key will cause the cursor to change from a block cursor to the data entry cursor type that corresponds to the type of data that may be entered in this field. 24 Model 612 and 614 Temperature Monitors ChA, ChB, ChC, ChD Setup Menu &K$&KDQQHO$ Indicates currently selected input channel. Select to scroll through all inputs. 2 . Input channel units. Temperature is displayed in real time on the left and is in the selected units. Selections are K, C, F or S. Here, S selects sensor units (Volts or Ohms). 3 6HQ3W Sensor type selection. Allows selection of any user or factory installed sensor. 5 $%ULGJH$XWR Selects bridge range. For NTC sensors, selections are 1.0mA, 100uA, 10uA and Auto. All other sensors use Auto. 6 +LJK$ODUP Set point for the High Temperature alarm. 7 +LJK(QDEOH1R High temperature alarm enable. Selections are Yes or No. 8 /RZ$ODUP Set point for the Low Temperature alarm. 9 /RZ$ODUP(QD<HV Low temperature alarm enable. Selections are Yes or No. 1 Alarm deadband. $'HDGEDQG 11 $/DWFKHG(QDEOH1RSelects latched vs. non-latched alarms. 10 12 $0D[. Information only. Maximum value attained since statistics reset. 13 $0LQ. Information only. Maximum value attained since statistics reset. 14 only. Time accumulated since statistics $$FFXP0LQInformation reset. 15 $6 Information only. Standard Deviation value attained since statistics reset. 16 $0.0LQ Information only. Slope of best-fit straight line. Value attained since statistics reset. 17 $E. Information only. Offset of best-fit straight line. Value attained since statistics reset. 18 ● $5HVHW6WDWLVWLFV Reset Statistics Table 9: Input Channel Setup Menus. 25 Temperature Units The Units field (line 1) assigns the units that are used to display temperature for the input channel. Selections are K for Kelvin, C for Celsius, F for Fahrenheit and S for sensor units. Note that if the S option is selected, the actual sensor units will be displayed when the field is deselected. Sensor units are V for Volts, m for milliVolts and Ω for Ohms. Sensor Type Selection Line 2 selects the Sensor type for the input channel. When this field is selected, the scroll keys are used to scroll through all of the available sensor types. Factory installed sensors appear first and then user sensors. For a list of factory installed sensors, refer to Appendix A. Setting a Temperature Alarm The Alarm lines are used to setup alarm conditions. The monitor allows alarm conditions to be assigned independently to any of the input channels. High temperature, low temperature alarms may be entered and enabled or disabled. Note that there is a 0.25K hysteresis in the assertion of high and low temperature alarms. The deadband field sets how much over or under the setpoint that the input temperature must be before changing the state of the alarm. Latched or non-latched alarms may be selected. Once asserted, a latched alarm remains asserted until it is cleared. Note: A latched alarm may be cleared by pressing the Right (►) key on the front panel when the Home Status screen is displayed. Alarm conditions are indicated on the front panel by the Alarm LED and (if enabled) an audio alarm. They are also reported via the remote interfaces. Input Channel Statistics Statistics are accumulated on each input channel. The accumulated values may be reset by selecting the last line of the menu: “Reset Statistics”. The System Setup Menu The System Functions Menu is used to set many of the instrument’s parameters including display resolution, I/O port settings etc. It is selected from the Root Menu. System Functions Menu 1 'LVSO\7&6 Sets the display time constant in seconds. Selections range from 0.5S to 16S 2 'LVSO\56 Sets the resolution. Selections are: 1, 2, 3 or Full. 3 ):9HUVLRQ( Information Only. Firmware revision code. 4 56 RS-232 serial port baud rate 5 *3,%$GUV( GPIB address. Valid only if attached to an external GPIB option. Table 10: System Functions Menu Display Time Constant The first line of the System Functions Menu is Display TC or Display Time Constant. This is an enumeration field that sets the time constant used for all temperature displays. Choices are 0.5, 1, 2, 4, 8, 16, 32 and 64 Seconds. The time constant selected is applied to all channels and is used to smooth data in noisy environments. 26 Model 612 and 614 Temperature Monitors Display Resolution The Display Resolution line (Display:RS) is used to set the temperature resolution of the front panel display. Settings of 1, 2 or 3 will fix the number of digits to the right of the decimal point to the specified value. A setting of FULL will left justify the display in order to show the maximum resolution possible. The Data-logging Setup Menu The Data-logging Menu is used to setup internal data logging. Data accumulated into an internal buffer that may be read out by using Cryomagnetics’ utility software, or by use of remote commands. System Functions Menu 1 6WDWH2II Starts or stops data-logging. 2 ,QWHUYDOVHF Sets the logging interval in units of seconds. 3 &RXQW Information Only. Number of samples logged. 4 Most recent date-time stamp. 5 ● 'HOHWH'DWD%XIIHU Clears the data-logging buffer. Table 11: Data-logging Setup Menu Relay Configuration Menu The two internal relays are configured by this menu. Relay Menu 1 2 3 4 5HOD\6HWXS0HQX 6RXUFH&K$ 6UF7HPS. 5O\6WDWXV Starts or stops data-logging. Sets the logging interval in units of seconds. Information Only. Number of samples logged. Information Only. Current relay status. 5 0RGH$XWR Relay operating mode. Choices are Auto, ManualON and ManualOFF. Auto mode asserts or clears the relay based on the high and low setpoints along with their respective enables. 6 'HDGEDQG Deadband. Sets the amount above or below the setpoint that the input channel's temperature has to be in order to toggle the state of the relay. +LJK 8 +LJK(QDEOH1R 9 /RZ 10 /RZ(QDEOH1R 7 High setpoint High setpoint enable. Low setpoint Low setpoint enable 27 The Network Configuration Menu The Network Configuration Menu is accessed from the System Setup Menu. It is used to configure basic Ethernet LAN settings. For advanced network settings, use a web browser to view the embedded web server. Network Configuration Menu 1 Information Only. Device name. be changed by the 'HY1HZ&U\RPDJQHWLFV May embedded web server or a remote interface. 2 &)( Information Only. MAC address. Unique 12 digit number for each instrument. 3 '+&3(QD2II DHCP enable. Recommended: Off. 4 ● ,3 Press Enter to change the unit’s Ethernet IP address. 5 ● 06. Press Enter to change the unit’s Ethernet subnet mask. 6 ● *Z\ Press Enter to change the unit’s Ethernet gateway IP. 7 3RUW TCP/IP port number. UDP port is TCP/IP port plus one. ! Information Only. Displays last command received over a remote interface. Used for debugging remote programs. Information Only. Displays last command sent over a remote interface. Used for debugging remote programs. 8 9 The Time / Date Setup Menu The Time / Date Setup Menu is used to set the system’s time and date settings. Time / Date Setup Menu 1 ● 7LPH System time. Press Enter to set 2 ● 'DWH System Date. Press Enter to set Basic Operating Procedures Configuring a Sensor Before connecting a new sensor to the monitor, the instrument should be configured to support it. Most common sensors are factory installed while others require a simple configuration sequence. Note: Sensor configuration from the instrument's front panel is discussed here. However, the process is much easier to perform by using the embedded web page. A complete list of sensors installed at the factory is shown in Appendix A. To configure the instrument for one of these sensors, proceed as follows: 28 Model 612 and 614 Temperature Monitors 1. Install the sensor on a selected input. Installation is described in the section titled Sensor Connections in Appendix H. 2. Navigate the front panel to the Input Channel Setup menu for the selected channel. The second line of this menu will show the current temperature in real-time and allow you to select the desired display units. 3. Use the navigation keys to go down to the Sen: field, scroll through the options and select the desired sensor. Select None to disable the input channel. At the end of the factory-installed sensors, eight user-installed selections will be shown. The default name for these are User Sensor N. However, this name can be changed to give a better indication of the sensor type that is connected. For most sensor types installation is now complete. The exceptions are NTC resistor sensors that use constant-voltage AC excitation. With these types of sensors, scroll down to the Bias Voltage field and select the desired constant-voltage excitation level. Then, select the bridge range. Default range is Auto for auto-ranged. But, some applications perform better if the actual range is fixed. Note: Only NTC resistor sensors require the selection of a Bias Voltage and Bridge Range. 29 Using NTC Sensors Negative-Temperature-Coefficient (NTC) resistors are often used as low temperature thermometers, especially at ultra-low temperature. Their resistance and sensitivity increase dramatically at low temperature but their sensitivity is often relatively poor at warmer temperatures. The monitor supports these sensors by using a constant-voltage AC resistance measurement: ● Measurement accuracy and temperature range are improved at low temperature because sensor self-heating errors are reduced or eliminated. ● Measurement accuracy is improved at warmer temperatures because the constant voltage circuit increases excitation power in that region. ● The control stability is improved in the warm region since higher excitation power reduces measurement noise. ● DC offsets in the resistance bridge can cause additional power dissipation at low excitation levels. The monitor holds offsets to a maximum of one-half of the minimum excitation current by use of an offset cancellation feedback loop. Error Sources in NTC Sensor Measurements At warm temperatures, the major source of error with NTC sensors is the measurement electronics itself. In a well-designed instrument, accuracy is limited to a level established by the measurement's signal-tonoise-ratio, where the signal is the power dissipated in the sensor and noise is the collection of all noise sources. Thus, accuracy is generally improved by increasing the power dissipated in the sensor. Conversely, at low temperature, NTC resistors have high resistance and the primary source of error is sensor self-heating caused by excitation power. The resistor has high sensitivity in this region, so measurement errors are small when viewed in units of temperature. Constant-voltage sensor excitation increases signal power at warm temperature, thereby improving measurement accuracy in an area where the sensor is less sensitive. At low temperature, constant voltage excitation reduces the power dissipated in the sensor which reduces accuracy in units of Ohms, but more importantly, reduces sensor self-heating. Since low temperature is the sensor's most sensitive area, temperature measurement accuracy will not be degraded. The result is an accuracy improvement that extends the useful temperature range of a given sensor at both the warm and cold ends. 30 Model 612 and 614 Temperature Monitors Data Logging The monitor has an internal data logging capability that uses non-volatile memory. Logging of input channel temperature data is performed to a circular buffer that contains up to 1,000 samples. Each sample contains all eight temperature readings plus a time stamp from a real time clock. The data logging buffer may be read by using the Utility Software package. This will save the logging buffer as a text file (.CSV) that can be opened by spreadsheet and text editor programs. Data Logging Setup The best way to setup data logging is by using the embedded web server. However, it can also be performed from the front panel. The first step is to ensure that the instrument's real-time clock is set to the current time. This can be done by opening the embedded web page. The current time is shown on the bottom of the Status Page and the clock may be set by going to the System page. From the front panel, the current time can be viewed and updated by going to the Time/Date Setup menu. Data logging can be configured and enabled from the embedded web server's System page. The Logging Enable field turns logging on and off and the Interval field sets the logging sample rate. The Current Count field shows how many samples have been accumulated. From the front panel, data logging may be configured by going to the System Setup menu and scrolling down to the Data Log Enable and Interval fields. Once enabled, data logging will continue until stopped. When the input buffer is full, new samples will over-write the oldest samples. Reading the Data Log Buffer Reading, or uploading, the monitor data logging buffer is best done using the Utility Software. Launch the software and connect to the instrument. Next, click on the Data Logging menu field and then click on Upload. This will launch a series of dialog boxes that will take you through the data logging process. Note: The Utility Software can perform data logging by continuously reading samples from a connected instrument. This is a different function than uploading the internal log buffer from the instrument. The internal data logging function does not require a connection to a computer. 31 Downloading a Sensor Calibration Curve The monitor accommodates up to eight user-defined sensor calibration curves that can be used for custom or calibrated sensors. Since these curves have up to 200 entries, they are usually maintained on a computer as a text file and downloaded to the controller by using the Utility Software. Cryomagnetics sensor calibration curves have a file extension of .crv. They may be opened and edited with any text editor. The format of the file is detailed in Appendix A. The process for downloading a sensor calibration curve using the Utility Software is detailed in the section titled Downloading or Uploading a Sensor Calibration Curve. This section discusses how to set up a curve specifically for download to the monitor. The Utility Software will read and attempt to parse the following file types: Sensor Curve File Types .crv Lakeshore .340 SI .txt Other .txt Directly supported. Supported. Reads curve data. Header information must be entered by using the header dialog box. The Utility Software will convert these files into .crv format automatically. No header information. Columns are reversed from other formats. Must be manually converted to a .crv file before use. Software will attempt to parse any text file. If the file contains columns of sensor readings vs. temperature, the entries will be properly parsed and the curve can be used or converted to a .crv file after the header dialog box is filled out. In order to download a file, run the utility software and select 'Sensor Curve Download'. The user will be prompted to select a file. Once the software has read the file, the header information dialog box will appear. 32 Model 612 and 614 Temperature Monitors The Sensor Name can be any string, up to 15 characters, that helps identify the sensor. The Sensor Type, Multiplier and Unit fields affect how the instrument is configured, so they must be correctly set or unexpected results will be obtained. Sensor Ruthenium-Oxide Type Multiplier Units Example ACR -1.0 LogOhms CX1030E1.crv ACR -1.0 LogOhms LSRX102.crv LSRX102.crv Thermistors ACR -1.0 LogOhms Rhodium-Iron 27Ω PTC100 1.0 Ohms rhfe27.crv Germanium ACR -1.0 LogOhms LSRX102.crv Carbon Glass ACR -1.0 LogOhms LSRX102.crv Silicon diode Diode -1.0 Volts s900diode.crv Carbon Ceramic ACR -1.0 LogOhms LSRX102.crv Platinum 100Ω PTC100 1.0 Ohms PT100385.crv Platinum 1KΩ PTC1K 1.0 Ohms PT1K385.crv GaAlAs diode Diode -1.0 Volts arial diode.crv Table 12: Recommended Sensor Configuration Data Note that NTC resistor data is generally in units of LogOhms. However, it can also be in units of Ohms. Be sure to check the curve data for reasonableness. Note: One simple way to generate a sensor calibration curve is to open a similar sensor file with a text editor and paste in your own data. The example files in the above table are for that purpose. They are located in the monitor sub-directory of the Utility Software package. At this point, it is a good idea to view a graph of the curve data. The above graph is for a Ruthenium-Oxide sensor with units of LogOhms. It shows the typical highly nonlinear curve for that type sensor. If the curve data was in units of Ohms, it would be so extremely nonlinear that significant errors might result. Proceed with downloading the curve to the instrument. 33 Using Thermocouple Sensors Thermocouple sensors have low sensitivity at cryogenic temperatures and are very susceptible to electrical noise. In order to obtain the best possible measurement accuracy, the recommendations given here should be carefully applied. Installing the Thermocouple Module All thermocouple sensors require the use of an optional Cryomagnetics external thermocouple module (4039-004). This module simply plugs into any sensor input channel to support thermocouple measurements from cryogenic through oven temperatures. Up to four modules can be installed on a single instrument and they can easily be added or removed at any time. They are powered by the monitor and perform amplification, cold-junction compensation and connection to copper. Internal switches are used to select the cold junction compensation for specific types. Open the module and use the switches to select types K, E, T, AuFe 0.7% or off. The thermocouple device is connected to the module by using a mini-spade connector. Refer to the Thermocouple Connections section. Offset Calibration Thermocouple devices can vary significantly from their standard curves, especially at cryogenic temperatures where their sensitivity is reduced. To accommodate these variations, the monitor allows an offset calibration for individual thermocouple devices. This can be a simple offset or a two-point offset and gain calibration. Note that device calibrations to not affect the instrument's basic calibration. &K$5DGLDWLRQ6KLHOG 7KHUPRFRXSOH . 6HW5HDGLQJ. 5HWXUQWR&K$FIJ Device calibration is performed by using the instrument's Input Configuration menu. An example is shown here. Alternatively, calibration may be performed by using remote commands. For cryogenic applications, an offset calibration is usually done at a low temperature reference point. Examples being liquid nitrogen or even liquid helium. The result of the calibration is that the controller will read the correct temperature when the sensor is held at that reference. Since thermocouples lose sensitivity at low temperature, an offset calibration in that range will generally have little effect on the higher temperature accuracy. An offset calibration is done as follows: 1. Connect the monitor as usual for thermocouple measurements. This procedure is done with the thermocouple cold-junction compensation ON. For best accuracy, be sure that ambient temperature doesn't vary significantly. 2. Allow the instrument to warm up for at least ½ hour without moving or handling the sensor. 3. From the instrument front panel, first set a thermocouple sensor and then go to the input configuration menu. 4. Establish the thermocouple device at a precisely known temperature. When stable, enter the desired reading in the Set Reading field and press Enter. For example, if the sensor is immersed in liquid nitrogen, enter a value of 77.35K 5. The input temperature reading should snap to the value entered. Note that the Set Reading temperature is always in units of Kelvin. Grounded vs. Floating Thermocouples Electrically floating devices are always recommended because they provide generally lower noise operation and cannot facilitate ground-loop conditions. However, the thermocouple module inputs are 34 Model 612 and 614 Temperature Monitors differential and have a high impedance to ground. This will allow operation with grounded devices in most systems. Always ensure that there is no more than a 5V difference between the grounded thermocouple and the instrument's chassis ground. Common Error Sources Cold Junction Compensation Cold Junction Compensation in the Cryomagnetics thermocouple module is performed by a circuit that measures the temperature of the input connector pins. This reading is then used offset the device's output voltage. Errors can be minimized by reducing local air currents around the module. Device Calibration Errors Variation in the manufacture of thermocouple wire and it’s annealing over time can cause errors in temperature measurement. Instruments that measure temperatures above about 0oC will usually allow the user to correct calibration errors by adjusting an offset in order to zero the error at room temperature. Unfortunately, in cryogenic applications, thermocouples lose sensitivity at low temperatures so a single offset voltage correction is insufficient. Thermocouples used over a wide temperature range may need to be calibrated at two temperature extremes. AC Power Line Noise Pickup AC power noise pickup is indicated by temperature measurements that are significantly in error. In extreme cases, there may be no valid measurements at all. When a grounded sensor is used, a poor quality ground may have sufficient AC voltage to exceed the input range of the module. This can often be corrected by running a copper connection from a point near the sensor ground and the chassis ground of the controller. Defective building wiring or insufficient grounding is usually the root cause. General recommendations to minimize AC pickup include: 1. Minimize the length of the thermocouple wires. Connect the module as near as possible to the sensor so that thermocouple wires are converted to copper as soon as possible. 2. Twist the wires. 3. Avoid running sensor wires near, or parallel to AC power lines. Shielding and Grounding Issues Grounding Power supplied to the instrument by an external supply or via Power-Over-Ethernet does not generally provide an earth ground reference. In order to minimize noise coupling into the instrument and customer's equipment, connection to an earth ground reference should be established by some other means. Common methods include: 1. Connecting the sensor cable shield to the instrument's chassis on one end and to the cryostat ground on the other. Generally, these connections are made using the backshell on the respective connectors. 2. Connection of a ground wire from the instrument's rear panel to a ground reference. This is often the cryostat ground. Note: The enclosure, except for rear panel, is anodized and cannot make electrical connection. 3. Connection of an RS-232 cable will reference the instrument to your computer's earth ground. Connection of a LAN cable does NOT make a reference since Ethernet is isolated. 4. Ground reference the negative side of an external power supply. The supplied external power supply or a Power-Over-Ethernet supply CANNOT be ground referenced. 35 IMPORTANT: The monitor requires that an Earth Ground reference connection is made at the rear panel. Failure to provide this connection will result in erratic measurements and can even damage input circuits. The sensor cables provided connect their shields to the monitor's chassis; Therefore, the required Earth Ground can be made by connecting the shield wire at the opposite end to a ground reference point. This is usually done by connecting it to the back-shell of the cryostat connector. The Single-Point-Ground The internal Single-Point-Ground is the voltage reference point for the instrument’s grounding scheme. All circuits are designed so that no current will normally flow through the connections to this ground. Therefore, it provides a good quality, low impedance path to ground for any undesired currents that are coupled into the equipment. Sensor Connection For best performance, all sensors connected to the instrument should be electrically isolated (floating) from any other grounds. Sensors used in cryogenic thermometry are often high impedance. For example, a Silicon Diode temperature sensor will have about 160K ohms of impedance at 5K. Because of this, a very efficient antenna can develop around the sensor and its connections. Requiring these sensors to be floating and providing a low impedance path to ground is the most effective way to eliminate noise pickup from this antenna effect. To ensure that the instrument’s grounding scheme is working effectively: 1. Make sure that the sensors are floating. 2. Make sure that the input cable shields are connected to the connector’s metal backshell. 3. Since the Monitor's enclosure is floating, ensure that the cryostat end of the sensor cable shields are also connected to the cryostat. 36 Model 612 and 614 Temperature Monitors Utility Software A PC compatible utility software package is provided with all instruments. This is available on CD, or on the Internet. Utility software can be used to control and configure the instrument via the LAN interface. It runs under all versions of the Windows operating system. This software provides several useful functions, including: 1. Real-time strip charts of temperature. 2. Data Logging. This function allows the user to record data from the instrument at a specified sample rate. The resulting file is compatible with most spreadsheet and data analysis software. 3. Download or upload sensor calibration curves. The software will accept curves in Cryomagnetics .CRV, Lakeshore .340 or Scientific Instrument’s .txt format. In fact, it will read almost any table of temperature vs. sensor units. 4. CalGen® function is implemented. This function allows the user to fit an existing sensor calibration curve to one- two- or three user-specified points. The result is a high accuracy sensor calibration at low cost. 5. Configuration of any of the instrument’s remote interfaces. 6. ‘Interactive Mode’ provides interactive communication with the instrument over any of the remote interfaces. Installing the Utility Software From a CD, the utility software package does not require installation. It can be executed from the CD directly by running the UTILITY.EXE program. When the software is downloaded off of the Internet, it is in a self-extracting ZIP format and must first be un-zipped onto hard disk. 37 Connecting to an Instrument The desired remote interface connection may be selected by clicking Comm>Port Select from the main menu. Select the desired communications port and then click OK. Click on the Connect button of the shortcut menu bar or on Comm->Connect from the main menu to connect to the instrument. After a short delay, the connect LED should light and the instrument type will be displayed. Also, most of the grayed-out fields on the menu bars should activate. 38 Model 612 and 614 Temperature Monitors Using the Interactive Terminal The Utility Software’s Interactive Terminal mode allows the user to send commands to the instrument and view the response. Terminal mode is selected by selecting Comm>Interact from the main menu or Interact from the shortcut bar. This will result in the display shown below. To interact with the instrument, type a remote command into the dialog box and click Send. The command will be transmitted to the instrument and a response, if any, will be displayed on the background window. To exit terminal mode, click the Quit button on the dialog box. 39 Downloading or Uploading a Sensor Calibration Curve Sensor calibration curves may be transferred between the PC and the instrument by using the Calibration Table menu. To download a curve (send it from the PC to the instrument), either select “Sensor Curve Download” from the shortcut bar or Operations>Sensor Curve>Download from the main menu. This will cause a file selection dialog box to appear as follows: From this screen, the desired calibration curve is selected. Cryomagnetics calibration curves have the file extension of .CRV. Lakeshore curves with the extension .340 may also be selected. Scientific Instruments .txt files may be downloaded by first selecting a file type of *.* and then selecting the desired calibration curve file. .CRV files are ASCII text files that may be edited by any text editor. After selecting the file and clicking on Open, the selected file will be read and the Edit Curve Header dialog box will appear. This box contains information extracted from the curve file header that can be modified, if desired, before the curve is downloaded. “Sensor Name” is any 15-character string and is only used to identify the sensor. Sensor type can be selected from a pull-down menu or entered directly. Note that different models of Cryomagnetics instruments support different types of sensors. Therefore, it is important to enter a sensor type that is supported by the specific product. If the instrument receives a sensor type that it does not support, the ‘Diode’ type is selected. The section titled “Input Configurations” gives complete information on sensor types. The Multiplier field is used to select the sign of the sensor’s temperature coefficient. A value of –1 selects a Negative-Temperature-Coefficient sensor while a value of 1 selects a Positive-Temperature-Coefficient. The Unit field selects the units used in the calibration curve. Choices are: Volts, Ohms or LogOhm. Checking the ‘Save as .crv’ will save the curve to disk as a Cryomagnetics .crv file. 40 Model 612 and 614 Temperature Monitors The sensor curve may be viewed as a graph by clicking the ‘Display Curve’ button. An example plot is shown here: After completing any desired changes in the “Edit Curve Header” dialog box, click ‘Accept’ to proceed. Then the, curve number dialog box will appear: A user calibration curve should be entered here. For the monitor, user curves are 1 through 4. 41 When ‘OK’ is selected, the sensor calibration curve will be downloaded to the instrument. During the transfer, curve data points will be displayed in the window’s main pane. Upon completion, the Download Complete dialog box will appear: Dismiss this dialog box to complete the download process. To upload a calibration curve, use the same procedure and select Upload. This will transfer a curve from the instrument to the PC. 42 Model 612 and 614 Temperature Monitors Using the Real-Time Strip Charts The real-time strip chart feature of the Utility Software lets the user continuously display any combination of input channels on the computer display. This function is initiated by selecting the View command on the Utility Software’s main toolbar, then selecting the desired channels to monitor. A strip chart will be displayed for each channel selected. The dialog box will show the channel’s Input Identifier, Name String and a chart of current temperature. The update rate of the chart is locked to the program’s Data Logging Interval. The section below details how to set this value. 43 Data Logging The Utility Software will perform data logging on all of the instruments input and control output channels. The result is a disk file in Comma-Separated-Value, or CSV format. This format is compatible with any data analysis or charting software including Microsoft Excel. To initiate data logging, select the Data Logging button from the Utility Software’s main menu. The Data Logging Setup dialog box will now appear. On this dialog box, check the desired channels and set an Interval value in Seconds. The minimum interval is 0.1 Second. When the Start button is clicked, a file selection dialog box will be shown. 44 Model 612 and 614 Temperature Monitors From this dialog box, enter a file name and select the directory where data logging results will be saved. As soon as the Save button is clicked, the software will begin continuous data logging to the specified file. While data logging is in progress, a dialog box will be displayed that allows the user to stop logging. When this Stop button is clicked, logging is stopped and the log file is closed. 45 CalGen Calibration Curve Generator. The feature is used to generate new calibration curves for Silicon diode or resistor sensors. This provides a method for obtaining higher accuracy temperature measurements without expensive sensor calibrations. Most Cryocon temperature controllers support CalGen directly on the instrument. However, the utility software package implements the same algorithm and can be used with virtually any instrument capable of measuring temperature. Curves can be generated from any user selected sensor calibration curve and are written to a specified internal user curve location. For diode sensors, the user may specify one, two or three data points. CalGen will generate the new curve based on fitting the input curve to the user specified points. Platinum or other resistor calibration curves require one or two data points. The generated curve will be a best fit of the input curve to the two specified input points. Since CalGen fits a sensor calibration curve to measured data, any errors in the instrument’s measurement electronics are also effectively canceled. CalGen Initial Setup To start the CalGen process, either select CalGen from the shortcut bar, or select Operations>CalGen from the main menu. This initiates the process of generating a new sensor curve. Using CalGen with Diode Sensors Options for generating diode calibration curves are: 1. One point near 300K. The portion of a diode Sensor curve above 30K is fit to a user-specified point near 300K. This is a two-point fit where the 30K point is taken from the existing calibration curve. The portion of the curve below 30K is unaffected. 2. Two points: 300K and 77K. These two user-specified points are taken to fit the diode curve region above 30K. The entire curve is offset to match the 77K point, then, the >30K region is fit to the two points. 3. Three points: 300K, 77K and 4.2K. Two points above 30K are fit as in the selection above. Then, a third point is used to fit a single point in the high-sensitivity region below 20K. 4. One point near 4.2K. This is a two-point fit where the 20K point is taken from the existing calibration curve. The portion of the curve above 20K is unaffected. Using CalGen with Resistor Sensors The calibration curve generation procedure for Platinum or other resistor sensors is the same as for the diode. However, these sensor curves are generated using two user specified points. Therefore, the selection of the number of points is not required. Example CalGen Procedure A complete procedure for calibrating a diode sensor at three points is shown here. Before the procedure can be started, the instrument must be connected and have a valid sensor connected. The CalGen procedure requires the user to stabalize the input temperature at three user-selected points. It will capture data at each of these points and then generate a new curve from that data. When a 3-point CalGen is started for a Silicon diode sensor, the reference curve must first be selected. This is the curve that will be rotated and shifted to fit the selected points. 46 Model 612 and 614 Temperature Monitors When the curve has been selected, the following dialog box will appear: The process requires the user to completely fill out this dialog box by selecting a temperature and then copying the voltage (or resistance) reading corresponding to that temperature from the instrument. Note that the Vapor Pressure button takes the user to a convenient calculator that computes the temperature of various cryogens from the current barometric pressure. Once the dialog box has been completed, click OK to proceed. To finish the process, a prompt will require the user to save the modified calibration curve to a file. 47 Instrument Calibration Calibration of the monitor requires the use of various voltage and resistance standards in order to generate calibration factors for the many measurement ranges available. Calibration is ‘Closed-Case’. There are no internal mechanical adjustments required. The monitor cannot be calibrated from the front panel. Calibration data is stored in the instrument’s non-volatile memory and is accessed only via the remote interfaces. Calibration of a measurement range is the simple process of generating an offset and gain value. However, since there are several input ranges available on each sensor input, the process can be time consuming. Caution: Any calibration procedure will require the adjustment of internal data that can significantly affect the accuracy of the instrument. Failure to completely follow the instructions in this chapter may result in degraded instrument performance. The Utility Software used in this procedure will first read all calibration data out of the instrument before any modifications. It is good practice to record these values for future reference and backup. Calibration Services When the instrument is due for calibration, contact Cryomagnetics for low-cost recalibration. Calibration Interval The monitor should be calibrated on a regular interval determined by the measurement accuracy requirements of your application. A 90-day interval is recommended for the most demanding applications, while a 1-year or 2-year interval may be adequate for less demanding applications. It is not recommended extending calibration intervals beyond 2 years. Whatever calibration interval you select, it is recommended that complete re-adjustment should always be performed at the calibration interval. This will increase your confidence that the instrument will remain within specification for the next calibration interval. This criterion for re-adjustment provides the best measure of the instrument’s long-term stability. Performance data measured using this method can easily be used to extend future calibration intervals. Minimum Required Equipment All calibrations require a computer with a LAN connection to the instrument. Additionally, reference standards are required for each input range as follows: • The Silicon Diode input range (Calibration Type I10UA and V10UA) requires voltage references of 0.5 and 1.5 Volts DC and a resistance standard of 100KΩ • The 100Ω Platinum range (Type R1MA) requires a 100Ω and a 10Ω resistor. • The 10,000Ω range (Type R10UA) requires 10KΩ and 1KΩ resistors. The test equipment recommended for complete calibration is a Fluke 5700A DMM calibrator. 48 The Basic Calibration Sequence You must first connect the monitor to a computer via the LAN interface and then run the Utility Software provided with the instrument. The Utility Software must be version 11.0.0 or higher. From the start-up menu of the Utility Software, click the Connect button in the bottom of the Short Cuts toolbar. The software will connect to the instrument and display the connection status below the button. To manually calibrate a range, select the desired range from the range type tabs and enter the desired Gain and Offset values in the boxes given and then, click the APPLY button. Gain is a unit-less gain factor that is scaled to a nominal value of 1.0. It is usually computed by: gain = (UT – LT) / (UM – LM) where: UT is the upper target and LT is the lower target. UM is the upper measurement and LM is the lower measurement. Gain values greater than 1.2 or less than 0.8 are rejected as out of range. Offset is in units of Volts or Ohms depending on the calibration type. Nominal value is 0.0. Positive or negative numbers are accepted. It is usually calculated by: Offset = UT - gain * UM Summary of Calibration Types Calibration data must be generated for each input channel by sequencing through the various calibration types on each channel. A summary of types is given here: Calibration Type Voltage Range Output Current SI DiodeV 0 – 2.2V N/A SI Diode I N/A 10μA 10μA constant-current source used with Silicon diode sensors. Description Voltage measurement for use with Silicon diode temperature sensors. 1mA AC 100mV, 1.25Hz 1.0mA 1mA range used with constant-voltage mode sensors. 100uA AC 100mV, 1.25Hz 100μA 100μA range used with constant-voltage mode sensors. 10uA AC 100mV, 1.25Hz 10μA 1mA DC 0-2.5VDC 1.0mA DC measurement of 100 Platinum RTD sensors. 100uA DC 0-2.5VDC 100μA DC measurement of 1K Ohm Platinum RTDs 10μA range used with constant-voltage mode sensors. Calibration of Silicon Diodes Silicon Diode sensors require the application of a precision 10μ A current followed by reading the voltagedrop across the device. Therefore, calibration of a diode requires two steps: 1) Calibration of the input voltage reading and 2) Calibration of the 10μA current source. Note that the voltage calibration must always be done first since the current source calibration requires a precision voltage reading. Diode Voltage Calibration To calibrate the diode voltage range, click on the SI Diode V tab and follow the sequence described above to send Gain and Offset values to the instrument. The upper target requires connection of a 1.9 Volt source. The actual value is between 1.0 Volts and 2.4 Volts. If you do not have a precision voltage source, you can use a 1.5 Volt battery by using a high precision volt meter to measure its actual voltage. The lower target requires connection of a 0.5 Volt source. The actual value is between zero Volts and 0.6 49 Volts. If you do not have a precision voltage source, you can short the input channel for zero volts. Constant-current Source Calibration Calibration of the constant-current source is performed by using the SI Diode I tab. On this screen, only an upper target value is required since the current-source only requires a gain term. The upper target requires connection of a 100KΩ resistor. The actual value should be within 10% of 100KΩ. Calibration of DC resistors Resistor sensors that use direct current excitation are calibrated by using the 1mA DC, 100uA DC and 10uA DC tabs. Resistors required for calibration are as follows: 50 1mA DC: Upper - 100Ω, Lower - 10Ω. 100uA DC: Upper 1,000Ω, Lower - 100Ω 10uA DC: Upper - 10,000Ω, Lower - 1,000Ω Remote Operation Remote Interface Configuration The monitor has two remote interfaces: The 10/100-BaseT Ethernet LAN and the RS-232. There are also two external options: IEEE-488.2 (GPIB) and USB. Connection to all of these interfaces is made on the rear panel of the instrument. For specifics about the connectors and cables required, refer to the section on Rear Panel Connections. Supported Ethernet Protocols HTTP: The monitor's HTTP server is used to implement the instrument's embedded web server. Up to five connections are supported simultaneously and connections are automatically closed after five minutes of inactivity. SMTP: The Simple Mail Transport Protocol is used to send E-mail from the monitor to a selected address. E-mail is used to report instrument status and is triggered by various user selected events. If sending email over the Internet is desired, the local area network connected to the monitor will have to have an active mail server. TIMEP: The Time Protocol allows a client to obtain the date and time from a host TIMEP server. If a time server is available on the Local Area Network, the monitor will periodically query it to update it’s internal real-time clock. TCP/IP: The Transmission Control Protocol / Internet Protocol provides reliable, flow-controlled, end-toend, communication between two connected devices. TCP operates even if packets are delayed, duplicated, lost, delivered out of order, or delivered with corrupted or truncated data. UDP: The User Datagram Protocol implemented on the monitor is similar to TCP but is connectionless. Since a connection does not need to be negotiated or maintained, UDP has a much lower overhead than TCP/IP. In the monitor, a TCP/IP port is available for communication using an ASCII command language. This is how the instrument interfaces some data acquisition software packages, including LabView™. Where the user is implementing custom software, UDP is recommended because of it's lower overhead. Ethernet Configuration Each device on an Ethernet Local Area Network must have a unique IP Address. This is similar to IEEE488 systems where each device required a unique ‘GPIB’ address. Further, the address assigned to the monitor must be within the range of the computers you want it to communicate with. The range is determined by the Subnet Mask. To connect to a LAN switch or hub, use a standard Category 5 patch cable. To connect directly to a PC, use a Category 5 crossover type patch cable. The monitor is shipped with a default IP address of 192.168.1.4 and Subnet Mask of 255.255.255.0. Using these settings, the instrument communicates with any computer or device that has an IP addresses in the range of 192.168.1.0 through 192.168.1.255. The user can configure the monitor to use any other IP address by going to the Network Configuration Menu. UDP Configuration UDP is a simple connection-less protocol that can be used to communicate with the instrument. The user binds a UDP socket and communicates with the instrument in a fashion similar to the older RS-232 style communications. Before you can bind a UDP socket, you will need to know the instrument's IP address and port number. Both the IP and port number may be obtained from the front panel of the instrument or by using the discovery function of the Utility Software. UDP uses a port that is the TCP port address plus one. The factory default is 5001. TCP/IP Data Socket Configuration TCP/IP is a connection orientated protocol that is more complex and has higher overhead than UDP. The user must bind a TCP/IP socket and negotiate a connection before communicating with an instrument. 51 Before you can bind a TCP/IP socket, you will need to know the instrument's IP address and port number. Both may be obtained from the front panel of the instrument or by using the discovery function of the Utility Software. The default TCP/IP port address is 5000. This can be changed from the front panel by going to the Network Configuration Menu. The monitor will handle up to five TCP/IP connections simultaneously. Connections will be automatically closed after 5 minutes of inactivity. Checking the TCP/IP connection with Hyperterminal Hyperterminal, or any other TCP/IP communications program can be easily used to test the TCP/IP connection. Run the program and configure it with the IP (default: 192.168.1.4) and TCP/IP port (Default: 5000) and it should be possible to type in basic commands. For example: *IDN? should return: Cryomagnetics,Model 612,204683,1.01A When working with the TCP/IP interface, it is often convenient to go to the Network Configuration Menu. The bottom two lines of this screen show the last line received and sent by the instrument. Web site configuration The monitor factory default settings are as follows: IP address: 192.168.1.4 Subnet Mask: 255.255.255.0 Gateway: 192.168.0.1 TCP Data Socket: 5000, UDP Data Socket: 5001 DHCP: OFF These settings are also entered into the monitor when the LAN Reset sequence is executed from the front panel. The instrument's embedded web site may be opened in any web browser by typing http://192.168.1.4 into the address bar, and the monitor’s Home Page should appear. Alternatively, if the network system has a DNS server, use the instrument's name instead of the IP address. The default name is: M24Cxxxx where xxxx is the last four digits of the instrument's serial number. From the monitor’s web page, configure the instrument to meet the network requirements. IEEE-488 (GPIB) Option Configuration The only configuration parameter for the optional GPIB interface is to set the address. This is done by using the System Functions Menu described above. Once the external GPIB interface is connected to the controller's LAN port, configuration is performed by the instrument. Note that each device on the GPIB interface must have a unique address. Set the instrument's address to any value between 1 and 31. The address is set to 12 when the unit is shipped from the factory. The GPIB interface does not use a termination character, or EOS. Rather, it uses the EOI hardware handshake method to signal the end of a line. Therefore, the host must be configured to talk to the instrument using EOI and no EOS. Primary Address: 1-31 Secondary Address: None Timeout 2S Terminate Read on EOS NO Set EOI with EOS on Writes YES EOS byte N/A Table 13: GPIB Host Setup Parameters 52 RS-232 Configuration The user can select RS-232 Baud Rates between 300 and 38,400. The factory default is 9600. The Baud Rate is changeable from the instrument's front panel by using the System Functions Menu. Other RS-232 communications parameters are fixed in the instrument. They are set as follows: Parity: None Bits: 8 Stop Bits: 1 Mode: Half Duplex The RS-232 interface uses a "New Line", or Line Feed character as a line termination. In the C programming language, this character is \n or hexadecimal 0xA. All strings sent to the instrument must be terminated by this character. The controller will always return the \r\n character sequence at the end of each line. Note: Some serial port software drivers allow the programmer to set a line termination character. This character is then appended to each string sent to the controller and stripped from returned strings. In this case, the \n (0xA) character should be selected. Checking the RS-232 connection with Hyperterminal Hyperterminal, or any other RS-232 communications program can be easily used to test the connection. Run the program and configure it with instrument's serial configuration in order to type in basic commands. For example: *IDN? should return: Cryomagnetics,Model 612,204683,1.01A When working with the RS-232 interface, it is convenient to go to the Network Configuration Menu. The bottom two lines of this screen show the last line received and sent by the instrument. USB option configuration The external USB option is automatically configured by the instrument when it is plugged into the RS-232 port. Your computer will see it as an extra COM port. Use it for communications just like any other RS-232 port. 53 Introduction Remote Programming Guide General Overview This brief is intended to assist the user interested in remote programming of the instrument. Since the language supports both simple and advanced functions, it may initially seem complex. However, the use of English language keywords and a tree-structured architecture make it easy to read and learn. Language Architecture ● The industry standard SCPI language defined by the IEEE-488.2 standard is used. Therefore, anyone with experience in test and measurement will find it familiar. ● Keywords used in commands are common English words, not cryptic acronyms. This makes command lines easy to read and understand, even for someone that is not familiar with the instrument. ● The SCPI is a 'tree structured' language where commands are divided into groups and associated commands into sub-groups. This architecture simplifies composing commands and improves readability. Purpose If your intent is to remotely program the instrument with fairly simple sequences, you can skip to the section titled “Commonly Used Commands”. This is a simple cheat-sheet format list of the commands that are most frequently used. If you are an advanced user with a familiarity of the SCPI programming language, the section titled “Remote Command Descriptions” is a complete reference to all commands. If you are not familiar with the SCPI language but need to perform advanced programming tasks, the SCPI is introduced in the next section. For all users, the section titled “Debugging Tips” is often helpful and the “Remote Command Tree” is a single page listing that shows the syntax of each command. 54 An Introduction to the SCPI Language SCPI is an acronym for Standard Commands for Programmable Instruments. Commonly called 'skippy', it is an ASCII-based instrument command language defined by the IEEE-488.2 specification and is commonly used by test and measurement instruments. SCPI commands are based on a hierarchical structure, also known as a tree system. In this system, associated commands are grouped together under a common node or root, thus forming subsystems. A portion the command tree for a Cryomagnetics instrument is shown here: INPut TEMPerature UNITs VARIance SLOPe ALARm NAMe SYSTem BEEP ADRS LOCKout LOOP SETPT RANGe RATe CONFig SAVE RESTore In the above, INPut and LOOP are root keywords whereas UNITs and RATe are second-level keywords. A colon ( : ) separates a command keyword from lower-level keyword. Command Format The format used to show commands is shown here: ,13XW{ $| %| &| '}$/$5P+,*+YDOXH! 1$0HQDPH The command language is case-insensitive, but commands are shown here as a mixture of upper and lower case letters. The upper-case letters indicate the abbreviated spelling for the command. For shorter program lines, send the abbreviated form. For better program readability, send the long form. For example, in the above statement, INP and INPUT are all acceptable. Braces ( { } ) enclose the parameter choices for a given command string. The braces are not sent as part of the command string. A vertical bar ( | ) separates multiple parameter choices for a given command string. Triangle brackets ( < > ) indicate that you must specify a numeric value for the enclosed parameter. Double-quote ( " ) marks must enclose string parameters. Commands are terminated using a semicolon ( ; ) character. The semicolon at the end of the line is assumed and is optional. The {}, |, <> and " characters are for the illustration of the command syntax and not part of the command syntax. Command Separators A colon ( : ) is used to separate a command keyword from a lower-level keyword. You must insert a blank space to separate a parameter from a command keyword. Compound Commands A semicolon ( ; ) is used as a separator character that separates commands within the same subsystem. For example, sending the following command string: ,13XW$81,7V.7(03HU" has the same effect as sending the following two commands: ,13XW$81,7V. ,13XW$7(03HU" 55 If multiple commands address different subsystems, the combination of a semicolon ( ; ) and a colon ( : ) are used. The semi-colon terminates the previous command and the colon indicates that the next command is in a different subsystem. For example: ,13XW$7(03HU"/2236(73W has the effect of sending the following two commands: ,13XW$7(03HU" /2236(73W Queries You can query the current value of most parameters by adding a question mark (?) to the command. For example, the following command set the setpoint on control loop 1 to 123.45: /2236(73W You can change it into a query that reads the setpoint by using the following: /2236(73W" The instrument's response will be a numeric string such as: 123.45. Compound queries are commonly used to save programming steps. For example, the query: /2236(73W"3*$LQ",*$LQ"'*$LQ" reports the loop 1 setpoint, P-gain, I-gain and D-gain. An example response is: Note that the response is also separated by semicolons. The representation of the decimal symbol for floating point numbers must be a period, '.', instead of comma, ',' as is customary used in some European countries. Command Terminators Commands must be terminated by an ASCII line-feed(\n) character. SCPI Common Commands The IEEE-488.2 SCPI standard defines a set of common commands that perform basic functions like reset, self-test and status reporting. Note that they are called common commands because they must be common to all SCPI compliant instruments, not because they are commonly used. Common commands always begin with an asterisk (*), are four to five characters in length and may include one or more parameters. Examples are: ,'1" &/6 23&" SCPI Parameter Types The SCPI language defines several different data formats to be used in program messages and response messages. Numeric Parameters: Commands that require numeric parameters will accept all commonly used decimal representations of numbers including optional signs, decimal points and scientific notation. Enumeration Parameters: These are used to set values that have a limited number of choices. Query responses will always return an enumeration parameter in upper-case letters. Some examples of commands with enumeration parameters are: ,13XW{$|%|&|'}81,7V{.|&|)|6} /223{ |}7<3H{ 2))|0$1|3,'|7$%/(|5$033} 56 String Parameters: String parameters can be up to 15 characters in length and can contain any ASCII characters excluding the double-quote ( " ). String parameters must be enclosed in double-quotes ( " ). For example: &21)LJ1$0H&ROG3ODWH Commonly Used Commands. A complete summary of remote commands is given in the User's Manual chapter titled "Remote Command Summary". The manual also has complete descriptions of all remote commands. This section is intended to show a few of the more commonly used commands. NOTE: Remote commands are not case sensitive. Function Command Comment Instrument Identification Read the instrument identification string *idn? Returns the instrument identification string in IEEE-488.2 format. For example:"Cryomagnetics,Model 612,204683,2.41" identifies the manufacturer followed by the model name, serial number and firmware revision code. Input Channel Commands Parameter for the input is A, B, C or D corresponding to inputs A, B, C or D. Read the temperature on input channel B input? b Temperature is returned in the current display units. Format is a numeric string. For example: 123.4567 Set the temperature units on input channel A to Kelvin. input a:units k Choices are K- Kelvin, C- Celsius, F- Fahrenheit and S- native sensor units (Volts or Ohms). Read the temperature units on channel B input b:units? Return is: K, C, F or S. Table 14: Commonly Used Remote Commands Debugging Tips 1. To view the last command that the instrument received and the last response it generated, press the System key and then select the Network Configuration Menu. The last two lines of this menu show > and < characters. These two lines show the last command received by the instrument and the last response generated. 2. Some commands require the instrument to write to non-volatile flash type memory, which can be time consuming. In order to avoid overrunning the instrument use compound commands that return a value, thus indicating that command processing is complete. For example: INPUT A:UNITS K;UNITS? will respond with the input units only after the command has completed. Another example: LOOP 1:SETPOINT 1234.5;:*OPC? Here, the operation complete command :*OPC? will return a '1' when command processing is complete. 3. It is often easiest to test commands by using the Utility Software. Run the program, connect to the instrument and use the Interact mode to send commands and view the response. Alternatively, any communications program like Windows Hyperterminal can be used to interact with the instrument via the LAN or serial ports. 4. For ease of software development, keywords in all SCPI commands may be shortened. The short form of a keyword is the first four characters of the word, except if the last character is a vowel. If so, the truncated form is the first three characters of the word. Some examples are: inp for input, syst for system alar for alarm etc. 57 SCPI Status Registers The Instrument Status Register The Instrument Status Register (ISR) is queried using the SYSTEM:ISR? command. The ISR is commonly used to generate a service request when various status conditions occur. In this case, the ISR is masked with the Instrument Status Enable (ISE) register. The ISR is defined as follows: ISR Bit7 Bit6 Bit5 Bit4 Bit3 Bit2 Alarm Bit1 Bit0 SFB SFA Where: Bit7 – Alarm: Indicates that an alarm condition is asserted. Use the ALARM commands to query individual alarms. Bit1 to Bit0 – SFx: Indicates that a sensor fault condition is asserted on an input channel. Use the INPUT commands to query the input channels. The Instrument Status Enable Register The Instrument Status Enable (ISE) Register is a mask register. It is logically “anded” with the contents of the ISR in order to set the Instrument Event (IE) bit in the Status Byte (STB) register. This can cause a service request to occur. Bits in the ISE correspond to the bits in the ISR defined above. The Standard Event Register The Standard Event Register (ESR) is defined by the SCPI to identify various standard events and error conditions. It is queried using the Common Command *ESR? This register is often used to generate an interrupt packet, or service request when various I/O errors occur. Bits in the ESR are defined as follows: ESR Bit7 OPC Bit6 Bit5 Bit4 Bit3 Bit2 QE DE EE CE Bit1 Bit0 PWR Where: Bit7 – OPC: Indicates Operation Complete. Bit5 – QE: Indicates a Query Error. This bit is set when a syntax error has occurred on a remote query. It is often used for debugging. Bit4 – DE: Indicates a Device Error. Bit3 – EE: Indicates an Execution Error. This bit is set when a valid command was received, but could not be executed. An example is attempting to edit a factory supplied calibration table. Bit2 – CE: Indicates a Command Error. This bit is set when a syntax error was detected in a remote command. Bit0 – PWR: Indicates power is on. 58 The Standard Event Enable Register The Standard Event Enable Register (ESE) is defined by the SCPI as a mask register for the ESR defined above. It is set and queried using the Common Command *ESE. Bits in this register map to the bits of the ESR. The logical AND of the ESR and ESE registers sets the Standard Event register in the Status Byte (STB). The Status Byte The Status Byte (STB) is defined by the SCPI and is used to collect individual status bits from the ESE and the ISR as well as to identify that the instrument has a message for the host in it’s output queue. It is queried using the Common Command *STB?. Bits are defined as follows: STB Bit7 Bit6 Bit5 Bit4 Bit3 RQS SE MAV IE Bit2 Bit1 Bit0 Where: Bit6 – RQS: Request for Service. Bit5 – SE: Standard Event. This bit is set as the logical ‘AND’ of the ESR and ESE registers. Bit4 – MAV: Message Available Bit3 – IE: Instrument Event. This bit is set as the logical ‘AND’ of the ISR and ISE registers. The Status Byte Register The Status Enable Register (SRE) is defined by the mask register for the STB. It is set and queried using the Common Commands *SRE. 59 Remote Command Tree SYSTEM commands SYSTem:ADRes <address> SYSTem:AMBient? SYSTem:BAUD {9600 | 19200 | 38400 | 57200} SYSTem:BEEP <seconds> SYSTem:DATe "mm/dd/yyyy" SYSTem:DISTc {0.5 | 1 | 2 | 4 | 8 | 16 | 32 | 64} SYSTem:DRES {FULL | 1 | 2 | 3} SYSTem:FWREV? SYSTem:HOMe SYSTem:HWRev? SYSTem:RESeed SYSTem:NAME "name" SYSTem:NVSave SYSTem:RESeed SYSTem:TIMe "hh:mm:ss" Input Commands INPut? {A | ... | H} or INPut {A | ... | H}:TEMPerature? INPut {A | ... | H}:UNITs {K | C | F | S} INPut {A | ... | H}:NAMe “Input Channel Name” INPut {A | ... | H}:SENPr? INPut {A | ... | H}::BRANge {Auto | 1.0mA | 100uA | 10uA} INPut {A | ... | H}::SENSor <ix> INPut {A | ... | H}:ALARm? INPut { A | ... | H }:ALARm:HIGHest <setpt> INPut { A | ... | H }:ALARm:LOWest <setpt> INPut { A | ... | H }:ALARm:HIENa { YES | NO } INPut { A | ... | H }:ALARm:LOENa { YES | NO } INPut { A | ... | H }:ALARm:Clear INPut { A | ... | H }:ALARm:LTEna { YES | NO } INPut { A | ... | H }:ALARm:AUDio { YES | NO } INPut { A | ... | H }:MINimum? INPut { A | ... | H }:MAXimum? INPut { A | ... | H }:VARiance? INPut { A | ... | H }:SLOpe? INPut { A | ... | H }:OFFSet? INPut { A | ... | H }:STAts:TIMe? INPut { A | ... | H }:STAts:RESet INPut { A | ... | H }:TCOFfset INPut { A | ... | H }:TCGAin Sensor Calibration Curve Commands CALcur SENSor <index>:NAMe name string" SENSor <index>:NENTry? SENSor <index>:UNITs {VOLTS | OHMS | LOGOHM} SENSor <index>: TYPe { DIODE | ACR | PTC100 | PTC1K | NTC10UA } SENSor <index>:MULTiply <multiplier> Data Logging Commands 60 DLOG:RUN {OFF | ON} DLOG:TIMe <Seconds> DLOG:COUNt? DLOG:READ? DLOG:RESET DLOG:CLEAR Relay Commands RELays? {1 | 2} RELays {1 | 2} :SOURce {A | B | C | D} RELays {1 | 2} :MODe {auto | control | on | off} RELays {1 | 2} :HIGHest <setpt> RELays {1 | 2} :LOWEST <setpt> RELays {1 | 2} : <deadband> RELays {1 | 2} :HIENa { YES | NO } RELays {1 | 2} :LOENa { YES | NO } Network Commands NETWork:IPADdress NETWork:MACaddress NETWork:NAME "name" NETWork:DHCP {ON | OFF} Mail Commands MAIL {A | ... | H} :ADDR “IPA” MAIL {A | ... | H}:FROM ”from e-mail address” MAIL {A | ... | H}:DEST “to e-mail address” MAIL {A | ... | H}:PORT <port number> MAIL {A | ... | H}:STATE {ON | OFF} IEEE Common Commands *CLS *ESE *ESR *OPC *IDN? *RST *SRE *STB 61 Remote Command Descriptions IEEE Common Commands &/6 The *CLS common command clears the status data structures, including the device error queue and the MAV (Message Available) bit. (6( The *ESE command sets the Standard Event Status Enable (ESE) Register bits. The ESE Register contains a bit mask for the bits to be enabled in the Standard Event Status (SEV) Register. A one in the ESE register will enable the corresponding bit in the SEV register. A zero will disable the bit. The *ESE? Query returns the current contents of the ESE register. (65 The *ESR query returns the contents of the Standard Event (SEV) status register. 23& The *OPC command will cause the instrument to set the operation complete bit in the Standard Event (SEV) status register when all pending device operations have finished. The *OPC Query places an ASCII ‘1’ in the output queue when all pending device operations have completed. ,'1" The *IDN? Query will cause the instrument to identify itself. The Model 18C will return the following string: Cryomagnetics, Model 612,<serial number>,<firmware revision> Where: <serial number> is the unit's serial number and <firmware revision> is the revision level of the unit's firmware 567 Reset the instrument. This will cause a hardware reset in the monitor. The reset sequence will take about 15 seconds to complete. During that time, the instrument will not be accessible over any remote interface. The *RST command sets the monitor to it’s last power-up default setting. 65( The *SRE command sets the Status Byte Enable (SRE) Register bits. The SRE Register contains a bit mask for the bits to be enabled in the Status Byte (STB) Register. A one in the SRE register will enable the corresponding bit in the STB register. A zero will disable the bit. The *SRE? Query returns the current contents of the SRE register. 67%" The *STB query returns the contents of the Status Byte Register. 62 System Commands. System commands are a group of commands associated with the overall status and configuration of the instrument rather than a specific internal subsystem. 6<67HP$'5HVDGGUHVV! Sets and queries the address that the IEEE-488.2 (GPIB) remote interface will use. The address is a numeric value between 1 and 31 with a factory default of 12. The addresses assigned to instruments must be unique on each GPIB bus structure. This command has no effect on other interfaces. 6<67HP$0%LHQW" Queries the internal reference junction temperature. Value reported as a decimal number in units of Celius. 6<67HP%$8'{9600 | 19200 | 38400 | 57200} Sets or queries the RS 232 Baud rate. 6<67HP%((3VHFRQGV! Asserts the audible alarm for a specified number of seconds. Command only, no query. 6<67HP'$7HPPGG\\\\ Sets or queries the instrument's date. Date is in string format and is surrounded by doublequotes. Format is mm/dd/yyyy for month / day / year. 6<67HP',67F{|||||||} Set or query the display filter time constant. The display filter is time-constant filter that is applied to all reported or displayed temperature data. Available time constants are 0.5, 1, 2, 4, 8, 16, 32 or 64 Seconds. 6<67HP'5(6{)8//|||} Sets or queries the instrument's display resolution. Choices are: ● FULL: Display temperature with the maximum possible resolution. ● 1, 2 or 3: Display will display the specified number of digits to the right of the decimal point. NOTE: This command only sets the number of digits displayed on the front panel display. It does NOT affect the internal accuracy of the instrument or the format of measurements reported on the remote interfaces. The main use for this command is to eliminate the flicker in low order digits when the instrument is used in a noisy environment. 6<67HP):5(9" Queries the instrument’s firmware revision level. 6<67HP+20H Causes the front panel display to go to the Operate Screen. 6<67HP+:5HY" Queries the instrument’s hardware revision level. 6<67(01$0(QDPH The controller contains a unit name string that may be set or queried using this command. This can be used to assign a descriptive name to the instrument. 6<67HP196DYH Save NV RAM to Flash. This saves the entire instrument configuration to flash memory so that it will be restored on the next power-up. Generally only used in environments where AC power is not toggled from the front panel. This includes remote and rack-mount applications. 63 6<67HP5(6HHG Re-seeds the input channel’s averaging filter, allowing the reading to settle significantly faster. The display filter may have filter time-constants that are very long. The RESEED command inserts the current instantaneous temperature value into the filter history, thereby allowing it to settle rapidly. Note: The RESEED command is useful in systems where a computer is waiting for a reading to settle. Issuing the RESEED command will reduce the required settling time of the reading. 6<67HP7,0HKKPPVV Sets or queries the instrument's time. Time is in string format and is surrounded by doublequotes. Format is hh:mm:ss for hour:mm:ss. Twenty-four hour format is used. Input Commands The INPUT group of commands are associated with the configuration and status of the four input channels. Parameter references to the input channels may be: ● Numeric ranging in value from zero to seven. ● Channel ID tags including CHA or CHB. ● Alphabetic including A or B. ,13XW"{A | ... | H} or ,13XW{A | ... | H}7(03HUDWXUH" The INPUT query reports the current temperature reading on any of the input channels. Temperature is filtered by the display time constant filter and reported in display units. Query only. ,13XW{A | ... | H}81,7V{.|&|)|6} Sets or queries the display units of temperature used by the specified input channel. Units may be K for Kelvin, C for Celsius, F for Fahrenheit or S for primitive sensor units. In the case of sensor units, the instrument will determine if the actual units are Volts or Ohms based on the actual sensor type. ,13XW{A | ...| H}1$0H1DPH6WULQJ Sets or queries the name string for the selected input channel. The name string can be up to 15 ASCII characters. The string is used to name the input channel in order to clarify it's use. ,13XW{A | ...| H}%5$1JH{Auto | 1.0mA | 100uA | 10uA} Sets or queries the resistance bridge excitation range. This is a range-hold function. Normally, this is set to auto so that the instrument will autorange excitation. For special applications, the resistance bridge may be set to a specific excitation range. ,13XW{A | ...| H}6(13U" The INPUT:SENPR query reports the reading on a selected input channel. For diode sensors, the reading is in Volts while resistor sensors are reported in Ohms. The reading is not filtered by the display time-constant filter. However, the synchronous input filter has been applied. Query only. ,13XW{A | ...| H}6(16RUL[! Sets or queries the sensor index number. <ix>, is taken from Appendix A. 64 ,13XW{A | ... | H}$/$5P" Queries the alarm status of the specified input channel. Status is a two character string where: -SF HI LO indicates that no alarms are asserted indicates a Sensor Fault condition. indicates a high temperature alarm indicates a low temperature alarm. There is a 0.25K hysteresis in the assertion of a high or low temperature alarm condition. The user selectable display time constant filter is applied to input channel temperature data before alarm conditions are tested. ,13XW{A | ... | H}$/$5P+,*+HVWVHWSW! Sets or queries the temperature setting of the high temperature alarm for the specified input channel. When this temperature is exceeded, an enabled high temperature alarm condition will be asserted. Temperature is assumed to be in the display units of the selected input channel. There is a 0.25K hysteresis in the assertion of a high or low temperature alarm condition. <setpt> is the alarm setpoint temperature. ,13XW{A | ... | H}$/$5P/2:(VWVHWSW! Sets or queries the temperature setting of the low temperature alarm for the specified input channel. When the input channel temperature is below this, an enabled low temperature alarm condition will be asserted. Temperature is assumed to be in the display units of the selected input channel. There is a 0.25K hysteresis in the assertion of a high or low temperature alarm condition. <setpt> is the alarm setpoint temperature. ,13XW{A | ... | H}$/$5P+,(1D{ <(6|12} Sets or queries the high temperature alarm enable for the specified input channel. An alarm must be enabled before it can be asserted. ,13XW{A | ... | H}$/$5P/2(1D{ <(6|12} Sets or queries the low temperature alarm enable for the specified input channel. An alarm must be enabled before it can be asserted. ,13XW{A | ... | H}$/$5P/7(1D{ <(6|12} Sets or queries the latched alarm enable mode. When an alarm is latched, it can be cleared by using the CLEar command. ,13XW{A | ... | H}$/$5P&/(DU Clears any latched alarm on the selected input channel. ,13XW{A | ... | H}$/$5P$8'LR{ <(6|12} Sets or queries the audio alarm enable. When enabled, an audio alarm will sound whenever an alarm condition is asserted. ,13XW{A | ... | H}0,1LPXP" Queries the minimum temperature that has occurred on an input channel since the STATS:RESET command was issued. ,13XW{A | ... | H}0$;LPXP" Queries the maximum temperature that has occurred on an input channel since the STATS:RESET command was issued. ,13XW{A | ... | H}9$5LDQFH" Queries the temperature variance that has occurred on an input channel since the STATS:RESET command was issued. Variance is calculated as the Standard Deviation squared. ,13XW{A | ... | H}6/2SH" Queries the input channel statistics. SLOPE is the slope of the best fit straight line passing through all temperature samples that have been collected since the STATS:RESET command 65 was issued. SLOPE is in units of the input channel display per Minute. 66 ,13XW{A | ... | H}2))6HW" Queries the input channel statistics. OFFSET is the offset of the best fit straight line passing through all temperature samples that have been collected since the STATS:RESET command was issued. OFFSET is in units of the input channel display. ,13XW{A | ... | H}67$WV7,0H" Queries the time duration over which input channel statistics have been accumulated. Time is reset by issuing the STAt:RESet command. Query only. ,13XW{A | ... | H}67$WV5(6HW Resets the accumulation of input channel statistical data. Command only affects the selected input channel. ,13XW{A | ... | H}7&2)IVHWRIIVHW! Sets or queries the offset value for thermocouple inputs. <offset> is the decimal value of offset and is in units of Kelvin. Refer to the section on Using Thermocouple Sensors for more information. ,13XW{A | ... | H}7&*$LQJDLQ! Sets or queries the gain value for thermocouple inputs. <gain> is the decimal value of the gain applied to thermocouple readings and is in units of volts per volts. Refer to the section on Using Thermocouple Sensors for more information. Relay Commands The relay subsystem includes the two auxiliary relays in the monitor. Using the RELAYS commands, these relays are independently configured to assert or clear based on the status of any of the four sensor input channels. Relay outputs are dry-contact and are available on the rear panel of the instrument. The user selectable display time constant filter is applied to input channel temperature data before relay conditions are tested. The user selectable relay deadband is also applied. 5(/D\V"{1|} Relay Status Query. The two auxiliary relays available in the monitor are addressed as 0 and 1. The RELAYS command can be used to query the status of each relay where: -Relay is in Auto mode and is clear. Hi Relay is asserted by a high temperature condition. Lo Relay is asserted by a low temperature condition. ON Relay is in manual mode and is asserted. OFF Relay is in manual mode and is clear. 5(/D\V{1 | 2} 6285FH{A | ... | H} Relay Input Source. Sets or queries the source input channel for a specified relay. 5(/D\V{1 | 2} +,*+HVWVHWSW! Relay High setpoint. Sets or queries the temperature setting of the high temperature setpoint for the specified relay. Parameter <setpt> is floating-point numeric and is in units of the controlling input channel. 5(/D\V{1 | 2} 02'H{AUTo|21|2))} Set or query the relay mode. Modes are: Auto Relay is controlled by enabled high and low setpoints. ON Relay is in manual mode and is asserted. OFF Relay is in manual mode and is clear. Control Relay is asserted whenever the controller is in Control mode. 5(/D\V{1 | 2} /2:HVWVHWSW! Relay Low setpoint. Sets or queries the temperature setting of the low temperature setpoint for a specified relay. Parameter <setpt> is floating-point numeric and is in units of the controlling input channel. 67 5(/D\V{1 | 2} +,(1D{ <(6|12} Relay High Enable. Sets or queries the high temperature enable for the specified relay. 5(/D\V{1 | 2} /2(1D{ <(6|12} Relay Low Enable. Sets or queries the low temperature enable for the specified relay. 5(/D\V{1 | 2} GHDGEDQG! Sets or queries the dead-band parameter. This controls the amount of hysteresis that is applied before a relay is asserted or cleared. Parameter <dead-band> is floating-point numeric and is in units of the controlling input channel. Sensor Calibration Curve Commands The CALCUR commands are used to transfer sensor calibration curves between the instrument and the host controller. Curves are referenced by an index number. In the monitor, there are eight user curves numbered 1 through 8. The CALCUR data block consists of many lines of ASCII text. The format is the same as the file format for user calibration curves, which is detailed in the section User Calibration Curve File Format. &$/&85LQGH[! Sets or queries sensor calibration curve data. Uses a fragmented message protocol to sense many lines of ASCII text to the instrument. Note: It is much easier to use the Utility Software to send and receive sensor calibration curves. Sensor commands Sensor commands are used to set and query information about the sensors installed in the controller. Both factory and user installed sensors can be queried, but only user sensors may be edited. NOTE: Factory installed sensors are indexed from 0 to 61. User installed sensors have index values from 61 to 68 corresponding to user curves 1 through 8. For additional information, refer to Appendix A. 6(16RULQGH[!QDPH1DPH6WULQJ Sets and queries the name string of the user-installed sensor at index <index>. The name string can be up to 15 ASCII characters. 6(16RULQGH[!1(17U\" Queries the number of entries in the user-installed sensor at index <index>. Response is a decimal integer ranging from zero to 200. 6(16RULQGH[!81,7V{92/7| /2*2+0 | OHMS} Sets or queries the units of a user installed calibration curve at <index>. For information on the curve units, refer to the User Calibration Curve File Format section. 6(16RULQGH[! 7<3H{',2'(| $&5 | PTC100 | PTC1K | NTC10UA} Sets or queries the type of sensor at <index>. For more information on sensor types, please refer to the Input Configurations section. Index is 0 through 7. 6(16RULQGH[!08/7LSO\PXOWLSOLHU! Sets or queries the multiplier field of a user installed calibration curve at <index>. For information on the multiplier, refer to the User Calibration Curve File Format section. 68 Network Commands The following commands are used to configure the monitor's Ethernet interface. 1(7:RUN,3$'GUHVV,3$ Sets or queries the instrument's IP address. The address is expressed as an ASCII string, so the input parameter must be enclosed in quotes. For example, the default IP address parameter is “192.168.1.4”. 1(7:RUN0$&$'GUHVV" Queries the instrument's MAC address. The address is returned as an ASCII string. Cryomagnetics MAC addresses range from 00:50:C2:6F:40:00 to 00:50:C2:6F:4f:ff. They cannot be changed by the user. 1(7:RUN1$0(QDPH The controller contains a unit name string that may be set or queried using this command. This can be used to assign a descriptive name to the instrument. This command is the same as the SYSTem:NAME command. 1(7:RUN'+&3 {ON | OFF} Set or query DHCP enable. Changes do not take effect until the next power cycle. Mail Commands The monitor can send e-mail over the Ethernet port when an alarm condition is asserted on an enabled input channel. The following remote commands are used to configure e-mail. However, it is much easier to configure e-mail using the instrument's embedded web server. MAIL {A | ... | H}:ADDR “IPA” Set or query the e-mail server IP address. Parameter format is an ASCII string and must be enclosed in quotation marks. For example: “192.168.0.1”. MAIL {A | ... | H}:FROM ”from e-mail address” Set or query the 'from' e-mail address. Parameter is an ASCII String. For example: “[email protected]”. MAIL {A | ... | H}:DEST “to e-mail address” Set or query the 'from' e-mail address. Parameter is an ASCII String. For example: “[email protected]”. MAIL {A | ... | H}:PORT <port number> Set or query the e-mail port. Parameter is integer and default is 25. MAIL {A | ... | H}:STATE {ON | OFF} Set or query the input channel e-mail send enables. If a channel is enabled, e-mail will be sent when an alarm condition is asserted on the selected input channel. 69 Data Logging Commands '/2*67$7H{21_2))} Turns the data logging function ON or OFF. Equivalent to Start / STOP. '/2*,17HUYDO6HFRQGV! Sets the data logging time interval in seconds. '/2*&281W" Queries the number of entries in the log buffer. '/2*" '/2*5($'" Reads the entire contents of the log buffer. Each record is sent on a single line. Format is: <#>, MM/DD/YYYY, HR,MN,SC, ChA, CHB, ChC,ChD where: <#> is the record number. MM/DD/YYYY is the date in Month, Day, Year format. HR,MN,SC is the time in Hour, Minute, Second format. Lines end with a <CR><LF> sequence. End of transmission is indicated by a line that only contains a semi-colon. '/2*5(6(W Sets the logging record number to zero. '/2*&/($U Clears the data logging buffer. 70 Code snippet in C++ The following code opens a Cryomagnetics instrument at address 192.168.1.4 on the Local Area Network. It is written in Microsoft Visual C++ and uses the eZNET LAN library provided on the the Utility CD. ([DPSOH(WKHUQHW/$1SURJUDPXVLQJ& 7&3,3GHFODUDWLRQV LQFOXGH”7&3,3GUYK” 7&3,3GUY/$1'HILQHJOREDO/$1REMHFW FKDU,3$>@ ””,QVWUXPHQWV,3DGGUHVVRQWKH/$1 FKDUWHPSVWU>@WHPSRUDU\FKDUDFWHUVWULQJ 2SHQWKHLQVWUXPHQW ,I/$1RSHQ,3${ FDQ WFRQQHFW /$1FORVH WKURZ”&DQ WWDONWRLQVWUXPHQW” } UHDGWKH,'1VWULQJ /$1,2”,'1"”WHPSVWU SULQWI”,'1LVV?Q”WHPSVWU3ULQW,'1 UHDGWKH0$&DGGUHVV /$1,2”QHWPDF"”WHPSVWU SULQWI”0$&LVV?Q”WHPSVWU 6WDUWWHPSHUDWXUHFRQWURO /$1,2”FRQWURO” 6WRSWHPSHUDWXUHFRQWURO /$1,2”VWRS” 5HDGFKDQQHO%LQSXW /$1,2”LQSXW"%”WHPSVWU SULQWI”&KDQQHO%WHPSHUDWXUHLVV?Q”WHPSVWU VHQGFRPSRXQGFRPPDQGWRLQSXWFKDQQHO$DQGZDLWIRULWWRILQLVK /$1,2”,1387$81,766(162523&"”WHPSVWU FORVHWKHLQVWUXPHQW /$1FORVH 71 EU Declaration of Conformity According to ISO/IEC Guide 22 and EN 45014 Product Category: Process Control Equipment Product Type: Temperature Measuring System Model Numbers: Model 612 and Model 614 Manufacturer's Name: Cryocon, Inc. Manufacturer's Address: P. O. Box 7012 Rancho Santa Fe, CA 92067 Tel: (858) 756- 3900, Fax: 858. 759. 3515 The before mentioned products comply with the following EU directives: 89/336/EEC, "Council Directive of 3 May 1989 on the approximation of the laws of the Member States relating to electromagnetic compatibility" 73/23/EEC, "Council Directive of 19 February 1973 on the harmonization of the laws of Member States relating to electrical equipment designed for use within certain voltage limits". The compliance of the above mentioned product with the Directives and with the following essential requirements is hereby confirmed: Emissions EN 55011,1998 Immunity EN 50082-1, 1997 Safety EN 61010, 1994 A2: May 96 The technical files and other documentation are on file with Mr. Guy Covert, President and CEO. As the manufacturer we declare under our sole responsibility that the above mentioned products comply with the above named directives. _________________________________________ Guy D. Covert July 15, 2011 72 Appendix A: Installed Sensor Curves Factory Installed Curves The following is a list of factory-installed sensors and the corresponding sensor index. Sensor # Name 0 None Description No Sensor. Used to turn the selected input channel off. Cryocon S700 series Silicon diode. Range: 1.4 to 500K. 10μA constant current excitation. 1 Cryocon S900 2 LS DT-670 Lakeshore DT-670 series Silicon diode, Curve 11. Range: 1.4 to 500K. 10μA constant current excitation. 3 LS DT-470 Lakeshore DT-470 series Silicon diode, Curve 10. Range: 1.4 to 500K. 10μA constant current excitation. 4 CD-12A 5 SI 410 Diode 20 Pt100 385 DIN43760 standard 100Ω Platinum RTD. Range: 23 to 873K, 1mA excitation. 21 Pt1K 385 1000Ω at 0°C Platinum RTD using DIN43760 standard calibration curve. Range: 23 to 1023K, 100μA excitation. 22 Pt10K 385 10KΩ at 0°C Platinum RTD. Temperature coefficient 0.00385, Range: 23 to 873K, 10μA excitation. 23 RhFe 27, 1mA 31 SI RO-105 Scientific Instruments Inc. RO-105 Ruthenium Oxide sensor. Temperature range is: 2 to 273K. Use with the NTC10uA input configuration only. 32 SI RO-600 Scientific Instruments Inc. RO-600 Ruthenium-Oxide sensor with constantvoltage AC excitation. Temperature range is: <500mK to 40K. bias. 33 Cryocon R500 Cryocon R500 Ruthenium-Oxide sensor with constant-voltage AC excitation. Temperature range is: <500mK to 40K. 34 Cryocon R400 Cryocon R400 Ruthenium-Oxide sensor. Temperature range is: 2 to 273K. Use with the NTC10uA input configuration only. 45 TC Type K Thermocouple, Type K. Range: 3.2 to 1643K 46 TC Type E Thermocouple, Type E. Range: 3.2 to 1273K 47 TC Type T Thermocouple, Type T. Range: 3.2 to 673K 48 TC AuFe .07% 0 None Cryo Industries CD-12A Silicon diode. Range: 1.4 to 500K. 10μA constant current excitation. Scientific Instruments, Inc. 410 diode Curve. Range: 1.5 to 450K. 10μA excitation. Rhodium-Iron. 27Ω at 0°C. 1mA DC excitation. 1.5 to 873K Chromel-AuFe 7% thermocouple. Range: 3 to 610K No Sensor. Used to turn the selected input channel off. The SENSor remote commands are used to query and edit sensors installed in the controller. For example, the command: INPUT B SENSor 34 would set input B to use the R400 sensor. INPUT A: SENSor 1 would set input A to use the S900 diode. INPUT A: SENSor 0 would turn input A off by setting the sensor to ‘none’. SENSor 1:NAME? Returns the name string at index 1. Factory installed sensors may not be edited by using these commands. 73 User Installed Sensor Curves The user may install up to eight custom sensors. This table shows the sensor index and default name of the user curves: User Curve Sensor # 0 61 User Sensor 1 1 62 User Sensor 2 2 63 User Sensor 3 3 64 User Sensor 4 4 65 User Sensor 5 5 66 User Sensor 6 6 67 User Sensor 7 7 68 User Sensor 8 Default Name Using the above table, the SENSor commands can be used to address the user curves. For example: INPUT B SENSor 62 assigns input B to user sensor #2. SENSor 64:NAME? Returns the name string of user sensor 4 SENSor 63:TYPE ACR sets the type of user sensor #3 to ACR. NOTE: Factory installed sensors are indexed from 0 to 60. User installed sensors have index values from 61 to 68 corresponding to user curves 1 through 8. 74 Sensor Curves on CD The following sensors are available on the CD supplied: File Description Cryocon S700 Cryocon S700 series Silicon diode. Range: 1.4 to 500K. 10μA constant current excitation. CryocalD3.crv Cryocal D3 Silicon diode. Range: 1.5 to 300K SI410.crv Scientific Instruments, Inc. SI-410 Silicon diode. Range: 1.5 to 450K Curve10.crv Lakeshore Curve 10 Silicon diode curve for DT-470 series diodes. Range: 1.4 to 495K. Curve11.crv Lakeshore Curve 10 Silicon diode curve for DT-670 series diodes. Range: 1.4 to 500K. PT100385.crv Cryocon CP-100, DIN43760 or IEC751 standard Platinum RTD, 100Ω at 0°C. Range: 23 to 1020K PT1K385.crv DIN43760 or IEC751 standard Platinum RTD, 1000Ω at 0°C. Range: 23 to 1020K PT1003902.crv Platinum RTD, 100Ω at 0°C Temperature coefficient 0.003902 Ω/C. Range: 73K to 833K. PT1K375.crv Platinum RTD, 1000Ω at 0°C Temperature coefficient 0.00375 Ω/C. Range: 73K to 833K. aufe07cr.crv Chromel-AuFe 7% thermocouple. Range: 3 to 610K TCTypeE.crv Thermocouple, Type E. Range: 3.2 to 1273K TCTypeK.crv Thermocouple, Type K. Range: 3.2 to 1643K TCTypeT.crv Thermocouple, Type T. Range: 3.2 to 673K CX1030E1.crv Cernox™ CX1030 example curve. Range: 4 to 325K 75 User Calibration Curve File Format Sensor calibration curves may be sent to any Cryomagnetics instrument using a properly formatted text file. This file has the extension .crv. It consists of a header block, lines of curve data and is terminated by a single semicolon (;) character. The header consists of four lines as follows: Sensor Name: Sensor name string Sensor Type: Enumeration Multiplier: Signed numeric Units: Units of calibration curve: {OHMS | VOLTS | LOGOHM} The Sensor Name string can be up to 15 characters and is used to identify the individual sensor curve. When downloaded to a Cryomagnetics instrument, this name appears in the sensor selection menu of the embedded web server and will appear on all sensor selection fields on the front panel. The Sensor Type Enumeration identifies the required input configuration of the input channel. For the monitor, selections are: DIODE, PTC100, PTC1K, NTC10uA and ACR. These configurations are described in the section titled Supported Sensor Configurations. The Multiplier field is a signed, decimal number that identifies the sensor's temperature coefficient and curve multiplier. Generally, for Negative-Temperature-Coefficient (NTC) sensors, the value of the multiplier is -1.0 and for a Positive-Temperature-Coefficient (PTC) sensor, the value is 1.0. As an advanced function, the multiplier field can be used as a multiplier for the entire calibration curve. For example, a 10KΩ Platinum RTD can use a calibration curve for a 100Ω Platinum RTD by using a multiplier of 100.0. The fourth line of the header is the sensor units field. This may be Volts, Ohms or Logohm. Generally, diode type sensor curves will be in units of Volts and most resistance sensors will be in units of Ohms. However, many resistance sensors used at low temperature have highly nonlinear curves. In this case, the use of Logohm units give a more linear curve and provide better interpolation accuracy. Logohm is the base-10 logarithm of Ohms. Examples of sensor calibration curves that are in units of Ohms include Platinum RTDs and Rhodium-Iron RTDs. Examples of sensors that best use Logohm include , Ruthenium-Oxide and Carbon-Ceramic. After the header block, there are two to 200 lines of sensor calibration data points. Each point of a curve contains a sensor reading and the corresponding temperature. Sensor readings are in units specified by the units line in the curve header. Temperature is always in Kelvin. The format of an entry is: <sensor reading> <Temperature> Where <sensor reading> is a floating-point sensor reading and <Temperature> is a floating-point temperature in Kelvin. Numbers are separated by one or more white spaces. Floating point numbers may be entered with many significant digits. They will be converted to 32 bit floating point which supports about six significant digits. The last entry of a table is indicated by a semicolon ( ; ) character with no characters on the line. NOTE: All curves must have a minimum of two entries and a maximum of 200 entries. Entries may be sent to the instrument in any order. The instrument will sort the curve in ascending order of sensor reading before it is copied to Flash RAM. Entries containing invalid numeric fields are deleted before the curve is stored. 76 The following is an example of a calibration curve transmitted to the instrument via the LAN interface: Good Diode Diode –1.0 volts 0.34295 300.1205 0.32042 273.1512 0.35832 315.0000 1.20000 3.150231 1.05150 8.162345 0.53234 460.1436 ; In summary, 1. The first line is a name string that can be up to 15 characters. Longer strings are truncated by the instrument. The second line identifies the instrument's input configuration and must be one of the allowed selections described in the Supported Sensor Configurations section. 2. The third line is the multiplier field and is 1.0 for PTC sensors and -1.0 for NTC sensors or diodes. 3. The fourth line of the header is the sensor units and must be Volts, Ohms or Logohm. 4. Curve entries must be the sensor reading followed by the temperature in units of Kelvin. Values are separated by one or more white space or tab characters. 5. The last line in the file has a single semicolon ( ; ) character. All lines after this are rejected. 6. It is recommended that the curve back is read after downloading to ensure that the instrument parsed the file correctly. This is easily done by using the Utility Software’s curve upload function under Operations>Sensor Curve>upload. 77 Appendix B: Updating Instrument Firmware Updates require the use of the Cryomagnetics Firmware Update Utility software and a hex file containing the updated firmware. These are available on the Internet. Note: Updating firmware in any instrument is not entirely without risk. Please only perform the procedure when some down time is available. The update will abort on the detection of a hardware malfunction. Also, the update may change instrument features that you are currently using in a different way. Factory defaults settings are restored that will erase any existing user calibration curves or PID tables. Discussion This instrument has two blocks of flash type program memory. In the standard configuration, the Internal block contains a boot-loader program and the External block contains the actual instrument firmware. During the normal power-up sequence, the boot-loader tests the external flash memory and then transfer execution to it in order to run the instrument's firmware. From there, the Cryomagnetics firmware update utility can be used to update instrument's firmware. The firmware update sequence is as follows: 1. Connect the LAN port of the instrument to your PC, turn the instrument ON and then run the FWutility.exe. 2. Click the Connect button to connect the PC to the instrument using TCP/IP. If there is an error, a dialog box will appear. Correct the problem and re-try. 3. While connected, the instrument still functions normally. Click on the Set Flash Mode button to place the instrument in the firmware update mode. In this mode, the instrument executes the boot-loader from the Internal flash memory and is waiting to program the External memory with the new firmware. 4. Click Connect again and then click the Program / Verify button to start the update process. 5. When the update process is complete, the instrument will automatically reset itself and start running the updated firmware. Updating unit firmware Before starting, be sure to have the FWutility.exe file and a hex file that contains the desired firmware update. On the instrument, check the current hardware and firmware revision by pressing the System key and scrolling down to the revision field. A typical display is: FW Ver: 3.00D meaning that the instrument has firmware revision 3.00 and hardware revision D. The name of the hex file is used to identify the firmware update update. For example: M18C_301.hex specifies that this is revision 3.01 for a monitor with hardware revision C. Note: The flash loader software does NOT check the hex file for compatibility with the target instrument. Please be sure that you are using the correct file. Connecting a PC to the instrument It is recommended that the instrument is connected directly to a PC using a LAN Crossover cable. The standard LAN patch cable is designed to connect a PC to a hub and will not work when used to connect to an instrument. The Crossover cable has the transmit and receive lines reversed, which allows direct 78 connection to an instrument. These cables should be clearly marked with the word 'Crossover'. From the PC, open the network connections dialog, select the network adapter that you are using with the Cryomagnetics instrument and select ''Internet Protocol (TCP/IP). In the TCP/IP dialog box, select 'Use the following IP' addresses and enter the following: IP address: 192.168.1.10 Subnet mask: 255.255.255.0 Other fields are not used. Click OK. This should allow you to communicate with the instrument. The advanced user can configure the Ethernet connection in any convenient way. The above procedure is given because it is known to work. The instrument will keep the assigned IP through the entire update process. However, when the update is complete, factory defaults are restored and the IP will be set to 192.168.1.5. Forcing a firmware download A firmware download does not generally need to be forced since the Firmware Utility will automatically set the download state. However, if the unit is non-functional, a firmware download may be forced as follows: 1. Press and holding the DEC (▼) key during power up. 2. When the "Operator Abort" message appears, press the DEC (▼) key to continue normally or press the INC (▲) key to abort to the firmware downloader. Loading Firmware Start the firmware update by running the Firmware Utility. This launches a dialog box as shown here. The instrument's default IP will appear in the dialog box. This can be changed if necessary. Click the Connect button. The status box should update to indicate a connection, but the instrument display will not change. Next, the firmware update file needs to be selected. Click on the browse button (. . .) to launch a file selection dialog. 79 Select the firmware hex file and click Open. The Firmware HEX file field will be updated with the file name. Also, the Set Flash Mode button will become active. Caution: Once you click the Set Flash Mode button, the instrument will enter the firmware update mode and will not function normally again until the entire firmware update process is complete without error. Be sure you have the correct hex file before proceeding. Click the Set Flash Mode button to set the instrument into the flash programming mode. The instrument will reset and start in the flash load mode. This is indicated by the display shown. Since the instrument was reset, click Connect again to re-establish contact. This activates the Program/Verify button. The instrument will now display “Connected...” %RRWORDGHU +ROG'(&NH\WRDERUW Click the Program/Verify button to start the firmware download. The last few lines of the instrument's display will indicate the status. First, the flash memories are erased and then individual records are programmed and verified. There are about 6800 records in a typical file and the programming process takes about ten minutes. When programming is complete, the unit will automatically reset and begin running the updated firmware. Factory defaults are also restored. It is possible to power the instrument OFF during the programming process. This will require a re-start of the entire process after powering ON again. Once the download progress starts, the instrument powersup in the boot loader mode and will not run the normal instrument firmware until the entire download process is completed without error. If an error occurs, an error message will display on the instrument's front panel for 20 seconds and then an alert box will show on the PC. Types of errors are: 1) Failure to erase flash memory. 2) Write error and 3) Verify error. If the error persists after several programming attempts, there is a hardware problem and you will need to contact Cryomagnetics. 80 Appendix C: Troubleshooting Guide Error Displays Display Condition . Or an erratic display of temperature. Input channel voltage measurement is out of range. Ensure that the sensor is connected and properly wired. Ensure that the polarity of the sensor connections is correct. Refer to the Sensor Connections section. Many sensors can be checked with a standard Ohmmeter. For resistor sensors, ensure that the resistance is correct by measuring across both the Sense and Excitation contacts. For a diode sensor, measure the forward and reverse resistance to ensure a diode-type function. . Input channel is within range, but measurement is outside the limits of the selected sensor’s calibration curve. Check sensor connections as described above. Ensure that the proper sensor has been selected. Refer to the Input Channel Setup Menus section. Change the sensor units to Volts or Ohms and ensure that the resulting measurement is within the selected calibration curve. Temperature Measurement Errors Symptom Condition Noise on temperature measurements. Possible causes: 1. Excessive noise pickup, especially AC power line noise. Check your wiring and shielding. Sensors must be floating, so check that there is no continuity between the sensor connection and ground. Review the System Shielding and Grounding Issues section. Note: This monitor uses a shielding scheme that is slightly different than some other monitors. If you are using cable sets made for use with other monitors, some shield connections may need to change. If pin 3 of the input connector is connected to the cable shield, disconnect it and either re-connect the shield to the backshell contact or leave the shield floating. No connection should ever be made to pin 3 of the input connector. 2. Check for shielding problems by temporarily removing the input connector’s backshell. If the noise changes significantly, current is being carried by the shields and is being coupled into the controller. Use a longer display filter time constant to reduce displayed noise. Symptom Condition DC offset in temperature measurements. Possible causes: 1. The wrong sensor type or sensor calibration curve is being used. Refer to the Input Channel Configuration Menu section. 2. DC offset in cryostat wiring. Review the Thermal EMF and AC Bias Issues section. Use AC bias, if necessary, to cancel the offset error. A four-wire measurement is not being used. Some cryostats use a to a two-wire measurement internally. This can cause offset errors due to lead resistance. Thermocouples: These sensors will often have DC offset errors. Use the CalGen feature to generate a new sensor calibration curve that corrects for these errors. 3. 4. No temperature reading. Review the Error Displays section above. 81 Remote I/O problems Symptom Condition Can’t talk to RS-232 interface. Possible causes: 1. Ensure that the RS-232 port is selected. Press the System key and scroll down to the RIO-Port: field. 2. Ensure that the baud rate of the controller matches that of the host computer. To check the controller’s baud rate, press the System key and scroll down to the RIO-RS232 field. 3. Ensure that the host computer settings are 8-bits, No parity, one stop bit. 4. The RS-232 port does not have an effective hardware handshake method. Therefore, terminator characters must be used on all strings sent to the controller. Review the RS-232 Configuration section. 5. Ensure that you are using a Null-Modem type cable. There are many variations of RS-232 cables and only the Null-Modem cable will work with Cryomagnetics controllers. This cable is detailed in the RS-232 Connections section. Debugging tip: Utility Software can be used to talk to the controller over the RS-232 port using the terminal mode. All command and response strings are displayed. This is a good way to establish a connection. Intermittent lockup on RS232 interface. Possible causes: 1. Long cables. Try using a lower baud rate. In some cases, inserting a 50mS delay between commands will help. 2. Noise pickup. Try using shielded cables with the shield connected to a metal backshell at both ends. 3. Don’t send reset (RST) commands to the controller before reading. Can’t talk to the LAN interface. Possible causes: 1. A Category 5 crossover patch cable is being used where a Category 5 patch cable should be used, or visa-versa. 2. The TCP settings between the monitor and the PC are incompatible. Review the network configuration section. 3. PC Client software not configured to use TCP Data Socket 5000. Debugging tip: Utility Software can be used to talk to the monitor over the LAN Data Socket port using the terminal mode. All command and response strings are displayed. Since the software provides the proper interface setup, it is a good way to establish initial connection. 82 Appendix D: Enclosure Options Panel Mounting Panel Cutout Shown here is a cut-out drawing for panel mounting of the monitor. Panel Mount Kit The monitor mounts to panel by sliding the enclosure through a panel cut-out hole and then installing the panel mount kit, Cryomagnetics part number 4012-020. Drawings and assembly of the panel mount kit are shown here. 83 Appendix E: Sensor Data Cryocon S700 Silicon Diode The Cryocon S700 Silicon diode sensor with a 10μA excitation current. 1 2 3 4 5 6 7 8 9 10 11 12 13 14 15 16 17 18 19 20 21 22 23 24 25 26 27 28 29 30 31 32 33 34 35 36 36 38 39 40 84 Volts 0.1633 0.1733 0.1834 0.1935 0.2038 0.2141 0.2246 0.2351 0.2458 0.2565 0.2673 0.2781 0.2891 0.3001 0.3111 0.3222 0.3334 0.3446 0.3558 0.3671 0.3784 0.3897 0.4011 0.4125 0.4239 0.4353 0.4467 0.4581 0.4695 0.4808 0.4922 0.5035 0.5148 0.5261 0.5373 0.5485 0.5596 0.5707 0.5900 0.6131 Temp(K) 475.0000 470.0000 465.0000 460.0000 455.0000 450.0000 445.0000 440.0000 435.0000 430.0000 425.0000 420.0000 415.0000 410.0000 405.0000 400.0000 395.0000 390.0000 385.0000 380.0000 375.0000 370.0000 365.0000 360.0000 355.0000 350.0000 345.0000 340.0000 335.0000 330.0000 325.0000 320.0000 315.0000 310.0000 305.0000 300.0000 295.0000 290.0000 280.0000 270.0000 41 42 43 44 45 46 47 48 49 50 51 52 53 54 55 56 57 58 59 60 61 62 63 64 65 66 67 68 69 70 71 72 73 74 75 76 77 78 79 80 Volts 0.6393 0.6586 0.6807 0.7040 0.7238 0.7461 0.7682 0.7916 0.8133 0.8338 0.8547 0.8753 0.8977 0.9198 0.9373 0.9542 0.9768 0.9865 0.9950 1.0050 1.0144 1.0241 1.0325 1.0420 1.0506 1.0587 1.0673 1.0753 1.0842 1.0870 1.0904 1.0941 1.0974 1.1011 1.1054 1.1108 1.1238 1.1650 1.2070 1.2290 Temp(K) 260.0000 250.0000 240.0000 230.0000 220.0000 210.0000 200.0000 190.0000 180.0000 170.0000 160.0000 150.0000 140.0000 130.0000 120.0000 110.0000 100.0000 95.0000 90.0000 85.0000 80.0000 75.0000 70.0000 65.0000 60.0000 55.0000 50.0000 45.0000 40.0000 38.0000 36.0000 34.0000 32.0000 30.0000 28.0000 26.0000 24.0000 22.0000 20.0000 19.0000 81 82 83 84 85 86 87 88 89 90 91 92 93 94 95 96 97 98 99 100 101 102 103 104 105 106 107 108 109 110 111 112 113 Volts 1.2510 1.2720 1.2950 1.3280 1.3650 1.4150 1.4700 1.5270 1.5750 1.5990 1.6230 1.6540 1.6670 1.6840 1.7080 1.7310 1.7500 1.7690 1.7850 1.7970 1.8000 1.8090 1.8160 1.8210 1.8270 1.8340 1.8390 1.8460 1.8520 1.8560 1.8590 1.8630 1.8660 Temp(K) 18.0000 17.0000 16.0000 15.0000 14.0000 13.0000 12.0000 11.0000 10.0000 9.5000 9.0000 8.5000 8.0000 7.5000 7.0000 6.5000 6.0000 5.5000 5.0000 4.7500 4.5000 4.2500 4.0000 3.7500 3.5000 3.2500 3.0000 2.7500 2.5000 2.2500 2.0000 1.7500 1.5000 Cryocon S900 Silicon Diode The Cryocon S900 Silicon diode sensor with a 10μA excitation current. Volts 0.09077 0.09281 0.11153 0.13320 0.15565 0.17873 0.20231 0.22623 0.25016 0.27403 0.29785 0.32161 0.34532 0.34768 0.36898 0.39261 0.41620 0.43976 0.46330 0.48681 0.51024 0.52192 0.53356 0.54516 0.55674 0.56828 0.57980 0.59131 0.60279 0.61427 0.62573 0.63716 0.64855 0.65992 0.67124 0.68253 0.69379 0.70503 0.71624 0.72743 0.73861 0.74978 0.76094 0.77205 0.78311 0.79412 0.80508 0.81599 0.82680 0.83754 0.84818 0.85874 Temp(K) 500.00 499.00 490.00 480.00 470.00 460.00 450.00 440.00 430.00 420.00 410.00 400.00 390.00 389.00 380.00 370.00 360.00 350.00 340.00 330.00 320.00 315.00 310.00 305.00 300.00 295.00 290.00 285.00 280.00 275.00 270.00 265.00 260.00 255.00 250.00 245.00 240.00 235.00 230.00 225.00 220.00 215.00 210.00 205.00 200.00 195.00 190.00 185.00 180.00 175.00 170.00 165.00 Volts 0.86921 0.87959 0.88988 0.90008 0.91021 0.92022 0.93008 0.93976 0.94927 0.95867 0.96794 0.97710 0.98615 0.99510 1.00393 1.00569 1.00744 1.00918 1.01093 1.01267 1.01439 1.01612 1.01785 1.01957 1.02127 1.02299 1.02471 1.02642 1.02814 1.02985 1.03156 1.03327 1.03498 1.03669 1.03839 1.04010 1.04179 1.04349 1.04518 1.04687 1.04856 1.05024 1.05192 1.05360 1.05528 1.05696 1.05863 1.06029 1.06196 1.06362 1.06528 1.06693 Temp(K) 160.00 155.00 150.00 145.00 140.00 135.00 130.00 125.00 120.00 115.00 110.00 105.00 100.00 95.00 90.00 89.00 88.00 87.00 86.00 85.00 84.00 83.00 82.00 81.00 80.00 79.00 78.00 77.00 76.00 75.00 74.00 73.00 72.00 71.00 70.00 69.00 68.00 67.00 66.00 65.00 64.00 63.00 62.00 61.00 60.00 59.00 58.00 57.00 56.00 55.00 54.00 53.00 Volts 1.06858 1.07023 1.07188 1.07353 1.07517 1.07681 1.07844 1.08008 1.08171 1.08334 1.08497 1.08659 1.08821 1.08983 1.09145 1.09306 1.09468 1.09629 1.09791 1.09952 1.10124 1.10295 1.10465 1.10643 1.10828 1.10996 1.11217 1.11480 1.11828 1.12425 1.13841 1.16246 1.18193 1.19816 1.21325 1.22816 1.24342 1.25932 1.27621 1.29401 1.31277 1.33317 1.35568 1.37998 1.40827 1.44098 1.47740 1.51590 1.55483 1.59108 1.62255 1.64342 Temp(K) 52.00 51.00 50.00 49.00 48.00 47.00 46.00 45.00 44.00 43.00 42.00 41.00 40.00 39.00 38.00 37.00 36.00 35.00 34.00 33.00 32.00 31.00 30.00 29.00 28.00 27.00 26.00 25.00 24.00 23.00 22.00 21.00 20.00 19.00 18.00 17.00 16.00 15.00 14.00 13.00 12.00 11.00 10.00 9.00 8.00 7.00 6.00 5.00 4.00 3.00 2.00 1.00 85 Cryocon R500 Ruthenium-Oxide Sensor The Cryocon R500 with 10μA DC excitation. Temp(K) 20.00 15.00 10.00 9.00 8.00 7.00 6.00 5.00 4.50 4.00 3.90 3.80 3.70 3.60 3.50 3.40 3.30 3.20 3.10 3.00 2.90 2.80 2.70 2.60 2.50 2.40 2.30 2.20 2.10 2.00 1.90 1.80 1.70 1.60 1.50 1.40 1.30 1.20 1.10 1.00 0.99 0.98 0.97 0.96 0.95 0.94 0.93 0.92 0.91 Ohms 1100.75 1127.06 1178.49 1195.31 1216.12 1242.56 1277.29 1325.01 1356.30 1394.87 1403.69 1412.95 1422.68 1432.91 1443.68 1455.05 1467.06 1479.78 1493.26 1507.58 1522.82 1539.09 1556.48 1575.12 1595.16 1616.77 1640.15 1665.53 1693.20 1723.48 1757.83 1793.33 1832.94 1877.43 1927.75 1985.13 2051.19 2128.07 2218.67 2327.06 2339.09 2351.35 2363.86 2376.63 2389.66 2402.97 2416.56 2430.44 2444.61 Ohms/K -4 -7 -15 -19 -24 -30 -41 -58 -70 -88 -93 -97 -102 -108 -114 -120 -127 -135 -143 -152 -163 -174 -186 -200 -216 -234 -254 -277 -303 -343 -355 -396 -445 -503 -574 -661 -769 -906 -1084 -1203 -1226 -1251 -1277 -1303 -1331 -1359 -1388 -1417 -1449 Temp(K) 0.90 0.89 0.88 0.87 0.86 0.85 0.84 0.83 0.82 0.81 0.80 0.79 0.78 0.77 0.76 0.75 0.74 0.73 0.72 0.71 0.70 0.69 0.68 0.67 0.66 0.65 0.64 0.63 0.62 0.61 0.60 0.59 0.58 0.57 0.56 0.55 0.54 0.53 0.52 0.51 0.50 0.49 0.48 0.47 0.46 Ohms 2459.10 2473.91 2489.05 2504.53 2520.36 2536.57 2553.15 2570.12 2587.50 2605.31 2623.55 2642.24 2661.41 2681.07 2701.23 2721.93 2743.17 2764.99 2787.41 2810.45 2834.13 2858.49 2883.56 2909.36 2935.94 2963.32 2991.54 3020.65 3050.68 3081.68 3113.70 3146.79 3181.01 3216.41 3253.06 3291.02 3330.37 3371.19 3413.56 3457.57 3503.33 3550.93 3600.49 3652.13 3706.01 Ohms/K -1481 -1514 -1548 -1583 -1621 -1658 -1697 -1738 -1781 -1824 -1869 -1917 -1966 -2016 -2070 -2124 -2182 -2242 -2304 -2368 -2436 -2507 -2580 -2658 -2738 -2822 -2911 -3003 -3100 -3202 -3309 -3422 -3540 -3665 -3796 -3935 -4082 -4237 -4401 -4576 -4760 -4956 -5164 -5388 -5624 Temp(K) 0.45 0.44 0.43 0.42 0.41 0.40 0.39 0.38 0.37 0.36 0.35 0.34 0.33 0.32 0.31 0.30 0.29 0.28 0.27 0.26 0.25 0.24 0.23 0.22 0.21 0.20 0.19 0.18 0.17 0.16 0.15 0.14 0.13 0.12 0.11 0.10 0.09 0.08 0.07 0.06 0.05 Ohms 3762.25 3821.02 3882.51 3946.90 4014.41 4085.27 4159.74 4238.11 4320.70 4407.85 4499.97 4597.50 4700.93 4810.82 4927.81 5052.62 5186.07 5329.10 5482.79 5648.41 5827.42 6021.54 6232.80 6463.61 6716.86 6996.06 7305.49 7650.42 8037.48 8475.06 8973.98 9548.42 10217.44 11007.22 11954.86 13114.91 14571.49 16462.45 19034.37 22792.03 29072.86 Ohms/K -5877 -6149 -6439 -6751 -7086 -7447 -7837 -8259 -8715 -9212 -9753 -10343 -10989 -11699 -12481 -13345 -14303 -15369 -16562 -17901 -19412 -21126 -23081 -25325 -27920 -30943 -34493 -38706 -43758 -49892 -57444 -66902 -78978 -94764 -116005 -145658 -189096 -257192 -375766 -628083 86 Cryocon R400 Ruthenium-Oxide Sensor The Cryocon R400 with 100uV AC excitation. Temp(K) 300.00 200.00 100.00 80.00 60.00 40.00 20.00 15.00 10.00 9.00 8.00 7.00 6.00 5.00 4.50 4.30 4.20 4.00 3.90 3.80 3.70 3.60 3.50 3.40 3.30 3.20 3.10 3.00 2.90 2.80 2.70 2.60 2.50 2.40 2.30 2.20 2.10 2.00 1.90 1.80 1.70 1.60 1.50 1.40 1.30 1.20 1.10 1.00 0.99 Ohms 1000 1008 1025 1032 1042 1058 1101 1127 1178 1195 1216 1243 1277 1325 1356 1371 1378 1395 1404 1413 1423 1433 1444 1455 1467 1480 1493 1508 1523 1539 1556 1575 1595 1617 1640 1666 1693 1723 1758 1793 1833 1877 1928 1985 2051 2128 2219 2327 2339 Ohms/K -0.08 -0.13 -0.33 -0.49 -0.84 -1.50 -4.08 -7.20 -15.40 -18.80 -23.60 -30.50 -40.90 -57.80 -70.50 -76.90 -80.40 -88.20 -92.60 -97.30 -102.30 -107.70 -113.70 -120.10 -127.20 -134.80 -143.20 -152.40 -162.70 -173.90 -186.40 -200.40 -216.10 -233.80 -253.80 -276.70 -302.80 -343.50 -355.00 -396.10 -444.90 -503.20 -573.80 -660.60 -768.80 -906.00 -1083.90 -1203.00 -1226.00 Temp(K) 0.98 0.97 0.96 0.95 0.94 0.93 0.92 0.91 0.90 0.89 0.88 0.87 0.86 0.85 0.84 0.83 0.82 0.81 0.80 0.79 0.78 0.77 0.76 0.75 0.74 0.73 0.72 0.71 0.70 0.69 0.68 0.67 0.66 0.65 0.64 0.63 0.62 0.61 0.60 0.59 0.58 0.57 0.56 0.55 0.54 0.53 0.52 0.51 0.50 Ohms 2351 2364 2377 2390 2403 2417 2430 2445 2459 2474 2489 2505 2520 2537 2553 2570 2588 2605 2624 2642 2661 2681 2701 2722 2743 2765 2787 2810 2834 2858 2884 2909 2936 2963 2992 3021 3051 3082 3114 3147 3181 3216 3253 3291 3330 3371 3414 3458 3503 Ohms/K -1251.00 -1277.00 -1303.00 -1331.00 -1359.00 -1388.00 -1417.00 -1449.00 -1481.00 -1514.00 -1548.00 -1583.00 -1621.00 -1658.00 -1697.00 -1738.00 -1781.00 -1824.00 -1869.00 -1917.00 -1966.00 -2016.00 -2070.00 -2124.00 -2182.00 -2242.00 -2304.00 -2368.00 -2436.00 -2507.00 -2580.00 -2658.00 -2738.00 -2822.00 -2911.00 -3003.00 -3100.00 -3202.00 -3309.00 -3422.00 -3540.00 -3665.00 -3796.00 -3935.00 -4082.00 -4237.00 -4401.00 -4576.00 -4760.00 Temp(K) 0.49 0.48 0.47 0.46 0.45 0.44 0.43 0.42 0.41 0.40 0.39 0.38 0.37 0.36 0.35 0.34 0.33 0.32 0.31 0.30 0.29 0.28 0.27 0.26 0.25 0.24 0.23 0.22 0.21 0.20 0.19 0.18 0.17 0.16 0.15 0.14 0.13 0.12 0.11 0.10 0.09 0.08 0.07 0.06 0.05 Ohms 3551 3600 3652 3706 3762 3821 3883 3947 4014 4085 4160 4238 4321 4408 4500 4598 4701 4811 4928 5053 5186 5329 5483 5648 5827 6022 6233 6464 6717 6996 7305 7650 8037 8475 8974 9548 10217 11007 11955 13115 14571 16462 19034 22792 29073 Ohms/K -4956.00 -5164.00 -5388.00 -5624.00 -5877.00 -6149.00 -6439.00 -6751.00 -7086.00 -7447.00 -7837.00 -8259.00 -8715.00 -9212.00 -9753.00 -10343.00 -10989.00 -11699.00 -12481.00 -13345.00 -14303.00 -15369.00 -16562.00 -17901.00 -19412.00 -21126.00 -23081.00 -25325.00 -27920.00 -30943.00 -34493.00 -38706.00 -43758.00 -49892.00 -57444.00 -66902.00 -78978.00 -94764.00 -116005.00 -145658.00 -189096.00 -257192.00 -375766.00 -628083.00 87 Sensor Packages The SM and CP Sensor Packages The S900-SM is mounted in a rugged surface-mounted package. This compact package features a low thermal mass and is easy to install. Package material is gold plated OHFC copper on an Alumina substrate. Solder limits the temperature range to 400K. Leads are 3 inches, material is 37 AWG copper with Polyimide insulation. Positive connection is Red and negative is Black. Sensor is easily installed by attaching the substrate directly to the desired surface using cryogenic varnish. Leads should be thermally anchored. The CP is an ultra-compact 'CP'. It features low thermal mass and operation to 500K. Package material is gold plated OHFC copper. Leads are 3 inches. Material is 37 AWG copper with Polyimide insulation. Positive connection is Red and negative is Black. This package is extremely small and has a low thermal mass. 88 The BB Sensor Package The BB package is an industry standard 0.310" bobbin package that features excellent thermal contact to the internal sensing element. This ensures a rapid thermal response and minimizes thermal gradients between the sensing element and the sensor package. Mechanical integrity of the sensor assures reliable performance even in severe applications. With the bobbin package, the lead wires are thermally anchored to the sensor mounting. This is essential for accurate sensor readings. Bobbin Package Specifications Bobbin Material Gold plated Oxygen free hard Copper. Marking Individual serial number. Sensor Bonding Stycast® epoxy. Cable Color Codes Mass 1.1g excluding leads. V+ Clear 36 inches, 36AWG Phosphor-Bronze. Fourlead color coded cryogenic ribbon cable. Insulation is heavy Formvar® . V- Green I+ Black I- Red Leads Mounting 4-40 machine screw. Temperature 400K Maximum. Table 16: Cable Color Code Table 15: BB Package Specifications Connections to the BB package are made using a color-coded four-wire, 36 AWG cryogenic ribbon cable. Wires may be separated by dipping in Isopropyl Alcohol and then wiping clean. Insulation is Formvar™ and is difficult to strip. Techniques include use of a mechanical stripper, scrapping with a razor blade and passing the wire quickly over a low flame. The BB package is easily mounted with a #4-40 brass screw. A brass screw is recommended because thermal stress will be reduced at cryogenic temperature. The mounting surface should be clean. A rinse with Isopropyl Alcohol is recommended. First, apply a small amount of Apiezon™ N grease to the threads of the screw and on the mounting surface of the sensor package. Next, place the bobbin on the mounting surface, insert screw through bobbin and lightly tighten. 89 The Canister Sensor Package Cryomagnetics's Ruthenium-Oxide sensors are available in a small 0.95" x 0.2" cylindrical canister package. Construction: Gold-plated cylindrical OHFC copper canister, Stycast® epoxy filler. There is no internal atmosphere. Epoxy limits the maximum storage temperature to 400K. Leads: Four, 36 AWG, Phosphor-Bronze, color coded. Formvar® insulation. Mass: 0.4g. Installation: Use a 0.101" diameter drill. Place a small amount of Apiezon® N grease in the hole before inserting the sensor. Ensure that the leads are thermally anchored. Cable Color Code V+ Clear V- Green I+ Black I- Red Connection: All connections should be 4-wire in order to eliminate errors due to lead resistance. Leads are coated with Butyl and may be separated by dipping them in Isopropyl Alcohol. Lead insulation is heavy Formvar® which is difficult to strip. Techniques include use of a mechanical stripper or scrapping with a razor blade. 90 Appendix F: Configuration Scripts The Utility Software package can be used to send configuration scripts to the instrument. These scripts consist mostly of standard remote commands and queries. Scripts can be used to completely configure an instrument including setting custom sensor calibration curves and PID tables. They are commonly used in a manufacturing environment to set a baseline state for a target product. In the laboratory, scripts can be used to save and restore configurations for various experiments. XML, or Extensible Markup Language, is used for the structure and format of script files. XML can be generated and edited with a standard text editor but advanced users may want to use one of the commonly available XML editors. Since it provides a structure and allows user documentation, it is easy to read and understand. Configuration scripts have a file extension of .xml. These files are sent to an instrument by using the Operations->Send Command File function of the Utility Software. Any remote command or query that is recognized by the instrument can be used in a script file. This includes commands that read and write user sensor calibration curves and PID tables. A complete description of available remote commands is given in the chapter titled Remote Programming Guide. The Remote Command Tree section is particularly useful for the advanced user. Script File Structure Header and Footer Like all XML files, script files have the following header and footer: <?xml version="1.0"?> <Transactions> . . . </Transactions> All user supplied information is placed between the Transactions tags. Basic XML Tags Comment: <! > Inserts a comment in the file for documentation and readability. The comment within the angle brackets after the exclamation is ignored by the software. <!Download User Curve 4> <!------------ Loop 1 ---------------> Model: <Model> </Model> Contains the Cryomagnetics instrument model number for source/destination verification. <Model>Model612 Version 2.03</Model> Remote Command: <Command> </Command> Send a remote command to the instrument. Commands can be any of the instrument's commands as described in the Remote Programming Guide. <Command>input c:sensor 2</Command> <Command>LOOP 1:SOURCE A;Setpt 20.0</Command> <Command>OVERTEMP:ENABLE ON</Command> 91 Query: <Query> </Query> Query data from the instrument. Queries can be any of the instrument's commands as described in the Remote Programming Guide. Query is generally used with a Response tag to compare the instrument's response to an expected value. If there is no Response tag, the result of the query is printed but not tested for errors. <Query>input c:sensor?</Query> <Query>input b:units K;units?</Query> Response: <Response> </Response> Identifies the expected response to a query. This tag must always follow a Query tag, otherwise, it is ignored. When the comparison fails, an error text message will be displayed and recorded to a file. <Query>Relays? 1</Query> <Response>Lo</Response> <Query>input c:units?</Query> <Response>K</Response> <! Should be Kelvin. Error if not > Floating Point Response: <Floatresponse> <Floatresponse> Compare the response returned from the instrument against an expected floating point number. This tag must always follow a Query tag; otherwise, it is ignored. When the comparison fails, an error text message will display. The returned value passes the test if within +/-2.5% of the expected value. <Query>input a:ALAR:High?</Query> <FloatResponse>200.000000</FloatResponse> Pause: <Pause> </Pause> Provide a pause for a specified number of milliseconds to allow the instrument to react to a command. Maximum 20 seconds. Generally, this is only used with the RS-232 serial interface where there is no hardware handshake. <Pause>1000</Pause> <! Delay 1 second > Group Tags Any tag that is not defined is treated as a group tag. They are used to provide structure and enhance readability. Otherwise, they are ignored. Complex Tags Sending a user sensor calibration curve or a PID table to an instrument requires a complex tag because it can require many lines of data. User Sensor Calibration Curve: <Calcur> Send a sensor calibration curve to the instrument. <!Download User curve 4> <CalCur>Calcur 4</CalCur> <!--Curve Name--> <CalCur>My Sensor</CalCur> <!--Curve Type--> <CalCur>Diode</CalCur> <!--Multiplier--> <CalCur>-1.000000</CalCur> <!--Units--> <CalCur>Volts</CalCur> <!--Curve Entries--> <CalCur>0.163300 475.000000</CalCur> <CalCur>0.173300 470.000000</CalCur> <CalCur>0.183400 465.000000</CalCur> <CalCur>1.866000 1.500000</CalCur> <!--Send the end-of-transmission character--> <CalCur>;</CalCur> Transmission of the calibration curve starts with the first CALCUR tag and ends when the end-of92 transmission(;) character is sent. Comments are ignored. Script File Example <?xml version="1.0"?> <Transactions> <Model>Model44 Version 3.06</Model> <Input> <!----- CHA -----> <Command>input a:sensor 20</Command> <! Set to PT100> <Query>input a:temp?</Query> <Command>input a:sensor 21</Command> <! Set to PT1K> <Query>input a:temp?</Query> <! Ignore response> <!---- CHB------> <Command>input b:sensor 20</Command> <Query>input b:temp?</Query> <Response>K</Response> <Command>input b:sensor 21</Command> <Query>input b:temp?</Query> </Input> <SensorCurve> <!User curve 4> <CalCur>CALCUR 4</CalCur> <!Curve Name> <CalCur>Test S700</CalCur> <!Curve Type> <CalCur>Diode</CalCur> <!Multiplier> <CalCur>-1.000000</CalCur> <!Unit> <CalCur>Volts</CalCur> <!Curve Entries> <CalCur>0.163300 475.000000</CalCur> <CalCur>0.173300 470.000000</CalCur> <CalCur>0.183400 465.000000</CalCur> <CalCur>0.193500 460.000000</CalCur> <CalCur>0.203800 455.000000</CalCur> <CalCur>0.214100 450.000000</CalCur> <CalCur>0.224600 445.000000</CalCur> <CalCur>0.235100 440.000000</CalCur> <CalCur>0.245800 435.000000</CalCur> <CalCur>0.256500 430.000000</CalCur> <CalCur>0.267300 425.000000</CalCur> <CalCur>0.278100 420.000000</CalCur> <CalCur>0.289100 415.000000</CalCur> <CalCur>0.300100 410.000000</CalCur> <CalCur>0.311100 405.000000</CalCur> <CalCur>0.322200 400.000000</CalCur> <CalCur>0.333400 395.000000</CalCur> <CalCur>0.344600 390.000000</CalCur> <CalCur>0.355800 385.000000</CalCur> <CalCur>;</CalCur> </SensorCurve> </Transactions> 93 Appendix G: Sensor Data Tables Silicon Diode Silicon diode sensors offer good sensitivity over a wide temperature range and are reasonably interchangeable. Use in magnetic fields is not recommended. Silicon diode sensors use a constant-current DC excitation of 10μA. Cryocon S900 Silicon Diode Name: Cryocon S900 Configuration: Diode T(K) Volts mV/K 1.4 1.63864 -36.56 4.2 1.53960 -33.91 10 1.35568 -26.04 20 1.18193 -11.34 30 1.10465 -3.12 50 1.07188 -1.46 77.35 1.02511 -1.69 100 0.98615 -1.85 150 0.88988 -2.03 200 0.78311 -2.17 250 0.67124 -2.28 300 0.55674 -2.36 355 0.42759 -2.33 400 0.32161 -2.38 450 0.20231 -2.37 500 0.09077 -2.12 nocoyrC S800 Silicon Diode Name: Cryocon S800 Configuration: Diode 1.63864 -36.56 4.2 1.53960 -33.91 10 1.36317 -26.04 20 1.17370 -11.34 30 1.10343 -3.12 50 1.07399 -1.46 77.35 1.02511 -1.69 100 0.98740 -1.85 150 0.89011 -2.03 200 0.78272 -2.17 250 0.67085 -2.28 300 0.55665 -2.36 355 0.42759 -2.33 400 0.32161 -2.38 450 0.20231 -2.37 500 0.09077 -2.12 Scientific Instruments SI-410 Name: SI 410 Diode Configuration: Diode T(K) Volts mV/K 1.4 1.71488 -10.54 4.2 1.64660 -32.13 10 1.39562 -35.28 20 1.17592 -20.43 30 1.10136 -1.75 50 1.06957 -1.59 77.35 1.14905 -1.72 100 0.98322 -1.82 150 0.88603 -2.00 200 0.78059 -2.14 250 0.67023 -2.23 300 0.55672 -2.28 T(K) Volts mV/K 350 0.44105 -2.32 1.4 1.87515 -36.86 400 0.32319 -2.36 4.2 1.75099 -49.16 450 0.20429 -2.38 10 1.47130 -43.45 20 1.18867 -15.93 30 1.10594 -3.90 Lakeshore DT-670 Silicon Diode Name: LS DT-670 Configuration: Diode 50 1.07079 -1.47 T(K) Volts mV/K 77.35 1.02356 -1.86 1.4 1.64429 -12.49 100 0.98170 -1.85 4.2 1.57848 -31.59 150 0.88365 -2.03 10 1.38373 -26.84 200 0.77887 -2.13 20 1.19775 -15.63 250 0.67067 -2.20 30 1.10624 -1.96 300 0.55955 -2.22 50 1.07310 -1.61 355 0.44124 -2.10 77.35 1.02759 -1.73 385 0.37611 -2.26 100 0.98697 -1.85 150 0.88911 -2.05 200 0.78372 -2.16 250 0.67346 -2.24 300 0.55964 -2.30 350 0.44337 -2.34 Scientific Instruments SI-430 and SI-440 Name: SI 430 Diode Configuration: Diode Name: SI 440 Diode Configuration: Diode T(K) 94 1.4 Volts mV/K 400 0.32584 -2.36 450 0.20676 -2.39 500 0.09068 -2.12 Lakeshore DT-470 Silicon Diode Name: LS DT-470 Configuration: Diode T(K) Volts mV/K 1.4 1.6981 -13.1 4.2 1.6260 -33.6 10 1.4201 -28.7 20 1.2144 -17.6 30 1.1070 -2.34 50 1.0705 -1.75 77.35 1.0203 -1.92 100 0.9755 -2.04 150 0.8687 -2.19 200 0.7555 -2.31 250 0.6384 -2.37 300 0.5189 -2.4 350 0.3978 -2.44 400 0.2746 -2.49 450 0.1499 -2.46 475 0.0906 -2.22 GaAlAs Diode GaAiAs diode sensors offer good sensitivity over a wide range of temperatures. However, they do not follow a standard calibration curve. Useful in magnetic fields below 5T and a temperature above 30K. Outside of this range, a Ruthenium-Oxide sensor offers better performance. GaAiAs diode sensors use a constant-current DC excitation of 10μA. The monitor limits low temperature operation to 25K since that is outside of the limits for use in magnetic fields. Shaded entries are outside of the monitor's temperature range. Lakeshore TG-120 GaAIAs Diode Name: User Supplied Configuration: Diode T(K) Volts mV/K 1.4 5.3909 -97.5 4.2 4.7651 -214 10 3.7521 -148 20 2.5341 -97.5 30 1.8056 -48.2 50 1.4637 -2.82 77.35 1.4222 -1.24 100 1.3918 -1.48 150 1.2985 -2.25 200 1.1738 -2.64 250 1.0383 -2.77 300 0.8978 -2.85 350 0.7531 -2.99 400 0.6066 -2.97 450 0.4556 -3.08 475 0.3778 -3.15 95 Platinum RTD Rhodium-Iron Platinum RTD sensors feature high stability, low magnetic field dependence and excellent interchangeability. They conform to the DIN43760 standard curve. Rhodium-Iron sensors feature high stability, low magnetic field dependence and reasonable interchangeability. The monitor uses 1.0mA Constant-Current AC excitation. Platinum RTD, DIN43760 and IEC751 Name: Pt100 385 Configuration: PTC100 Name: Pt1K 385 Configuration: PTC1K 96 T(K) Ohms Ω/K 20 2.2913 0.085 30 3.6596 0.191 50 9.3865 0.360 77.35 20.380 0.423 100 29.989 0.423 150 50.788 0.409 200 71.011 0.400 250 90.845 0.393 300 110.354 0.387 400 148.640 0.383 500 185.668 0.378 600 221.535 0.372 700 256.243 0.366 800 289.789 0.360 900 324.302 0.318 1123 390.47 0.293 The monitor supports them with 1.0mA ConstantCurrent AC excitation. Rhodium-Iron 27Ω Name: RhFe 27 1mA Configuration: PTC100 T(K) Ohms Ω/K 1.4 1.5204 0.178 4.2 1.9577 0.135 10 2.5634 0.081 20 3.1632 0.046 30 3.5786 0.040 50 4.5902 0.064 77.4 6.8341 0.096 100 9.1375 0.106 150 14.463 0.105 200 19.641 0.102 250 24.686 0.101 300 29.697 0.101 350 34.731 0.101 400 39.824 0.103 Cernox™ Cernox™ temperature sensors do not follow a standard calibration curve. Data shown here is for typical sensors. The monitor supports Cernox™ using a 100mV or less Constant-Voltage AC excitation. This extends low temperature operation to 100mK. Please refer to the section titled "Selecting a Voltage Bias for NTC Sensors" Lakeshore Cernox™ CX-1010 Name: User Supplied Config: ACR 10mV 100 85.940 -0.552 150 65.864 -0.295 200 54.228 -0.184 250 46.664 -0.124 300 41.420 -0.088 350 37.621 -0.065 400 34.779 -0.050 420 33.839 -0.045 Lakeshore Cernox™ CX-1050 Name: User Supplied Config: ACR T(K) Ohms Ω/K T(K) Ohms Ω/K 0.1 21389 -558110 1.4 26566 -48449 0.2 4401.6 -38756 2 11844 -11916 0.3 2322.4 -10788 3 5733.4 -3042.4 0.4 1604.7 -4765.9 4.2 3507.2 -1120.8 0.5 1248.2 -2665.2 6 2252.9 -432.14 1 662.43 -514.88 10 1313.5 -128.58 1.4 518.97 -251.77 20 692.81 -30.871 2 413.26 -124.05 30 482.88 -14.373 3 328.95 -58.036 40 373.11 -8.392 4.2 277.32 -32.209 50 305.19 -5.507 6 234.44 -17.816 77.35 205.67 -2.412 10 187.11 -8.063 100 162.81 -1.488 20 138.79 -3.057 150 112.05 -0.693 30 115.38 -1.819 200 85.800 -0.397 40 100.32 -1.252 250 69.931 -0.253 50 89.551 -0.929 300 59.467 -0.173 77.35 70.837 -0.510 350 52.142 -0.124 100 61.180 -0.358 400 46.782 -0.093 150 47.782 -0.202 420 45.030 -0.089 200 39.666 -0.130 250 34.236 -0.090 300 30.392 -0.065 Lakeshore Cernox™ CX-1030 Name: User Supplied Config: ACR Lakeshore Cernox™ CX-1070 Name: User Supplied Config: ACR 100mV T(K) Ohms Ω/K 4.2 5979.4 -2225.3 6 3577.5 -794.30 T(K) Ohms Ω/K 10 1927.2 -214.11 0.3 31312 -357490 20 938.93 -46.553 0.4 13507 -89651 30 629.90 -20.613 0.5 7855.7 -34613 40 474.89 -11.663 1 2355.1 -3265.2 50 381.42 -7.490 1.4 1540.1 -1264.9 77.35 248.66 -3.150 2 1058.4 -509.26 100 193.29 -1.899 3 740.78 -199.11 150 129.60 -0.854 4.2 574.20 -97.344 200 97.626 -0.477 6 451.41 -48.174 250 78.723 -0.299 10 331.67 -19.042 300 66.441 -0.201 20 225.19 -6.258 350 57.955 -0.143 30 179.12 -3.453 400 51.815 -0.106 40 151.29 -2.249 420 49.819 -0.094 50 132.34 -1.601 77.35 101.16 -0.820 97 Ruthenium-Oxide Lakeshore Cernox™ CX-1080 Name: User Supplied Config: ACR 100mV 98 T(K) Ohms Ω/K 20 6157.5 -480.08 30 3319.7 -165.61 40 2167.6 -79.551 50 1565.3 -45.401 77.35 836.52 -15.398 100 581.14 -8.213 150 328.75 -3.057 200 220.93 -1.506 250 163.73 -0.863 300 129.39 -0.545 350 106.98 -0.368 T(K) Ohms Ω/K 400 91.463 -0.261 0.05 29072 -628083 420 86.550 -0.231 0.1 13114 -145658 0.2 6996 -30943 0.3 5053 -13345 0.5 3503 -4760 1 2327 -1203 1.4 1985 -660.6 2 1723 -343.5 3 1508 -152.4 4.2 1378 -80.4 6 1277 -40.9 10 1178 -15.4 20 1101 -4.08 30 1053 -4.0 40 1009 -3.5 Cryocon R500 The R500 Ruthenium-Oxide temperature sensor is designed primarily for ultra-low temperature operation. Features include interchangeability and operation in high magnetic fields. The monitor will support the R500 down to about 2.0K. Please refer to the section titled "Selecting a Voltage Bias for NTC Sensors" Cryocon R500 Ruthenium-Oxide Name: Cryocon R500 Config: ACR Cryocon R400 The R400 Ruthenium-Oxide temperature sensor is designed for operation between 2.0K and 273K with high sensitivity below 40K. They feature interchangeability and operation in high magnetic fields. Applications include low temperature superconducting magnet systems and liquid helium systems. Using the NTC10uA input configuration will operate with the R400 over it's full temperature range. Cryocon R400 Ruthenium-Oxide Name: Cryocon R400 Config: NTC10uA T(K) Ohms Ω/K 2 239556 -17787 3 221769 -13961 4 207807 -11343 Scientific Instruments RO-600 Name: SI RO-600 Config: ACR T(K) Ohms Ω/K 0.05 29072 -628083 0.1 13114 -145658 0.2 6996 -30943 0.3 5053 -13345 0.5 3503 -4760 1 2327 -1203 1.4 1985 -660.6 2 1723 -343.5 3 1508 -152.4 4.2 1378 -80.4 6 1277 -40.9 10 1178 -15.4 20 1101 -4.08 30 1053 -4.0 40 1009 -3.5 6 187171 -7647 10 163317 -3907 20 138709 -1400 30 128199 -745 T(K) Ohms Ω/K 40 122128 -474 2 239556 -17787 100 108595 -108 3 221769 -13961 200 102432 -34 4 207807 -11343 273 100604 -0.05 6 187171 -7647 10 163317 -3907 20 138709 -1400 30 128199 -745 40 122128 -474 100 108595 -108 200 102432 -34 273 100604 -0.05 Scientific Instruments RO-105 Name: SI RO-105 Config: NTC10uA 99 Thermocouples An external thermocouple module is required. Thermocouple Type E Name: TC type E 100 Config: TC70 Thermocouple Type K Name: TC type K Config: TC70 K μV μV/K 3.2 -6457.7 0.74 4.2 -6456.9 0.92 K μV μV/K 10 -6448.5 2.01 3.2 -9834.9 1.59 10.5 -6447.4 2.12 4.15 4.2 -9833 2.09 20 -6417.8 10 -9813.3 4.66 30 -6365.1 6.39 20 -9747 8.51 40 -6290 8.61 30 -9643.8 12.1 50 -6193.3 10.7 40 -9505.5 15.5 75 -5862.9 15.6 50 -9334.2 18.7 100 -5417.6 19.9 75 -8777.7 25.6 150 -4225.5 27.5 100 -8063.4 31.4 200 -2692.8 33.5 150 -6238.1 41.2 250 -897.6 38 200 -3967.4 49.3 273.15 0 39.4 250 -1328.7 56 300 1075.3 40.6 273.15 0 58.5 350 3135.8 41.5 300 1608 61.1 400 5200 40.8 350 4777.7 65.6 500 9215.6 40.3 400 8159.8 69.6 600 13325 41.7 500 15426 75.3 670 16264 42.2 600 23138 78.6 700 17533 42.4 670 28694 80 800 21789 42.6 700 31100 80.4 900 26045 42.4 800 39179 81 1000 30251 41.7 900 47256 80.4 1100 34373 40.7 1000 55247 79.3 1200 38396 39.7 1100 63119 78.1 1270 41153 39 1200 70842 76.3 1300 42318 38.7 1270 76136 75.2 1400 46131 37.5 1500 49813 36.1 1600 53343 34.5 1640 54712 34 Thermocouple Type T Name: TC type T Thermocouple Type Chromel-AuFe(0.07%) Name: AuFe 0.07% Config: TC70 Config: TC70 K μV μV/K K μV μV/K 3.2 -6257.5 1.03 1.2 -5299.6 8.98 4.2 -6256.2 1.4 2 -5292 10.1 10 -6242.9 3.12 3.2 -5278.9 11.6 20 -6199.2 5.58 4.2 -5266.8 12.6 30 -6131.3 7.99 10 -5181.8 16 40 -6040 10.2 20 -5014 17 50 -5927.7 12.2 30 -4846.4 16.6 75 -5573.6 16 40 -4681.5 16.5 100 -5131.2 19.4 50 -4515.8 16.7 150 -4004.3 25.6 75 -4084.6 17.8 200 -2575.3 31.4 100 -3627 18.8 250 -872.57 38 150 -2645.2 20.4 273.15 0 39.4 200 -1600.1 21.4 300 1067.4 40.8 250 -512.81 22 350 3215.5 45 300 597.44 22.4 400 5560.2 48.7 350 1696.3 21.8 500 10735 54.6 400 2805.7 22.7 600 16437 59.2 500 5135.3 23.4 670 20677 61.7 600 7470.7 23.4 Appendix H: Rear Panel Connections Rear Panel Figure 2: Model 612 Rear Panel Input Connectors Two DB-9 connectors (Model 614) or one (Model 612) provide 4-wire measurement for the appropriate amount of sensors. Any input connector can also be used for the dual thermocouple option connection. LAN A standard RJ-45 Ethernet connector is used for connection to a local area network. This connector can 101 also used for the Power-over-Ethernet connection. Power input The external power supply provided with the monitor accepts 100 – 240VAC @ 50 – 60Hz and outputs 12VDC @ 1.0A. This may be plugged directly into the monitor's power jack. Alternatively, any supply from 7.5 to 48V, AC or DC with a capacity of greater than 10VA may be used. The jack is 2.1mm with positive voltage on the center and negative on the sleeve. Power-Over-Ethernet is also supported. An IEEE-802.3AT Power-Over-Ethernet hub or injector is required. Plug the cable from this device into the Ethernet input of the monitor. In this case, the power jack should not used. IMPORTANT: The monitor requires that an Earth Ground reference connection is made at the rear panel. Failure to provide this connection will result in erratic measurements and can even damage input circuits. The sensor cables provided connect their shields to the monitor's chassis; therefore, the required Earth Ground can be made by connecting the shield wire at the opposite end to a ground reference point. This is usually done by connecting it to the back-shell of the cryostat connector. 102 RS-232 DB9 null-modem connection. This connector is also used for the USB serial port emulator option. Relays A four pin, 3.5mm, detachable terminal block is used to connect to the Normally-Open contacts of the two relays. Contact ratings: 10A@125 VAC, 5A@250VAC or 5A@30VDC. Sensor Connections All four sensor connections are made at the rear panel of the monitor using the two DB-9 receptacles provided. There are two channels on each connector. Four Wire Sensor Connections Silicon Diode and all resistor type sensors should be connected to the monitor using the four-wire method. It is strongly recommended that sensors be connected using shielded, twisted pair wire. Cable shields should be dressed for connection to the conductive backshell of the connector. Signal connection is as follows: Figure 3: Input Connector Input Channel A A A A B B B B Signal Excitation Current(+) Excitation Current(-), Signal Ground. Voltage Sense(+) Voltage Sense(-) Excitation Current(+) Excitation Current(-), Signal Ground. Voltage Sense(+) Voltage Sense(-) Option power. 5VDC@500mA Pin 8 9 4 5 6 7 1 2 3 Table 17: Sensor Input Connector Pinout Caution: Pin 3 of each input connector is used to power external options such as the dual thermocouple module. If there is no option present, this pin should be left unconnected. Note: Since power supplied to the instrument does not generally provide an earth ground reference, this reference is often established by connecting the sensor cable shield to the instrument's chassis on one end and to the cryostat ground on the other. Generally, these connections are made using the backshell on the connectors. 103 Color codes for the Dual Sensor Cable (part number 4034-038) are as follows: Input Channel Color Code ChA ChA ChA ChA ChB ChB ChB ChB White Green Red Black White Green Red Black DB9 Pin Signal Current(+) Current(-) Sense(+) Sense(-) Current(+) Current(-) Sense(+) Sense(-) 8 9 4 5 6 7 1 2 Table 18: Dual Sensor Cable Color Codes The cable used is Belden 8723. This is a dual twisted pair cable with individual shields and a drain wire. The shields and drain wire are connected to the DB9 connector's metal backshell in order to complete the shielding connection. Sensor Wiring DC offsets can build up in cryogenic temperature measurement systems due to thermocouple effects within the sensor wiring. They are commonly referred to as Thermal EMFs. Careful wiring can minimize these effects. The most effective method of minimizing thermocouple (DC) offsets is to wire temperature sensors so that connections between dissimilar metals are grouped together. For example, the connection between sensor leads and cryostat wiring should be kept close together. This way, the thermocouple junctions formed by the connection will have equal-but-opposite voltages and will cancel each other. Frequently, sensor leads are made from the same material as the cryostat wires. Therefore, there is no significant thermocouple formed by this connection. In a four-wire measurement scheme, only connections in the voltage sense lines can cause measurement errors. So, the sense wires should have adjacent contacts in a multi-pin connector in order to minimize any temperature difference between them. Caution: Any disconnected inputs to the monitor should be configured to a sensor type of 'None'. This will turn the input off and prevent the highimpedance preamplifiers from drifting into a latch-up state. Recommended color codes for a sensor cable are as follows: Color Code Signal Pin White Excitation(+) 5 Green Excitation(-) 1 Red Sense(+) 4 Black Sense(-) 2 Table 19: Sensor Cable Color Codes The cable used is Belden 8723. This is a dual twisted pair cable with individual shields and a drain wire. The shields and drain wire are connected to the connector's metal backshell in order to complete the shielding connection. A four-wire connection is recommended in order to eliminate errors due to lead resistance. Cryogenic 104 applications often use fine wires made from specialty metals that have low heat conduction. This results in high electrical resistance and, therefore, large measurement errors if the four-wire scheme is not used. Four-wire connection to diode and resistive type sensors is diagrammed below: Figure 4: Diode and Resistor Sensor Connections Thermocouple connections Thermocouple sensors require the use of an external thermocouple module option. All thermocouple connections must be made at the module's input connector since this connector is thermally anchored to an internal sensor that is used for Cold Junction compensation. Sensor connection is made at the screw terminals. Proper polarity of the sensor wires is required. Polarity is marked on the input connector and a summary of common thermocouple polarities is given in the table below. The input connector should have its plastic back-shell and rubber grommet installed in order to prevent local air currents from generating errors in the cold junction circuitry. It is recommended that the thermocouple sensor be electrically isolated, or floating, from any surrounding circuits or grounds. This will ensure the highest possible measurement accuracy. Additional discussion on thermocouple and grounding issues can be found below in the “Using Thermocouple Sensors” section below. Type (+) Terminal (-)Terminal E Chrome, Purple Constantan, Red K Chrome, Yellow Aluminum, Red T Copper, Blue Constantan, Red Chromel, Silver Gold, Gold Chromel-AuFe Table 20: Thermocouple Polarities 105 Relay Connections Relay connections are made on the rear panel using the 3.5mm, 4-pin detachable terminal block provided. Pi n Function 1 Relay #1 N.O. 2 Relay #1 Common. 3 Relay #2 N.O. 4 Relay #2 Common. Table 21: Relay Connections Terminal block contacts are rated at 10.0A. Relay contact ratings are 10A@125 VAC, 5A@250VAC or 5A@30VDC. Ethernet (LAN) Connection The 10/100-BaseT Ethernet network (RJ-45) system is used by the monitor for Ethernet network connectivity. The 10/100 Mbps twisted-pair Ethernet system operates over two pairs of wires. One pair is used for receiving data signals and the other pair is used for transmitting data signals. This means that four pins of the eight-pin connector are used. Figure 5: LAN RJ-45 Pinout 10/100-BaseT Straight Through (Patch) Cable When connecting the monitor to a hub or switch, a standard Category 5 'patch’ cable is used. This connects the instrument’s transmit lines to the hub’s receive lines etc. 10/100-BaseT Crossover Cable When connecting the monitor directly to the computer, the transmit data pins of the computer should be wired to the receive data pins of the monitor, and vice a verse. The 10/100-BaseT crossover cable should be used for this purpose. A crossover cable is usually a different color than the straight through patch cable. Power-Over-Ethernet Connection The instrument may be powered by an IEEE-802.3at Power-Over-Ethernet compatible powered hub or power injector. When connected to the RJ-45 input, the instrument will negotiate power requirements with the hub and then power itself from the Ethernet cable. Since power and data are taken from a single cable, wiring can be simplified. Power-Over-Ethernet supplies are NOT earth ground referenced. Some other connection between the instrument's chassis and earth ground should be fabricated in order to minimize noise coupling. 106 IEEE-488.2 Connections The optional IEEE-488.2 (GPIB) connection is installed by connecting the dongle to the Ethernet port using the crossover LAN cable provided. The interface will be configured by the instrument and will appear to your system as a standard IEEE-488.2 device. RS-232 Connections The monitor uses a DB-9 dual female null modem cable for RS-232 serial communication. The pin-out of the connector is as follows: Pin 1 2 3 4 5 Function NC RXD, Receive data TXD, Transmit data NC Ground Pin 6 7 8 9 Function NC NC NC NC Table 22: RS-232 DB-9 Connector Pinout An example cable is Digikey Inc. part number AE1033-ND. The wiring diagram for this cable is shown below. Note that communication with the monitor only requires connection of pins 2, 3 and 5. All other connections are optional. Figure 6: RS-232 Null Modem Cable 107 INDEX AC power Single-Point-Ground, ........................................................................................................................................................... 36 Accessories, ................................................................................................................................................................................... 7 Alarms clearing, ............................................................................................................................................................................... 26 enable, ................................................................................................................................................................................. 25 hysteresis, ............................................................................................................................................................................ 26 latched, .......................................................................................................................................................................... 11, 26 LED, ..................................................................................................................................................................................... 10 low temperature, .................................................................................................................................................................. 25 setpoint, ............................................................................................................................................................................... 25 visual, ................................................................................................................................................................................... 14 CalGen®, ................................................................................................................................................................................ 12, 19 Configuration Scripts, ................................................................................................................................................................... 91 Command tag, ..................................................................................................................................................................... 91 Comment tag, ..................................................................................................................................................................... 91 Complex tags, ...................................................................................................................................................................... 92 Example, ............................................................................................................................................................................... 93 Floatresponse tag, ............................................................................................................................................................... 92 Group tags, .......................................................................................................................................................................... 92 Model tag, ........................................................................................................................................................................... 91 Pause tag, ............................................................................................................................................................................ 92 Query tag, ............................................................................................................................................................................ 92 Response tag, ...................................................................................................................................................................... 92 XML, ................................................................................................................................................................................ 2, 91 Data Logging, ............................................................................................................................................................................... 31 Clearing, .............................................................................................................................................................................. 70 Count, .................................................................................................................................................................................. 70 Format, ................................................................................................................................................................................ 70 Interval, ................................................................................................................................................................................ 70 Reading, .............................................................................................................................................................................. 70 State, ................................................................................................................................................................................... 70 Display resolution, ............................................................................................................................................................................. 27 TC, ....................................................................................................................................................................................... 26 time constant, ...................................................................................................................................................................... 26 Enclosure, .................................................................................................................................................................................... 21 cutout, .................................................................................................................................................................................. 83 dimensions, .......................................................................................................................................................................... 21 Environmental, ..................................................................................................................................................................... 21 Panel Mount, ........................................................................................................................................................................ 83 Safety Concerns, ................................................................................................................................................................. 21 Safety Symbols, ................................................................................................................................................................... 21 Ethernet 10/100-BaseT, .................................................................................................................................................................... 106 configuration, ....................................................................................................................................................................... 28 connection, ........................................................................................................................................................................ 106 Factory Defaults, ............................................................................................................................................................ 51, 52 gateway, ............................................................................................................................................................................... 52 HTTP, ................................................................................................................................................................................... 51 IP, ............................................................................................................................................................................. 28, 51, 52 LabView™, ........................................................................................................................................................................... 51 patch cable, ................................................................................................................................................................. 51, 106 SMTP, .................................................................................................................................................................................. 51 subnet mask, ....................................................................................................................................................................... 52 TCP/IP, ....................................................................................................................................................................... 3, 51, 52 TIMEP, ................................................................................................................................................................................. 51 UDP, ................................................................................................................................................................................. 3, 51 108 Factory Defaults restoring, .............................................................................................................................................................................. 11 Firmware Update Utility FWutility.exe, ........................................................................................................................................................................ 78 introduction, ......................................................................................................................................................................... 78 IEEE-488 address, ............................................................................................................................................................................... 63 Configuration, ...................................................................................................................................................................... 52 connection, ........................................................................................................................................................................ 107 GPIB, ................................................................................................................................................................................... 52 specifications, ...................................................................................................................................................................... 20 Input Channel alarm outputs, ...................................................................................................................................................................... 20 audible alarm, ...................................................................................................................................................................... 20 Input Protection, .................................................................................................................................................................. 11, 19 Instrument Calibration Calibration Interval, .............................................................................................................................................................. 48 Calibration Services, ............................................................................................................................................................ 48 Procedure, .......................................................................................................................................................................... 48 Keypad POWER key, ........................................................................................................................................................................ 11 LED indicators, ............................................................................................................................................................................. 10 Relay deadband, ...................................................................................................................................................................... 61, 67 XE "Relay:DEADband"DEADband, ..................................................................................................................................... 61 DEADband, .......................................................................................................................................................................... 61 specifications, ...................................................................................................................................................................... 20 Remote Commands Data Logging, ...................................................................................................................................................................... 70 Returning Equipment, .................................................................................................................................................................... 6 RS-232 configuration, ....................................................................................................................................................................... 53 connection, ........................................................................................................................................................................ 107 specifications, ...................................................................................................................................................................... 20 S700 Color Codes, ........................................................................................................................................................................ 89 mounting, ............................................................................................................................................................................. 89 SCPI *IDN?, .................................................................................................................................................................................. 62 ESE, ............................................................................................................................................................................... 59, 62 ESR, ........................................................................................................................................................................ 58, 59, 62 Instrument Status Enable, ................................................................................................................................................... 58 Instrument Status Register, ................................................................................................................................................. 58 ISE, ................................................................................................................................................................................ 58, 59 ISR, ................................................................................................................................................................................ 58, 59 OPC command, ................................................................................................................................................................... 62 RST command, .................................................................................................................................................................... 62 Standard Event Register, ..................................................................................................................................................... 58 Standard Event Status Enable, ............................................................................................................................................ 62 STB, ............................................................................................................................................................................... 58, 59 sensor connection, .......................................................................................................................................................................... 19 Connection, .......................................................................................................................................................................... 36 Sensor fault, ..................................................................................................................................................................................... 10 selection, .............................................................................................................................................................................. 26 type, ..................................................................................................................................................................................... 26 units, ........................................................................................................................................................................ 10, 25, 26 Sensor Calibration Curve, ............................................................................................................................................................ 68 CRV file, ......................................................................................................................................................................... 32, 33 file format, ............................................................................................................................................................................ 68 LogOhms, ............................................................................................................................................................................ 77 109 Supported Sensors, ..................................................................................................................................................................... 12 Technical Assistance, ..................................................................................................................................................................... 5 Temperatue Units Selection, ........................................................................................................................................................ 26 Temperature Sensors Carbon Glass, .................................................................................................................................................................... 12 XE "Temperature Sensors:Cernox™"Cernox™, ............................................................................................................ 33, 76 Cernox™, ...................................................................................................................................................................... 12, 18 Cernox™, ............................................................................................................................................................................. 33 Cernox™, ............................................................................................................................................................................. 75 Cernox™, ............................................................................................................................................................................. 76 Cernox™, .............................................................................................................................................................................. 97 Cernox™, ............................................................................................................................................................................. 97 Cernox™, ............................................................................................................................................................................. 97 Cernox™, ............................................................................................................................................................................. 97 Cernox™, ............................................................................................................................................................................. 97 Cernox™, ............................................................................................................................................................................. 97 Cernox™, ............................................................................................................................................................................. 97 Cernox™, ............................................................................................................................................................................. 98 connection, ........................................................................................................................................................................ 103 constant-voltage, ................................................................................................................................................................. 18 XE "Temperature Sensors:XE "Temperature Sensors:GaAlAs diode"CP-100"CP-100, ........................................................ 7 CP-100, .................................................................................................................................................................................. 7 XE "Temperature Sensors:GaAlAs diode"CP-100, ................................................................................................................ 7 DT-470, ................................................................................................................................................................................ 73 DT-670, ................................................................................................................................................................................ 73 GaAlAs diode, .................................................................................................................................................................. 7, 12 Gallium-Arsenide, ................................................................................................................................................................ 19 Germanium, .................................................................................................................................................................. 12, 18 GP-100, ................................................................................................................................................................................. 7 NTC resistor, ........................................................................................................................................................................ 18 Platinum, .............................................................................................................................................................................. 17 XE "Temperature Sensors:Platinum RTD"Platinum RTD, ..................................................................................................... 7 Platinum RTD, ........................................................................................................................................................................ 5 Platinum RTD, ........................................................................................................................................................................ 7 Platinum RTD, ........................................................................................................................................................................ 7 Platinum RTD, .................................................................................................................................................................... 12 Platinum RTD, ...................................................................................................................................................................... 16 PT10K, ................................................................................................................................................................................. 73 PT1K, ................................................................................................................................................................................... 73 R400, ............................................................................................................................................................................... 7, 73 R500, ..................................................................................................................................................................................... 7 Rhodium-Iron, ........................................................................................................................................................ 12, 17, 73 RO-600, ............................................................................................................................................................................... 73 RTD, ..................................................................................................................................................................................... 73 Ruthenium Oxide, ................................................................................................................................................................ 18 Ruthenium-Oxide, ........................................................................................................................ 7, 12, 33, 73, 76, 95, 98, 99 S900, ................................................................................................................................................................................... 33 S900, ............................................................................................................................................................................... 7, 94 self-heating, ......................................................................................................................................................................... 18 SI-410, ................................................................................................................................................................................. 73 silicon diode, ........................................................................................................................................................................ 94 Silicon Diode, ................................................................................................................................... 7, 12, 17, 36, 48, 49, 103 Thermal EMF, .................................................................................................................................................................... 104 Thermistors, ......................................................................................................................................................................... 18 thermocouple, ................................................................................................................ 12, 19, 34, 35, 67, 73, 75, 100, 105 Wiring, ................................................................................................................................................................................ 104 XP-100, .................................................................................................................................................................................. 7 XP-1K, ................................................................................................................................................................................... 7 Time constant filter Re-seeding, ......................................................................................................................................................................... 11 time-constant filter, ........................................................................................................................................................... 11, 63, 64 Unit Name, ............................................................................................................................................................................. 63, 69 110 USB Option configuration, ....................................................................................................................................................................... 53 Utility Software 340 format, ........................................................................................................................................................................... 37 XE "Utility Software:CalGen"CalGen, .................................................................................................................................. 46 CalGen, ................................................................................................................................................................................ 46 calibration curve, .................................................................................................................................................................. 42 CRV, ..................................................................................................................................................................................... 40 CRV format, ......................................................................................................................................................................... 37 Curve 340, ........................................................................................................................................................................... 40 Data Logging, ................................................................................................................................................................ 43, 44 Strip Chart, ........................................................................................................................................................................... 43 111