1
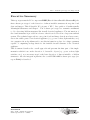
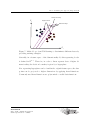
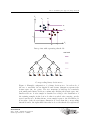
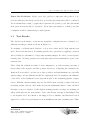
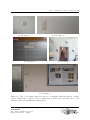
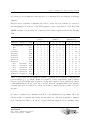
D5.2 Shape grammars for almost invisible
objects
Software prototype v1
DURAARK
FP7 – ICT – Digital Preservation
Grant agreement No.: 600908
Date: 2014-09-30
Version 1.0
Document id. : duraark/2014/D.5.2/v1.0
D5.2 – Software prototype v1 | Page 1 of 49
Grant agreement number
:
600908
Project acronym
:
DURAARK
Project full title
:
Durable Architectural Knowledge
Project’s website
:
www.duraark.eu
Partners
:
FhA – Fraunhofer Austria [AT]
CITA – KUNSTAKADEMIETS ARKITEKTSKOLE [DK]
Project instrument
:
EU FP7 Collaborative Project
Project thematic priority
:
Information and Communication Technologies (ICT) Digital Preservation
Project start date
:
2013-02-01
Project duration
:
36 months
Document number
:
duraark/2014/D.5.2/v1.0
Title of document
:
Shape grammars for almost invisible objects – Software prototype v1
Deliverable type
:
Software prototype
Contractual date of delivery
:
2014-09-30
Actual date of delivery
:
2014-09-30
Lead beneficiary
:
FhA
Author(s)
:
Robert Viehauser <[email protected]> (FhA)
Ulrich Krispel <[email protected]> (FhA)
Martin Hecher <[email protected]> (FhA)
Martin Tamke <[email protected]> (CITA)
Responsible editor(s)
:
Martin Hecher <[email protected]> (FhA)
Quality assessor(s)
:
Raoul Wessel <[email protected]> (UBO)
Thomas Krijnen <[email protected]> (TUE)
Approval of this deliverable
:
Stefan Dietze <[email protected]> (LUH) – Project Coordinator
Marco Fisichella <[email protected]> (LUH) – Project Manager
Distribution
:
Public
Keywords list
:
object detection, shape grammar, computer vision, point clouds
DURAARK
FP7 – ICT – Digital Preservation
Grant agreement No.: 600908
D5.2 – Software prototype v1 | Page 2 of 49
Executive Summary
This report presents the D5.2 component RISE (Reveal almost Invisible StructurEs), the
first software prototype for the detection of almost invisible structures from point cloud
data and images. This deliverable D5.2 is part of WP5, “Recognition of Architecturally
Meaningful Structures and Shapes”. The software prototype is a semantic enrichment
tool for detecting hidden structures like in-wall electrical appliances. The information of
the found structures is provided in a form so that it can be stored in a long-term archival
system. The technical approach is to use point cloud and image data from a laser scan to
detect the visible parts of an electrical appliance (e.g. power sockets, light switches, etc.)
via computer vision algorithms and to use this information as base for a shape grammar
capable of outputting an hypothesis for the invisible in-wall elements of the electrical
appliance.
This document describes the overall approach and presents the first part of the implementation which focus on the detection of observable objects (e.g. power sockets, light
switches, etc.) as a necessary step for the later detection of almost invisible or hidden
structures. Also the integration plan into the overall DURAARK software prototype (see
report D2.4) is described.
DURAARK
FP7 – ICT – Digital Preservation
Grant agreement No.: 600908
Table of Contents
1
Introduction . . . . . . . . . . . . . . . . . . . . . . . . . . . . . . . . . .
4
2
DURAARK RISE (Reveal Invisible StructurEs) . . . . . . . . . . . . . .
6
2.1
Approach . . . . . . . . . . . . . . . . . . . . . . . . . . . . . . .
6
2.2
User Manual . . . . . . . . . . . . . . . . . . . . . . . . . . . . . .
8
2.3
Integration into the DURAARK Workbench . . . . . . . . . . . .
12
Technical Implementation . . . . . . . . . . . . . . . . . . . . . . . . . .
15
3.1
Related Work . . . . . . . . . . . . . . . . . . . . . . . . . . . . .
15
3.2
Software Design . . . . . . . . . . . . . . . . . . . . . . . . . . . .
19
3.3
Test Results . . . . . . . . . . . . . . . . . . . . . . . . . . . . . .
34
Decisions & Risks . . . . . . . . . . . . . . . . . . . . . . . . . . . . . . .
40
4.1
Technical decisions and impacts . . . . . . . . . . . . . . . . . . .
40
4.2
Risk assessment . . . . . . . . . . . . . . . . . . . . . . . . . . . .
41
5
Licenses . . . . . . . . . . . . . . . . . . . . . . . . . . . . . . . . . . . .
43
6
Conclusions & Impact . . . . . . . . . . . . . . . . . . . . . . . . . . . .
44
6.1
RISE . . . . . . . . . . . . . . . . . . . . . . . . . . . . . . . . . .
44
6.2
Workbench Integration . . . . . . . . . . . . . . . . . . . . . . . .
46
References . . . . . . . . . . . . . . . . . . . . . . . . . . . . . . . . . . . . . .
49
3
4
3
D5.2 – Software prototype v1 | Page 4 of 49
1
Introduction
The creation of 3D scans of buildings today requires a high investment of time and money.
It is therefore meaningful to make extensive use of archived scans from future long-term
archival systems in order to extract information on buildings. The semantic enrichment
tools developed in the DURAARK work packages 4 and 5 provide means to find architectural meaningful structures and elements in unstructured 3D point clouds.
Some important architectural elements, e.g. the visible parts of electric appliances, normally switches and sockets, are however hard to detect on a geometrical level within point
clouds. The reason is that the geometric deviation of these objects from their surrounding architectural surfaces (usually the wall they are embedded in) is in the magnitude of
the regular scattering of points from a laser scan, which is 2-5mm in the case of typical
indoor scans.
The task 5.2 of the DURAARK project investigates hence means to find these almost invisible objects. This is important, as owners and facility managers of buildings today are
lacking information about the exact position and amount of their electrical outlets and
light switches. Current architectural building information, as electrical 2D plan drawings,
describes their position often on a symbolic level only. The imprecision of this information is worsened through the often hectic situation on building sites. Precise information
about electrical appliances is however necessary for better planning and cost estimation
of maintenance tasks. In addition to obtaining a general overview of these entities of the
building, this information may be used further for the planning of the placement of e.g.
electrical equipment and functions with a certain need regarding power outlets within the
building or even for the planning of refurbishment of the building. This might concern
the planning of the room occupation, as well as the overall spatial layout.
DURAARK
FP7 – ICT – Digital Preservation
Grant agreement No.: 600908
D5.2 – Software prototype v1 | Page 5 of 49
The software prototype described in this report is responsible for ”Revealing almost
Invisible StructurEs” and is named RISE henceforth. RISE detects almost invisible or
hidden objects in electrical applicances within 3D point clouds and provides semantic
information about their type and location. This information can be used with other
tools developed in the DURAARK project, allowing stakeholders (e.g. building owners)
to understand and control whether their electrical system in the building is installed
correctly in performing a difference analysis between the planned 3D Building Information
Model (BIM) and semantically enriched point cloud scans taken on the building site
during construction time.
This report provides an overview of the approach on how to detect almost invisible features from images and point cloud data and a description of the developed data workflow
and processing pipeline in the standalone application RISE. The current version includes
the specification of the systems components such as the vision pipeline, feature descriptor
and machine learning classifier, as well as a user manual for the application in Section 2.2.
Currently RISE is not yet integrated in the overall DURAARK Workbench (see D2.4).
The integration will be part of the next WP2 deliverable in M30, the plan towards the
integration is described in Section 2.3.
DURAARK
FP7 – ICT – Digital Preservation
Grant agreement No.: 600908
D5.2 – Software prototype v1 | Page 6 of 49
2
DURAARK RISE (Reveal Invisible StructurEs)
This section describes the approach taken by the software prototype RISE and includes
a user manual for the tool. The section also includes the future plan to integrate the currently standalone executable RISE into the DURAARK Workbench, which is described
in report D2.4.
2.1
Approach
The approach taken for this tool is based on the fact that archived data from 3D scans
usually contains not only 3D point information, as contemporary 3D documentation
hardware combines 3D laser scanners with cameras. The linkage of visual information
from the images with 3D geometry represented in point clouds provides a new point of
departure to derive architecturally meaningful information.
Report D7.1 shows that it is very common today to document spaces not only with a
3D scanner, but to use its built-in camera to capture images referenced in the 3D point
clouds. The resulting images cover the whole scanned sphere and become an important
part of the 3D documentation of buildings. Commercial products such as FARO Scene1
utilize the single images to create panoramic images (see Figure 1 for an example) that
are mapped onto the 3D point clouds in a further step.
The resulting coloured point clouds are an industry standard today and allow for a
better, more realistic and atmospheric perception of the documented spaces. A second
application of the created panoramas is the use as lightweight access copies of 3D scans.
Commercial products as FARO webshare2 couple a 3D point cloud stored on a server
with a panoramic image. This is sent as a lightweight access copy to users instead of
1
2
http://www.faro.com/en-us/products/faro-software/scene/overview
http://www.faro.com/products/faro-software/scene-webshare-cloud/overview
DURAARK
FP7 – ICT – Digital Preservation
Grant agreement No.: 600908
D5.2 – Software prototype v1 | Page 7 of 49
Figure 1: Panoramic image created within the Postprocessing of 3D scan data
large-sized 3D point clouds. This way users are enabled to interact with point clouds
in real-time, e.g. for measuring, marking and exploration. Typical uses are panning,
zooming, rotating and moving to the next scanner position.
However, these images contain additional information about the scanned objects, which
is not or only hardly represented in the point clouds themselves. This concerns all colour
and material information - visible, but geometrically not present - and information on
objects that are typically just slightly elevated from the surrounding surface, such as wallmounted signs and technical fittings. The latter include most visible electrical fittings, as
sockets, light switches and (if visible) distribution- and cavity sockets. As the placement
of these fittings in walls follows rules and standards one can as well infer on the position
of the connecting cables, or even the overall electric system within a room.
While the above mentioned objects are almost invisible on the geometrical level of 3D
scans, they are usually well visible in images. This applies even to very low contrast
objects on white walls, for instance if they cast shadows because of direct or ambient
illumination. Those visual hints usually provide enough detail in an image for a computer
vision algorithm to detect the contours of a nearly invisible object. The result of this
DURAARK
FP7 – ICT – Digital Preservation
Grant agreement No.: 600908
D5.2 – Software prototype v1 | Page 8 of 49
object detection step will be a set of images with mark-ups for the identified components
(e.g. a light switch) along with a confidence for their real existence. The position of the
technical appliances can be registered again in the 3D space of the laser scans.
These mark-ups are then serving as input for synthesis of almost invisible structures
using shape grammars. The grammar represents the rules, according to which power
and water lines are installed; the mark-ups in the images are the terminal symbols. A
3D structure will be generated, which represents the known inputs (e.g. light switches,
respectively terminal symbols) best. The deduction of this information from 3D scans
opens completely new ways to access archived data.
2.2
2.2.1
User Manual
Prerequisites and Installation
The software prototype can be downloaded via the URL https://github.com/DURAARK/
RISE/releases/download/v0.2/RISE-v0.2.zip. The downloaded file is a ZIP archive
that has to be extracted to an arbitrary folder on the user’s harddisk. The software
expects a Windows 7 or Windows 8 (up to 8.1) operating system (64bit). Example test
and training data are shipped with the software prototype.
2.2.2
Usage
The executable is implemented as command line tool that can be launched via the command prompt, it accepts several parameters.
Depending on these, two different modes are executed:
• Training mode: Before the computer vision algorithm is able to detect sockets and
switches on an input image, the algorithm has to be configured and trained in advance. The essential data of the training result, as well as the pipeline configuration,
DURAARK
FP7 – ICT – Digital Preservation
Grant agreement No.: 600908
D5.2 – Software prototype v1 | Page 9 of 49
is stored in an XML file after training was performed successfully.
In this mode, the user has to provide a set of training patches embodied by a folder
containing “.jpg” or “.png” image files. In order to code the class labels of the
training images, their filename has to start with the corresponding class label followed by an underscore (for instance: 1 trainingimage001.jpg). The class labels
have to follow the convention: 0 = negative examples, 1 = sockets, 2 = switches.
• Testing mode: In this mode the program performs a detection of sockets and
switches on a given set of images. Again, “.jpg” and “.png” files are supported.
The pipeline and the classifier are configured according to a loaded XML data file
that was created in training mode. The test images are supposed to be orthophotos
of walls or wall-segments, having a fixed relation to their physical dimension of 1px
per mm2 . For each of those images, a new XML file and an output image will be
created that store and visualize the detection results, respectively.
The execution parameters are explained in detail below:
• -1 [-2..-5]: Pipeline configuration (required for training)
This parameters specify the pipeline configuration of the corresponding channel (1
to a maximum of 5) by a string of keywords. Each keyword adds a module to the
corresponding channel. Since an algorithm is applied on the output data of a previous module, the order of the keywords is important. The different module keywords
within one channel have to be delimited by a comma (for example: -1 grad,pca
or -2 canny,dist,brief). The user has to numerate the channels without any
missing number, i.e. when -3 is specified, also -1 and -2 must exist.
If neither a feature extractor nor a subspace module is assigned to a channel configuration, the classifier interprets the full image as feature vector.
The framework takes the following keywords:
DURAARK
FP7 – ICT – Digital Preservation
Grant agreement No.: 600908
D5.2 – Software prototype v1 | Page 10 of 49
– grad: Gradient image preprocessing filter: calculated by superposition of Sobel
filter responses
– canny: Binary edge map image preprocessing filter: by applying the Canny
edge detector
– dist: Distance transform image preprocessing filter: Requires binary image,
in this deliverable only makes sense in combination with “canny”
– hog: HOG feature descriptor
– brief: BRIEF feature descriptor
– pca: PCA data compression
• -f: Classifier (required for training)
This parameter defines which algorithm is used for the classification task by analyzing the (concatenated) vector given from the specified feature channels. When this
parameter is given, the executable is set to training mode. Otherwise, the previous
parameters are neglected and testing is performed.
The following values are accepted in this deliverable:
– svm: Support Vector Machine
– rf: Random Forest
• -c: Configuration file (always required)
This specifies the name of the file that contains the setup of the vision pipeline and
the data to restore the trained classifier. In training mode this file will be created
(or overwritten if already existing), whereas in testing mode it is used to initialize
the vision pipeline. The name given in the command line will be automatically
extended by “.xml” if this postfix not already present.
DURAARK
FP7 – ICT – Digital Preservation
Grant agreement No.: 600908
D5.2 – Software prototype v1 | Page 11 of 49
• -d: Training/Testing image folder (always required)
Depending on the executed mode, this parameter defines the relative path to the
folder containing the training- or the test-images (an example trainings and test
image set is provided with the installation).
Example Meaningful Vision Pipeline Configurations
• Train the vision pipeline by using the HoG descriptor and SVM classifier with the
training patches from a folder named “training-set”. Store the training results to
“config.xml”:
rise.exe -1 hog -f svm -d training-set -c config.xml
• Same as above with replacing the classifier by a Random Forest:
rise.exe -1 hog -f rf -d training-set -c config.xml
• Train the detection algorithm with gradient images described by the BRIEF descriptor. Use a Random Forest as classifier:
rise.exe -1 grad,brief -f rf -d training-set -c config.xml
• To combine the above methods and let the classifier choose the best features, set
up multiple feature channels. As classifier, use a SVM:
rise.exe -1 hog -2 grad,brief -f svm -d training-set -c config.xml
• Try to learn the Canny edge representation of the objects. In order to add more information per pixel to the image patches, subsequently perform a distance transform
on the Canny edge result. As already mentioned, this configuration is supposed to
perform relatively bad:
rise.exe -1 canny,dist,brief -f rf -d training-set -c config.xml
DURAARK
FP7 – ICT – Digital Preservation
Grant agreement No.: 600908
D5.2 – Software prototype v1 | Page 12 of 49
• To apply a previously learned vision pipeline on a set of test images stored in a
directory named “test-set”, execute
rise.exe -d test-set -c config.xml
The result files will be stored within the test-set folder.
2.3
Integration into the DURAARK Workbench
The DURAARK Workbench is the central graphical user interface (GUI) in DURAARK
for stakeholders to perform use cases in the field of long-term archival of BIM data. The
functionality of the GUI is provided by components which are developed in the different
work packages in form of software deliverables. The Workbench is combining those components and provides a coherent user interface for them. The RISE component described
in this report is a tool that belongs to the Geometric Enrichment block developed in WP4
and WP5. Figure 2 shows the abstract architecture of the DURAARK Workbench, with
the other geometric enrichment components highlighted in blue. The architecture was
build to integrate different types of components into the Workbench, namely web-based
services and desktop applications. RISE belongs to the desktop application type and will
be integrated into the Workbench’s user interface as part of the ”Geometric Enrichment”
workflow, together with the point cloud components developed in D4.1 and D5.1. The
integration mechanism is provided by the underlying DURAARK Framework, Figure 3
shows its design overview. The integration mechanism is highlighted in the lower right
of the figure, a detailed description of the mechanism can be found in the report D2.4,
Section 3.1.1. A description of the ”Geometric Enrichment” workflow is given in D2.4,
Section 1.
At this point in time the integration of the component into the Workbench is not finished
yet. It will follow as part of the development towards the next deliverable in WP2 which is
DURAARK
FP7 – ICT – Digital Preservation
Grant agreement No.: 600908
D5.2 – Software prototype v1 | Page 13 of 49
WP4/5
Geometric Enrichment
Initial data from authoring application (REVIT etc.)
or Laser Scanning
Registration
Hidden Structure
Detection
IFC/PC Augmentation
Difference Analysis
IFC Extraction
Access Copy
Generation
IN: IFC-SPF, (IFC-SPF,E57),
(E57,E57), E57
7
E5
F
-SP
IFC
OUT: (IFC-SPF,E57,ifcPC.rdf)
57
F,E
PC
,ifc
f)
.rd
5
,E
PF
C-S
(IF
(S)
DF
(S),
IFC
cR
DF
IN:
cR
L/if
if
/
W
cO
WL
cO
f, if
T: if PC.rd
OU
ifc
F
-SP
WP3
,
P
C-S
(IF
WP6
Semantic Enrichment
E57
IFC-SPF
ifcPC.rdf
ifcOWL
ifcRDF(S)
E
IF 57
if C-S
ifcO cRDF PF
.r
WL
/ifc df
RD
F(S
)
WP2
Preservation of Data
PreIngest Tool
Client
Search & Retrieval
PROBABO3D
Search Interface
SIP Transfer
(FTP)
Query semantic concepts
(REST/JSON)
Query / ResultList
(SOAP)
DIP Transfer
(REST)
SERVER
CLIENT
Semantic Enrichment
Authoring Tool
7,
Replace semantic
links
(REST/JSON)
Semantic Digital
Observer
PreIngest Tool
Server
PROBADO3D Ingest
(REST/JSON)
PROBADO3D
WebService
Rosetta-PROBADO
Connector
Semantic Digital
Archive
PROBADO3D
Index
SDA Snapshot
(FTP)
SDA Maintaining
Tool
Rosetta
Query semantic concepts
(REST/JSON)
Figure 2: Overall structure of the DURAARK approach, as described in D2.3. RISE
(highlighted in blue) compliments the other components of the Geometric Enrichment
block.
due in month 30 of the project. Section 6.1 gives an outlook on the upcoming integration
tasks of this tool into the Workbench.
DURAARK
FP7 – ICT – Digital Preservation
Grant agreement No.: 600908
D5.2 – Software prototype v1 | Page 14 of 49
Figure 3: DURAARK Framework overview with the integration mechanism for desktop
applications in the lower right.
DURAARK
FP7 – ICT – Digital Preservation
Grant agreement No.: 600908
D5.2 – Software prototype v1 | Page 15 of 49
3
3.1
Technical Implementation
Related Work
Current work mainly deals with detection of power lines from data where such structures
can be directly observed, which is an important task for the safety of unmanned aerial
vehicles (UAVs) [10], [14]. The detection of indoor power lines from measurements however has, to our knowledge, not been published in the scientific community. Our targeted
approach will be combining object detection from computer vision with shape grammars
which are mainly used in computer graphics.
3.1.1
Object detection
The vast field of object detection on images consists of many approaches, each designed
to make use of advantageous properties of a specific object category.
Since sockets and switches on the walls surface are mostly untextured and mainly defined
by their silhouettes, methods based on local, discriminative saliency points are supposed
to perform poor on this task.
In the recent past, detecting power sockets gained attention in the field of robotics in
order to build self-charging robots [3, 11]. Here the recognition task is basically done
by template matching, which is error-prone to varying perspectives and high intra-class
variability, e.g. different designs and models of sockets. In robotics applications, the robot
or camera is actively movable and thus able to investigate a wall segment from different
perspectives. Furthermore, typically only one specific socket type has to be recognized
and false negative detections (missed sockets) on a single image are not very critical in
the application context. Hence, simple template matching yields sufficient results in the
field of robotics.
DURAARK
FP7 – ICT – Digital Preservation
Grant agreement No.: 600908
D5.2 – Software prototype v1 | Page 16 of 49
When detecting objects with as few scans as possible, handling a wider range of view
angles becomes necessary. For this, a much more robust approach is to learn invariant
features by discriminative machine learning algorithms.
One of the trend-setting approaches on identifying objects by their global gradient appearance of the recent years is the “Histograms of oriented gradients for human detection”
by Dalal and Triggs [6]. This very discriminative and at the same time generalizing representation of silhouettes compiles discrete gradient histograms binned to their direction
over certain sub-image-patches (cells).
The sub regions consist of several overlapping areas of variable size, however, for brevity
a common visualization shows the occurence frequency of certain gradient directions by
oriented lines on a fixed-size, non-overlapping cell grid. An example is shown in figure
4. As classifier for the human detection task Dalal and Triggs used a Support Vector
Machine (SVM), which is described in more detail in Section 3.2.
Many novel object detection methods reuse the concept of the HoG descriptor combined
with a SVM classifier as basis in order to yield higher sophisticated algorithms. One of
them is the Deformable Part Model from Felzenszwalb et al. [7], which is currently one
of the best performing methods.
This algorithm is capable of detecting objects with varying spatial configuration of their
parts, for instance humans raising their hands. This is achieved using a SVM, simultaneously learning the appearance and the spatial configuration of the object parts by using
the HoG descriptor and a localization probability map, respectively. In order to train
such a SVM, an iterative method working with latent variables was developed. Thus, the
classifier used in this approach is called “Latent SVM”.
Since sockets and switches have a static appearance, for this report the basic HoG-SVM
approach is considered as proper approach for the recognition task.
Instead of learning one well engineered descriptor, another approach collects many sim-
DURAARK
FP7 – ICT – Digital Preservation
Grant agreement No.: 600908
D5.2 – Software prototype v1 | Page 17 of 49
(a) Input image
(b) Corresponding HoG values
Figure 4: Visualization of the Histogram of Gradients (HoG) descriptor applied on an
image of a human in order to detect objects with a similar silhouette. Figure 4a shows
the input image from which the descriptor was calculated. Figure 4b illustrates the
Histogram of oriented Gradients descriptor, where the length of the small lines in each
cell represent the strength of the gradient in their particular direction. Additionally, the
brightness of the lines codes their importance for the detection task, which corresponds
to the weights assigned by the trained SVM classifier. Both figures are taken from [6].
ple features of which the classifier selects the most proper ones yielding a strong feature
representation. In [9] power sockets (also cars, people and bicycles) were detected by
merging 7 different feature channels taken from a RGB camera and a 3D laser scanner
(namely the red-, blue-, green-color channel, intensity and a hue distance value, spatial distance and remission were used). For all channels they applied Haar-like wavelets
[13, 16] as feature descriptor. A subsequent AdaBoost classifier [8] then selects the best
discriminating features out of all different channels for the learned category.
DURAARK
FP7 – ICT – Digital Preservation
Grant agreement No.: 600908
D5.2 – Software prototype v1 | Page 18 of 49
3.1.2
Shape grammars
Shape grammars have been developed by Stiny et al. [15], originally to capture a formal
specification of the design of paintings. The concept is based on methods from formal
languages; a grammar consists of set of rules, a word in this grammar is a specific instance
of an object and all possible words of the grammar correspond to the whole design space.
Shape grammars have recently gained popularity in the computer graphics community
as a method for the automatic generation of variations of an object class (e.g. buildings
in a city) [12].
DURAARK
FP7 – ICT – Digital Preservation
Grant agreement No.: 600908
D5.2 – Software prototype v1 | Page 19 of 49
3.2
Software Design
In this section we explain the design of the system architecture and give an explanation
of the components.
The detection of objects using machine learning methods is a difficult task if the objects
are visible under arbitrary transformations (e.g. the perspective transformation of a camera). Therefore, a suitable canonical representation is desirable because a classification
will typically yield better result as an algorithm can be better tuned to discriminate between objects, and the amount of training data is significantly reduced as it has to be
supplied in one canonical form only. Therefore, the system needs to convert the input
data into the canonical representation, which is a two-dimensional orthographic image
(or orthophoto) at a specific resolution (mm/pixel). This modularization decouples the
computer vision part, i.e. training and classification, from the geometry processing part,
i.e. orthophoto generation. This allows to implement, test, and improve these aspects
separately. Furthermore, if geometric assumptions, e.g. all sockets are placed on planar
walls, turn out to be too limiting, only the orthophoto generation module has to be improved. Similar, the vision pipeline is decoupled in a way that different combinations of
algorithms for object classification can be evaluated.
3.2.1
Overall Architecture
An overview of all components of the system can be seen in Figure 5. The input to the
system consists of the following measurement data:
point clouds Those are acquired from range scans. At the moment we only consider the
scan acquired from one scanner position. If it is necessary to perform multiple scans
because of room geometry or size, the scans have to be aligned in a preprocessing
step, and either the scans are fused before running the pipeline, or the detections will
DURAARK
FP7 – ICT – Digital Preservation
Grant agreement No.: 600908
D5.2 – Software prototype v1 | Page 20 of 49
Figure 5: Overall software architecture of the system. Green boxes correspond to the
input data, red boxes correspond to prior knowledge, blue boxes correspond to intermediate results (the interface between modules). The final result is shown with a thicker
border. Black boxes represent the software modules of the system.
be carried out on each scan separately, and resulting detections are fused afterwards.
photos / panoramic images Additional information stems from visual data taken either by a scanning device, or manually using a camera. The images have to be
registered to the point cloud data, e.g. the camera position and orientation is
known for each image.
geometry / metadata A coarse geometry, either supplied by automatic or manual reconstruction is needed for preprocessing. Additional important information is the
knowledge of which parts of the geometry correspond to walls, and the connectivity
information of rooms.
The system processes the data in the following manner:
DURAARK
FP7 – ICT – Digital Preservation
Grant agreement No.: 600908
D5.2 – Software prototype v1 | Page 21 of 49
1. The input data is partitioned into rectangular regions of interest, in which relevant
objects could be detected. These regions correspond to wall segments. The Orthophoto generation component generates an orthophoto for each wall segment for
each supplied input photo or panoramic image, as well as the transformation information from the 2D orthophoto coordinate system to the 3D coordinate system of
the 3D model / point cloud.
2. The vision pipeline operates on rectangular images of predefined size, which roughly
corresponds to the size of the objects of interest (e.g. sockets), which we call patches.
The Patch extraction component will extract such patches from a given orthophoto.
For now, this component will perform a sliding window approach and perform the
search on the whole orthophoto. If necessary, this procedure can be speed up in the
future by using interest point detectors to detect salient points in the orthophoto
and reduce the search space to such points of interest.
3. The vision pipeline itself operates on patches and can be grouped into three stages:
the preprocessing stage, the feature extraction stage, and the classification stage. In
the first two stages the patch is transformed to a representation vector in a feature
space. The classification stage, which was pre-trained with feature representations
of categories of objects (e.g. sockets) decides if a patch classifies into one of the
pre-trained categories.
4. After the classification the decision is propagated back to the patch extraction
stage, which will transform positive detections back into the orthophoto position.
Detections from patches are collected for a whole orthophoto.
5. The detections inside one orthophoto are then projected back to 3D, using the
transformation of the corresponding wall segment. This yields small rectangular
DURAARK
FP7 – ICT – Digital Preservation
Grant agreement No.: 600908
D5.2 – Software prototype v1 | Page 22 of 49
regions in 3D that correspond to a detection of an object (e.g. sockets) which are
registered to the point clouds / geometry.
6. The last module in this chain is the power line predictor component. This component will create possible power line configurations given the observed detections.
The power lines will be synthesized from hypothesis created from the position of
detections and prior knowledge, e.g. preferred regions in walls for power lines.
3.2.2
Components
In this report only the vision pipeline component is described in detail. In future releases
of the document more components (e.g. the power line predictor) will be added.
Patch extraction and processing The computer vision part expects an orthophoto as
input, whose dimension corresponds to the physical dimension of the examined wall/wallsegment (1px/1mm2 ). This orthophoto is scanned by a sliding window of fixed size,
whereon the detection of switches and sockets is performed by the vision pipeline.
Positive detection results are then visualized on the input image and their 2D coordinates
(measured relative to the input image) are stored to an XML file.
Vision Pipeline Traditional image classification tasks in computer vision can be divided into three submodules, defined by their incoming and outgoing data types: Image
preprocessing, feature extraction and classification.
Since there exist a huge number of various approaches for all three processing steps, finding the best suited tool-chain of algorithms for this specific object detection task can be
quite time-consuming.
Hence, for this software prototype a modular vision pipeline equipped with some standard approaches was developed that allows quick evaluation of different configurations.
DURAARK
FP7 – ICT – Digital Preservation
Grant agreement No.: 600908
D5.2 – Software prototype v1 | Page 23 of 49
A more detailed description of the three submodules is given below:
• Image preprocessing: This module operates on image level only. From a given input
image, an output image is calculated aiming at enhancing the visual information
in respect to the overall recognition objective. The searched objects in the given
images have low contrast and are mainly defined by edges defined by their shape.
Thus, reasonable image preprocessing methods are supposed to increase the ratio
of the gradient-induced information.
As examples we implemented a gradient image calculation via Sobel filters, the more
intrusive Canny edge-detection algorithm and the distance transform for subsequent
processing of binary images.
An example of the implemented preprocessing methods is shown in figure 6.
– Gradient Image: Applied on a given input image, this module calculates the
responses of a Sobel filter in both x- and y-direction. The final gradient image
is a superposition of the absolute values of the filter responses.
– Canny edge detector : This algorithm results in a binary edge map according
to the approach of John Canny in [5]. Unfortunately, its outcome is very
sensitive to its parameters. This fact in combination with the high variety of
the gradient strengths in our images can make this preprocessing method less
suitable for our purpose. Nevertheless, it was implemented in this software
prototype for experimental purposes.
– Distance transform image: In order to prepare a binary edge map for further
processing it is often useful to calculate a distance transform image. For each
pixel this representation caclulates the distance to the nearest non-zero pixel
of the input image.
DURAARK
FP7 – ICT – Digital Preservation
Grant agreement No.: 600908
D5.2 – Software prototype v1 | Page 24 of 49
Origin image
Gradient image
Canny edge filter
Distance transform of
the Canny edge image
Figure 6: The implemented preprocessing methods applied on a sample image. The
gradient image and the Canny edge filtered image are calculated from the original
picture. For the distance transform representation the canny image was used as
input. For visibility reasons, the value range of the latter image was stretched in
the visualization.
• Feature descriptor: The algorithms of this building block attempt to represent the
essential visual content of an image as data vector, where similar content should
be assigned to similar data points in the feature space. This yields a generalization
of the visual appearance and inherently performs a reduction of the dimensionality
for the classification problem. Again, various algorithms exist, each focusing on
different objectives.
The objects subject to detection are characterized by their static, unobtrusive nature and do not possess any highly discriminating key-features. Thus, we focus on
DURAARK
FP7 – ICT – Digital Preservation
Grant agreement No.: 600908
D5.2 – Software prototype v1 | Page 25 of 49
feature descriptors aiming to describe the overall appearance of an (preprocessed)
input image patch.
For this software prototype the Histogram-of-Oriented-Gradients (HOG) descriptor
and the BRIEF descriptor are implemented.
– Histogram of oriented Gradients (HOG) [6]: This feature representation was
successfully applied in various fields of computer vision. It codes the spatial
distribution of gradients in sub-patches (cells) of an image by calculating histograms of gradients discretely binned to their direction. For an example refer
to Section 3.1.
– BRIEF [4]: This descriptor evaluates many randomly chosen relations of intensity values all over the image and thus represents the image content very
efficiently. A single relation is defined by a simple comparison of pixel values
yielding a binary result (e.g. I(x1 ) > I(x2 ) or similar). The final feature vector
is built by concatenating the results of all selected binary tests.
• Machine learning classifier: The last module of the vision pipeline assigns semantic
class labels to a given sample represented as data point. Before such algorithms can
predict the class a given data point belongs to, they need to be trained in advance
with example descriptor vectors sufficiently representing all different classes. This
collection of samples is called the training set.
Basically, machine learning approaches can be split up into two groups: supervised
and unsupervised methods.
Supervised methods aim to finding the optimal discriminating information for different classes by analyzing the training set by taking known class labels into account.
Unsupervised methods attempt to form meaningful clusters just from the distribution of all training samples without considering any class information.
DURAARK
FP7 – ICT – Digital Preservation
Grant agreement No.: 600908
D5.2 – Software prototype v1 | Page 26 of 49
The first group of classifiers usually performs better, for the second group creating
a training set is much easier.
Due to the high variety of non-interesting objects within a room we cannot expect
an unsupervised machine learning algorithm to form three clusters that match sockets, switches and all others just from unlabelled training images. Hence we focus on
supervised machine learning algorithms, for which a sufficient amount of annotated
training patches is necessary.
Because of their successful application in computer vision, the Support Vector Machine (SVM) and the Random Forest classifier are chosen for this software prototype.
– Support Vector Machine [1]: SVMs try to calculate the optimal decision boundary between samples of different classes. Figure 7 illustrates the objective of
a linear SVM classifier in a two-dimensional feature space. At the training
stage the separating line is determined based on where the margin to the
training samples of the different classes is maximized and thus considered optimal. As the found solution only depends on the data points closest to this
linear separator, a SVM is completely described by these “support vectors”.
The classification on a certain test data point is performed by determining on
which side of the line the point is located.
DURAARK
FP7 – ICT – Digital Preservation
Grant agreement No.: 600908
D5.2 – Software prototype v1 | Page 27 of 49
Decision boundary
F2
Support Vectors
Maximum margin
F1
Figure 7: Methodology of an SVM learning to discriminate different classes by
providing training examples.
Generally, in a feature space of the dimensionality D, this separating border
is defined in RD−1 . Therefore, in order to linear separate data of higher dimensionality, the decision boundary is given by a hyperplane.
If no separating hyperplane can be found in the original feature space, the data
points can be projected to higher dimensions by applying kernel functions.
Commonly used kernel functions are polynomials or radial basis functions.
DURAARK
FP7 – ICT – Digital Preservation
Grant agreement No.: 600908
D5.2 – Software prototype v1 | Page 28 of 49
F2
n3
n6
n7
n1
n4
F1
n5
n2
Data points with separating thresholds
tree level
n1
n2
n3
n5
n4
n6
n7
p(class)
p(class)
p(class)
p(class)
p(class)
p(class)
p(class)
p(class)
class
class
class
class
class
class
class
class
Corresponding binary decision tree
Figure 8: Example configuration of a binary decision tree. At each node of
the tree a randomly chosen threshold and feature dimension separates the
feature space into two parts. The tree structure is build up by recursively
performing such binary decisions continuously dividing the feature space into
smaller sections. A test sample is classified according to the distribution of
the training samples in the leaf node that is reached after carrying out the
tests down the tree. In this scheme, a test sample is past to the left child node
if its value of the chosen feature dimension is lower than the corresponding
threshold and to the right child if its value is above the threshold, respectively.
DURAARK
FP7 – ICT – Digital Preservation
Grant agreement No.: 600908
D5.2 – Software prototype v1 | Page 29 of 49
– Random Forest [2]: Another supervised classifier concept that recently gained
much attention in the computer vision community aims at training an ensemble of random decision trees, known as Random Forest. A single tree is made
of simple binary “decisions nodes” (e.g. thresholding applied on one dimension
of the feature vector) arranged in a tree structure where in each leaf node the
class distribution of the training samples is estimated by compiling a histogram
during the training stage. An example of a trained binary decision tree with
randomly chosen tests is illustrated in figure 8.
The key to performance of the random forest classifier lies in the combination
of many such simple classifiers, yielding a strong classifier.
Therefore the single trees have to be built from various binary decisions which
are as independent as possible. This is achieved by the random selection of
features for each splitting node, which induces a good generalization of the
overall classifier.
In the past years many different versions and modifications of random forests
came up in order to improve classification results and/or computation time.
Vision Pipeline Extensions The vision pipeline concept described in Section 3.2.2
and illustrated in Figure 5 corresponds to a standard method of how this problem is addressed. In the following Subsection we introduce some additional extensions to enhance
the capabilities of the framework, which have been emitted in the prior description of the
pipeline for better comprehensibility.
DURAARK
FP7 – ICT – Digital Preservation
Grant agreement No.: 600908
D5.2 – Software prototype v1 | Page 30 of 49
The extensions are:
• A new module category of “subspace methods”, which performs data compression.
It can optionally replace a feature extractor module or compress a resulting feature
data vector. This algorithm aims at reducing the data dimensionality without
losing too much information in order to simplify the classification problem for the
classifier.
• To enable the classifier to choose the best discriminating features produced by various methods, the pipeline can be configured to evaluate multiple feature channels
in parallel. The classifiers input data is formed by concatenating the different result
vectors of each channel.
These extensions are optional and thus excluded from Figure 5 due to simplification.
Figure 9 shows the vision pipeline part with optional extensions.
Details on subspace methods Images and vectors, that are exchanged between all
the algorithms described above, can be interpreted as data points in a high-dimensional
space. Therefore, classical data compression methods can be applied in order to reduce
the data dimensionality with respect to preserving as many information as possible. In
terms of a computer vision pipeline, these algorithms can be applied on both images and
vectors, and therefore they cannot be assigned to one of the three strictly ordered groups
from above.
Hence, such data compression methods from the additional group of subspace methods
can be optionally placed either as feature extractor module, or as interlink between an
original feature extractor and the classifier.
In this software prototype, the Principal Component Analysis (PCA) was implemented
as data compression method to examine if the classifiers detection rate for power sockets
DURAARK
FP7 – ICT – Digital Preservation
Grant agreement No.: 600908
D5.2 – Software prototype v1 | Page 31 of 49
Training Data
[patches]
Training Data
[labels]
Extended vision pipeline
Subspace
Method
Image
patch
Preprocessing
Method
Filtered
patch(es)
Feature
Representation
(concatenated)
Feature vector(s)
Subspace
Method
Classifier
Subspace
Method
Preprocessing
Method
Filtered
patch(es)
Feature
Representation
Subspace
Method
Decision
Figure 9: The extended vision pipeline. The optional paths and modules are shown
as dashed lines. Since a subspace method can be applied on both images and feature
vectors, it can replace the feature extractor or used subsequently after a feature extraction
algorithm. Whereas this illustration contains a second feature channel, our software
prototype can be configured from 1 up to 5 different channels.
and light switches can be increased by reducing the data dimensionality significantly. In
an arbitrary data space, the principal component analysis determines a set of orthogonal
vectors in whose directions a given set of data points exhibit the highest variances. Hence,
these vectors represent the principal components of the given data.
Figure 10 shows an example of a set of two-dimensional data points and their principal
components.
Mathematically, the directions of the highest variances are determined by the eigenvectors
corresponding to the dominant eigenvalues of the data’s covariance matrix. The reduction
of the dimensionality of a data point is achieved by projecting it into a new coordinate
DURAARK
FP7 – ICT – Digital Preservation
Grant agreement No.: 600908
D5.2 – Software prototype v1 | Page 32 of 49
D2
Second principal component
First principal component
D1
Figure 10: Illustration of the principal components of a set of 2 dimensional data points.
The determined principal components are ordered according to the level of variance in
the corresponding direction.
system spanned by the most dominant orthogonal basis vectors, which are exactly those
eigenvectors or the principal components.
Thus, a compressed data point embodies the coefficients of a linear combination of those
basis vectors that optimal represents the original data point. The whole data compression
procedure is also known as Karhunen-Loéve transform.
When applying the PCA directly on images (i.e. all image pixels aligned to one high
dimensional vector), the observed principal components also represent images, which
are also called “Eigen-images” due to the mathematical background of the calculation.
Figure 11 shows the first 6 Eigen-Images of the positive training examples of our current
training set. Due to the high variability of the background class, in the implementation of
this software prototype the principle components are calculated from the positive training
examples only.
Although they are orthogonal basis vectors, for a human eye they look very similar
because all positive training images show similar objects.
DURAARK
FP7 – ICT – Digital Preservation
Grant agreement No.: 600908
D5.2 – Software prototype v1 | Page 33 of 49
In combination with the sliding window approach, the compressed data can also be interpreted as filter response or template matching scores when applying the Eigen-images
as filter kernels or templates.
For this reason, projecting a data point which was also used to calculate the projection
won’t cause a significant response in just one dimension. Thus, over-fitting is no concern
when training a SVM with the PCA-projected samples that were also used to “train” the
PCA itself.
1st dominant Eigen-img.
2nd dominant Eigen-img.
3rd dominant Eigen-img.
4th dominant Eigen-img.
5th dominant Eigen-img.
6th dominant Eigen-img.
Figure 11: The first six most dominant Eigen-images of the positive training set. In all of
them, the basic structure of a socket can be observed. When compressing an input image,
the coefficients are determined to optimally reconstruct it by a linear combination of such
images. In the current implementation, the query data is projected into an Eigen-space
consisting of a fixed number of 70 dimensions.
DURAARK
FP7 – ICT – Digital Preservation
Grant agreement No.: 600908
D5.2 – Software prototype v1 | Page 34 of 49
Power line Prediction In the power line predictor component, the position of detections with prior knowledge modeled by power line placement rules will be combined.
As an intermediate result, a graph that represents all possible power line placements
from given detections will be generated. From this representation, a final power line
configuration will be synthesized per wall segment.
3.3
Test Results
The detection performance of various vision pipeline configurations were evaluated on 5
different test images, which are shown in Figure 12.
For training, a self-annotated database of 41 power sockets and 13 light switches was
used. From each annotation, 10 training patches were generated by applying a random
jitter, yielding a total number of 540 positive training samples. In order to create negative
training data, 726 image patches were randomly extracted from unmarked regions of the
annotated set.
Table 1 lists the evaluation results of each configuration on each test image in terms of
true positive, false negative and false positive detections. Comparing the classifiers, the
Random Forest tends to produce more false positives and misclassifications, especially
when working on lower dimensional (PCA-compressed) data. Nevertheless, the influence
of the PCA on the classification rate depends mostly on the remaining pipeline configuration. With the current training data set, the HoG feature descriptor achieves the most
promising results, whereas other methods perform significantly inferior. Since the HoG
descriptor is more tolerant to badly aligned training patches, an improved training set
will possibly increase the performance of the other feature descriptors (including PCA)
to an adequate level. In contrast to the Support Vector Machine, the Random Forest is
supposed to yield worse performance from an insufficient amount of training data. Thus,
DURAARK
FP7 – ICT – Digital Preservation
Grant agreement No.: 600908
D5.2 – Software prototype v1 | Page 35 of 49
(a) Test image 1
(b) Test image 2
(c) Test image 3
(d) Test image 4
(e) Test image 5
Figure 12: The 5 test images that were used for evaluating different pipeline configurations. Especially on image 4 and 5 many false positives were detected, due to the
cluttered scene and insufficient training data.
DURAARK
FP7 – ICT – Digital Preservation
Grant agreement No.: 600908
D5.2 – Software prototype v1 | Page 36 of 49
its observed lower classification rate may also be compensated by providing more training
samples.
Whereas most 2-channel configurations seem to prefer the best features as expected,
the surprisingly low response of the SVM applied on the concatenation of the HoG and
BRIEF descriptor is probably also caused by the relative small variety in the training
data.
Configuration
Channel 1
(ground
HoG
HoG
Grad,Brief
Grad,Brief
HoG,PCA
HoG,PCA
Grad,PCA
Grad,PCA
HoG
HoG
HoG
HoG
HoG,PCA
HoG,PCA
Channel 2
True Pos.
(correct)
False Neg.
(missed)
False Pos.
(hallucinated)
Class.
I1
I2
I3
I4
I5
I1
I2
I3
I4
I5
I1
I2
I3
I4
I5
truth / desired)
RF
SVM
RF
SVM
RF
SVM
RF
SVM
Grad,Brief
RF
Grad,Brief SVM
Grad,PCA
RF
Grad,PCA SVM
Grad,PCA
RF
Grad,PCA SVM
1
1
1
1
1
1
1
0
1
1
0
1
1
1
1
2
2
2
1
1
0
2
1
2
2
0
1
2
2
2
6
6
6
4
3
4
6
4
6
6
3
6
6
4
6
4
3
3
1
1
2
2
2
2
1
0
3
2
2
3
2
2
2
1
1
1
2
1
2
1
1
2
2
1
2
0
0
0
0
0
0
0
0
0
0
1
0
0
0
0
0
0
0
1
1
0
0
1
0
0
2
0
0
0
0
0
0
0
2
3
0
0
2
0
0
3
0
0
0
0
0
1
1
3
3
0
2
1
0
3
4
1
0
1
0
0
0
0
1
1
0
0
1
0
0
1
0
0
0
0
0
0
0
0
0
0
0
0
0
0
0
0
0
0
0
0
0
0
0
0
0
0
0
0
0
0
0
0
0
0
0
2
1
5
0
5
1
24
18
2
0
1
2
3
0
0
16
4
10
9
45
20
71
87
21
0
26
47
21
42
0
7
2
26
21
38
8
95
22
5
0
6
25
16
14
Table 1: This table shows evaluation results of different vision pipeline configurations
for test images I1 to I5 , which contain 1,2,6,4 and 2 objects, respectively. True positives
denote correct detections, false negatives correspond to missed objects and false positives
count hallucinations. If an object was correctly detected but misclassified (for instance
a switch that was recognized as socket), its neither counted as true positive nor false
negative.
In order to estimate the computational effort of the implemented algorithms, the total
execution time of training and testing was measured for each various pipeline configuration, and listed in Table 2. It can be observed that the Support Vector Machine takes
DURAARK
FP7 – ICT – Digital Preservation
Grant agreement No.: 600908
D5.2 – Software prototype v1 | Page 37 of 49
significantly longer than the Random Forest, especially when dealing with high feature
dimensions. When processing compressed data, these methods achieve similar execution
times.
Configuration
Execution time
Channel 1 Channel 2 Classifier
[min]
HoG
HoG
Grad,Brief
Grad,Brief
HoG,PCA
HoG,PCA
Grad,PCA
Grad,PCA
HoG
HoG
HoG
HoG
HoG,PCA
HoG,PCA
Grad,Brief
Grad,Brief
Grad,PCA
Grad,PCA
Grad,PCA
Grad,PCA
RF
SVM
RF
SVM
RF
SVM
RF
SVM
RF
SVM
RF
SVM
RF
SVM
63
261
34
77
129
128
185
179
108
567
244
359
322
317
Table 2: The total execution time consists of the time needed for training and classification using a specific pipeline configuration. The time is specified in minutes.
Figure 13 shows some result images of tests listed in table 1, pointing out the most difficult
test cases. In the first image (Figure 13a) all desired objects were classified correctly,
but also a false positive detection (hallucination) was made, due to cyclic object in the
background having a similar visual appearance as the learned data. Figure 13b shows
an example of a detected but a wrongly classified switch. Some false positive detections
can be observed on the poster to the right, caused again by visual structures similar
DURAARK
FP7 – ICT – Digital Preservation
Grant agreement No.: 600908
D5.2 – Software prototype v1 | Page 38 of 49
to a trained category. In the example shown in Figure 13c, the classifier was heavily
responding to the equally sized squares of the registration targets and other image patches
containing a square shaped contour.
DURAARK
FP7 – ICT – Digital Preservation
Grant agreement No.: 600908
D5.2 – Software prototype v1 | Page 39 of 49
(a) Ch.1: HoG+PCA, Classifier: SVM, Image 3
(b) Ch.1: HoG, Ch.2: Gradient+BRIEF, Classifier: RF, Image 5
(c) Ch.1: HoG+PCA, Ch.2: Gradient+PCA, Classifier: RF, Image 4
Figure 13: Example results pointing out misclassification causes. Detected sockets are
marked by a green bounding box, whereas detected switches are colored red.
DURAARK
FP7 – ICT – Digital Preservation
Grant agreement No.: 600908
D5.2 – Software prototype v1 | Page 40 of 49
4
4.1
Decisions & Risks
Technical decisions and impacts
Pipeline-based Architecture
The appearance properties of the detected elements require to combine several vision
methodologies to be able to detect nearly invisible features in architectural data. The
pipeline architecture has been chosen to be able to combine such methodologies, and to
be adaptable for possible future requirements. No conceptual change of the software is
necessary for that. New algorithms can easily be integrated as additional preprocessing
methods or feature representations in the pipeline.
Clear separation of data acquisition and processing
Another technical decision was that the input data to this system is required to be in an
non-vendor specific format, in order to be independent from the actual hardware that was
used to acquire the data. For this software prototype, images in .jpg format are accepted
as input for training and classification.
Software library ”OpenCV” as for computer vision pipeline
OpenCV (http://opencv.org) is a software library free for academic and commercial
use that provides tools and utilities in the area of computer vision (CV). The feature set
relevant for D5.2 includes tools for object detection, machine learning and visualization.
The library is a corner stone of the described software library and provides a base set
of standard utilities which serves as foundation of the software prototype. OpenCV is
designed for efficiency and has a large community using the library and contributing to
it, which makes it a future-proof asset for the software prototype to build upon.
DURAARK
FP7 – ICT – Digital Preservation
Grant agreement No.: 600908
D5.2 – Software prototype v1 | Page 41 of 49
4.2
Risk assessment
This section lists the discussed technical risks, consequence and treatment action:
Risk Description The software prototype supports the detection of sockets and lightswitches, but the stakeholder needs the detection of feature X.
Risk Assessment
Impact Medium
Probability Medium
Description The software prototype’s current implementation is built for detecting sockets and light-switches. Depending on the architecture in question
other features may be relevant for detecting the nearly invisible structures in
the building.
Contingency Solution The design of the software deliverable provides the possibility
to execute a picture-based training step before the actual detection of features in
the building is taking place. The training step allows the stakeholder to provide
pictures of the needed feature (e.g. self-taken or from an online image library) which
are used to train the system. After the training phase the algorithms support the
detection of those features. Depending on the characteristics of the feature the
provided algorithms may not be suited for the detection of the feature, or better
suited algorithms exist. In this case the pipeline-based architecture described in
3.2.1 and in 4.1 allows for the integration of those algorithms to fit the needs of the
stakeholder.
DURAARK
FP7 – ICT – Digital Preservation
Grant agreement No.: 600908
D5.2 – Software prototype v1 | Page 42 of 49
Risk Description No laser scanner is available to acquire the necessary input data.
Risk Assessment
Impact Low
Probability Low
Description A stakeholder does not have the (financial) possibility to buy or rent
a laserscanner for generating the input data necessary for the usage of the
software prototype.
Contingency Solution The software prototype has a clear data input interface that
defines which data has to be provided in which format. The acquisition method
can be chosen to the likings and possibilities of the stakeholder, as long as the data
format is pre-processed into the demanded input data format.
DURAARK
FP7 – ICT – Digital Preservation
Grant agreement No.: 600908
D5.2 – Software prototype v1 | Page 43 of 49
5
Licenses
The following table gives an overview of the software licences generated and used for the
implementation:
IPR
Type
Software name
License Information
software
software
software
IP used
or generated
generated
used
used
Hidden structures tool
OpenCV
tclap
BSD
BSD
MIT
software
used
tinyxml
zlib
DURAARK
FP7 – ICT – Digital Preservation
Grant agreement No.: 600908
D5.2
http://opencv.org
http://tclap.
sourceforge.net
https://github.com/
leethomason/tinyxml2
D5.2 – Software prototype v1 | Page 44 of 49
6
Conclusions & Impact
This report presents the first version of the software prototype D5.2 in form of the RISE
standalone application.
6.1
RISE
The current prototype provides a sound foundation for detecting the visible parts of a
electric applicance which will serve as the input data for the future prototypes which will
include the detection of the almost invisible or hidden parts of the appliance, e.g. power
lines inside a wall. Especially when using the HoG feature descriptor, the first evaluations
show satisfying results to build on. We further observed that some configurations produce
undesired false positive and negative detections, as can be seen in Figure 13 and Table
1, which is mostly a matter of the currently insufficient amount of training samples, and
shows that the different methods yield different results for the task at hand. Currently,
we work on the creation of a bigger training set in order to discriminate more different
types of sockets and improve the vision pipeline overall.
At the moment, the system operates on a single scan. Multiple scans will however not
change the pipeline drastically, but will yield more orthophotos (each from one scan),
and for each the detections of the computer vision pipeline. This might yield overlapping
detection results, which will have to be combined in the result mapping module.
Further limitations of the detection performance regarding occlusions, image quality,
camera distance and angle etc. are not known in the current development state.
In the next version of the prototype the computer vision part will be equipped by more
sophisticated computer vision methods/modules in order to improve the detection results.
Particularly, the approaches of [9] will be considered by implementing color channel image
filters (red, green, blue), Haar-like Wavelets [13, 16] and AdaBoost [8] as new vision
DURAARK
FP7 – ICT – Digital Preservation
Grant agreement No.: 600908
D5.2 – Software prototype v1 | Page 45 of 49
modules.
Also, better fitted parameters of the feature descriptors and classifiers, and a larger,
more representative training-set are supposed to yield better classification rates. Since
especially the PCA and the BRIEF descriptor are very sensitive to the registration of
the training images, this becomes an important prerequisite for a better training-set. If
the performance may still be insufficient, due to the modular concept of the detection
framework also 3D information from the point cloud can be included easily. However,
taking 3D information into account will most likely induce new challenges in training
sample generation in order to cover different designs of switches and sockets.
To do a quantitative evaluation of various vision pipeline configurations larger test sets
with annotated ground truth will be added. For this, the orthophoto generation module
will need to be enabled to work on data directly provided by a laser scanner.
Additionally, to speed up the visual recognition, the code will be better parallelized in
order to take advantage of multi-core systems.
For the power line predictor component, the rules encoding the prior knowledge will
be formulated, from this the method to synthesize the power line placement will be
developed. The grammar formally describes prior knowledge of the placement of power
lines, possibly using a growing metaphor: starting from a power line entry point of a
room, the power lines grow towards the measurements under specific constraints, which
are encoded into the growing rules.
DURAARK
FP7 – ICT – Digital Preservation
Grant agreement No.: 600908
D5.2 – Software prototype v1 | Page 46 of 49
6.2
Workbench Integration
With the next software prototype deliverable of WP2 in month 30 the tool described
in this report will be fully integrated into the geometric enrichment workflows of the
Workbench. Integration will be done in two areas. The first area is the user experience
when working with the tool, which is done via a flexible - but non-graphical - interface
at the moment. The next Workbench prototype deliverable will provide a graphical
user interface for the tool with an abstraction of the underlying functionality to make it
reasonably easy for a stakeholder to use the tool.
The second integration activity is to incorporate the information of found elements in
a point cloud into the package that is persisted in the long-term archival system. This
activity will be done in close cooperation with other partners.
DURAARK
FP7 – ICT – Digital Preservation
Grant agreement No.: 600908
References
[1] B. Boser, I. Guyon, and V. Vapnik. A training algorithm for optimal margin classifiers. In Proceedings of the fifth annual workshop on Computational learning theory,
pages 144–152. ACM, 1992.
[2] L. Breiman. Random forests. Machine learning, 45(1):5–32, 2001.
[3] L. Bustamante and J. Gu. Localization of electrical outlet for a mobile robot using visual servoing. In Electrical and Computer Engineering, 2007. CCECE 2007.
Canadian Conference on, pages 1211–1214. IEEE, 2007.
[4] M. Calonder, V. Lepetit, C. Strecha, and P. Fua. Brief: Binary robust independent
elementary features. In Computer Vision–ECCV 2010, pages 778–792. Springer,
2010.
[5] J. Canny. A computational approach to edge detection. Pattern Analysis and Machine Intelligence, IEEE Transactions on, PAMI-8(6):679–698, Nov 1986.
[6] N. Dalal and B. Triggs. Histograms of oriented gradients for human detection.
In Computer Vision and Pattern Recognition, 2005. CVPR 2005. IEEE Computer
Society Conference on, volume 1, pages 886–893. IEEE, 2005.
47
D5.2 – Software prototype v1 | Page 48 of 49
[7] P. F. Felzenszwalb, R. B. Girshick, D. McAllester, and D. Ramanan. Object detection
with discriminatively trained part-based models. Pattern Analysis and Machine
Intelligence, IEEE Transactions on, 32(9):1627–1645, 2010.
[8] Y. Freund, R. Schapire, and N. Abe. A short introduction to boosting. JournalJapanese Society For Artificial Intelligence, 14(771-780):1612, 1999.
[9] D. A. Klein, D. Schulz, and S. Frintrop. Boosting with a joint feature pool from
different sensors. In Computer Vision Systems, pages 63–72. Springer, 2009.
[10] Z. Li, Y. Liu, R. Hayward, J. Zhang, and J. Cai. Knowledge-based power line detection for uav surveillance and inspection systems. In Image and Vision Computing
New Zealand, 2008. IVCNZ 2008. 23rd International Conference, pages 1–6, Nov
2008.
[11] W. Meeussen, M. Wise, S. Glaser, S. Chitta, C. McGann, P. Mihelich, E. MarderEppstein, M. Muja, V. Eruhimov, T. Foote, et al. Autonomous door opening and
plugging in with a personal robot. In Robotics and Automation (ICRA), 2010 IEEE
International Conference on, pages 729–736. IEEE, 2010.
[12] P. Müller, P. Wonka, S. Haegler, U. Andreas, and L. Van Gool. Procedural Modeling
of Buildings. Proceedings of 2006 ACM Siggraph, 25(3):614–623, 2006.
[13] C. P. Papageorgiou, M. Oren, and T. Poggio. A general framework for object detection. In Computer vision, 1998. sixth international conference on, pages 555–562.
IEEE, 1998.
[14] B. Song and X. Li. Power line detection from optical images. Neurocomputing,
129(0):350 – 361, 2014.
DURAARK
FP7 – ICT – Digital Preservation
Grant agreement No.: 600908
D5.2 – Software prototype v1 | Page 49 of 49
[15] G. Stiny and J. Gips. Shape Grammars and the Generative Specification of Painting
and Sculpture. Best computer papers of 1971, 1:125–135, 1971.
[16] P. Viola and M. Jones. Rapid object detection using a boosted cascade of simple features. In Computer Vision and Pattern Recognition, 2001. CVPR 2001. Proceedings
of the 2001 IEEE Computer Society Conference on, volume 1, pages I–511. IEEE,
2001.
DURAARK
FP7 – ICT – Digital Preservation
Grant agreement No.: 600908