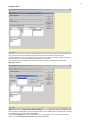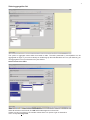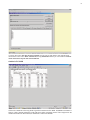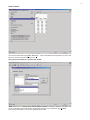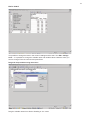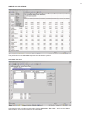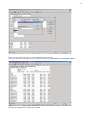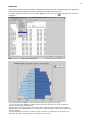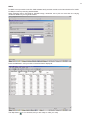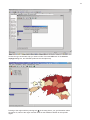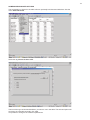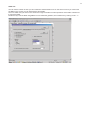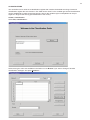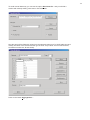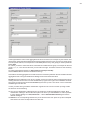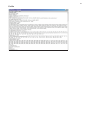
1
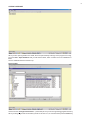
PC-AXIS 2006
User Manual
2
List of contents
Introduction................................................................................................................. 3
Help functions ........................................................................................................... 4
Open a database ...................................................................................................... 5
Open a table .............................................................................................................. 6
Save a table............................................................................................................... 9
Edit atable.................................................................................................................10
Simple calculations................................................................................................... 11
Diagrams ................................................................................................................. 13
Maps ....................................................................................................................... 14
Some more advanced options.................................................................................. 16
Classifications............................................................................................................ 18
3
Introduction
When installing PC-AXIS 2006 a new folder Pcaxis2006 and some files into the system folder are created on
the hard disk. File Pcaxis.exe in the folder Pcaxis2006 must be started to use PC-AXIS.
To create your own database it is recommended to create a folder for database and subfolders for subject
areas in the database. The tables in database are organised and displayed like any other files in Windows.
PC-AXIS allows presenting statistical tables and graphs. Usually statistical indicator is expressed using
specified characteristics called classification variables. In the title of the table, the list of classification
variables is automatically generated after “by”. One or more indicators can be presented in the table.
This instruction has been compiled according to those published in Denmark and Sweden.
The most important news in PC-AXIS 2006:
<
<
<
<
<
The table cells can get a thousand delimiter
Optional menu for long texts in variable values
A link between PC-AXIS and Excel is automatically established when istalling PC-AXIS
New function to produce HTML list of contents for PC-AXIS database
The possibility to save queries towards px-files and run them in batch. Start by selecting File Start
recording. Give the bat file a suitable name. Then do the selection, editing, calculation and conversion
you need and select File Stop recording. Go through all the pxq-files you see in the list and give them
suitable names. The saved queries can be run from PC-AXIS by Run saved query....
Instruction for creating maps has been added.
4
HELP FUNCTIONS
When the mouse indicator touches a tool button explanatory information is shown.
If you need more help, please use the toolkey that opens the help function.
You can also press F1 to get context related help wherever you are in PC-AXIS.
5
OPEN A DATABASE
When you are opening a table in PC-AXIS, there are optional ways of doing it. If the program is running,
just press File - Open Database and you will find the folder, which contains the current database or
table.
The PC-AXIS files have the extension px.
Select a table
Use the function Change Classification… (see below) where you can change the aggregation directory.
When you are going to select a new table you either can click on it, or mark it and then press the Enter key.
6
OPEN A TABLE
If you need all values of the variable just click on the name of the variable on the top of a list.
If certain values are to be selected you have to press CTRL + left mouse button (alternative CTRL +
right mouse button). Only the selected values will appear in the table.
If you wish to get all the variables and all the values of the variables, just click on the button All.
Aggregate values
You can use the classifications if you have a table which is more detailed than you want it to be. Classify
the variable age by using the button Aggregate.
If the button Aggregate is not active, the directory for aggregation list is not correctly allocated.
Use the function Change Classification when selecting a table.
7
Select aggregation list
The option to aggregate values differ from table to table. The table presented by municipalities can be
aggregated on region. If you wish to classify on variable age (in the selected table it is in one year classes), you
can aggregate it on five year classes or ten year classes.
Select values to the table
When all selections are finished, click OK and the table appears on the screen.
If there are very long texts on the variable values there is an option to get an alternative
menu. Just press Long texts.
8
If you tick the option Use this layout as default, the only way to alter back to the original layout
can be done in the menu View - Advanced, the tag Information where you can tick the box Show
value selection in layout with small listboxes.
A table in PC-AXIS
Click on the asterisk in the top panel to get the footnotes for the table. Available information is
Source, Units, Internal reference code and some other necessary notes. There might even be
certain information on the material, a variable or a value of a variable.
9
SAVE A TABLE
You can save the table using File - Save as…. Then a windows turns up where you can enter
where to save the file and name the file.
Using Convert and Save in another file format
If you would like to save the table in another file format you just select the tag Convert.
You can save the table in any of the optional file formats.
10
EDIT A TABLE
It is possible to change the texts in the column headings and the stub. Use Edit - Change
texts…. It is possible to change the variable name and variable values. Mark the value you
want to change. Enter the new text and press Enter.
Drag and drop variables using the mouse
Drag the variable names from Stub to Heading or vice versa.
11
SIMPLE CALCULATIONS
The pull down menu Calculate exposes the calculation options.
Calculate Per cent
Calculate the ratio of males and females. Select Calculate - Per cent… and use the “Males
and females” of sex as the base for the calculation.
12
Enter a name on the new value or use the default name ”Per cent”.
If you just want the resulting per cent to remain in the table use excluded in the area Initial values.
Now the percentages are inserted into the table.
13
DIAGRAMS
The table in PC-AXIS can be presented in a diagram according to a number of diagram types. It is possible to
make different types of graphs, like charts, line diagrams and population pyramids.
To make a graph you have to use menu View Graph or click on the icon
a diagram.
and select your choice of
If you press the button Adjust... you will get some options to change in the graph.
You can use the button Copy in the graph window and insert the graph into another Windows
program like MS-Word and MS-Excel.
When arriving to the other program where the graph is supposed to be inserted use the paste
special option using bitmap format. If not using this, a table will appear instead of the graph in the
windows program.
Certain diagrams are based upon certain number of columns or variables to be presented. The
population pyramid is based on a table consisting of two columns.
14
MAPS
PX-MAP is a map-module in the PC-AXIS software family and this module can be launched from PC-AXIS.
PX-Map is a tool for presenting statistical data.
When selecting data in PC-AXIS for PX-MAP usage, remember not to pick out more than one varying
variable in addition to your regional variable.
The next figure shows an example of data-selection that is valid for presentation in PX-MAP.
The next figure shows an example of data-selection that is valid for presentation in PX-MAP.
Press the OK-button and your table of selected data is displayed:
The Map-button
is now enabled, and you are ready to make your map.
15
Choose the type of thematic map you want to make. Press the OK-button in the Choose
maptype dialog-box, and PX-MAP produces the choroplet map:
Pointing to the region with the pointing tool
in the map picture, you get information about
the region-ID, name of the region and the value for this statistical variable for this specific
region.
16
SOME MORE ADVANCED OPTIONS
The presentation of figures in the table cells can optionally hold thousand delimiters. Use the
menu View-Advanced.
Select the tag Format for data cells.
Then mark the type of thousand delimiter you want to use in the table. The selected option will
work from the next table opened in PC-AXIS.
It is possible to change a lot of different parameters.
17
Table size
You can set the number of lines you as a maximum want the table to use on the screen. Even if you cannot see
the table on the screen you can work with the whole table.
The more table cells you show on the screen the longer it will take to make operations on the table. Furthermore
it uses more RAM.
Decide the layout of the table using View. You can delete the gridlines, line numbers etc by clicking on the ” v ”.
18
CLASSIFICATIONS
You can define from a value set a classification register that contains the desired summings. Instead of
classification register the sum function in PC-AXIS can be used. For the variable age several classifications
can be established to create several age groups. Also for the variable region municipalities can be put
together in larger areas forming special divisions of the country.
Create a classification
Select File, Classification...
Select among the value sets available in the listbox or use Browse if you want to change to another
classification catalogue. And press Continue….
19
To avoid manual data entry you can use the option Read from file... and you will find a
window with already existing value sets or PC-AXIS table.
Now the page will be filled with values from the selected value set or PC-AXIS table (text and
codes), the name of the domain and the type of value set (V=Value set of normal structure,
H=Hierarcical value set, N=sub areas).
Press on the button Aggregations….
20
In the upper field the name of the aggregation list has to be entered, for example 5-year classes. This
name will be used in the table heading when this aggregation list is used. For groups every single group
is named (Code and text, for example 0-4 in both fields). Before every new group you have to press the
button Add.
For values you have to select the values, which will be included into the group, for example for the first
group 0, 1, 2, 3, 4. the source value set you can find in the right. To transfer values use the arrow key
button.
To create overlapped groups tick on Allow values in a group to overlap.
Use the Show button to check the result before saving.
To be able to use the aggregations one shall secure the consistency between the PC-AXIS files and the
aggregations lists. The right classification catalogue has to be linked to PC-AXIS.
Domain is a keyword that can occur for any variable. It refers to a class of values. A list with all names of
existing domains can be seen from the Classification program if the right current database is linked.
The name can also be found with the Domain keyword in the px-file. This name is to be used when
establishing a new value set.
In case you after having created a classification register do not access to it when opening a table
the reasons can be following:
< The current classification catalogue does not contain the created classification register. Shift
classification catalogue. Do it at the same places as where you shift database. It is also possible
to set a default catalogue in View, Advanced…. Select Classification Directory and set the
desired catalogue.
< Domain is not corresponding between the px-file and the value set. Open the px-file in Notepad
and check if the name corresponds to the value set.
21
Px-file